

Abstract

Amyotrophic lateral sclerosis (ALS) is a fatal neurodegenerative disease without effective treatment. The progressive motoneuron death in ALS is associated with alterations in lipid metabolism. As its regulation occurs in mitochondria-associated endoplasmic reticulum (ER) membranes (MAMs), modulation of mitochondria-ER contacts (MERCs) is emerging as a crucial factor in MAM formation and lipid metabolism control. Using the MERLIN biosensor in a high-throughput screening within the EU-OPENSCREEN ERIC, we discovered small molecules that increase MERCs in HCT116 cells, enhancing their ability to uptake cholesterol. We demonstrated that cholesterol trafficking is decreased in an ALS patient-derived cell model, and this trafficking is restored after treatment with the discovered MERC modulator 24. Electron microscopy revealed that treatment with compound 24 increases MERCs, promotes lipid droplet formation, and restores mitochondrial cristae. Overall, the brain-permeable MERC modulator, compound 24, may serve as a valuable pharmacological tool for studying MAM function and holds potential for in vivo studies in ALS and other MAM dysfunction diseases.
Introduction
Amyotrophic lateral sclerosis (ALS) is a rare and fatal neurodegenerative disease that affects 1 to 2.2 per 100,000 people between 58 and 60 years old.1 Among its pathological molecular features, the progressive death of motor neurons, the presence of different proteinopathies such as those caused by aggregates of the nuclear protein TDP-43 or the antioxidant enzyme SOD1, neuroinflammation and glutamate excitotoxicity are the most prevalent.2 Moreover, mitochondrial dysfunction and alterations in lipid metabolism have been also been associated with this pathology, emerging as valuable therapeutic targets.3,4
The regulation of multiple lipid pathways occurs at lipid nanodomain in the endoplasmic reticulum (ER), known as mitochondria-associated ER-membranes (MAMs). These domains are transient and formed by local increases in the levels of cholesterol in the ER that result in the recruitment of specific proteins involved in multiple metabolic processes, including the production, storage, and export of lipids.5 Moreover, the formation of MAMs provides a functional platform for the crosstalk between these two organelles.6
Defects in the formation of MAMs have been associated with neurodegenerative disorders, including ALS,7 but their role in the disease remains unknown. Likewise, disruptions in lipid metabolism have been linked to ALS. Specifically, anomalies in the levels of cholesterol and specific sphingolipid classes, such as ceramides and sphingomyelins, or deficiencies in the enzymes responsible for their metabolism, such as ceramidases and sphingomyelin synthase, are implicated in the onset and progression of ALS.8 Taken together, these data implicate MAM dysfunction as key step in the pathogenesis of ALS and justify the modulation of MAMs as a potential novel therapeutic target.
Specific tools for the quantification of MERCs have contributed to our understanding of these contact sites. In particular, we developed a novel bioluminescence resonance energy transfer (BRET)–based biosensor called MERLIN (Mitochondria–ER Length Indicator Nanosensor).9 This biosensor is a modular, genetically encoded system in which each of the two components of the BRET pair are linked to the ER or the mitochondrial outer membrane (Figure 1). MERLIN serves as a proximity sensor for assessing distances between the ER and mitochondria in cell under physiological conditions or after genetic or pharmacological manipulation.10
Figure 1.

Scheme illustrating the structure of the MERLIN BRET biosensor. In MERLIN BRET pair is formed by Renilla luciferase 8 (Rluc8) targeted to the mitochondria with the C-terminal of BCL-XL (B33C), acting as donor, and mVenus (mVen) targeted to the ER by the N-terminal of S-calnexin (sCal), performing as acceptor. When in close proximity and upon the addition of cell permeable coelenterazine h, Rluc8 processes coelenterazine h into coelenteramide, excited product that can transfer the energy to the acceptor by resonance.
Here, we optimized the use of the MERLIN biosensor in a specialized screening site of the ERIC EU-OPENSCREEN to discover small molecules capable of modulating MERCs. Our data revealed a set of selected hits able to enhance ER-mitochondria proximity in HCT116 mutant cells. Further hit-to-lead optimization, lead to valuable pharmacological tools capable of modulating MERCs in patient-derived cellular models of ALS, thereby promoting the recovery of ER/mitochondria lipid fluxes and enhancing mitochondrial health.
Results and Discussion
MERLIN Assay Development and Chemical Library Screening for the Identification of Compounds Targeting MERCs
Given the relevance of MERCs in ALS we aimed to identify small molecules able to modulate the contacts between mitochondria and ER (MERCs). For this purpose we generated a stable human colon cell line (HCT116 cells) expressing the BRET-based nanosensor MERLIN9 and optimized a high-throughput assay to screen small molecules that can modulate MERCs, which may have potential therapeutic relevance.
First assay optimization was performed by means of the MyriaScreen Diversity Library,11 comprised of 10,000 high-purity screening compounds, handpicked to maximize the chemical diversity while maintaining drug-like properties, in 96-well plates. Subsequently, the assay was miniaturized and transferred to 384-well plate format required to screen the European Chemical Biology Library (ECBL) from the European chemical biology research infrastructure EU-OPENSCREEN. Noteworthy, ECBL has been shown to be a valuable tool for drug discovery.12 The screening of the entire ECBL, comprising more than 100,000 compounds,13 was conducted in 384-well plates, at a final concentration of 15 μM. In the screening plates, untreated controls were included to determine the BRET basal signal of the MERLIN-HCT116 cell line. Compounds exhibiting an increase in the BRET signal greater than the average basal signal plus three standard deviations were chosen for further analysis. Molecules that induced cell death, as indicated by a decrease in donor emission intensity of more than 25%, were excluded in order to minimize the odds that these compounds affect to the photophysical properties of the BRET pair proteins. Additionally, compounds showing a 1.5-fold increase in the donor signal were also eliminated, as their intrinsic fluorescence might interfere with the assay. After a confirmatory assay to discard false positives, we performed dose–response curves of potential candidates, at eight different concentrations (1–46 μM, n = 4). Remarkably, we identified a number of compounds that effectively increase BRET signal, associated with a decrease in mitochondria-ER distance in a concentration-dependent manner, with EC50 values ranging from 8 to 120 μM (data not shown).
All the hits found met the criteria outlined in the high-throughput screening quality control general guidelines of EU-OPENSCREEN, including reproducibility, EC50 values, and low toxicity. Several potential candidates that effectively modulate MERCs in a concentration-dependent manner without affecting cell viability were identified. We believe these identified small molecules may represent promising tools for further research and analysis into MERCs modulation. In fact, one of the hits here identified, compound EOS101130 (EC50 = 13.66 μM, R2 = 0.96), is known as MG132, a well-known proteasome inhibitor14 that induces ER stress and MERCs,15 which validates the screening.
Among the identified hits, we selected compound EOS100585 (EC50 = 8.36 μM, R2 = 0.94) due to its low EC50 value as the best hit to be analyzed. This compound resulted to be niclosamide (1) (Figure 2), a well-known antihelmintic agent in clinical use. Recent studies have indicated that niclosamide may have broad clinical applications for the treatment of diseases other than those caused by parasites, including cancer,16 COVID-19,17 and, neurodegenerative diseases.18 Furthermore, niclosamide has been postulated as a therapeutic candidate for ALS as it modulates TDP-43 pathology in cellular models of ALS, and activates mitophagy via the PINK1-parkin-ubiquitin pathway.19 However, nothing is known about its relationship with MERCs regulation and the potential restoring of lipid metabolism in ALS.
Figure 2.
Chemical structure of niclosamide (1).
MERCs Modulation Ability of Niclosamide Derivatives: A Structure–Activity Relationship Study
Niclosamide (1) consists of two substituted phenyl rings linked by an amide group. With the aim of establishing a structure–activity relationship, different modifications in the phenyl rings were proposed considering the inclusion of substituents of different nature with diverse electrophilic properties, along with different positions within the aromatic ring. Additionally, changes in the nature of the aromatic ring were considered. Thus, the bioisoster thiophene heterocycle, the naphtyl group or saturated cycles and the change to benzylic or alkylic moieties were explored (Figure 3). Following this, two parallel series of amide derivatives were prepared to be biologically evaluated. The first series derived from the chemical reaction of substituted anilines with different organic acyl chlorides such as aromatic, benzylic, aliphatic, etc. led to compounds 1–23 (Table 1). Analogues with fluorine instead of chlorine atom in the niclosamide-related scaffold were synthesized to check the influence of the halogen atom in the biological activity. The second amide series, compounds 24–34 (Table 1), derived from the reaction of 5-chloro-2-hydroxybenzoic acid with diverse primary or secondary amines. Mainly, different substituted aromatic or benzylic amines were used.
Figure 3.

Chemical-related niclosamide derivatives prepared and evaluated as MERCs modulators.
Table 1. 4-Nitrophenylamide (A) and 5-Chloro-2-hydroxybenzamide (B) Derivatives with Their EC50 (BRET) Valuesa.

n.d. = not determined.
Although some compounds were previously described, all the derivatives included in this work were obtained according to the synthetic pathways outlined in Scheme 1. A convergent microwave (MW) assisted synthesis was employed for the preparation of all the 2-chloro- or 2-fluoro-4-nitrophenylamide derivatives (Scheme 1A). In this method, an equimolar mixture of either 2-chloro- or 2-fluoro-4-nitroaniline and the corresponding aryl, alkyl or benzyl acyl chloride was heated at 150 °C for 10 min under microwave irradiation. The compounds were purified by recrystallization from ethanol. In cases where the acyl chloride was not commercially available, it was synthesized from the corresponding carboxylic acid using thionyl chloride as the chlorinating agent. Following this synthetic procedure, compounds 1–23 were prepared and fully characterized for biological evaluation.
Scheme 1. Synthesis of the Two Series of Niclosamide Derivatives: (A) 2-Chloro- or 2-Fluoro-4-nitrophenylamide Series and (B) 5-Chloro-2-hydroxybenzamide Series.

Reagents and conditions: (i) MW, 150 °C, 10 min; (ii) SOCl2, 80 °C, 2 h; (iii) EDC, HOBt, Et3N, CHCl3, 12 h.
Regarding the 5-chloro-2-hydroxybenzamide series, compounds 24–34 were obtained through an amidation reaction of commercial 5-chloro-2-hydroxybenzoic acid with the corresponding amine in chloroform, and using triethylamine as a base. 1-(3-(Dimethylamino)propyl)-3-ethylcarbodiimide hydrochloride (EDC) was employed as a carboxyl-activating agent, while 1-hydroxybenzotriazole hydrate (HOBt) was used to enhance the efficiency of amine coupling and prevent side reactions (Scheme 1B).
All the derivatives synthesized were >95% pure by HPLC analysis and were unequivocally characterized based on their analytical and spectroscopic data as detailed in the Experimental section.
These synthetic analogues were screened in a dose–response manner using the HCT116 cell line stably expressing MERLIN to determine their ability to modulate the contacts or distance between mitochondria and ER. When the BRET signal was unequivocally modulated, the EC50 value was calculated after determining the dose–response curve with eight increasing concentrations of the corresponding compound. To fit the curves, the model of nonlinear regression of ([Agonist] vs response -- Variable slope (four parameters) from the GraphPad software was used. Sometimes, the values of all the four parameters were not precisely determined. In those situations, EC50 value cannot be determined because the R2 values are very low. The value R2 quantifies goodness of fit. All obtained data are summarized in Table 1. Only compounds with calculated EC50 values and R2 > 0.8 were selected for further analysis.
Although several chemical moieties with distinct steric and electrostatic properties were assayed, in general the chloro- or fluoro-nitrophenylamide derivatives exhibited similar changes in the BRET signal, with an ambiguous response regarding MERCs modulation and low R2 values. In this context, only compounds 1 and 2 showed EC50 values of 5.68 and 5.64 μM with R2 > 0.8, respectively, indicating a closer distance between both cellular organelles.
On the other hand, a larger number of compounds with better responses for the BRET signal were observed among the 5-chloro-2-hydroxybenzamide derivatives, with EC50 values of 2.44, 9.70, and 8.32 μM for compounds 25, 27, and 29 (Table 1), respectively. In this chemical family, the presence of a π-deficient aromatic ring attached to the nitrogen atom of the amide bridge seemed to produce better responses in the MERLIN biosensor. We also recovered compound 24 because, although the dose–response curve adjustment was ambiguous and the EC50 value cannot be determined precisely, individual data revealed significant BRET increases at higher doses. Their BRET curves at different concentrations are depicted in Figure 4.
Figure 4.

Quantification of BRET signal alterations upon the incubation with individual MERCs modulators in HCT116 cells containing MERLIN. BRET signal, inversely correlated with mitochondria-ER distance, was measured upon the addition of compounds 24, 25, 27, and 29 at different concentrations and normalized to DMSO (MOCK) treated cells (dashed lines). Data represent the mean ± SD, N ≥ 3 independent experiments with three technical replicates per condition.
Altogether, these results reveal that the 5-chloro-2-hydroxybenzamide moiety may be a privileged structural scaffold to induce shortening of the distance between mitochondria and ER. Closer contacts between these two organelles could be achieved if a π-deficient aromatic ring is attached to the amide nitrogen atom. Thus, compounds 1, 2, 24, 25, 27, and 29 were selected for further studies.
Evaluation of the Pharmacological Modification of Cholesterol Uptake by Niclosamide Derivatives
Increases in the internalization of exogenous cholesterol trigger the delivery of this lipid to the ER, which in turn stimulates the formation of MAM domains and MERCs. By the same token, cholesterol turnover, a critical event in the central nervous system (CNS) implicated in neurodegeneration,20 is among the pathways regulated by MAMs.21 Therefore, our subsequent investigation aimed to determine whether cholesterol internalization and traffic in various cell types could be altered when MERCs are modulated by the compounds identified in this study.
Before assessing the compounds impact on cholesterol uptake by cells, their cell viability was evaluated using the 3-(4,5-dimethyl-2-thiazolyl)-2,5-diphenyl-2H-tetrazolium bromide (MTT) assay, a colorimetric assay for assessing cell metabolic activity.22 In this case, the nicotinamide-adenine-dinucleotide (NAD(P)H)-dependent cellular oxido-reductases enzymes from metabolically active cells reduce the tetrazolium salt to strongly purple colored and lipophilic formazan products, which are then quantified by absorbance. We tested the compounds at doses of 1, 5, and 10 μM, with a cell viability threshold of >80% established as the safety limit. Initially, we examined the HCT116 cell line, which was used in conjunction with the MERLIN biosensor to identify the compounds. As illustrated in Figure 5, all the MERCs modulators tested, compounds 1, 2, 24, 25, 27, and 29 were deemed safe at a dose of 1 μM. However, only compounds 24, 27, and 29 exhibited cellular safety above 5 μM.
Figure 5.
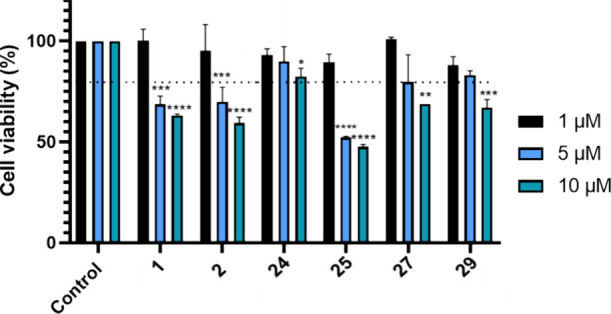
Cell viability (HCT116 cell lines) using MTT assay after treatment with compounds 1, 2, 24, 25, 27, and 29 at 1, 5, and 10 μM doses, for 24 h. Results are expressed as the mean ± standard error of the mean (SEM) for three independent experiments. *, p < 0.1; **, p < 0.01; ***, p < 0.001; ****, p < 0.0001.
Once the safe treatment dose was established, we evaluated the cells’ ability to uptake cholesterol from the extracellular medium after treatment with the compounds. At 1 μM, none of the compounds altered cholesterol uptake compared to untreated cells (Figure 6A) both after 1 and 3 h of treatment. However, treatment with compound 24 at a dose of 5 μM significantly increased the cells’ cholesterol uptake capacity after 3 h of treatment, as shown in Figure 6B. The others compounds were considered not adequate to be used at higher doses because of their lower therapeutic window.
Figure 6.
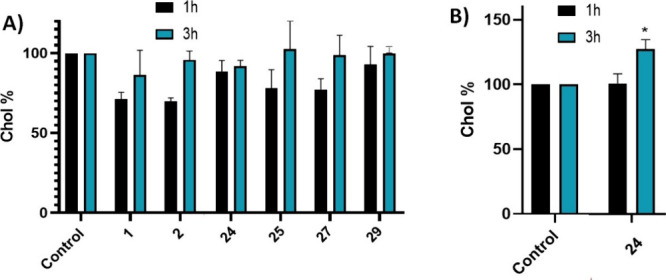
Extracellular cholesterol uptake capacity of HCT166 cells after treatment with (A) compounds 1, 2, 24, 25, 27, and 29 at 1 μM for 1 and 3 h; (B) with compound 24 at 5 μM for 1 and 3 h. Results are expressed as the mean ± standard error of the mean (SEM) for three independent experiments. *, p < 0.1.
Altogether, we have demonstrated that compound 24 identified in the phenotypical assay using the MERCs biosensor MERLIN not only promotes the shortening of distances between mitochondria and the ER, but can also enhance cholesterol internalization in HCT166 cells under physiologically relevant conditions, suggesting its ability to modulate lipid metabolism. Thus, we selected compound 24 for further assays.
Several studies have shown a relationship between abnormal cholesterol profiles in plasma and ALS patients.23,24 Furthermore, TDP-43, the primary pathological hallmark of ALS, has been found to disrupt MERCs and to alter MAM function and lipid metabolism.25 Therefore, we measured cholesterol internalization in ALS patient-derived lymphoblastic cell lines. This patient-based cellular model recapitulates not only TDP-43 pathology, such as cytoplasmatic localization and increased phosphorylation, but also oxidative stress and defects in inflammatory cytokines and autophagic efflux. This model provides a feasible translational pharmacological platform for drug discovery.26,27 To minimize variability among ALS patients, we included several different cell lines from several controls, familial and sporadic ALS (sALS) patients. Thus, initially, we investigated if cholesterol uptake was altered in lymphoblast from our in-house biobank of patient-derived ALS cells in comparison with healthy controls. We used cell lines from six control patients, six lines from sporadic ALS, four samples from SOD1 familial ALS, two with mutations in C9orf72, one with TBK1 mutation and two with TARDBP mutations. Cells were incubated with a fluorescently labeled analog of cholesterol (NBD-cholesterol) for 1 h, and after careful washing, fluorescence intensity was measured at 469/537 nm. All the experiments were conducted in triplicate. Figure 7 displays the uptake of cholesterol in different patient cell lines. While variability is evident, cholesterol internalization was significantly lower in sporadic, SOD1, and C9orf72 ALS patient cell lines compared to control cell lines. Interestingly, in patient cell lines with mutations in the TBK1 or TARDBP genes, no differences in this lipid were found.
Figure 7.

Extracellular cholesterol uptake capacity of the different familial and sporadic ALS patient’s lymphoblastic cell lines. Results are expressed as the mean ± standard error of the mean (SEM) for three independent experiments. **, p < 0.01; ***, p < 0.001.
We next proceeded to determine the potential efficacy of our MERCs modulator, compound 24, in the internalization of cholesterol homeostasis in our ALS cell models. Each ALS lymphoblastoid cell line was treated with the compounds at a fixed concentration of 5 μM for 24 h. Subsequently, fluorescent cholesterol was added for 1 h to the medium. After washing, fluorescence was measured at 469/537 nm, and the data are presented in Figure 8. Notably, compound 24 significantly enhanced cholesterol uptake in sporadic and C9orf72 familial cell lines, but this change was not observed in the SOD1-ALS samples under these experimental conditions.28
Figure 8.
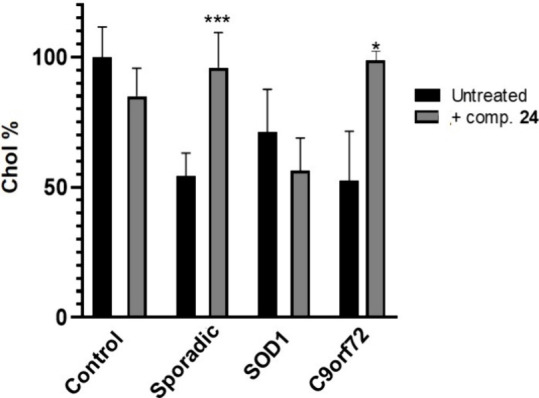
Extracellular cholesterol uptake capacity of the different patient lymphoblastic cell lines without treatment and after treatment with compound 24 (5 μM, 24 h). Results are expressed as the mean ± standard error of the mean (SEM) for three independent experiments. *, p < 0.1; ***, p < 0.001.
Altogether, our results suggest that compound 24 can increase cholesterol internalization and ER-mitochondria interaction in cells derived from ALS patients. To further corroborate this, we measured the levels of cholesteryl esters and lipid droplet formation in control or sALS lymphoblasts before and after 24 h incubation with MERC modulator 24 (Figure 9A). In support of the contribution of this compound on cholesterol mobilization, our treatment was able to induce the formation of cholesteryl esters and increase the levels of lipid droplet in control or sALS lymphoblasts (Figure 9B,C).
Figure 9.
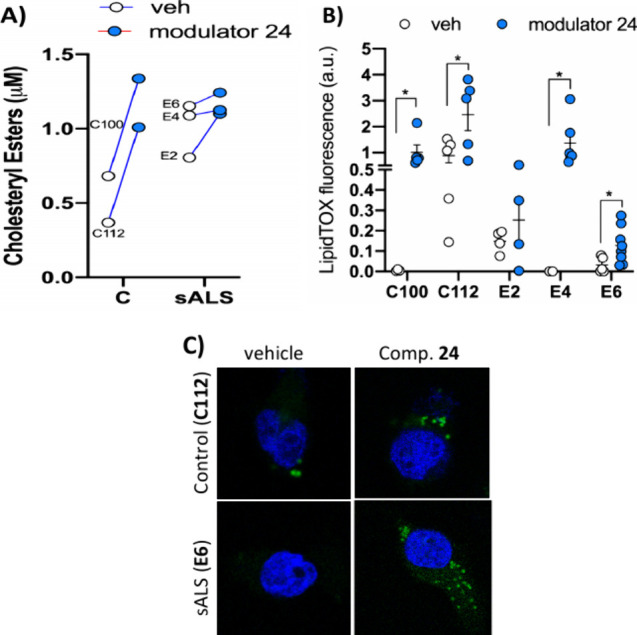
Cholesteryl esters (A) and lipid droplets (B,C) were quantified in control and sALS lymphoblasts treated with MERC modulator 24 (5 μM for 24 h) or vehicle. Individual values are shown for cholesteryl esters quantification. Lipid droplet staining results are expressed as the mean ± standard error of the mean (SEM). More than 100 cells were quantified per condition. *, p < 0.1. Representative images are included (C). Nuclei were stained using DAPI (in blue). Scale bar = 20 μm.
To begin deciphering the mechanism by which MERC modulator 24 enhances cholesterol uptake in sALS lymphoblasts, we repeated the experiment in the presence of various agents known to interfere with distinct pathways of cholesterol internalization. Thus, we have measured changes in the cholesterol uptake with compound 24 in cotreatment with several inhibitors of known cholesterol transporter such as thiosemicarbazone copper chelator BTL1,29 sulfosuccinimidyl oleate sodium (SSO)30 and ezetimibe (EZE).31 The experiment has been performed in two control cell lines (C100 and C112) and two sporadic ALS patients cell lines (E2 and E4) by triplicate. We have observed no effects with the exception of cotreatment with BTL1, which blocks the increase in cholesterol uptake induced by compound 24 (Figure 10). BTL1 inhibits the transfer of lipids between high-density lipoproteins (HDL) and cells, mediated by the cell surface HDL scavenger receptor B, type 1 (SR-B1).32 Thus, SR-B1 may be involved in the mechanism of action of compound 24 regarding cholesterol uptake, although further studies are necessary for final confirmation.
Figure 10.

Extracellular cholesterol uptake capacity of the different control (C100 and C112) and sALS (E2 and E4) patient lymphoblastic cell lines without treatment and after treatment with compound 24 (5 μM, 24 h). Additionally, cells were treated with 10 μM BLT1 before addition of the fluorescent NBD-cholesterol. Results are expressed as the mean ± standard error of the mean (SEM) for three independent experiments. *, p < 0.1; **, p < 0.01.
Mitochondria Oxygen Consumption in Lymphoblast from ALS Patients
Finally, and considering that the formation of mitochondria-associated membranes (MAM) and the establishment of ER-mitochondria contact sites are essential for sustaining mitochondrial activity and cellular bioenergetics,33,34 we validate our findings by measuring mitochondrial oxygen consumption rates (OCR) in our cell model using the Seahorse XF analyzer before and after treatment with the MERCs modulator 24. This assay was performed using lymphoblasts obtained from one control subject and one sALS patient (Figure S3).
Consistent with previous findings,35,36 our data show that basal OCR levels were elevated in sALS cells, while mitochondrial maximal respiration levels (uncoupled respiration after carbonyl cyanide-4-(trifluoro-methoxy)phenyl hydrazone (FCCP) treatment) was significantly reduced compared to control cells (Figure 11A). The ratio between basal and maximal OCR reveals the spare respiratory capacity of mitochondria, which is a measure of the ability of the cell to respond to increased energy demand under stress. In agreement with previous data, sALS cells exhibited a marked reduction in spare respiratory capacity levels (Figure 11B). Notably, treatment with compound 24 successfully restored basal OCR levels in sALS lymphoblasts, leading to a notable improvement in spare respiratory capacity (Figure 11B). This suggests that MERCs modulator 24 can mitigate mitochondrial dysfunction in sALS cells, bringing their bioenergetic parameters closer to those observed in control cells.
Figure 11.

Mitochondrial oxygen consumption rates (OCR) and spare respiratory capacity in lymphoblasts derived from a healthy control and one sALS patient with and without treatment with MERCs modulator 24. (A) Basal OCR, and after addition of oligomycin, FCCP and rotenone + antimycin. (B) Spare respiratory capacity, calculated as the difference between maximal and baseline OCR. The data show the mean of four experimental replicates ± the standard error of the mean.
Defects in MAM in ALS have been shown to alter mitochondria substrate specificity from pyruvate to fatty acids as carbon sources for ATP production.37 This metabolic shift results in alterations in mitochondrial activity in sALS lymphoblasts, resulting in increased basal OCR and reduced spare respiratory capacity and loss of cellular metabolic flexibility. Our previous findings indicate that compound 24 can restore ER-mitochondria contacts stimulating MAM formation and regulating bioenergetics in ALS lymphoblasts. While the specific molecular mechanisms behind this effect require further investigation, our results highlight the potential of the MERCs modulator 24 as a therapeutic agent for correcting metabolic and mitochondrial dysfunction in ALS.
Transmission Electron Microscopy Analysis
One of the best techniques to study and analyze MERCs is transmission electron microscopy (TEM) and, although it is a low throughput technique that requires samples to be fixed and processed, it is emerging as the gold standard for visualizing the close proximity of the ER and mitochondria membranes.38
The first analysis was done in HCT116 cells treated with compound 24, as this compound promoted cholesterol uptake in this cell line (Figure 6). Representative images are shown in Figure 12. Quantification of MERCs were done in 5 independent cells and different parameters such as the number of contact sites, the average length of the contact site or the minimal distance between organelles were determined. Finally the ERMICC coefficient as described by Naon et al.39 was determined in cells treated with DMSO or compound 24. This coefficient is higher when the mitochondria-ER distance is closer, which is the situation found in our samples. These data confirm that compound 24 is a MERCs modulator promoting the proximity between the two organelles, which may underlie increased cholesterol uptake, one of the first step in further lipid metabolism.
Figure 12.
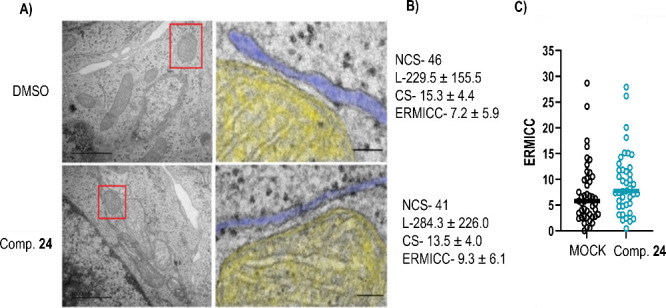
Effect of compound 24 on MERCs formation in HCT116 cells. (A) Left, Representative TEM-images of a mitochondria-ER contact site in HCT116 cells treated with 24 or with DMSO (MOCK). Right, zoomed area (marked with a red box). Mitochondria is shown in yellow; the ER appears in blue. Scale bar, 100 nm. (B) Quantification of MERCs on compound 24 treated and untreated cells. NCS- Number of contact sites in N = 5 cells. L- Average Length of the contact sites measured in nm. CS-Contact site, minimal distance between organelles in nm. ERMICC- ER-Mitochondria contact coefficient. (C) ERMICC coefficient of individual contact sites in DMSO and compound 24 treated cells.
In a subsequent step, we investigated by TEM lymphoblasts from controls and sporadic ALS patients treated with compound 24. Previous reports have shown that ALS cells present mitochondria with structural alterations such as disorganized cristae and low electron density.40 Therefore, to assess the effect of this small molecule on the morphology of mitochondria and their contacts with ER, we analyzed control and sporadic ALS lymphoblasts before and after treatment with compound 24.
In agreement with our previous data,8 MERCs appeared significantly decreased in ALS cells when compared to controls, but treatment with compound 24 rescued the number of contacts in lymphoblast from sALS patients (Figure 11). We note, however, that this increase in the number of MERCs does not necessarily correlate with a stimulation of the functional crosstalk between both organelles.
Moreover, after treatment, sALS lymphoblasts displayed large lipid droplets in their cytosol in apposition to ER and mitochondria (Figure 13) suggesting, perhaps a shift in mitochondrial lipid metabolism. In lieu with this idea, our results showed that sALS lymphoblasts presented mitochondria with disorganized or absent cristae compared to those from healthy individuals,41 and that cristae structure was restored after incubation with compound 24 (Figure 14).
Figure 13.
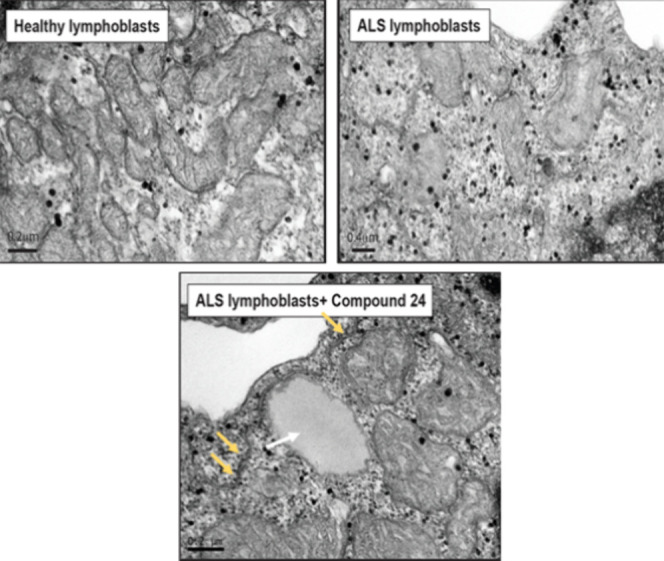
TEM images on control, sALS and sALS with MERCs modulator 24 (5 μM for 24 h). The white arrow shows a lipid droplet and the yellow ones remark the MERCs.
Figure 14.
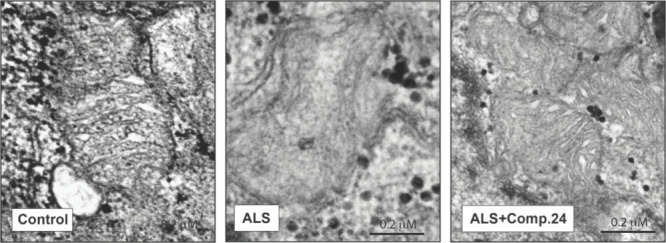
TEM images of control, ALS and ALS + compound 24. In ALS lymphoblast disorganized or absent cristae inside the mitochondria is observed in comparison to healthy controls lymphoblasts. Treatment with compound 24 (5 μM for 24 h) restored mitochondria structure.
Our studies suggest that these drugs have a beneficial impact on mitochondria in ALS cells, although further functional studies are necessary to fully elucidate the mechanism behind these changes.
ADME Properties and Blood-Brain Barrier Permeability Prediction of MERCs Modulators
Absorption, Distribution, Metabolism, and Excretion (ADME) properties are critical in drug discovery as they determine the pharmacokinetics, safety, and overall effectiveness of drug candidates. Computational tools are extensively used to estimate these parameters, including solubility, permeability, oral absorption, and central nervous system (CNS) penetration. These predictions guide compound selection and optimization, reducing the dependence on time-consuming and expensive experimental methods.
Using QikProp (Schrödinger)42 for in silico calculations, we assessed key physicochemical and ADME properties of the MERCs modulators (compounds 24, 25, 27, and 29) alongside the reference compound, niclosamide. The results are summarized in Table 2. Overall, the calculated properties fall within acceptable ranges (as detailed in the experimental section). Notably, compound 24 exhibits particularly favorable permeation values, including Caco-2 permeability and predicted human oral absorption.
Table 2. Prediction of Relevant Physicochemical and ADME Propertiesa.
| Comp. no. | MW (D) | QP log Po/w | QPlogS (mol dm–3) | QPPCaco (nm s–1) | QPlogBB | HOA (%) | PSA (Å2) |
|---|---|---|---|---|---|---|---|
| niclosamide | 327.12 | 3.107 | –4.64 | 248.19 | –0.937 | 87.99 | 97.98 |
| 24 | 247.68 | 3.267 | –3.92 | 1756.47 | –0.152 | 100.00 | 53.86 |
| 25 | 292.68 | 2.68 | –4.12 | 208.74 | –1.145 | 84.16 | 98.89 |
| 27 | 272.69 | 2.858 | –4.34 | 366.19 | –0.914 | 89.56 | 79.57 |
| 29 | 292.68 | 2.624 | –4.15 | 208.65 | –1.147 | 83.82 | 98.80 |
MW: molecular weight; QP log Po/w: Predicted octanol/water partition coefficient; QPlogS: Predicted aqueous solubility, log S. S in mol dm–3 is the concentration of the solute in a saturated solution that is in equilibrium with the crystalline solid; QPPCaco: Predicted apparent Caco-2 cell permeability in nm/s. Caco-2 cells are a model for the gut-blood barrier; QPlogBB: Predicted brain/blood partition coefficient; HOA: Predicted human oral absorption on 0 to 100% scale. The prediction is based on a quantitative multiple linear regression model. This property usually correlates well with human oral absorption, as both measure the same property; PSA: Polar surface area. van der Waals surface area of polar nitrogen and oxygen atoms and carbonyl carbon atoms.
As one of the primary challenges in treating CNS diseases is the penetration of the drug candidates through the blood-brain barrier (BBB), we tested experimentally the brain penetration of niclosamide and compounds 24, 25, 27, and 29 using the parallel artificial membranes permeability assay (PAMPA) which utilizes a porcine brain lipid membrane. The in vitro permeabilities (Pe) of ten commercial drugs for human use through the lipid membrane extract, along with those of the compounds, were determined and are detailed in Figure S1 and Table S1. Niclosamide was not completely soluble under the experimental conditions and could not be tested. In fact, this is the less soluble compound (QPlogS) in the previous calculated properties (Table 2). Compounds were classified as CNS+ when they exhibited a value of permeability >4.4 × 10⁻⁶ cm s–1 (Figure 15).
Figure 15.

Permeability (Pe 10–6 cm s–1) across the BBB of control drugs (used in the experiment validation) and MERCs modulators 24, 25, 27, and 29 evaluated by the PAMPA methodology (CNS+, permeable, green; CNS–, not permeable, red).
As shown in Figure 15, all the compounds tested (5-chloro-2-hydroxybenzamide derivatives 24, 25, 27 and 29) and in particular 24, demonstrated the capability to cross the BBB through passive permeation, indicating their potential as candidates for further advancement.
Conclusions
Overall, we have reported for the first time a high-throughput screening using the MERLIN sensor to discover small molecules capable of modulating mitochondrial-ER contact sites (MERCs). Through structural optimization of the antihelmintic drug niclosamide, we developed a series of MERCs modulators based on a hydroxybenzamide scaffold. Our findings demonstrate that the MERLIN biosensor, initially designed to assess distances between mitochondria and the ER, is a valuable tool for discovering effective MERCs modulators that can reduce ER-mitochondria distance and increase the cholesterol uptake in HCT116 cells. Interestingly, we also demonstrated that not only the internalization of cholesterol was altered in sporadic and familial ALS patient-derived cell models such as SOD1 and c9orf72, but that our selected MERCs modulator compound 24 could significantly restore the uptake levels of this lipid. Compound 24 increased the number of MERCs, promoted the formation of lipid droplets, restore mitochondrial oxygen consumption rates and re-established mitochondrial cristae in lymphoblasts from sALS patients as revealed by EM analysis. Additionally, niclosamide derivative 24 was also capable of crossing the blood-brain barrier through passive permeation, thus being suitable for further in vivo studies. Altogether, we report novel valuable tools for investigating the potential of modulating mitochondrial-ER contacts to promote mitochondria health. Moreover, we here report biologically active compounds with an appealing therapeutic profile for the treatment of neurodegenerative diseases like ALS, associated with defects in the formation of MAM and lipid metabolism dysfunctions.
Experimental Section
Chemistry
All solvents were purchased from Sigma-Aldrich (anhydrous solvents), and commercially available reagents were used as received without further purification. All reactions were monitored by thin-layer chromatography (TLC) (TLC plates GF254, Merck) or LC–MS (liquid chromatography mass spectrometry). The MW-assisted synthesis was carried out using a Biotage Initiator eight single-mode cavity instrument from Biotage. The crude reaction products were purified by flash chromatography on prepacked silica gel columns using the Isolera One system from Biotage. 1H and 13C NMR (nuclear magnetic resonance) spectra were recorded on a Bruker AVIII HD 300 MHz BACS-60 operating at 300 and 75 MHz respectively, using CDCl3 or DMSO-d6 as solvents and tetramethylsilane (TMS) as the internal standard. Chemical shifts are reported in δ values (ppm) and coupling constants (J) are reported in hertz (Hz). Multiplicities are given by the following abbreviations: s (singlet), d (doublet), dd (doublet of doublets), ddd (doublet of doublet of doublets), t (triplet), td (triplet of doublets), q (quartet), quint (quintet), m (multiplet), and br (broad signal). Melting points (mp) were determined in a Büchi Melting Point M-560 apparatus. HPLC–MS (high-pressure liquid chromatography coupled to mass spectrometry) analysis was carried out on an Agilent 1260 Infinity II HPLC instrument coupled with an Agilent MSD XT quadrupole and equipped with a ZORBAX SB-C18 column (3.5 μM, 50 mm × 4.6 mm) using scan positive electrospray. High-resolution mass spectrometry (HRMS) was performed on a QTOF hybrid quadrupole time-of-flight Agilent 6500 mass spectrometer, coupled with an Agilent 1100 liquid chromatograph. Values are expressed in mass units (m/z). Derivatives 1,432,433,445,456,457,4613,4720,4824,4925,4926,5027,5029,5130,5231,5332,543355 and 34(54) have been previously described although their synthetic procedures are different or their structural characterizations are missed. Compounds 9, 10, 11, 12, 14, 16, 18, 21, 22, and 28 are found with CAS number but without synthesis or structural characterization. Niclosamide derivatives 4, 8, 15, 17, 19, and 23 are completely new. All the compounds are >95% purity by HPLC analysis.
General Procedure for the Synthesis of 2-Chloro- or 2-Fluoro-4-nitrophenylamide Derivatives 1–23
A convergent synthetic pathway using MW-assisted synthesis was used. Thus, either 2-chloro- or 2-fluoro-4-nitroaniline (1 equiv) and the corresponding acyl chloride (1 equiv) were mixed in a microwave tube and the mixture was reacted at 150 °C for 10 min. After this time, the formed solid was washed with n-hexane and recrystallized from ethanol to yield the desired product. In some cases, the synthesis of the corresponding acyl chloride reagent was necessary prior to the formation of the amide bond. These compounds were obtained by the reaction of the carboxylic acid (1 equiv) with thionyl chloride (15 mL) and the mixture was left stirring for 2 h at 80 °C. The resulting product was isolated by the rotatory evaporation of the solvent and washed with methylene chloride (2 × 20 mL). The acyl chlorides were used without further purification.
5-Chloro-N-(2-chloro-4-nitrophenyl)-2-hydroxybenzamide (1)
The title compound was synthesized from 5-chloro-2-hydroxybenzoic acid (300 mg, 1.74 mmol), thionyl chloride (15 mL), and 2-chloro-4-nitroaniline (271 mg, 1.74 mmol). A white solid was obtained. Yield: 50%; mp: 229–230 °C (lit.43 228–231 °C). 1H NMR (300 MHz, DMSO-d6) δ 12.53 (br, 1H), 11.34 (s, 1H), 8.81 (d, J = 9.3 Hz, 1H), 8.44 (d, J = 2.6 Hz, 1H), 8.30 (dd, J = 9.3 and 2.7 Hz, 1H), 7.97 (d, J = 2.8 Hz, 1H), 7.54 (dd, J = 8.8 and 2.8 Hz, 1H), 7.10 (d, J = 8.8 Hz, 1H). 13C NMR (75 MHz, DMSO-d6) δ 163.1, 155.7, 143.1, 141.6, 134.5, 130.5, 125.3, 124.4, 124.2, 122.9, 121.3, 119.9, 119.7. HPLC–MS (M + H)+ = 327.1, purity 99.4%, Rt = 3.97 min.
5-Chloro-N-(2-fluoro-4-nitrophenyl)-2-hydroxybenzamide (2)
The title compound was synthesized from 5-chloro-2-hydroxybenzoic acid (220 mg, 1.27 mmol), thionyl chloride (15 mL), and 2-fluoro-4-nitroaniline (200 mg, 1.27 mmol). A brown solid was obtained. Yield: 40%; mp: 263–264 °C (lit.43 248–252 °C). 1H NMR (300 MHz, DMSO-d6) δ 12.37 (s, 1H), 11.11 (d, J = 3.2 Hz, 1H), 8.67 (dd, J = 9.1 and 7.8 Hz, 1H), 8.26 (dd, J = 11.0 and 2.6 Hz, 1H), 8.19 (ddd, J = 9.1, 2.6, and 1.1 Hz, 1H), 7.94 (d, J = 2.8 Hz, 1H), 7.53 (dd, J = 8.8 and 2.8 Hz, 1H), 7.08 (d, J = 8.8 Hz, 1H). 13C NMR (75 MHz, DMSO-d6) δ 162.8, 155.2, 155.2 (d, J = 244.9 Hz), 142.5 (d, J = 8.1 Hz), 133.9, 133.0 (d, J = 10.8 Hz), 129.8, 123.7, 121.1 (d, J = 2.6 Hz), 120.8 (d, J = 1.8 Hz), 119.5, 119.2, 111.3 (d, J = 23.5 Hz). HPLC–MS (M + H)+ = 311.1, purity 97.4%, Rt = 3.85 min.
N-(2-Chloro-4-nitrophenyl)-2-methoxybenzamide (3)
The title compound was synthesized from 2-chloro-4-nitroaniline (300 mg, 1.74 mmol) and 2-methoxybenzoyl chloride (259 μL, 1.74 mmol). A white solid was obtained. Yield: 59%; mp: 203–204 °C. 1H NMR (300 MHz, CDCl3) δ 10.99 (s, 1H), 8.98 (d, J = 9.3 Hz, 1H), 8.33 (d, J = 2.6 Hz, 1H), 8.30 (dd, J = 7.9 and 1.8 Hz, 1H), 8.19 (dd, J = 8.8 and 2.6 Hz, 1H), 7.57 (td, J = 8.3 and 1.8 Hz, 1H), 7.17 (t, J = 8.2 Hz, 1H), 7.08 (d, J = 7.2 Hz, 1H), 4.12 (s, 1H). 13C NMR (75 MHz, CDCl3) δ 163.9, 157.6, 142.8, 141.9, 134.6, 133.0, 124.9, 123.8, 122.6, 122.0, 120.8, 111.8, 56.5. HPLC–MS (M + H)+ = 307.1, purity 99.7%, Rt = 4.18 min.
N-(2-Fluoro-4-nitrophenyl)-2-methoxybenzamide (4)
The title compound was synthesized from 2-fluoro-4-nitroaniline (200 mg, 1.28 mmol) and 2-methoxybenzoyl chloride (191 μL, 1.28 mmol). A beige solid was obtained. Yield: 72%; mp: 163–164 °C. 1H NMR (300 MHz, CDCl3) δ 10.73 (s, 1H), 8.87 (dd, J = 9.3 and 7.7 Hz, 1H), 8.29 (dd, J = 7.9 and 1.8 Hz, 1H), 8.15–8.07 (m, 1H), 8.03 (dd, J = 10.9 and 2.5 Hz, 1H), 7.57 (ddd, J = 8.4, 7.3, and 1.9 Hz, 1H), 7.17 (td, J = 8.2 and 1.0 Hz, 1H), 7.07 (dd, J = 8.4 and 1.1 Hz, 1H), 4.11 (s, 1H). 13C NMR (75 MHz, CDCl3) δ 163.7, 157.6, 151.2 (d, J = 246.7 Hz), 142.5 (d, J = 8.8 Hz), 134.6 (C-14), 133.9 (d, J = 9.6 Hz), 132.8, 122.1, 121.15 (d, J = 2.8 Hz), 120.7, 120. 6, 111.9, 110.9 (d, J = 24.3 Hz), 56.5. HRMS m/z: calcd for C14H11FN2O4 [M + Na]+ 313.0595; found 313.0584. HPLC–MS (M + H)+ = 291.1, purity 99.7%, Rt = 4.01 min.
2-Chloro-N-(2-chloro-4-nitrophenyl)benzamide (5)
The title compound was synthesized from 2-chloro-4-nitroaniline (300 mg, 1.74 mmol) and 2-chlorobenzoyl chloride (220 μL, 1.74 mmol). A white solid was obtained. Yield: 31%; mp: 192–193 °C. 1H NMR (300 MHz, DMSO-d6) δ 10.62 (s, 1H), 8.40 (d, J = 2.6 Hz, 1H), 8.28 (dd, J = 9.0 and 2.6 Hz, 1H), 8.17 (d, J = 9.0 Hz, 1H), 7.69–7.45 (m, 4H). 13C NMR (75 MHz, DMSO-d6) δ 165.6, 144.4, 140.7, 135.7, 131.7, 130.1, 129.8, 129.3, 127.3, 126.9, 125.9, 125.1, 123.0. HRMS m/z: calcd for C13H8Cl2N2O3 [M + Na]+ 332.9804; found 332.9803. HPLC–MS (M + H)+ = 311.0, purity 99.9%, Rt = 3.91 min.
2-Chloro-N-(2-fluoro-4-nitrophenyl)benzamide (6)
The title compound was synthesized from 2-fluoro-4-nitroaniline (200 mg, 1.28 mmol) and 2-chlorobenzoyl chloride (162 μL, 1.28 mmol). A beige solid was obtained. Yield: 78%; mp: 171–172 °C. 1H NMR (300 MHz, CDCl3) δ 8.81 (t, J = 9.1 Hz, 1H), 8.63 (s, 1H), 8.15 (dd, J = 9.1 and 1.9 Hz, 1H), 8.06 (dd, J = 10.7 and 2.6 Hz, 1H), 7.87 (dd, J = 7.0 and 1.7 Hz, 1H), 7. 56–7.38 (m, 3H). 13C NMR (75 MHz, CDCl3) δ 164.5, 151.2 (d, J = 247.7 Hz, 143.4 (d, J = 8.4 Hz, C-5), 133.5, 133.0, 132.6 (d, J = 10.0 Hz, C-2), 131.3, 131.0, 130.9, 127.8, 121.1 (d, J = 3.3 Hz), 120.8 (d, J = 1.3 Hz), 111.2 (d, J = 24.5 Hz). HRMS m/z: calcd for C13H8ClFN2O3 [M + Na]+ 317.0100; found 317.0096. HPLC–MS (M + H)+ = 295.1, purity 99.6%, Rt = 3.67 min.
N-(2-Chloro-4-nitrophenyl)-4-methylbenzamide (7)
The title compound was synthesized from 2-chloro-4-nitroaniline (200 mg, 1.16 mmol) and 4-methylbenzoyl chloride (153 μL, 1.16 mmol). A white solid was obtained. Yield: 37%; mp: 162–164 °C (lit.46 161–163 °C). 1H NMR (300 MHz, DMSO-d6) δ 10.20 (s, 1H), 8.41 (d, J = 2.6 Hz, 1H), 8.26 (dd, J = 9.0 and 2.6 Hz, 1H), 8.08 (d, J = 9.0 Hz, 1H), 7.92 (d, J = 8.3 Hz, 2H), 7.37 (d, J = 7.8 Hz, 2H), 2.40 (s, 3H). 13C NMR (75 MHz, DMSO-d6) δ 165.3, 144.4, 142.6, 141.5, 130.6, 129.2, 128.0, 127.9, 126.5, 124.9, 122.9, 21.1. HPLC–MS (M + H)+ = 291.1, purity 97.3%, Rt = 4.07 min.
N-(2-Fluoro-4-nitrophenyl)-4-methylbenzamide (8)
The title compound was synthesized from 2-fluoro-4-nitroaniline (200 mg, 1.28 mmol) and 4-methylbenzoyl chloride (169 μL, 1.28 mmol). A brown solid was obtained. Yield: 45%; mp: 177–178 °C. 1H NMR (300 MHz, DMSO-d6) δ 10.45 (s, 1H), 8.22 (dd, J = 10.5 and 2.4 Hz, 1H), 8.17–8.05 (m, 2H), 7.90 (d, J = 8.2 Hz, 2H), 7.36 (d, J = 7.7 Hz, 2H), 2.40 (s, 3H). 13C NMR (75 MHz, DMSO-d6) δ 165.6, 153.5 (d, J = 251.5 Hz), 143.9 (d, J = 8.3 Hz), 142.6, 133.1 (d, J = 11.6 Hz), 130.6, 129.1, 128.2, 125.2 (d, J = 2.5 Hz), 120.2 (d, J = 3.3 Hz), 111.8 (d, J = 24.9 Hz), 21.1. HRMS m/z: calcd for C14H11FN2O3 [M + Na]+ 297.0646; found 297.0642. HPLC–MS (M + H)+ = 275.1, purity 98.2%, Rt = 3.78 min.
N-(2-Chloro-4-nitrophenyl)thiophene-2-carboxamide (9)
The title compound was synthesized from 2-chloro-4-nitroaniline (300 mg, 1.74 mmol) and 2-thiophenecarbonyl chloride (186 μL, 1.74 mmol). A gray solid was obtained. Yield: 70%; mp: 182–183 °C. 1H NMR (300 MHz, CDCl3) δ 8.78 (d, J = 9.2 Hz, 1H), 8.55 (s, 1H), 8.34 (d, J = 2.6 Hz, 1H), 8.21 (dd, J = 9.2 and 2.6 Hz, 1H), 7.71 (dd, J = 3.8 and 1.2 Hz, 1H), 7.66 (dd, J = 5.0 and 1.1 Hz, 1H), 7.20 (dd, J = 5.0 and 3.8 Hz, 1H). 13C NMR (75 MHz, CDCl3) δ 159.8, 143.2, 140.3, 138.1, 132.7, 129.7, 128.4, 124.9, 123.9, 122.4, 120.2. HRMS m/z: calcd for C11H7ClN2O3S [M + Na]+ 304.9758; found 304.9751. HPLC–MS (M + H)+ = 283.0, purity 99.8%, Rt = 3.76 min.
N-(2-Fluoro-4-nitrophenyl)thiophene-2-carboxamide (10)
The title compound was synthesized from 2-fluoro-4-nitroaniline (200 mg, 1.28 mmol) and 2-thiophenecarbonyl chloride (137 μL, 1.28 mmol). A brown solid was obtained. Yield: 50%; mp: 186–187 °C. 1H NMR (300 MHz, CDCl3) δ 8.72 (dd, J = 9.1 and 7.8 Hz, 1H), 8.18–8.08 (m, 2H), 8.06 (dd, J = 10.8 and 2.5 Hz, 1H), 7.70 (dd, J = 3.8 and 1.1 Hz, 1H), 7.66 (dd, J = 5.0 and 1.1 Hz, 1H), 7.19 (dd, J = 5.0 and 3.8 Hz, 1H). 13C NMR (75 MHz, CDCl3) δ 159.8, 150.9 (d, J = 246.8 Hz), 143.0 (d, J = 8.4 Hz), 137.9, 132.8 (d, J = 9.6 Hz), 132.7, 129.7, 128.4, 121.1 (d, J = 3.4 Hz), 120.5 (d, J = 1.6 Hz), 111.2 (d, J = 24.3 Hz). HRMS m/z: calcd for C11H7FN2O3S [M + Na]+ 289.0054; found 289.0052. HPLC–MS (M + H)+ = 267.1, purity 99.5%, Rt = 3.52 min.
N-(2-Chloro-4-nitrophenyl)-1-naphthamide (11)
The title compound was synthesized from 2-chloro-4-nitroaniline (300 mg, 1.74 mmol) and 1-naphthoyl chloride (263 μL, 1.74 mmol). A white solid was obtained. Yield: 35%; mp: 193–195 °C. 1H NMR (300 MHz, CDCl3) δ 8.97 (d, J = 9.2 Hz, 1H), 8.52 (s, 1H), 8.43 (m, 1H), 8.36 (d, J = 2.6 Hz, 1H), 8.27 (dd, J = 9.2 and 2.6 Hz, 1H), 8.06 (d, J = 8.5 Hz, 1H), 7.84 (dd, J = 7.1 and 1.2 Hz, 1H), 7.98–7.92 (m, 1H), 7.68–7.53 (m, 3H). 13C NMR (75 MHz, CDCl3) δ 167.5, 143.3, 140.7, 134.1, 133.0, 132.5, 130.2, 128.8, 128.1, 127.1, 125.9, 125.1, 124.9, 124.9, 123.9, 122.8, 120.5. HRMS m/z: calcd for C17H11ClN2O3 [M + H]+ 327.0531; found 327.0531. HPLC–MS (M + H)+ = 327.0, purity 99.0%, Rt = 4.09 min.
N-(2-Fluoro-4-nitrophenyl)-1-naphthamide (12)
The title compound was synthesized from 2-fluoro-4-nitroaniline (200 mg, 1.28 mmol) and 1-naphthoyl chloride (194 μL, 1.28 mmol). A beige solid was obtained. Yield: 58%; mp: 170–171 °C. 1H NMR (300 MHz, CDCl3) δ 8.97 (dd, J = 9.2 and 7,7 Hz, 1H), 8.43–8.34 (m, 1H), 8.25–8.14 (m, 2H), 8.10–8.01 (m, 2H), 7.98–7.91 (m, 1H), 7.81 (dd, J = 7.2 and 1.3 Hz, 1H), 7.67–7.51 (m, 3H). 13C NMR (75 MHz, CDCl3) δ 167.5, 151.1 (d, J = 246.0 Hz), 143.2 (d, J = 8.8 Hz), 134.0, 133.1 (d, J = 8.8 Hz), 132.9, 132.5, 130.2, 128.8, 128.1, 127.1, 125.8, 125.0, 124.8, 121.1 (d, J = 3.3 Hz), 120.7 (d, J = 1.3 Hz), 111.2 (d, J = 24.3 Hz). HRMS m/z: calcd for C17H11FN2O3 [M + H]+ 333.0646; found 333.0642. HPLC–MS (M + H)+ = 311.1, purity 99.9%, Rt = 3.85 min.
N-(4-Nitrophenyl)-1-naphthamide (13)
The title compound was synthesized from p-nitroaniline (200 mg, 1.44 mmol) and 1-naphthoyl chloride (219 μL, 1.44 mmol). A beige solid was obtained. Yield: 45%; mp: 200–202 °C (lit.47 213-215 °C). 1H NMR (300 MHz, DMSO-d6) δ 11.19 (s, 1H), 8.30 (d, J = 9.2 Hz, 2H), 8.24–8.00 (m, 5H), 7.84 (d, J = 7.1 Hz, 1H), 7.70–7.55 (m, 3H). 13C NMR (75 MHz, DMSO-d6) δ 167.9, 145.5, 142.6, 133.8, 133.2, 130.8, 129.5, 128.4, 127.3, 126.5, 126.0, 125.0, 125.0, 124.9, 119.5. HPLC–MS (M + H)+ = 293.1, purity 97.9%, Rt = 3.80 min.
N-(2-Chloro-4-nitrophenyl)-2-phenylacetamide (14)
The title compound was synthesized from 2-chloro-4-nitroaniline (300 mg, 1.74 mmol) and 2-phenylacetyl chloride (230 μL, 1.74 mmol). A white solid was obtained. Yield: 55%; mp: 92–94 °C. 1H NMR (300 MHz, CDCl3) δ 8.68 (d, J = 9.3 Hz, 1H), 8.20 (d, J = 2.6 Hz, 1H), 8.14 (dd, J = 9.2 and 2.6 Hz, 1H), 7.95 (br, 1H), 7.49–7.32 (m, 5H), 3.58 (s, 2H). 13C NMR (75 MHz, CDCl3) δ 169.6, 143.2, 140.2, 133.3, 129.9, 129.8, 128.5, 124.7, 123.7, 122.4, 119.9, 45.4. HRMS m/z: calcd for C14H11ClN2O3 [M + H]+ 291.0531; found 291.0524. HPLC–MS (M + H)+ = 291.1, purity 98.5%, Rt = 3.82 min.
N-(2-Fluoro-4-nitrophenyl)-2-phenylacetamide (15)
The title compound was synthesized from 2-fluoro-4-nitroaniline (200 mg, 1.28 mmol) and 2-phenylacetyl chloride (169 μL, 1.28 mmol). A beige solid was obtained. Yield: 77%; mp: 154–155 °C. 1H NMR (300 MHz, CDCl3) δ 8.68 (dd, J = 9.2 and 7.7 Hz, 1H), 8.09–8.02 (m, 1H), 7.93 (dd, J = 10.7 and 2.5 Hz, 1H), 7.62 (br, 1H), 7.48–7.31 (m, 5H), 3.83 (s, 2H). 13C NMR (75 MHz, CDCl3) δ 169.5, 150.7 (d, J = 247.2 Hz), 143.0 (d, J = 8.3 Hz), 133.3, 132.7 (d, J = 9.7 Hz), 129.7, 129.6, 128.3, 120.9 (d, J = 3.5 Hz), 120.3 (d, J = 1.7 Hz), 111.0 (d, J = 24.4 Hz), 45.1. HRMS m/z: calcd for C14H11FN2O3 [M + Na]+ 297.0646; found 297.0640. HPLC–MS (M + H)+ = 275.1, purity 99.1%, Rt = 3.61 min.
N-(2-Chloro-4-nitrophenyl)-2-(4-chlorophenyl)acetamide (16)
The title compound was synthesized from 2-chloro-4-nitroaniline (200 mg, 1.16 mmol) and 2-(4-chlorophenyl)acetyl chloride (170 μL, 1.16 mmol). A white solid was obtained. Yield: 59%; mp: 148–149 °C. 1H NMR (300 MHz, CDCl3) δ 8.67 (d, J = 9.2 Hz, 1H), 8.24 (d, J = 2.6 Hz, 1H), 8.15 (dd, J = 9.2 and 2.6 Hz, 1H), 7.90 (s, 1H), 7.42 (d, J = 8.4 Hz, 2H), 7.31 (d, J = 8.6 Hz, 2H), 3.75 (s, 2H). 13C NMR (75 MHz, CDCl3) δ 168.9, 143.3, 140.0, 134.5, 131.7, 131.1, 129.8, 124.8, 123.8, 122.5, 120.1, 44.6. HRMS m/z: calcd for C14H10Cl2N2O3 [M + Na]+ 346.9961; found 346.9951. HPLC–MS (M + H)+ = 325.0, purity 99.7%, Rt = 3.95 min.
2-(4-Chlorophenyl)-N-(2-fluoro-4-nitrophenyl)acetamide (17)
The title compound was synthesized from 2-fluoro-4-nitroaniline (200 mg, 1.28 mmol) and 2-(4-chlorophenyl)acetyl chloride (188 μL, 1.28 mmol). A brown solid was obtained. Yield: 65%; mp: 156–157 °C. 1H NMR (300 MHz, CDCl3) δ 8.61 (dd, J = 9.1 and 7.7 Hz, 1H), 8.10–8.03 (m, 1H), 7.96 (dd, J = 10.7 and 2.5 Hz, 1H), 7.56 (br, 1H), 7.40 (d, J = 8.4 Hz, 2H), 7.29 (d, J = 8.4 Hz, 2H), 3.79 (s, 2H). 13C NMR (75 MHz, CDCl3) δ 168.9, 150.8 (d, J = 247.0 Hz), 143.2 (d, J = 4.3 Hz), 134.4, 132.5 (d, J = 10.0 Hz), 131.7, 130.9, 129.7, 121.0 (d, J = 3.5 Hz), 120.4 (d, J = 1.7 Hz), 111.1 (d, J = 24.2 Hz), 44.3. HRMS m/z: calcd for C14H10ClFN2O3 [M + Na]+ 331.0256; found 331.0245. HPLC–MS (M + H)+ = 309.1, purity 99.4%, Rt = 3.79 min.
N-(2-Chloro-4-nitrophenyl)-2-cyclohexylacetamide (18)
The title compound was synthesized from 2-chloro-4-nitroaniline (300 mg, 1.74 mmol) and 2-cyclohexylacetyl chloride (267 μL, 1.74 mmol). A white solid was obtained. Yield: 38%; mp: 117–118 °C. 1H NMR (300 MHz, DMSO-d6) δ 8.32 (d, J = 1.6 Hz, 1H), 8.16–8.21 (m, 2H), 2.39 (d, J = 7.0 Hz, 2H), 1.85–1.53 (m, 6H), 1.30–0.92 (m, 5H). 13C NMR (75 MHz, DMSO-d6) δ 171.5, 143.2, 141.2, 124.9, 124.6, 124.1, 123.0, 43.6, 34.8, 32.4, 25.8, 25.6. HRMS m/z: calcd for C14H17ClN2O3 [M + Na]+ 319.0820; found 319.0815. HPLC–MS (M + H)+ = 297.1, purity 99.9%, Rt = 4.22 min.
2-Cyclohexyl-N-(2-fluoro-4-nitrophenyl)acetamide (19)
The title compound was synthesized from 2-fluoro-4-nitroaniline (200 mg, 1.28 mmol) and 2-cyclohexylacetyl chloride (197 μL, 1.28 mmol). An orange solid was obtained. Yield: 52%; mp: 162–163 °C. 1H NMR (300 MHz, CDCl3) δ 8.67 (dd, J = 9.1 and 7.8 Hz, 1H), 8.10–8.05 (m, 1H), 8.00 (dd, J = 10.8 and 2.5 Hz, 1H), 7.52 (br, 1H), 2.33 (d, J = 7.0 Hz, 2H), 1.85–1.64 (m, 5H), 1.37–0.96 (m, 6H). 13C NMR (75 MHz, CDCl3) δ 171.2, 150.6 (d, J = 246.0 Hz), 142.7 (d, J = 8.8 Hz), 132.9 (d, J = 9.9 Hz), 121.0 (d, J = 3.3 Hz), 120.4 (d, J = 1.7 Hz), 111.0 (d, J = 24.8 Hz), 46.1, 35.5, 33.2, 26.2, 26.1. HRMS m/z: calcd for C14H17FN2O3 [M–H]− 279.1150; found 279.1151. HPLC–MS (M + H)+ = 281.1, purity 99.2%, Rt = 4.03 min.
N-(2-Chloro-4-nitrophenyl)propionamide (20)
The title compound was synthesized from 2-chloro-4-nitroaniline (300 mg, 1.74 mmol) and propionyl chloride (152 μL, 1.74 mmol). A yellow solid was obtained. Yield: 80%; mp: 105–107 °C (lit.48 108 °C). 1H NMR (300 MHz, CDCl3) δ 8.71 (d, J = 9.2 Hz, 1H), 8.29 (d, J = 2.6 Hz, 1H), 8.16 (ddd, J = 9.2, 2.6, and 0.6 Hz, 1H), 7.89 (br, 1H), 2.54 (q, J = 7.5 Hz, 2H), 1.29 (t, J = 7.5 Hz, 3H). 13C NMR (75 MHz, CDCl3) δ 172.3, 143.0, 140.5, 124.8, 123.8, 122.0, 120.2, 31.3, 9.4. HRMS m/z: calcd for C9H9ClN2O3 [M–H]− 227.0229; found 227.0229. HPLC–MS (M + H)+ = 229.0, purity 99.0%, Rt = 3.41 min.
N-(2-Fluoro-4-nitrophenyl)propionamide (21)
The title compound was synthesized from 2-fluoro-4-nitroaniline (300 mg, 1.92 mmol) and propionyl chloride (168 μL, 1.92 mmol). A brown solid was obtained. Yield: 34%; mp: 167–168 °C. 1H NMR (300 MHz, CDCl3) δ 8.66 (dd, J = 9.1 and 7.8 Hz, 1H), 8.10–8.04 (m, 1H), 8.00 (dd, J = 10.8 and 2.5 Hz, 1H), 7.60 (s, 1H), 2.52 (q, J = 7.5 Hz, 2H), 1.28 (t, J = 7.5 Hz, 3H). 13C NMR (75 MHz, CDCl3) δ 172.4, 150.6 (d, J = 246.4 Hz), 142.7 (d, J = 8.8 Hz), 133.0 (d, J = 9.8 Hz), 121.0 (d, J = 3.3 Hz), 120.4 (d, J = 1.8 Hz), 111.0 (d, J = 24.6 Hz), 31.1, 9.3. HRMS m/z: calcd for C9H9FN2O3 [M–H]− 211.0524; found 211.0525. HPLC–MS (M + H)+ = 213.1, purity 99.7%, Rt = 3.20 min.
N-(2-Chloro-4-nitrophenyl)hexanamide (22)
The title compound was synthesized from 2-chloro-4-nitroaniline (300 mg, 1.74 mmol) and hexanoyl chloride (243 μL, 1.74 mmol). A white solid was obtained. Yield: 40%; mp: 98–99 °C. 1H NMR (300 MHz, CDCl3) δ 8.71 (d, J = 9.2 Hz, 1H), 8.29 (d, J = 2.6 Hz, 1H), 8.16 (dd, J = 9.2 and 2.6 Hz, 1H), 7.88 (s, 1H), 2.49 (t, J = 7.5 Hz, 2H), 1.84–1.69 (m, 2H), 1.46–1.27 (m, 4H), 0.98–0.86 (m, 3H). 13C NMR (75 MHz, CDCl3) δ 171.8, 143.0, 140.5, 124.8, 123.8, 122.1, 120.2, 38.2, 31.4, 25.1, 22.5, 14.0. HRMS m/z: calcd for C12H15ClN2O3 [M–H]− 269.0698; found 269.0702. HPLC–MS (M + H)+ = 271.1, purity 99.8%, Rt = 4.04 min.
N-(2-Fluoro-4-nitrophenyl)hexanamide (23)
The title compound was synthesized from 2-fluoro-4-nitroaniline (300 mg, 1.92 mmol) and hexanoyl chloride (269 μL, 1.92 mmol). A beige solid was obtained. Yield: 56%; mp: 166–167 °C. 1H NMR (300 MHz, CDCl3) δ 8.66 (dd, J = 9.1 and 7.8 Hz, 1H), 8.11–8.04 (mm, 1H), 8.00 (dd, J = 10.8 and 2.5 Hz, 1H), 7.57 (s, 1H), 2.45 (d, J = 7.6 Hz, 2H), 1.75 (quint, J = 7.3 Hz, 2H), 1.43–1.28 (m, 4H), 0.97–0.86 (m, 3H). 13C NMR (75 MHz, CDCl3) δ 171.9, 150.6 (d, J = 246.2 Hz), 143.1 (d, J = 9.6 Hz), 132.9 (d, J = 9.6 Hz), 121.0 (d, J = 3.1 Hz), 120.4 (d, J = 1.7 Hz), 111.0 (d, J = 24.5 Hz), 38.0, 31.4, 25.0, 22.5, 14.0. HPLC–MS (M + H)+ = 255.1, purity 99.7%, Rt = 3.85 min.
General Procedure for the Synthesis of 5-Chloro-2-hydroxybenzamide Derivatives 24–34
5-Chloro-2-hydroxybenzoic acid (500 mg, 2.90 mmol) was solved in 15 mL of chloroform with 1-(3-(dimethylamino)propyl)-3-ethylcarbodiimide hydrochloride (EDC, 71 mg, 0.37 mmol), 1-hydroxybenzotriazole hydrate (HOBt, 40 mg, 0.30 mmol), Et3N (600 μL, 4.30 mmol) and the corresponding amine (2.90 mmol). The mixture was stirred overnight at room temperature. After this time, the organic mixture was evaporated, solved in 15 mL of ethyl acetate and washed with brine (2 × 10 mL) and water (2 × 10 mL). The organic layer was dried over anhydrous sodium sulfate and concentrated in vacuo. The crude product was purified using silica gel flash chromatography with a gradient of hexane/ethyl acetate 9:1 as the elution solvent.
5-Chloro-2-hydroxy-N-phenylbenzamide (24)
The title compound was synthesized from 5-chloro-2-hydroxybenzoic acid (500 mg, 2.90 mmol), EDC (71 mg, 0.37 mmol), HOBt, (40 mg, 0.30 mmol), Et3N (600 μL, 4.30 mmol) and aniline (265 μL, 2.90 mmol). A white solid was obtained. Yield: 74%; mp: 211–212 °C (lit.49 209–210 °C). 1H NMR (300 MHz, DMSO-d6) δ 11.84 (s, 1H), 10.40 (s, 1H), 7.96 (d, J = 2.7 Hz, 1H), 7.72–7.67 (m, 2H), 7.47 (dd, J = 8.8 and 2.7 Hz, 1H), 7.41–7.34 (m, 2H), 7.18–7.11 (m, 1H), 7.02 (d, J = 8.8 Hz, 1H). 13C NMR (75 MHz, DMSO-d6) δ 165.0, 156.6, 138.0, 133.0, 128.8, 128.4, 124.3, 122.7, 120.8, 119.6, 119.1. HPLC–MS (M + H)+ = 248.0, purity 98.7%, Rt = 3.84 min.
5-Chloro-2-hydroxy-N-(4-nitrophenyl)benzamide (25)
The title compound was synthesized from 5-chloro-2-hydroxybenzoic acid (500 mg, 2.90 mmol), EDC (71 mg, 0.37 mmol), HOBt, (40 mg, 0.30 mmol), Et3N (600 μL, 4.30 mmol) and p-nitroaniline (400 mg, 2.90 mmol). A yellow solid was obtained. Yield: 45%; mp: 264–265 °C (lit.49 246–247 °C). 1H NMR (300 MHz, DMSO-d6) δ 11.45 (s, 1H), 10.82 (s, 1H), 8.27 (d, J = 9.4 Hz, 2H), 7.99 (d, J = 9.4 Hz, 2H), 7.83 (d, J = 2.7 Hz, 1H), 7.48 (dd, J = 8.8 and 2.7 Hz, 1H), 7.04 (d, J = 8.8 Hz, 1H). 13C NMR (75 MHz, DMSO-d6) δ 165.0, 155.9, 144.5, 142.7, 133.1, 128.8, 126.4, 124.9, 122.9, 120.1, 118.9. HPLC–MS (M + H)+ = 293.0, purity 99.7%, Rt = 3.84 min.
5-Chloro-N-(4-fluorophenyl)-2-hydroxybenzamide (26)
The title compound was synthesized from 5-chloro-2-hydroxybenzoic acid (500 mg, 2.90 mmol), EDC (71 mg, 0.37 mmol), HOBt, (40 mg, 0.30 mmol), Et3N (600 μL, 4.30 mmol) and 4-fluoroaniline (274 μL, 2.90 mmol). A white solid was obtained. Yield: 62%; mp: 238–239 °C (lit.50 239–240 °C). 1H NMR (300 MHz, DMSO-d6) δ 11.80 (s, 1H, H8), 10.43 (s, 1H), 7.94 (d, J = 2.7 Hz, 1H), 7.76–7.67 (m, 2H), 7.47 (dd, J = 8.8 and 2.7 Hz, 1H), 7.26–7.17 (m, 2H), 7.01 (d, J = 8.8 Hz, 1H). 13C NMR (75 MHz, DMSO-d6) δ 165.1, 158.9 (d, J = 241.2 Hz), 156.9, 134.3 (d, J = 2.5 Hz), 133.1, 128.3, 122.8 (d, J = 8.0 Hz), 122.7, 119.5, 119.1, 115.3 (d, J = 22.4 Hz). HPLC–MS (M + H)+ = 266.1, purity 99.5%, Rt = 3.85 min.
5-Chloro-N-(4-cyanophenyl)-2-hydroxybenzamide (27)
The title compound was synthesized from 5-chloro-2-hydroxybenzoic acid (500 mg, 2.90 mmol), EDC (71 mg, 0.37 mmol), HOBt, (40 mg, 0.30 mmol), Et3N (600 μL, 4.30 mmol) and 4-aminobenzonitrile (342 mg, 2.90 mmol). A white solid was obtained. Yield: 51%; mp: 247–249 °C (lit.50 246–247 °C). 1H NMR (300 MHz, DMSO-d6) δ 11.48 (br, 1H), 10.68 (s, 1H), 7.94–7.88 (m, 2H), 7.85–7.80 (m, 3H), 7.47 (dd, J = 8.8 and 2.7 Hz), 7.03 (d, J = 8.8 Hz, 1H). 13C NMR (75 MHz, DMSO-d6) δ 165.0, 156.0, 142.6, 133.3, 133.0, 128.7, 122.8, 120.7, 120.4, 119.0, 105.8. HPLC–MS (M + H)+ = 273.1, purity 99.9%, Rt = 3.71 min.
5-Chloro-2-hydroxy-N-(4-(methylcarbamoyl)phenyl)benzamide (28)
The title compound was synthesized from 5-chloro-2-hydroxybenzoic acid (500 mg, 2.90 mmol), EDC (71 mg, 0.37 mmol), HOBt, (40 mg, 0.30 mmol), Et3N (600 μL, 4.30 mmol) and 4-amino-N-methylbenzamide (435 mg, 2.90 mmol). A yellow solid was obtained. Yield: 44%; mp: 257–258 °C. 1H NMR (300 MHz, DMSO-d6) δ 11.84 (s, 1H), 10.52 (s, 1H), 8.45 (m, J = 4.5 Hz, 1H), 8.14 (t, J = 1.9 Hz, 1H), 7.99 (d, J = 2.7 Hz, 1H), 7.87 (ddd, J = 8.1, 2.3, and 1.1 Hz, 1H), 7.59 (dt, J = 7.8 and 1.3 Hz, 1H), 7.50–7.41 (m, 2H), 7.03 (d, J = 8.8 Hz, 1H), 2.79 (d, J = 4.5 Hz, 3H). 13C NMR (75 MHz, DMSO-d6) δ 166.4, 165.2, 157.0, 138.1, 135.3, 133.2, 128.7, 128.4, 123.3, 122.8, 122.6, 120.0, 119.4, 119.2, 26.3. HRMS m/z: calcd for C15H13ClN2O3 [M + Na]+ 327.0507; found 327.0506. HPLC–MS (M + H)+ = 305.1, purity 99.1%, Rt = 3.13 min.
5-Chloro-2-hydroxy-N-(3-nitrophenyl)benzamide (29)
The title compound was synthesized from 5-chloro-2-hydroxybenzoic acid (500 mg, 2.90 mmol), EDC (71 mg, 0.37 mmol), HOBt, (40 mg, 0.30 mmol), Et3N (600 μL, 4.30 mmol) and 3-nitroaniline (400 mg, 2.90 mmol). A white solid was obtained. Yield: 55%; mp: 243–244 °C (lit.51 260 °C). 1H NMR (300 MHz, DMSO-d6) δ 11.55 (br, 1H), 10.73 (s, 1H), 8.74 (t, J = 2.2 Hz, 1H), 8.06 (ddd, J = 8.2, 2.1, and 1.0 Hz, 1H), 7.98 (ddd, J = 8.3, 2.3, and 1.0 Hz, 1H), 7.89 (d, J = 2.7 Hz, 1H), 7.65 (t, J = 8.2 Hz, 1H), 7.47 (dd, J = 8.8 and 2.7 Hz, 1H), 7.03 (d, J = 8.8 Hz, 1H). 13C NMR (75 MHz, DMSO-d6) δ 165.3, 156.4, 147.9, 139.4, 133.2, 130.2, 128.5, 126.6, 122.8, 120.1, 119.1, 118.6, 114.7. HPLC–MS (M + H)+ = 293.1, purity 99.6%, Rt = 3.82 min.
N-(2-Aminophenyl)-5-chloro-2-hydroxybenzamide (30)
The title compound was synthesized from 5-chloro-2-hydroxybenzoic acid (500 mg, 2.90 mmol), EDC (71 mg, 0.37 mmol), HOBt, (40 mg, 0.30 mmol), Et3N (600 μL, 4.30 mmol) and benzene-1,3-diamine (313 mg, 2.90 mmol). An orange solid was obtained. Yield: 29%; mp: 305–307 °C. 1H NMR (300 MHz, DMSO-d6) δ 12.27 (br, 1H), 10.00 (s, 1H), 8.06 (d, J = 2.7 Hz, 1H), 7.46 (dd, J = 8.8 and 2.7 Hz, 1H), 7.26 (dd, J = 7.9 and 1.5 Hz, 1H), 7.03–6.93 (m, 2H), 6.79 (dd, J = 8.0 and 1.5 Hz, 1H), 6.60 (td, J = 7.5 and 1.5 Hz, 1H), 4.99 (br, 2H). 13C NMR (75 MHz, DMSO-d6) δ 165.7, 157.8, 143.0, 133.1, 128.5, 126.8, 126.4, 122.5, 122.3, 119.1, 118.4, 116.3, 116.0. HRMS m/z: calcd for C13H11ClN2O2 [M + H]+ 263.0582; found 263.0577. HPLC–MS (M + H)+ = 263.0, purity 98.4%, Rt = 3.29 min.
5-Chloro-2-hydroxy-N-(4-methoxybenzyl)benzamide (31)
The title compound was synthesized from 5-chloro-2-hydroxybenzoic acid (500 mg, 2.90 mmol), EDC (71 mg, 0.37 mmol), HOBt, (40 mg, 0.30 mmol), Et3N (600 μL, 4.30 mmol) and 4-methoxybenzylamine (379 μL, 2.90 mmol). A white solid was obtained. Yield: 62%; mp: 142–144 °C (lit.53 134–136 °C). 1H NMR (300 MHz, DMSO-d6) δ 12.56 (s, 1H), 9.32 (t, J = 5.9 Hz, 1H), 7.97 (d, J = 2.6 Hz, 1H), 7.43 (dd, J = 8.8 and 2.6 Hz, 1H), 7.26 (d, J = 8.6 Hz, 2H), 6.94 (d, J = 8.8 Hz, 1H), 6.90 (d, J = 8.7 Hz, 2H), 4.43 (d, J = 5.8 Hz, 2H), 3.73 (s, 3H). 13C NMR (75 MHz, DMSO-d6) δ 167.3, 158.6, 158.4, 133.3, 130.6, 128.8, 127.3, 122.3, 119.3, 116.8, 113.8, 55.1, 42.0. HPLC–MS (M + H)+ = 292.1, purity 99.1%, Rt = 3.80 min.
(5-Chloro-2-hydroxyphenyl)(4-methylpiperazin-1-yl)methanone (32)
The title compound was synthesized from 5-chloro-2-hydroxybenzoic acid (500 mg, 2.90 mmol), EDC (71 mg, 0.37 mmol), HOBt, (40 mg, 0.30 mmol), Et3N (600 μL, 4.30 mmol) and N-methylpiperazine (321 μL, 2.90 mmol). A white solid was obtained. Yield: 53%; mp: 152–154 °C (lit.54 164–165 °C). 1H NMR (300 MHz, DMSO-d6) δ 10.09 (s, 1H), 7.25 (dd, J = 8.7 and 2.7 Hz, 1H), 7.13 (d, J = 2.7 Hz, 1H), 6.87 (d, J = 8.7 Hz, 1H), 3.57 (br, 2H), 3.18 (br, 2H), 2.29 (br, 4H), 2.18 (s, 3H). 13C NMR (75 MHz, DMSO-d6) δ 165.3, 152.2, 129.7, 127.4, 125.8, 122.6, 117.4, 54.6, 54.3, 45.6. HPLC–MS (M + H)+ = 255.1, purity 98.6%, Rt = 1.95 min.
5-Chloro-2-hydroxy-N-(naphthalen-1-ylmethyl)benzamide (33)
The title compound was synthesized from 5-chloro-2-hydroxybenzoic acid (500 mg, 2.90 mmol), EDC (71 mg, 0.37 mmol), HOBt, (40 mg, 0.30 mmol), Et3N (600 μL, 4.30 mmol) and naphthalen-1-ylmethanamine (425 μL, 2.90 mmol). A white solid was obtained. Yield: 60%; mp: 188–189 °C. 1H NMR (300 MHz, DMSO-d6) δ 12.47 (s, 1H), 9.37 (t, J = 5.7 Hz, 1H), 8.16 (dd, J = 7.9 and 1.7 Hz, 1H), 8.01 (d, J = 2.6 Hz, 1H), 7.97 (dd, J = 8.0 and 1.6 Hz, 1H), 7.88 (dd, J = 7.2 and 2.3 Hz, 1H), 7.62–7.48 (m, 4H), 7.44 (dd, J = 8.9 and 2.7 Hz, 1H), 6.95 (d, J = 8.8 Hz, 1H), 4.99 (d, J = 5.6 Hz, 2H). 13C NMR (75 MHz, DMSO-d6) δ 167.2, 158.4, 133.7, 133.3, 130.8, 128.6, 127.8, 127.6, 126.4, 125.9, 125.7, 125.5, 123.3, 122.4, 119.3, 117.0, 40.7. HPLC–MS (M + H)+ = 312.1, purity 97.9%, Rt = 4.10 min.
5-Chloro-2-hydroxy-N-phenethylbenzamide (34)
The title compound was synthesized from 5-chloro-2-hydroxybenzoic acid (500 mg, 2.90 mmol), EDC (71 mg, 0.37 mmol), HOBt, (40 mg, 0.30 mmol), Et3N (600 μL, 4.30 mmol) and 2-phenylethanamine (364 μL, 2.90 mmol). A white solid was obtained. Yield: 76%; mp: 121–122 °C (lit.54 120–121 °C). 1H NMR (300 MHz, DMSO-d6) δ 12.53 (s, 1H), 8.93 (t, J = 5.6 Hz, 1H), 7.91 (d, J = 2.6 Hz, 1H), 7.43 (dd, J = 8.8 and 2.6 Hz, 1H), 7.34–7.17 (m, 5H), 6.93 (d, J = 8.8 Hz, 1H), 3.56–3.48 (m, 2H), 2.86 (t, J = 7.4 Hz, 2H). 13C NMR (75 MHz, DMSO-d6) δ 167.3, 158.5, 139.2, 133.2, 128.7, 128.4, 127.3, 126.2, 122.3, 119.3, 116.9, 40.6, 34.7. HPLC–MS (M + H)+ = 276.1, purity 97.9%, Rt = 3.93 min.
Biology
Cell Culture and Cell Viability
HCT116, and MERLIN-HCT116 cells were maintained in McCoy’s5A (free phenol red) medium (Sigma-Aldrich) and supplemented with 10% FBS (Invitrogen) and 1% penicillin/streptomycin (Invitrogen).
Lymphoblastic Cell Lines: Peripheral blood samples of all the individuals enrolled in this study were collected after written informed consent of the patients or their relatives (demographic information is presented in Table 3) to establish the lymphoblastoid cell lines (LCLs) as previously described,56 by infecting peripheral blood lymphocytes with the Epstein–Barr virus (EBV). All study protocols were approved by the Hospital Doce de Octubre (Approval number CEI 18/004) and the Spanish Council of Higher Research Institutional Review Board (date of approval Feb 1, 2018) and are in accordance with National and European Union Guidelines. All patients were diagnosed by applying the revised El Escorial criteria.57 Lymphoblastoid cells lines were grown in suspension in T flasks in an upright position, in approximately 8 mL of RPMI-1640 medium that contained 2 mM l-glutamine, 100 μg/mL streptomycin/penicillin and 10% (v/v) fetal bovine serum (FBS) and maintained in a humidified 5% CO2 incubator at 37 °C. Fluid was routinely changed every 3 days by removing the medium above the settled cells and replacing it with an equal volume of fresh medium.
Table 3. Demographic and Clinical Characteristics of Participants.
| code | gender | age | mutation |
|---|---|---|---|
| C100 | female | 83 | |
| C105 | female | 54 | |
| C106 | female | 67 | |
| C110 | male | 75 | |
| C112 | male | 71 | |
| C122 | male | 55 | |
| E2 | female | 76 | sporadic ALS |
| E4 | female | 54 | sporadic ALS |
| E6 | female | 79 | sporadic ALS |
| E8 | male | 55 | sporadic ALS |
| E10 | male | 68 | sporadic ALS |
| ED10 | male | 67 | sporadic ALS |
| E18-5 | male | 49 | SOD1 p.Leu117Val c.352C > G |
| E18-6 | female | 58 | SOD1 p.Asn139His c.418A > C |
| E18-7 | male | 59 | SOD1 p.Leu117Val c.352C > G |
| E20-1 | female | 63 | SOD1 |
| E9 | male | 64 | C9orf72 |
| E21-1 | male | 72 | C9orf72 |
| E7 | male | 88 | TBK1 Het R573G |
| E18-1 | female | 59 | TARDBP c.1146 A > G Het; p. ile Val |
| E18-3 | female | 40 | TARDBP Exon 6: c.883G > A Hom.; p.G295S |
Cell viability was determined by the MTT assay (3-[4,5-dimethylthiazol-2-yl]-2,5-diphenyltetrazolium bromide), as previously described.58 Cell survival was estimated as the percentage of the value of untreated controls.
BRET HTS Measurements
In BRET assays, MERLIN-HCT116 cells10 were seeded at 4500 cells/well in a white 384 well plate for 24 h and incubated at cell culture conditions (37 °C with 5% CO2). This is followed by overnight treatment with the EOS library compounds or their derivatives. Then cells were incubated with 5 μM coelenterazine h (PROLUME) for 8 min in the dark and BRET measurements were carried out in a CLARIOstar microplate reader at RT. The BRET signal is determined by calculating the acceptor emission relative to the donor emission, and corrected by subtracting the background ratio detected when RLuc8 (the Donor) is expressed alone. As an internal positive control, we used a fusion construct that contains both parts of the biosensor expressed in tandem (RLuc8-mVenus), which show high BRET efficiency due to close proximity.10 In each plate of the screening, we included as controls: HCT116 cells transfected with RLuc8 alone (negative control), HCT116 cells transfected with RLuc8-mVenus fusion (positive control), MERLIN-HCT116 cells treated with DMSO (untreated condition or basal value for the MERCs in the cells). For every plate, Z’ factor was calculated and only those plates with a Z’ factor higher than 0.7 were considered for further analysis. The Z’ factor was calculated using the formula: Z’ = 1 – 3(σp + σn)/|μp – μn|, where μ and σ are the mean and standard deviation of positive (p) and negative (n) controls, respectively.
In this screening, cell seeding as well as drug addition were performed using the MCA96 robot (TECAN). Substrate addition and BRET measurements were performed with the CLARIOstar plate reader (BIOGEN Científica).
After a preliminary screening with a fixed drug concentration of 15 μM, a confirmatory screening was done, maintaining the same concentration in order to minimize false positives. Next, for those components showing consistent differences, a titration with 8 different concentrations ranging from nanomolar levels up to ∼46 μM was carried out. Results were fitted to the equation: Y = Bottom + (Top – Bottom)/(1 + 10log EC50 – X) ([Agonist] vs response – Variable slope (four parameters) using the GraphPad software. When synthesized niclosamide derivatives were tested, we performed directly the dose–response determination at the eight different concentrations.
Cholesterol Internalization Measurement
HCT116 cells were seeded in a black 96 well plate for 24 h and incubated at cell culture conditions (37 °C with 5%CO2). Then, cells were treated with compounds for other 24 h. After this time, fluorescence NDB Cholesterol (Invitrogen) was added for 1 and 3 h. Cells were washed for 3 times with PBS and fluorescence was measured at 469/537 nm.
Lymphoblastoid cells lines were seeded in 24 well plates, treated with compounds for 24 h and incubated at cell culture conditions (37 °C with 5%CO2). Then, fluorescence NDB Cholesterol (Invitrogen) was added for 1 h. Cells were washed for 3 times with PBS and fluorescence was measured at 469/537 nm. In some experiments, 10 μM BLT1 (Sigma-Aldrich), SSO (Sigma-Aldrich) or EZE (SelleckChem) were incubated 15 min before addition of the NBD-cholesterol.
Cholesteryl-Esters Determination
Lymphoblastoid cells lines were treated with compound 24 for 24 h. Total levels of cholesteryl-esters were determined using the Amplex Cholesterol kit (A12216, Thermofisher Scientific). Briefly, lipids were extracted from cells by incubating equal amount of cells with a mixture of chloroform:methanol (2:1, v/v). After centrifugation and recovery of the organic phase, lipids were dried by speed-vac, resuspended in the provided assay buffer and cholesteryl-esters quantified following manufacturer’s instructions.
Quantificacion of Lipid Droplets
Lymphoblastoid cells lines previously treated for 24 h with compound 24 were fixed with 4% PFA and, after extensive washing with PBS, lipid droplets were stained by 2 h incubation with LipidTOX Green reagent (H34475, Thermofisher Scientific) following manufacturer's instructions. Nuclei were stained using DAPI. Images were obtained using a Leica SP8 confocal microscope and lipid droplet staining quantified using ImageJ software.
Oxygen Consumption Rates Measurements
Energy metabolism of control and ALS lymphoblasts was assessed in the presence or absence of compound 24 by using the Extracellular Flux Analyzer XFp (Agilent Seahorse). 200,000 cells/well were seeded in the Seahorse XFp miniplates, previously coated with a Poly-l-lysine solution (Poly-l-lysine 0.2 mg mL–1, borax 1X). Before measurements were made, cells were cultured for 24 h in supplemented RPMI medium (as described above) with or without compound 24 (5 μM). Bioenergetic profiles of ALS and control lymphoblasts were performed using the Mito Stress Test Kit (Agilent Technologies for Seahorse XFp). After 24 h of treatment, the culture medium was removed and 180 μL of bicarbonate-free DMEM (Sigma-Aldrich) supplemented with 2 mM l-glutamine, 5 mM glucose, 2% FBS, 1 mM pyruvate (Sigma-Aldrich), and HEPES 5 mM pH 7.4 was added. Cells were incubated for 1 h in a CO2-free incubator.
The glycolytic activity and mitochondrial respiration were determined from the oxygen consumption rate (OCR). First, four measurements under basal conditions were made. To inhibit mitochondrial ATP synthesis, oligomycin (1 μM) was added. Then, the uncoupler carbonylcyanide-p-trifluoromethoxy-phenylhydrazone (FCCP) was subsequently incorporated (3 μM) to determine the maximum respiratory rate. Finally, three measurements were made in the presence of antimycin (2.5 μM) and rotenone (2.5 μM) to inhibit mitochondrial respiration.
Mitochondrial-ER Contact Sites Quantification by Transmission Electron Microscopy (TEM)
Mitochondrial cristae images were obtained as described previously with some modifications.59 Briefly, HCT116 cells were seeded on Aclar discs and cultivated for 24 h before incubation with 25 μM of MERCs modulators. Then cells were fixed for 1 h at room temperature and 30 min at 4 °C in 4% formaldehyde with 2.5% sucrose and 100 mM CaCl2 in HEPES buffer pH 7.4. Samples were washed three times with 0.1 M cacodylate buffer. Then, they were incubated with 1% osmium tetroxide, 1% potassium ferricyanide, in 0.1 M CaCo Buffer with 1.25% Sucrose for 30 min at 4 °C. After 3 × 5 min wash with 0.1 M cacodylate buffer, samples were dehydrated using an ascending ethanol series (50, 70, 90, 100%) for 7 min each at 4 °C. Next, samples were infiltrated with a mixture of 50% Epon/ethanol for 1 h, 66% Epon/ethanol for 2 h and with pure Epon overnight at 4 °C. TAAB capsules filled with Epon were placed in TAAB capsules and filled with Epon and cured for 48 h at 60 °C as described previously.60 Ultrathin sections of 70 nm were performed using an ultramicrotome (Leica Microsystems, UC6) and a 45° diamond knife (Diatome, Biel, Switzerland) and stained with 1.5% uranyl acetate for 15 min at 37 °C and 3% lead citrate solution for 4 min at room temperature. Images were acquired using a JEM2100 Plus Transmission Electron Microscope (JEOL) operating at 80 kV equipped with a OneView 4K camera (Gatan). Image analysis for mitochondria-ER contact sites was performed manually using Fiji. ERMICC value to calculate the contact between ER and the mitochondria was calculated as described.39
ADME Properties Calculations
3D structures were prepared using LigPrep (Schrödinger).61 Briefly, hydrogens were added if needed, tautomers and protonation states were calculated at pH 7.4 ± 2.0 using Epik and the structures were energetically minimized. For each compound, the most favorable state was retained for the subsequent calculation of the described properties using QikProp (Schrödinger).42
The reference value intervals for each of the calculated properties are as follows: MW (130.0–725.0); QP log Po/w (−2.0–6.5); QPlogS (−6.5–0.5); QPPCaco (<25 poor, > 500 great); QPlogBB (−3.0–1.2); HOA (>80% high, < 25% poor); PSA (7.0–200.0).
Parallel Artificial Membrane Permeability Assay (PAMPA)
Prediction of the BBB penetration was done using the PAMPA methodology.62 Ten commercial drugs of known BBB permeability, namely atenolol, caffeine, desipramine, enoxacin, hydrocortisone, ofloxacin, piroxicam, promazine, testosterone and verapamil were used as controls in each experiment. An assay validation was conducted by comparing the reported permeability values of these commercial drugs with the experimental data obtained using this method. Controls and MERCs modulators were dissolved in 5 mL of a phosphate buffer saline solution of PBS/EtOH (70:30 respectively) at pH 7.4. The donor 96-well plate (Millipore, catalog no. MAIPS4510) was coated with 4 μL of porcine brain lipid in dodecane at 20 mg/mL (Avanti Polar Lipids, catalog no. 141101) and then filled with 180 μL of each filtered compound solution. The acceptor 96-well plate (Millipore, catalog no. 141101) was filled with 180 μL of the phosphate buffer. The donor plate was then carefully placed above the acceptor plate to form a “sandwich” which was incubated at room temperature for 2 h and 30 min. During the incubation time, compounds diffused from the donor plate through the brain–lipid membrane into the acceptor plate. At the termination point, the donor plate was removed and the concentration of the compounds diffused into the acceptor plate was determined by absorbance measurements in a microplate reader (Thermoscientific, Varioskan). Every sample was analyzed at 2–5 wavelengths in three wells and in two independent experiments. Results are given as the mean ± standard deviation (SD) of the two runs. Commercial drugs, PBS, ethanol and dodecane were purchased from Sigma-Aldrich, Acros Organics and Fluka.
Electron Microscopy (EM) of Lymphoblast Cells
Differentes lymphoblasts from controls and sporadic ALS patients with or without treatment were fixed in a fixative solution containing 4% paraformaldehyde and 2.5% glutaraldehyde in 0.1 M phosphate buffer [pH 7.3] for 4 h at 4 °C and then postfixed for 1 h in a 1:1 solution of 2% aqueous osmium tetroxide and 3% aqueous potassium ferrocyanide. The tissue was dehydrated in a graded series of acetone dilutions and finally embedded in Spurr’s resin. Ultrathin sections (60 nm) were stained with lead citrate and electron micrographs were obtained using a JEOL 1010 electron microscope operated at 80 kV and equipped with a CCD Gatan Erlangshen ES500w camera.
Statistical Analysis
Statistical analyses were performed with Graph Pad Prism 6 (La Jolla, CA, USA). All the statistical data are presented as mean ± standard error of the mean (SEM). Normality was checked with the Shapiro–Wilk test. Parametric tests were therefore used in the statistical analysis. Unless indicated differently, data are representative for three independent experiments. Statistical significance was estimated by Student’s t test or by analysis of variance (ANOVA) followed by the Fisher’s LSD test for multiple comparisons. A value of p < 0.01 was considered significant.
Acknowledgments
We are grateful to the patients, healthy volunteers and clinicians involved in this study for providing samples. We acknowledge support of the publication fee by the CSIC Open Access Publication Support Initiative through its Unit of Information Resources for Research (URICI). The helpful support of María Luisa García Gil from the electronic microscopy CAI of UCM is gratefully acknowledged.
Glossary
Abbreviations
- ADME
absorption, distribution, metabolism and excretion
- ALS
amyotrophic lateral sclerosis
- BBB
Blood-brain barrier
- BLT1
leukotriene B4 receptor 1
- CNS
central nervous system
- ER
endoplasmic reticulum
- HPLC
high-performance liquid chromatography
- HRMS
high-resolution mass spectrometry
- mp
melting point
- MAM
mitochondria-associated ER-membrane
- MERCs
mitochondria-endoplasmic reticulum contacts
- NMR
nuclear magnetic resonance
- OCR
oxygen consumption rate
- PAMPA
parallel artificial membranes permeability assay
- TEM
transmission electron microscopy
- TLC
thin-layer chromatography
Supporting Information Available
The Supporting Information is available free of charge at https://pubs.acs.org/doi/10.1021/acs.jmedchem.4c01368.
Linear correlation and permeability values in the PAMPA assay; cell death quantification for compound 24 using DRAQ7 probe viability; bioenergetic profile of lymphoblasts with and without compound 24 treatment and 1H and 13C NMR spectra, HPLC and HRMS spectrum of compound 24 (PDF)
This research was funded by European Commission Horizon 2020 Framework Programme (Project EU-OPENSCREEN-DRIVE - GA 823893), La Caixa and Luzón Foundation (grant no. HR21-00931), Luzón Foundation (UNZUE project), MCIN/AEI/10.13039/501100011033 (grant no. PID2019-105600RB-I00 to A.M., PID2019-108806RB-I00 to M.J.V., PID2020-115048RB-I00 to M.O., and PID2022-141616OA-I00 to H.F.-R.), Consejo Superior de Investigaciones Cientificas PTI+ Neuroaging (European Union Next Generation EU/PRTR), Spanish Health Institute Carlos III (grant no. CB18/05/00040 to A.M., and CB22/12/00048 to M.J.V.), and Deutsche Forschungsgemeinschaft. (grant CRC1403 to A.-J.G.-S. and CRC1218 advanced postdoctoral grant to H.F.-R.). Finally, A.-J.G.-S. thanks to the European Research Council (ERC) under the European Union’s Horizon 2020 research and innovation program (grant agreement no. 817758); and H.F.-R. acknowledges support by the Ikerbasque Basque Foundation for Science, COFUND, H2020-MSCA-COFUND-2020-101034228-WOLFRAM2, and by ERDF a way of making Europe (ERDF/EU).
The authors declare no competing financial interest.
Supplementary Material
References
- Talbott E. O.; Malek A. M.; Lacomis D.. The epidemiology of amyotrophic lateral sclerosis. In Neuroepidemiology; Rosano C.; Ikram M. A.; Ganguli M., Eds.; Elsevier: Amsterdam, The Netherlands, 2016; Vol. 138, pp 225–238. [DOI] [PubMed] [Google Scholar]
- Ilieva H.; Vullaganti M.; Kwan J. Advances in molecular pathology, diagnosis, and treatment of amyotrophic lateral sclerosis. BMJ. 2023, 383, e075037 10.1136/bmj-2023-075037. [DOI] [PMC free article] [PubMed] [Google Scholar]
- Genin E. C.; Abou-Ali M.; Paquis-Flucklinger V. Mitochondria, a key target in amyotrophic lateral sclerosis pathogenesis. Genes. 2023, 14, 1981. 10.3390/genes14111981. [DOI] [PMC free article] [PubMed] [Google Scholar]
- Godoy-Corchuelo J. M.; Fernández-Beltrán L. C.; Ali Z.; Gil-Moreno M. J.; López-Carbonero J. I.; Guerrero-Sola A.; Larrad-Sainz A.; Matias-Guiu J.; Matias-Guiu J. A.; Cunningham T. J.; Corrochano S. Lipid metabolic alterations in the ALS-FTD spectrum of disorders. Biomedicines. 2022, 10, 1105. 10.3390/biomedicines10051105. [DOI] [PMC free article] [PubMed] [Google Scholar]
- Herrera-Cruz M. S.; Simmen T.. Over six decades of discovery and characterization of the architecture at mitochondria-associated membranes (MAMs). In Organelle Contact Sites: From Molecular Mechanism to Disease; Tagaya M.; Simmen T., Eds.; Springer: Switzerland, 2017; Vol. 997, pp 13–31. [DOI] [PubMed] [Google Scholar]
- Mao H.; Chen W.; Chen L. X.; Li L. F. Potential role of mitochondria-associated endoplasmic reticulum membrane proteins in diseases. Biochem. Pharmacol. 2022, 199, 115011 10.1016/j.bcp.2022.115011. [DOI] [PubMed] [Google Scholar]
- Parakh S.; Atkin J. D. The mitochondrial-associated ER membrane (MAM) compartment and its dysregulation in Amyotrophic Lateral Sclerosis (ALS). Semin. Cell Dev. Biol. 2021, 112, 105–113. 10.1016/j.semcdb.2021.02.002. [DOI] [PubMed] [Google Scholar]
- Bernal A. F.; Mota N.; Pamplona R.; Area-Gomez E.; Portero-Otin M. Hakuna MAM-Tata: Investigating the role of mitochondrial-associated membranes in ALS. Biochim. Biophys. Acta, Mol. Basis Dis. 2023, 1869, 166716 10.1016/j.bbadis.2023.166716. [DOI] [PubMed] [Google Scholar]
- Hertlein V.; Flores-Romero H.; Das K. K.; Fischer S.; Heunemann M.; Calleja-Felipe M.; Knafo S.; Hipp K.; Harter K.; Fitzgerald J. C.; García-Sáez A. J. MERLIN: a novel BRET-based proximity biosensor for studying mitochondria-ER contact sites. Life Sci. Alliance. 2020, 3, e201900600 10.26508/lsa.201900600. [DOI] [PMC free article] [PubMed] [Google Scholar]
- Flores-Romero H.; García-Sáez A. J. MERLIN: A BRET-based proximity biosensor for studying mitochondria-ER contact sites. Methods Mol. Biol. 2022, 2525, 197–205. 10.1007/978-1-0716-2473-9_14. [DOI] [PubMed] [Google Scholar]
- Sigma-Aldrich . https://www.sigmaaldrich.com/ES/es/technical-documents/technical-article/chemistry-and-synthesis/lead-discovery/screening-compounds (accessed June 5, 2024).
- Ginex T.; Madruga E.; Martinez A.; Gil C. MBC and ECBL libraries: outstanding tools for drug discovery. Front. Pharmacol. 2023, 14, 1244317 10.3389/fphar.2023.1244317. [DOI] [PMC free article] [PubMed] [Google Scholar]
- Horvath D.; Lisurek M.; Rupp B.; Kühne R.; Specker E.; von Kries J.; Rognan D.; Andersson C. D.; Almqvist F.; Elofsson M.; Enqvist P. A.; Gustavsson A. L.; Remez N.; Mestres J.; Marcou G.; Varnek A.; Hibert M.; Quintana J.; Frank R. Design of a general-purpose European compound screening library for EU-OPENSCREEN. ChemMedChem. 2014, 9, 2309–2326. 10.1002/cmdc.201402126. [DOI] [PubMed] [Google Scholar]
- Lee D. H.; Goldberg A. L. Proteasome inhibitors: valuable new tools for cell biologists. Trends Cell Biol. 1998, 8, 397–403. 10.1016/S0962-8924(98)01346-4. [DOI] [PubMed] [Google Scholar]
- Wilson E. L.; Metzakopian E. ER-mitochondria contact sites in neurodegeneration: genetic screening approaches to investigate novel disease mechanisms. Cell Death Differ. 2021, 28, 1804–1821. 10.1038/s41418-020-00705-8. [DOI] [PMC free article] [PubMed] [Google Scholar]
- Wang Z.; Ren J. Y.; Du J. X.; Wang H.; Liu J.; Wang G. L. Niclosamide as a promising therapeutic player in human cancer and other diseases. Int. J. Mol. Sci. 2022, 23, 16116. 10.3390/ijms232416116. [DOI] [PMC free article] [PubMed] [Google Scholar]
- Singh S.; Weiss A.; Goodman J.; Fisk M.; Kulkarni S.; Lu I.; Gray J.; Smith R.; Sommer M.; Cheriyan J. Niclosamide-A promising treatment for COVID-19. Br. J. Pharmacol. 2022, 179, 3250–3267. 10.1111/bph.15843. [DOI] [PMC free article] [PubMed] [Google Scholar]
- Apolloni S.; D’Ambrosi N. Repurposing niclosamide for the treatment of neurological disorders. Neural Regen. Res. 2023, 18, 2705–2706. 10.4103/1673-5374.373705. [DOI] [PMC free article] [PubMed] [Google Scholar]
- Kato Y.; Sakamoto K. Niclosamide affects intracellular TDP-43 distribution in motor neurons, activates mitophagy, and attenuates morphological changes under stress. J. Biosci. Bioeng. 2021, 132, 640–650. 10.1016/j.jbiosc.2021.06.015. [DOI] [PubMed] [Google Scholar]
- Dai L. J.; Zou L.; Meng L. X.; Qiang G. F.; Yan M. M.; Zhang Z. T. Cholesterol metabolism in neurodegenerative diseases: molecular mechanisms and therapeutic targets. Mol. Neurobiol. 2021, 58, 2183–2201. 10.1007/s12035-020-02232-6. [DOI] [PubMed] [Google Scholar]
- Fujimoto M.; Hayashi T.; Su T. P. The role of cholesterol in the association of endoplasmic reticulum membranes with mitochondria. Biochem. Biophys. Res. Commun. 2012, 417, 635–639. 10.1016/j.bbrc.2011.12.022. [DOI] [PMC free article] [PubMed] [Google Scholar]
- Stockert J. C.; Horobin R. W.; Colombo L. L.; Blázquez-Castro A. Tetrazolium salts and formazan products in Cell Biology: Viability assessment, fluorescence imaging, and labeling perspectives. Acta Histochem. 2018, 120, 159–167. 10.1016/j.acthis.2018.02.005. [DOI] [PubMed] [Google Scholar]
- Hartmann H.; Ho W. Y.; Chang J. C.; Ling S. C. Cholesterol dyshomeostasis in amyotrophic lateral sclerosis: cause, consequence, or epiphenomenon?. FEBS J. 2022, 289, 7688–7709. 10.1111/febs.16175. [DOI] [PubMed] [Google Scholar]
- Abdel-Khalik J.; Yutuc E.; Crick P. J.; Gustafsson J. A.; Warner M.; Roman G.; Talbot K.; Gray E.; Griffiths W. J.; Turner M. R.; Wang Y. Defective cholesterol metabolism in amyotrophic lateral sclerosis. J. Lipid Res. 2017, 58, 267–278. 10.1194/jlr.P071639. [DOI] [PMC free article] [PubMed] [Google Scholar]
- Stoica R.; De Vos K. J.; Paillusson S.; Mueller S.; Sancho R. M.; Lau K. F.; Vizcay-Barrena G.; Lin W. L.; Xu Y. F.; Lewis J.; Dickson D. W.; Petrucelli L.; Mitchell J. C.; Shaw C. E.; Miller C. C. J. ER-mitochondria associations are regulated by the VAPB-PTPIP51 interaction and are disrupted by ALS/FTD-associated TDP-43. Nat. Commun. 2014, 5, 3996. 10.1038/ncomms4996. [DOI] [PMC free article] [PubMed] [Google Scholar]
- Posa D.; Martínez-González L.; Bartolomé F.; Nagaraj S.; Porras G.; Martínez A.; Martín-Requero A. Recapitulation of pathological TDP-43 features in immortalized lymphocytes from sporadic ALS patients. Mol. Neurobiol. 2019, 56, 2424–2432. 10.1007/s12035-018-1249-8. [DOI] [PubMed] [Google Scholar]
- Lastres-Becker I.; Porras G.; Arribas-Blázquez M.; Maestro I.; Borrego-Hernández D.; Boya P.; Cerdán S.; García-Redondo A.; Martínez A.; Martin-Requero Á. Molecular alterations in sporadic and SOD1-ALS immortalized lymphocytes: Towards a personalized therapy. Int. J. Mol. Sci. 2021, 22, 3007. 10.3390/ijms22063007. [DOI] [PMC free article] [PubMed] [Google Scholar]
- Agrawal I.; Lim Y. S.; Ng S. Y.; Ling S. C. Deciphering lipid dysregulation in ALS: from mechanisms to translational medicine. Transl. Neurodegener. 2022, 11, 48. 10.1186/s40035-022-00322-0. [DOI] [PMC free article] [PubMed] [Google Scholar]
- Raldúa D.; Babin P. J. BLT-1, a specific inhibitor of the HDL receptor SR-BI, induces a copper-dependent phenotype during zebrafish development. Toxicol. Lett. 2007, 175, 1–7. 10.1016/j.toxlet.2007.08.007. [DOI] [PubMed] [Google Scholar]
- Kuda O.; Pietka T. A.; Demianova Z.; Kudova E.; Cvacka J.; Kopecky J.; Abumrad N. A. Sulfo-N-succinimidyl oleate (SSO) inhibits fatty acid uptake and signaling for intracellular calcium via binding CD36 lysine 164. J. Biol. Chem. 2013, 288, 15547–15555. 10.1074/jbc.M113.473298. [DOI] [PMC free article] [PubMed] [Google Scholar]
- Bays H. E.; Neff D.; Tomassini J. E.; Tershakovec A. M. Ezetimibe: Cholesterol lowering and beyond. Expert Rev. Cardiovasc. Ther. 2008, 6, 447–470. 10.1586/14779072.6.4.447. [DOI] [PubMed] [Google Scholar]
- Yu M.; Lau T. Y.; Carr S. A.; Krieger M. Contributions of a disulfide bond and a reduced cysteine side chain to the intrinsic activity of the high-density lipoprotein receptor SR-BI. Biochemistry. 2012, 51, 10044–10055. 10.1021/bi301203x. [DOI] [PMC free article] [PubMed] [Google Scholar]
- Morcillo P.; Kabra K.; Velasco K.; Cordero H.; Jennings S.; Yun T. D.; Larrea D.; Akman H. O.; Schon E. A. Aberrant ER-mitochondria communication is a common pathomechanism in mitochondrial disease. Cell Death Dis. 2024, 15, 405. 10.1038/s41419-024-06781-9. [DOI] [PMC free article] [PubMed] [Google Scholar]
- Area-Gomez E.; de Groof A.; Bonilla E.; Montesinos J.; Tanji K.; Boldogh I.; Pon L.; Schon E. A. A key role for MAM in mediating mitochondrial dysfunction in Alzheimer disease. Cell Death Dis. 2018, 9, 335. 10.1038/s41419-017-0215-0. [DOI] [PMC free article] [PubMed] [Google Scholar]
- Burstein S. R.; Valsecchi F.; Kawamata H.; Bourens M.; Zeng R.; Zuberi A.; Milner T. A.; Cloonan S. M.; Lutz C.; Barrientos A.; Manfredi G. In vitro and in vivo studies of the ALS-FTLD protein CHCHD10 reveal novel mitochondrial topology and protein interactions. Hum. Mol. Genet. 2018, 27, 160–177. 10.1093/hmg/ddx397. [DOI] [PMC free article] [PubMed] [Google Scholar]
- Konrad C.; Kawamata H.; Bredvik K. G.; Arreguin A. J.; Cajamarca S. A.; Hupf J. C.; Ravits J. M.; Miller T. M.; Maragakis N. J.; Hales C. M.; Glass J. D.; Gross S.; Mitsumoto H.; Manfredi G. Fibroblast bioenergetics to classify amyotrophic lateral sclerosis patients. Mol. Neurodegener. 2017, 12, 76. 10.1186/s13024-017-0217-5. [DOI] [PMC free article] [PubMed] [Google Scholar]
- Palamiuc L.; Schlagowski A.; Ngo S. T.; Vernay A.; Dirrig-Grosch S.; Henriques A.; Boutillier A. L.; Zoll J.; Echaniz-Laguna A.; Loeffler J. P.; René F. A metabolic switch toward lipid use in glycolytic muscle is an early pathologic event in a mouse model of amyotrophic lateral sclerosis. EMBO Mol. Med. 2015, 7, 526–546. 10.15252/emmm.201404433. [DOI] [PMC free article] [PubMed] [Google Scholar]
- Lam J.; Katti P.; Biete M.; Mungai M.; AshShareef S.; Neikirk K.; Lopez E. G.; Vue Z.; Christensen T. A.; Beasley H. K.; Rodman T. A.; Murray S. A.; Salisbury J. L.; Glancy B.; Shao J. Q.; Pereira R. O.; Abel E. D.; Hinton A. A universal approach to analyzing transmission electron microscopy with ImageJ. Cells 2021, 10, 2177. 10.3390/cells10092177. [DOI] [PMC free article] [PubMed] [Google Scholar]
- Naon D.; Zaninello M.; Giacomello M.; Varanita T.; Grespi F.; Lakshminaranayan S.; Serafini A.; Semenzato M.; Herkenne S.; Hernández-Alvarez M. I.; Zorzano A.; De Stefani D.; Dorn G. W.; Scorrano L. Critical reappraisal confirms that Mitofusin 2 is an endoplasmic reticulum-mitochondria tether. Proc. Natl. Acad. Sci. U. S. A. 2016, 113, 11249–11254. 10.1073/pnas.1606786113. [DOI] [PMC free article] [PubMed] [Google Scholar]
- Ruffoli R.; Bartalucci A.; Frati A.; Fornai F. Ultrastructural studies of ALS mitochondria connect altered function and permeability with defects of mitophagy and mitochondriogenesis. Front. Cell. Neurosci. 2015, 9, 341. 10.3389/fncel.2015.00341. [DOI] [PMC free article] [PubMed] [Google Scholar]
- Smith E. F.; Shaw P. J.; De Vos K. J. The role of mitochondria in amyotrophic lateral sclerosis. Neurosci. Lett. 2019, 710, 132933. 10.1016/j.neulet.2017.06.052. [DOI] [PubMed] [Google Scholar]
- Schrödinger Release 2021–2: QikProp; Schrödinger, LLC: New York, NY, 2021. [Google Scholar]
- Lal J.; Ramalingam K.; Meena R.; Ansari S. B.; Saxena D.; Chopra S.; Goyal N.; Reddy D. N. Design and synthesis of novel halogen rich salicylanilides as potential antileishmanial agents. Eur. J. Med. Chem. 2023, 246, 114996 10.1016/j.ejmech.2022.114996. [DOI] [PubMed] [Google Scholar]
- Xu X.; Lin S.; Yang C.. Preparation of niclosamide derivative for treating tumor. CN109053480, 2018.
- Engers D. W.; Field J. R.; Le U.; Zhou Y.; Bolinger J. D.; Zamorano R.; Blobaum A. L.; Jones C. K.; Jadhav S.; Weaver C. D.; Conn P. J.; Lindsley C. W.; Niswender C. M.; Hopkins C. R. Discovery, synthesis, and structure-activity relationship development of a series of N-(4-acetamido)phenylpicolinamides as positive allosteric modulators of metabotropic glutamate receptor 4 (mGlu4) with CNS exposure in rats. J. Med. Chem. 2011, 54, 1106–1110. 10.1021/jm101271s. [DOI] [PMC free article] [PubMed] [Google Scholar]
- Yoshino K.; Kohno T.; Uno T.; Morita T.; Tsukamoto G. Organic phosphorus compounds. 1. 4-(Benzothiazol-2-yl) benzylphosphonate as potent calcium antagonistic vasodilator. J. Med. Chem. 1986, 29, 820–825. 10.1021/jm00155a037. [DOI] [PubMed] [Google Scholar]
- Gonec T.; Kos J.; Nevin E.; Govender R.; Pesko M.; Tengler J.; Kushkevych I.; Stastna V.; Oravec M.; Kollar P.; O’Mahony J.; Kralova K.; Coffey A.; Jampilek J. Preparation and biological properties of ring-substituted naphthalene-1-carboxanilides. Molecules. 2014, 19, 10386–10409. 10.3390/molecules190710386. [DOI] [PMC free article] [PubMed] [Google Scholar]
- Chiron R.; Graff Y. Coexistence of intramolecular bonds in ortho-substituted amide esters and amide ketones. Spectrochim. Acta A Mol. Biomol. Spectrosc. 1976, 32, 1303–1310. 10.1016/0584-8539(76)80170-5. [DOI] [Google Scholar]
- Mito S.; Cheng B. X.; Garcia B. A.; Ooi X. Y.; Gonzalez D.; Ruiz T. C.; Elisarraras F. X.; Tsin A. SAR study of niclosamide derivatives for neuroprotective function in SH-SY5Y neuroblastoma. Bioorg. Med. Chem. Lett. 2023, 96, 129498 10.1016/j.bmcl.2023.129498. [DOI] [PubMed] [Google Scholar]
- Lee I. Y.; Gruber T. D.; Samuels A.; Yun M.; Nam B.; Kang M.; Crowley K.; Winterroth B.; Boshoff H. I.; Barry C. E. Structure-activity relationships of antitubercular salicylanilides consistent with disruption of the proton gradient via proton shuttling. Bioorg. Med. Chem. 2013, 21, 114–126. 10.1016/j.bmc.2012.10.056. [DOI] [PMC free article] [PubMed] [Google Scholar]
- Juang Y. P.; Chou Y. T.; Lin R. X.; Ma H. H.; Chao T. L.; Jan J. T.; Chang S. Y.; Liang P. H. Design, synthesis and biological evaluations of niclosamide analogues against SARS-CoV-2. Eur. J. Med. Chem. 2022, 235, 114295 10.1016/j.ejmech.2022.114295. [DOI] [PMC free article] [PubMed] [Google Scholar]
- Li C.; Wu Y.; Tang D.; Wang F.; Chen H.. Preparation of triazine benzimidazolone derivatives for OLED devices. CN110964038, 2020.
- Waisser K.; Perina M.; Klimesová V.; Kaustová J. On the relationship between the structure and antimycobacterial activity of substituted N-benzylsalicylamides. Collect. Czechoslov. Chem. Commun. 2003, 68, 1275–1294. 10.1135/cccc20031275. [DOI] [Google Scholar]
- Kim J.; Kang S.; Hong S.; Yum S.; Kim Y. M.; Jung Y. Structure-activity relationship of salicylic acid derivatives on inhibition of TNF-α dependent NFκB activity: Implication on anti-inflammatory effect of N-(5-chlorosalicyloyl)phenethylamine against experimental colitis. Eur. J. Med. Chem. 2012, 48, 36–44. 10.1016/j.ejmech.2011.11.030. [DOI] [PubMed] [Google Scholar]
- Gstach H.; Chiba P.; Mastalir M.. Amidophenoxypropanolamines. US20150141437, 2015.
- Ibarreta D.; Tao J. M.; Parrilla R.; Ayuso M. S. Mutation analysis of chromosome 19 calmodulin (CALM3) gene in Alzheimer’s disease patients. Neurosci. Lett. 1997, 229, 157–160. 10.1016/S0304-3940(97)00453-9. [DOI] [PubMed] [Google Scholar]
- Brooks B. R.; Miller R. G.; Swash M.; Munsat T. L. El Escorial revisited: Revised criteria for the diagnosis of amyotrophic lateral sclerosis. Amyotroph. Lateral Scler. Other Motor Neuron Disord. 2000, 1, 293–299. 10.1080/146608200300079536. [DOI] [PubMed] [Google Scholar]
- Denizot F.; Lang R. Rapid colorimetric assay for cell-growth and survival. Modifications to the tetrazolium dye procedure giving improved sensitivity and reliability. J. Immunol. Methods. 1986, 89, 271–277. 10.1016/0022-1759(86)90368-6. [DOI] [PubMed] [Google Scholar]
- Flores-Romero H.; Ros U.; Garcia-Saez A. J. Pore formation in regulated cell death. EMBO J. 2020, 39, e105753 10.15252/embj.2020105753. [DOI] [PMC free article] [PubMed] [Google Scholar]
- Flores-Romero H.; Hohorst L.; John M.; Albert M. C.; King L. E.; Beckmann L.; Szabo T.; Hertlein V.; Luo X.; Villunger A.; Frenzel L. P.; Kashkar H.; Garcia-Saez A. J. BCL-2-family protein tBID can act as a BAX-like effector of apoptosis. EMBO J. 2022, 41, e108690 10.15252/embj.2021108690. [DOI] [PMC free article] [PubMed] [Google Scholar]
- Schrödinger Release 2021–2: LigPrep; Schrödinger, LLC: New York, NY, 2021. [Google Scholar]
- Di L.; Kerns E. H.; Fan K.; McConnell O. J.; Carter G. T. High throughput artificial membrane permeability assay for blood-brain barrier. Eur. J. Med. Chem. 2003, 38, 223–232. 10.1016/S0223-5234(03)00012-6. [DOI] [PubMed] [Google Scholar]
Associated Data
This section collects any data citations, data availability statements, or supplementary materials included in this article.