

ABSTRACT
Aim
To evaluate risk indicators for gingival recessions (GRs) in the lower anterior teeth of orthodontic patients post treatment and during a retention period of at least 5 years, compared to non‐treated controls.
Material and Methods
Eighty‐nine orthodontically treated patients who were recession‐free before treatment were recruited. Demographic, cephalometric and occlusal records were retrieved before (T1) and after treatment (T2), and periodontal outcomes were clinically evaluated at least 5 years post retention (T3). Eighty‐eight non‐treated patients served as controls. Recession areas were digitally assessed and compared using t‐test and chi‐square tests, and a multiple linear regression model was built.
Results
In the treated group, recession incidence was 11.24% at T2 and 67.42% at T3, all classified as type 1, class A (−). Among controls, recession prevalence was 15.91%, similar to the incidence at T2, but significantly lower than at T3. GR was most common in canines (1.85 mm2; 95% CI: 2.61–7.70; p < 0.005). Regression analysis identified higher incidence of recessions in female patients and in those with thin phenotype, high angle skeletal pattern, increased final inclination of lower incisors and greater probing depth.
Conclusions
GR incidence after orthodontic treatment was comparable to controls but increased significantly post retention. Several risk indicators may predict GR occurrence.
Keywords: fixed retainer, gingival recession, orthodontic retention, orthodontic treatment, risk indicator
1. Introduction
Gingival recession (GR) is defined as an apical shift of the gingival margin caused by different conditions/pathologies. It is associated with clinical attachment loss. This may apply to all surfaces (buccal/lingual/interproximal) (Jepsen et al. 2018). It can pose an aesthetic concern for the patient and lead to increased dentin sensitivity. Classically, it was defined as the displacement of the soft‐tissue margin apical to the cemento‐enamel junction (CEJ) (Lindhe, Allen, and Maynard 1996).
Prevalence of GR is dependent on age, with its onset typically occurring relatively early (Sarfati et al. 2010). A study involving 10,676 subjects revealed a prevalence of type 1 recessions > 1 mm of 12.4%, with a lower prevalence of 5.8% when considering the anterior area (Romandini et al. 2020). However, studies focusing on patients treated with orthodontics reported a prevalence ranging from 47% to 87% in long‐term follow‐ups (Mijuskovic et al. 2018; Morris et al. 2017).
The aetiology of localized GR is multifactorial, involving both predisposing and precipitating factors (Chatzopoulou and Johal 2015).
Slutzkey and Levin (2008) observed that orthodontically treated young adults (18–22 years) had twice the risk of developing GR compared to untreated individuals. Similarly, Renkema, Fudalej, Renkema, Abbas, et al. (2013) and Renkema, Fudalej, Renkema, Bronkhorst, et al. (2013) reported a significantly higher prevalence of GR among treated patients versus controls after 2 and 5 years. Interestingly, their analysis did not link GR to changes in lower incisor inclination during treatment (Renkema et al. 2014; Renkema, Fudalej, Renkema, Abbas, et al. 2013; Renkema, Fudalej, Renkema, Bronkhorst, et al. 2013).
Most orthodontic patients need a retention phase to stabilize results and prevent relapse, often achieved with fixed retainers (Martin et al. 2023). However, improper use of fixed retainers or neglect during the retention period can result in unwanted incisor inclination changes and adverse effects on soft tissues (Renkema et al. 2014; Renkema, Fudalej, Renkema, Abbas, et al. 2013; Renkema, Fudalej, Renkema, Bronkhorst, et al. 2013), with conflicting findings reported by Juloski, Glisic, and Vandevska‐Radunovic (2017).
Previous studies have often relied on plaster‐cast measurements, assessed only the presence or absence of recessions, were purely retrospective or used external controls.
The study aimed to evaluate potential risk indicators for the development of digitally assessed GR areas in orthodontic patients at least 5 years post treatment with fixed appliances and a fixed lingual retainer.
2. Material and Methods
The present study was designed as an ambipective observational study using both current and retrospective data, reported following the STROBE guidelines (Von Elm et al. 2007). The exposed group included patients with fixed lingual retainers on their lower incisors, treated with fixed orthodontic appliances between 2014 and 2016, with no GR before treatment and who completed their treatment at least 5 years earlier. The non‐exposed group included prospective non‐treated orthodontic patients. Post‐retention visits for treated patients and baseline visits for controls occurred during 2021–2022.
The condition of interest was the presence of GR. All patients were consecutively recruited from the Postgraduate Orthodontic Clinic, Faculty of Dentistry, Complutense University of Madrid (UCM), Spain. Permission was obtained from the Research Ethics Committee of the San Carlos Clinical Hospital (C.P.URI120–C.I.21/720‐E). All patients, or their parents or tutors, signed informed consent forms and agreed to participate in the study.
Patients in the exposed group were consecutively selected among those attending recall visits during the retention phase and meeting the following inclusion criteria: (1) treated with full fixed appliances, (2) lingual retainer bonded from canine to canine (Ortho FlexTech nickel‐free gold), (3) absence of retreatment and (4) complete records of the initial (T1) and post‐treatment (T2) phase. Exclusion criteria were (1) presence of GR in the lower incisors or canines before treatment, (2i) treatment with extractions, (iii) crowding > 6 mm, (4) treatment combined with orthognathic surgery, (5) restorative treatment in anterior‐inferior teeth, (6) periodontitis patients, (7) agenesis, (8) severe skeletal dysplasia (requiring orthognathic surgery for correction) or (9) craniofacial syndromes or malformations.
Patients in the non‐exposed group were consecutively selected if they fulfilled these criteria: (1) untreated orthodontic patients, (2) complete pre‐orthodontic treatment records and (3) presence of a full dentition. They were excluded if they presented (1) restorative treatment in the lower anterior teeth, (2) anticipated treatment with extractions, (3) crowding > 6 mm, (4) periodontitis, (5) agenesis, (6) severe skeletal dysplasia or (7) craniofacial syndromes or malformations.
2.1. Sample Size
The sample size was calculated for a 95% significance level and 80% power, using data from Renkema, Fudalej, Renkema, Abbas, et al. (2013) and Renkema, Fudalej, Renkema, Bronkhorst, et al. (2013), which found higher recession rates in orthodontically treated patients compared to untreated controls (OR 4.48, p < 0.001; 95% CI: 2.61–7.70). The required sample size was 176 patients (88 per group).
2.2. Data Collection
Three timepoints were considered for the exposed group: T1 (before treatment), T2 (end of treatment) and T3 (at least 5 years post treatment, retention phase) (Figure 1). Data collected at T1 and T2 included models, photographs and cephalometric values. At T3 study visit, photographic records, dental models and periodontal measurements were obtained. For the non‐exposed group, similar records were collected during their initial pre‐orthodontic visit, with no follow‐up. For a secondary intra‐group analysis of the non‐exposed group, three age groups were established corresponding to the mean ages of the exposed group at T1, T2 and T3.
FIGURE 1.

Study diagram. T1, before orthodontic treatment; T2, end of orthodontic treatment and T3, at least 5 years after treatment (retention phase). For the non‐exposed group, records were obtained during their pre‐orthodontic visit. Solid background indicates clinical assessment visit.
Study models were scanned using a TRIOS intraoral scanner (3‐Shape, Copenhagen, Denmark). The resulting STL files were imported into Geomagic Control. T1–T2 and T1–T3 digitised images were cropped and initially superimposed using the best‐fit alignment algorithm. Then, manual superimposition was performed on each mandibular anterior teeth (canine to canine), using the lingual surfaces as reference points. This process resulted in six superimpositions per patient, with each tooth serving as the reference, following Tsukiboshi et al. (2023).
Digital quantification of the area of recession (mm2), measured from the CEJ to the gingival margin was performed using the ‘Area Measurement tool’ of the software. The area was delineated by placing points along the unadjusted preformed curves of the gingival margin and the CEJ, adjusted manually (following Dritsas et al. 2023), with each point's location verified against the corresponding photographs. To make linear measurements, cross‐sections were made at the mid‐facial point of each tooth being analysed. Recession depth (RD) and width (RW) (mm) were measured vertically and horizontally at the deepest and widest points of the recession (Figure 2).
FIGURE 2.
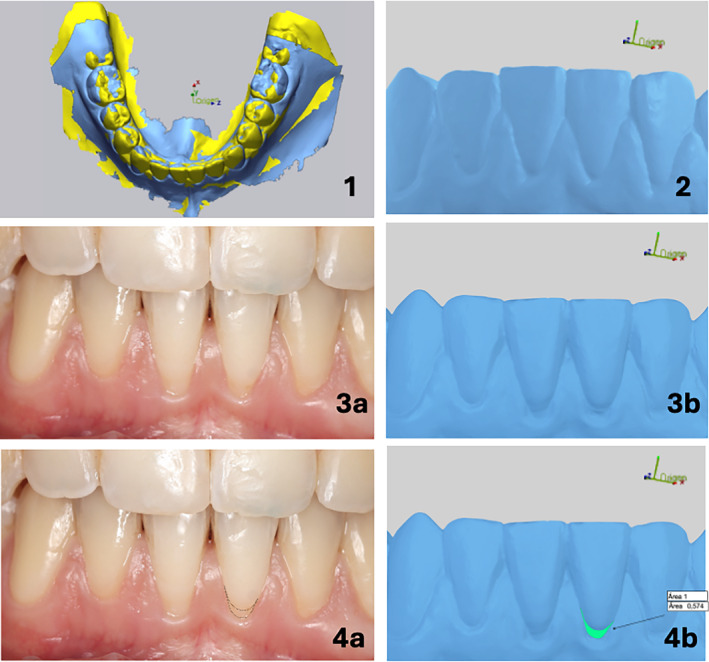
Example of recession area delimitation in the digital dental cast, verified against the corresponding clinical photograph. 1. Superimposition of the initial and final model in the Geomagic control program. 2. Image of the initial digital dental cast. 3a. Post‐retention clinical photograph showing recession of the lower incisors. 3b. Corresponding post‐retention digital dental cast showing recession of the lower incisors. 4a. Delimitation of the recession area (black dots) on the left central incisor. 4b. Calculation of the recession area on the digital dental cast of the left central incisor.
Demographic, cephalometric and occlusal variables were retrieved from the records at T1 and T2 for the exposed group and at the pre‐orthodontic visit for the non‐exposed group. Digital cephalometric images were traced with Dolphin Imaging Version 12 Software, (Chatsworth, California, USA), including ANB angle (degrees), facial convexity (mm), Wits appraisal (mm), mandibular plane angle (degrees), XY axis angle (degrees), inclination (degrees) and position (mm) (initial and final) of the lower incisor according to Ricketts, Steiner and Tweed. Occlusal measurements were performed using the Orthoanalyzer 1.7 analytical software (3Shape, Copenhagen, Denmark): arch length–tooth size discrepancy (DOD) (mm), molar and canine angle class, overbite (mm) and overjet (mm). The periodontal variables collected at the study visit (T3), in the exposed and non‐exposed groups, included periodontal phenotype, probing depth (PD), plaque index (PI) and gingival index (GI). To measure the gingival thickness, we clinically assessed the visibility of a periodontal probe (CPU 15 UNC, Hu‐Friedy) inserted 1 mm deep into the gingival sulcus. Based on the translucency of the periodontal probe and considering that gingiva in the lower incisors becomes non‐transparent at a thickness of approximately 0.8 mm (Kloukos et al. 2022), we classified the gingival phenotype as thin (aproximately < 1 mm) or thick (> 1 mm) (Fischer et al. 2021). The same periodontal probe was use to record probing depths (PD) (mm), PI (Turesky 1970) and GI (Lobene 1986).
The total number of recessions relative to the six mandibular anterior teeth was calculated as a discrete outcome. All measurements were performed by a single calibrated examiner (B.C.).
2.3. Statistical Analysis
To evaluate measurement error using the intraclass correlation coefficient (ICC), a random subsample of 30 casts was selected and areas were measured twice. Additionally, 20 cephalometric tracings were repeated twice, and ICC was also calculated.
Categorical variables were compared using the chi‐square test. After assessing the normal distribution (Shapiro–Wilk test), quantitative variables were compared using Student's t‐test (p‐value ≤ 0.05).
A multiple linear regression model (stepwise) was constructed to identify predictors for the number of recessions present at T3. The considered outcomes to be included in the model were age at T3, treatment duration, Wit's value, mandibular plane angle, gender, periodontal phenotype, PI, GI, PD, final inclination and position of lower incisors, changes in their position and inclination and DOD.
3. Results
3.1. Method Error
Repeated measurements of recession areas from 30 teeth (five from each of the six lower anterior teeth) showed an ICC for intra‐examiner agreement ranging from 0.919 to 0.887, indicating high reproducibility. The ICC values for the repeated measures of the 20 cephalometric tracings ranged from 0.983 to 0.952, indicating very high reproducibility.
3.2. Sample
A sample of 177 patients was analysed, comprising 89 patients in the exposed group with a mean treatment duration of 2.24 years (y) (SD = 7.14) and a mean retention period of 5.54 years (SD = 3.23), and 88 patients in the non‐exposed group. The gender distribution was similar in both exposed (males: 31; females: 58) and non‐exposed groups (males: 37; females: 51) (p = 0.221). Additionally, the mean age was 11.92 years for the exposed group before treatment (T1), 14.26–15.14 years immediately after treatment (T2) and 19.37–20.18 years at least 5 years post retention (T3). The mean age of the non‐exposed group was 14.60 years, comparable to the exposed group at T2 (p = 0.451). (Appendices S1 and S2). Comparisons of occlusal, cephalometric and periodontal outcomes between the exposed and non‐exposed groups at T1 are presented in Table 1. Both groups exhibited similar occlusal and cephalometric features, except for the XY axis, which was slightly lower in the non‐treated group, indicating a more vertical growth pattern in the latter. Patients in both groups presented a slight skeletal class II. The mean PI was significantly lower in the non‐exposed group (0.75; SD = 0.57) than in the exposed patients (1.06; SD = 0.84) at T1, but clinically insignificant.
TABLE 1.
Comparison of occlusal, cephalometric and periodontal outcomes between the exposed (treated group) at T1 and non‐exposed (non‐treated) groups.
| Exposed | Non‐exposed | ||||
|---|---|---|---|---|---|
| Mean | SD | Mean | SD | p | |
| DOD (mm) | −2.89 | 2.39 | −2.56 | 3.10 | 0.431 a |
| Overjet (mm) | 3.40 | 1.59 | 3.62 | 1.68 | 0.367 a |
| Overbite (mm) | 2.93 | 1.35 | 2.98 | 1.45 | 0.807 a |
| ANB (degrees) | 3.23 | 1.49 | 3.35 | 1.26 | 0.55 a |
| Facial convexity (mm) | 2.39 | 2.24 | 2.77 | 2.01 | 0.22 a |
| Wits (mm) | −0.51 | 1.47 | −0.14 | 1.48 | 0.10 a |
| Mandibular plane (degrees) | 23.42 | 5.95 | 23.90 | 9.4 | 0.67 a |
| XY axis (degrees) | 69.73 | 3.56 | 68.73 | 3.52 | 0.05 a , * |
| Initial inclination lower inc. Steiner (degrees) | 24.29 | 5.29 | 25.98 | 6.52 | 0.057 a |
| Initial position lower inc. Steiner (mm) | 4.84 | 2.08 | 5.21 | 2.62 | 0.305 a |
| Initial inclination lower inc. Ricketts (degrees) | 23.03 | 5.01 | 23.52 | 6.00 | 0.556 a |
| Initial position lower inc. Ricketts (mm) | 1.37 | 2.58 | 2.01 | 2.75 | 0.114 a |
| Initial inclination Tweed (degrees) | 92.15 | 13.52 | 94.07 | 11.85 | 0.308 a |
| Biotype | 0.360 b | ||||
| Thin | 21.2% | 16.3% | |||
| Thick | 31% | 31.5% | |||
| PI | 1.05 | 0.84 | 0.75 | 0.57 | 0.005 a , ** |
| GI | 0.50 | 0.54 | 0.50 | 0.45 | 0.919 a |
| PD (mm) | 2.07 | 0.44 | 2.19 | 0.45 | 0.070 a |
Abbreviations: DOD, dental osseus discrepancy; GI, gingival index; inc, incisor; PD, probing pocket depth; PI, plaque index; SD, standard deviation.
p‐value obtained through t‐test.
p‐value obtained through chi‐square test.
p‐value ≤ 0.05.
p‐value ≤ 0.005.
3.3. Recession Analysis
As shown in Table 2, among the 88 participants in the non‐treated group, only 14 (15.91%) showed recession while 74 (84.09%) did not during the initial clinical visit. This group was not followed up. Therefore, presence of GR is reported as prevalences. Segmenting the sample by the mean age of treated patients at each time point showed a progressively higher, but non‐significant, prevalence of recessions: 13.51%, 17.14% and 18.75%, respectively (Appendix S2).
TABLE 2.
Comparison of recession incidence between the treated (exposed) group across three study periods and the prevalence in the control (non‐exposed) group.
| Exposed | Non‐exposed | |||
|---|---|---|---|---|
| T1 | T2 | T3 | ||
| No rec (n) | 89 | 79 | 29 | 74 |
| Rec (n) | 0 | 10 | 60 | 14 |
| Total (n) | 89 | 89 | 89 | 88 |
| No rec (%) | 100 | 88.76 | 32.58 | 84.09 |
| Rec (%) | 0 | 11.24 | 67.42 | 15.91 |
| p‐value exp. vs. non‐exp. | — | 0.491 | < 0.001 | |
Note: p‐values refer to the comparison between the exposed group at T2 and T3 and the total sample of the non‐exposed group, respectively.
Abbreviations: exp., exposed group; n, sample size; no rec, no recession; non‐exp., non‐exposed group; rec, recession; T1, start of treatment; T2, end of the treatment; T3, 5 years after the end of the treatment.
In the exposed group at T1, none of the 89 patients had recession, as per the eligibility criteria. At T2, 10 patients (11.24%) developed recession, similar to the prevalence in non‐treated patients (p = 0.491). Five years post treatment (T3), the incidence of GR significantly increased to 67.42% (60 patients), significantly higher than the prevalence in the non‐treated group (p < 0.001) with only 29 patients (32.58%) remaining recession‐free. The incidence of recession progressively increased, particularly during the retention period.
Table 3 presents the areas of recession per tooth. No areas of recession were detected at T1, as mentioned before. At T2, the highest values of increased recession were found for the lower canines (left canine mean: 0.61 mm2, SD: 0.18 mm2, p < 0.05; right canine mean: 0.78 mm2, SD: 0.18 mm2, p < 0.05). At T3, a progressive increase in the area of recession was noted for all teeth, with the highest values observed in the left canine (mean: 1.85 mm2, SD:0.22 mm2, p < 0.05). All recessions found were classified as type 1, class A (−), demonstrating no loss of interproximal attachment, detectable cementoenamel junction or absence of cervical step (Pini‐Prato et al. 2010).
TABLE 3.
Comparisons of mean recession area of each affected tooth, measured in mm2, across the three study periods in the treated group, along with the percentage of teeth affected by recession relative to all included teeth.
| Tooth | mm2 T1 | mm2 T2 | mm2 T3 | p | T1 | T2 | T3 | |||
|---|---|---|---|---|---|---|---|---|---|---|
| Mean | SD | Mean | SD | Mean | SD | |||||
| 43 | 0 | 0 | 0.78 | 0.18 | 0.2 | 0.26 | 0.001** | 0 | 36.5% | 66.7% |
| 42 | 0 | 0 | 0.04 | 0.04 | 0.15 | 0.08 | 0.27 | 0 | 6.3% | 15.9% |
| 41 | 0 | 0 | 0.06 | 0.05 | 0.26 | 0.11 | 0.10 | 0 | 9.5% | 27% |
| 31 | 0 | 0 | 0.1 | 0.05 | 0.6 | 0.14 | 0.001** | 0 | 15.9% | 28.6% |
| 32 | 0 | 0 | 0.08 | 0.04 | 0.25 | 0.07 | 0.002** | 0 | 3.2% | 14.3% |
| 33 | 0 | 0 | 0.61 | 0.18 | 1.85 | 0.22 | 0.004** | 0 | 39.7% | 76.2% |
Note: p‐value refers to the comparison across three study periods.
Abbreviations: 31, left mandibular central incisor; 32, left mandibular lateral incisor; 33, left mandibular canine; 41, right mandibular central incisor; 42, right mandibular lateral incisor; 43, right mandibular canine; SD, standard deviation; T1, before orthodontic treatment; T2, after orthodontic treatment; T3, retention period.
p‐value ≤ 0.005.
Appendix S3 presents the depth and width dimensions (mm) of the recessions in both the exposed (at T1, T2 and T3) and non‐exposed groups. In the non‐exposed group, the deepest recessions were observed in teeth 33 (mean: 0.19 mm, SD = 0.45) and 43 (mean: 0.19 mm, SD = 0.17). In the exposed group, no recessions were observed at T1 (inclusion criterion). At T2, mean recession depths were not significantly different between groups for teeth 32, 42 and 43. However, for the remaining teeth, the GR depth was significantly greater in the exposed group. At T3, the treated group showed significantly larger recession dimensions in all teeth compared to a group of untreated pre‐orthodontic patients. The deepest recessions were observed at teeth 33 (mean: 0.89 mm, SD = 0.99) and 43 (mean: 0.72 mm, SD = 0.93) in the treated group at T3. It is noteworthy that the average values of width and depth of the recessions found were < 1 mm in most cases, with values > 1 mm detected in only a few isolated cases.
Figure 3 illustrates the increasing incidence of recessions in the exposed group over time, from T1 to T2, but more notably from T2 to T3. At T2, recessions were present in 7.9% and 6.3% of the lower right and left canines, respectively, and in 1.6% of the lower left incisors. At T3, 67.42% of the patients showed at least one tooth with recession (Table 2). The distribution of recessions per tooth revealed a higher incidence in canines (52.38% for the left and 46.03% for the right canine, respectively), followed by central incisors (30.15% and 28.57%) and lateral incisors (28.57% and 27%). Intra‐group comparisons (Cochran's Q test) indicated significant changes for all teeth (p < 0.001).
FIGURE 3.

Bar diagram illustrating the analysis of recessions for each tooth individually and their progressive increase across the three study periods. T1, before orthodontic treatment; T2, end of orthodontic treatment and T3, at least 5 years after treatment (retention phase). 33, left mandibular canine; 32, left mandibular lateral incisor; 31, left mandibular central incisor; 41, right mandibular central incisor; 42, right mandibular lateral incisor; 43, right mandibular canine.
Appendices 1 and 2 display the bivariate comparisons of various outcomes between subjects with and without recession in the non‐exposed and exposed groups, respectively.
The multiple regression model included 89 patients from the exposed group who were followed until the end of the study. Table 4 presents the final model for the dependent variable, namely the ‘total number of recessions at T3’, and its predictors, and their respective regression coefficients. The model's explanatory power was low, with an R 2 value of 0.352. Maximum and minimum residuals were 3.212 and 3.632, respectively. The model revealed fewer recessions in males (reference value for gender was women), and a higher incidence in patients with a thin phenotype (reference value was thick phenotype), high angle skeletal pattern, increased final inclination of lower incisors and increased PD.
TABLE 4.
Multiple linear regression model, including the 89 patients from the exposed group who were followed until the end of the study.
| Dependent variables | R 2 | Significant predictors | Unstandardized coefficient | SD error | Standardized coefficient | p |
|---|---|---|---|---|---|---|
| Total number of GR | 0.352 | Gender | −1.536 | 0.328 | −0.450 | < 0.001** |
| Mandibular plane Angle | 0.092 | 0.026 | 0.340 | 0.001** | ||
| PD | 0.857 | 0.327 | 0.243 | 0.01** | ||
| Gingival biotype | 0.815 | 0.320 | 0.254 | 0.013* | ||
| Final inclination lower incisor Steiner | 0.060 | 0.026 | 0.222 | 0.023* |
Note: The total number of recessions at T3 was the selected dependent variable. p‐value ANOVA < 0001. Minimum residue = −3.632. Maximum residue = 3.212.
Abbreviations: GR, gingival recession; SD, standard deviation.
p‐value ≤ 0.05.
p‐value < 0.005.
4. Discussion
This article represents one of the first studies analysing GR following orthodontic treatment using digital measurement techniques to quantify recession areas.
The results of the study indicate that orthodontic treatment may act as contributing factor for the development of GR, which increased 5 years after treatment, during the retention phase. These findings align with prior research demonstrating greater alveolar bone loss (Renkema et al. 2011) and larger GR among orthodontically treated patients compared to untreated individuals (Katsaros, Livas, and Renkema 2007; Renkema, Fudalej, Renkema, Abbas, et al. 2013; Renkema, Fudalej, Renkema, Bronkhorst, et al. 2013).
Additionally, an exhaustive examination of digital models was conducted. This approach sets the present study apart from similar ones which often focused solely on plaster‐model analysis, thereby sacrificing precision in the assessment of soft tissues (Juloski, Glisic, and Vandevska‐Radunovic 2017; Katsaros, Livas, and Renkema 2007; Renkema et al. 2014; Renkema, Fudalej, Renkema, Abbas, et al. 2013; Renkema, Fudalej, Renkema, Bronkhorst, et al. 2013; Øgaard 1988). Recession area measurements were performed using Geomagic software according to Schneider et al.'s (2014) guidelines. Recent studies have concluded that digital evaluation improves measurement accuracy, maintains compatibility with previous studies and introduces new evaluation possibilities (Kuralt, Kučič, and Fidler 2022; Tsukiboshi et al. 2023; Dritsas et al. 2023).
This study used a large sample size of 177 patients. Although some studies had larger samples, they relied only on plaster models and binary assessment of GR categorized as present or absent, unlike our study. Nonetheless, the results align with those of others on the significant increase in recessions with time (Al‐Moghrabi et al. 2018; Joss‐Vassalli et al. 2010; Pandis et al. 2007; Renkema, Fudalej, Renkema, Abbas, et al. 2013; Renkema, Fudalej, Renkema, Bronkhorst, et al. 2013; Schütz‐Fransson et al. 2019; Juloski, Glisic, and Vandevska‐Radunovic 2017).
Considering the recessions found at the baseline, we agree with Petsos et al. (2024), with values similar to ours of recessions depths in the treated group and with lingual fixed retainer, although their follow‐up was only 1 year. Regarding the prevalence of GR in the non‐exposed group, the present data aligns with those of Renkema, Fudalej, Renkema, Abbas, et al. (2013) and Renkema, Fudalej, Renkema, Bronkhorst, et al. (2013), showing a progressive increase in GR occurrence with advancing age, although our results did not reach statistical significance. However, the present study revealed higher percentages of recession in the treated group and lower values in the non‐treated group, potentially attributable to meticulous digital measurements where even a 0.1 mm discrepancy was considered as a recession.
The teeth that showed more GR prevalence were the canines. This finding partially aligns with the observations by Katsaros, Livas, and Renkema (2007) and Juloski, Glisic, and Vandevska‐Radunovic (2017), who noted that in their treated group the left central incisor was the most affected tooth in patients with retention, whereas in the group without retention the most affected tooth was the canine. This contrasts with the findings of Renkema, Fudalej, Renkema, Abbas, et al. (2013) and Renkema, Fudalej, Renkema, Bronkhorst, et al. (2013), who reported mandibular incisors to be more susceptible to the development of GR.
Our regression model included several variables, such as sex, lower incisor final inclination, facial pattern, PD and gingival phenotype. Renkema, Fudalej, Renkema, Abbas, et al. (2013) and Renkema, Fudalej, Renkema, Bronkhorst, et al. (2013) initially used age alone in their model, later adding age, sex and incisor inclination, which had no significant impact on clinical crown height changes of lower incisors (Renkema et al. 2014).
Unlike our findings, which indicated that the female gender was the most affected, we did not find any articles with similar methodology that reported this association (Pandis et al. 2007; Al‐Moghrabi et al. 2018; Juloski, Glisic, and Vandevska‐Radunovic 2017; Renkema et al. 2014; Rody et al. 2016).
A few studies have investigated the relationship between occlusal variables such as crowding and the appearance of recessions. The present data agree with those of Al‐Moghrabi et al. (2018) and Schütz‐Fransson et al. (2019) in their model studies, which found no statistically significant occlusal variables associated with the presence of GR.
Regarding the cephalometric results, the present study did not find significant differences related to recession in the change of inclinations of the lower incisors. However, the final inclination of the lower incisor was a significant predictor in the regression model. Renkema et al. (2014) observed an increase in the clinical crown in the incisors of 0.75–0.83 mm after treatment but did not find significant differences between the proclined teeth group and the non‐proclined group (p = 0.273). Other authors, such as Morris et al. (2017), Ruf, Hansen, and Pancherz (1998) and Aziz and Flores‐Mir (2011), concluded that the change in inclination of lower incisors did not affect development of GR. However, the studies by Pernet et al. (2019) and Yared, Zenobio, and Pacheco (2006) seem to show that excessive proclination of the lower incisors was directly related to GR. Differences in the impact of the lower incisors' pro‐inclination on GR prevalence between studies may be explained by the degree of inclination and the assessment method.
Regarding facial pattern, regression analysis revealed that for each degree of vertical growth, there was an increase in GR. These findings align with the observations of Salti et al. (2017), who associated a greater occurrence of recession in individuals with long, narrow faces. The direction of mandibular growth has been related to symphyseal morphology (Aki et al. 1994). A posterior mandibular growth direction (vertical growth) has been associated with increased height, decreased depth and reduced symphyseal width. With controversy in the literature (Aziz and Flores‐Mir 2011), this is a direction for future studies to explore.
Among all periodontal variables examined, PD was the only periodontal variable statistically significant in both groups, with higher values observed in patients with GR compared to those without GR (p = 0.036). These findings are in agreement with the 9‐year follow‐up results of the Pandis et al. (2007), in which PD played a pivotal role in the occurrence of GBR (p < 0.005). In the present study, no differences in PI were observed, contrary to the findings of Pandis et al. (2007) and Aziz and Flores‐Mir (2011).
We observed significant differences in periodontal phenotype (treated group) (p = 0.026), with more recessions in the thin phenotype group, consistent with previous studies (Claffey and Shanley 1986; Kloukos et al. 2014; Renkema, Fudalej, Renkema, Abbas, et al. 2013 and Renkema, Fudalej, Renkema, Bronkhorst, et al. 2013) and reviews (Cadenas de Llano‐Pérula et al. 2023). Rasperini et al. (2015) similarly noted that a thin periodontal phenotype causes a reduction in keratinized tissue width (KTW) and increases GR risk.
A limitation of this study was the lack of follow‐up for the non‐exposed group and the reliance on existing records for data at T1 and T2 for the exposed group. This may introduce potential biases and limit the ability to establish causality. For that reason, we used the term ‘risk indicator’ instead of ‘risk factor’. A strength of our study was the use of a multiple regression model, which helped us to control for confounding factors and reduce bias.
Future cohort studies with prospective analysis of recessions from baseline to long‐term are needed. Additionally, future studies should investigate different orthodontic appliances, such as aligners, and different types of retainers, such as removable clear plastic retainers, and their association with the occurrence of recessions.
5. Conclusions
The present study suggests that orthodontic treatment and fixed lingual retainers may increase the chances of minor GR development. Increased incidence was observed not at the end of the treatment but 5 years after the retention phase using lingual fixed retainers.
The factors sex, mandibular plane angle, final inclination of the lower incisor, periodontal phenotype and increased probing depth were postulated as indicators of increased risk for the development of GR.
Author Contributions
B.C. performed clinical measurements, revised the patients and extracted the data and wrote the manuscript. J.S.‐E. was a major contributor to the study design and supervision of the manuscript. C.V. extracted the data and was a major contributor to the study design. R.‐M.Y.‐V. was a major contributor to supervising the patients and the manuscript. C.M. designed the study, interpreted the results and wrote the manuscript.
Conflicts of Interest
The authors declare no conflicts of interest.
Supporting information
Data S1. Appendix.
Acknowledgements
The authors would like to extend their gratitude to the Spanish Society of Orthodontics (SEDO) for partially funding this study, and to the Department of Dental Clinical Specialties at Complutense University of Madrid, Spain, for hosting the clinical part of this study. Additionally, we thank 3D Systems (SC, USA) for providing complimentary access to the Geomagic Control software for a limited time.
Funding: This work was supported by the Spanish Society of Orthodontics (SEDO) through a research grant awarded to Dr. B Celis; BIOCRAN (Craniofacial Biology: Orthodontics and Dentofacial Orthopedics) Research Group, Complutense University of Madrid, Spain.
Data Availability Statement
The data that support the findings of this study are available on request from the corresponding author. The data are not publicly available due to privacy or ethical restrictions.
References
- Aki, T. , Nanda R. S., Currier G. F., and Nanda S. K.. 1994. “Assessment of Symphysis Morphology as a Predictor of the Direction of Mandibular Growth.” American Journal of Orthodontics and Dentofacial Orthopedics 106, no. 1: 60–69. [DOI] [PubMed] [Google Scholar]
- Al‐Moghrabi, D. , Johal A., O'Rourke N., et al. 2018. “Effects of Fixed vs Removable Orthodontic Retainers on Stability and Periodontal Health: 4‐Year Follow‐Up of a Randomized Controlled Trial.” American Journal of Orthodontics and Dentofacial Orthopedics 154, no. 2: 167. 10.1016/j.ajodo.2018.01.007. [DOI] [PubMed] [Google Scholar]
- Aziz, T. , and Flores‐Mir C.. 2011. “A Systematic Review of the Association Between Appliance‐Induced Labial Movement of Mandibular Incisors and Gingival Recession.” Australasian Orthodontic Journal 27, no. 1: 33–39. [PubMed] [Google Scholar]
- Cadenas de Llano‐Pérula, M. , Castro A. B., Danneels M., Schelfhout A., Teughels W., and Willems G.. 2023. “Risk Factors for Gingival Recessions After Orthodontic Treatment: A Systematic Review.” European Journal of Orthodontics 45, no. 5: 528–544. [DOI] [PubMed] [Google Scholar]
- Chatzopoulou, D. , and Johal A.. 2015. “Management of Gingival Recession in the Orthodontic Patient.” Seminars in Orthodontics 21: 15–26. [Google Scholar]
- Claffey, N. , and Shanley D.. 1986. “Relationship of Gingival Thickness and Bleeding to Loss of Probing Attachment in Shallow Sites Following Nonsurgical Periodontal Therapy.” Journal of Clinical Periodontology 13, no. 7: 654–657. [DOI] [PubMed] [Google Scholar]
- Dritsas, K. , Halazonetis D., Ghamri M., Sculean A., Katsaros C., and Gkantidis N.. 2023. “Accurate Gingival Recession Quantification Using 3D Digital Dental Models.” Clinical Oral Investigations 27, no. 4: 1697–1705. [DOI] [PMC free article] [PubMed] [Google Scholar]
- Fischer, K. R. , Büchel J., Testori T., Rasperini G., Attin T., and Schmidlin P.. 2021. “Gingival Phenotype Assessment Methods and Classifications Revisited: A Preclinical Study.” Clinical Oral Investigations 25: 5513–5518. [DOI] [PMC free article] [PubMed] [Google Scholar]
- Jepsen, S. , Caton J. G., Albandar J. M., et al. 2018. “Periodontal Manifestations of Systemic Diseases and Developmental and Acquired Conditions: Consensus Report of Workgroup 3 of the 2017 World Workshop on the Classification of Periodontal and Peri‐Implant Diseases and Conditions.” Journal of Clinical Periodontology 45: S219–S229. 10.1111/jcpe.12951. [DOI] [PubMed] [Google Scholar]
- Joss‐Vassalli, I. , Grebenstein C., Topouzelis N., Sculean A., and Katsaros C.. 2010. “Orthodontic Therapy and Gingival Recession: A Systematic Review.” Orthodontics & Craniofacial Research 13, no. 3: 127–141. [DOI] [PubMed] [Google Scholar]
- Juloski, J. , Glisic B., and Vandevska‐Radunovic V.. 2017. “Long‐Term Influence of Fixed Lingual Retainers on the Development of Gingival Recession: A Retrospective, Longitudinal Cohort Study.” Angle Orthodontist 87, no. 5: 658–664. [DOI] [PMC free article] [PubMed] [Google Scholar]
- Katsaros, C. , Livas C., and Renkema A.‐M.. 2007. “Unexpected Complications of Bonded Mandibular Lingual Retainers.” American Journal of Orthodontics and Dentofacial Orthopedics 132, no. 6: 838–841. [DOI] [PubMed] [Google Scholar]
- Kloukos, D. , Eliades T., Sculean A., and Katsaros C.. 2014. “Indication and Timing of Soft Tissue Augmentation at Maxillary and Mandibular Incisors in Orthodontic Patients. A Systematic Review.” European Journal of Orthodontics 36, no. 4: 442–449. [DOI] [PubMed] [Google Scholar]
- Kloukos, D. , Kalimeri E., Koukos G., Stähli A., Sculean A., and Katsaros C.. 2022. “Gingival Thickness Threshold and Probe Visibility Through Soft Tissue: A Cross‐Sectional Study.” Clinical Oral Investigations 26, no. 8: 5155–5161. 10.1007/s00784-022-04483-0. [DOI] [PMC free article] [PubMed] [Google Scholar]
- Kuralt, M. , Kučič A. C., and Fidler A.. 2022. “Evaluation of Gingival Recessions With Conventional Versus Digital Methods.” Journal of Dentistry 120: 104093. [DOI] [PubMed] [Google Scholar]
- Lindhe, J. , Allen E., and Maynard G.. 1996. “Consensus Report. Mucogingival Therapy.” Annals of Periodontology 1, no. 1: 702–706. [DOI] [PubMed] [Google Scholar]
- Lobene, R. 1986. “A Modified Gingival Index for Use in Clinical Trials.” Clinical Preventive Dentistry 8: 3–6. [PubMed] [Google Scholar]
- Martin, C. , Littlewood S. J., Millett D. T., et al. 2023. “Retention Procedures for Stabilising Tooth Position After Treatment With Orthodontic Braces.” Cochrane Database of Systematic Reviews 5, no. 5: CD002283. [DOI] [PMC free article] [PubMed] [Google Scholar]
- Mijuskovic, M. , Gebistorf M. C., Pandis N., Renkema A. M., and Fudalej P. S.. 2018. “Tooth Wear and Gingival Recession in 210 Orthodontically Treated Patients: A Retrospective Cohort Study.” European Journal of Orthodontics 40, no. 4: 444–450. [DOI] [PubMed] [Google Scholar]
- Morris, J. W. , Campbell P. M., Tadlock L. P., Boley J., and Buschang P. H.. 2017. “Prevalence of Gingival Recession After Orthodontic Tooth Movements.” American Journal of Orthodontics and Dentofacial Orthopedics 151, no. 5: 851–859. [DOI] [PubMed] [Google Scholar]
- Øgaard, B. 1988. “Marginal Bone Support and Tooth Lengths in 19‐Year‐Olds Following Orthodontic Treatment.” European Journal of Orthodontics 10, no. 3: 180–186. [DOI] [PubMed] [Google Scholar]
- Pandis, N. , Vlahopoulos K., Madianos P., and Eliades T.. 2007. “Long‐Term Periodontal Status of Patients With Mandibular Lingual Fixed Retention.” European Journal of Orthodontics 29, no. 5: 471–476. [DOI] [PubMed] [Google Scholar]
- Pernet, F. , Vento C., Pandis N., and Kiliaridis S.. 2019. “Long‐Term Evaluation of Lower Incisors Gingival Recessions After Orthodontic Treatment.” European Journal of Orthodontics 41, no. 6: 559–564. [DOI] [PubMed] [Google Scholar]
- Petsos, H. , Usherenko R., Dahmer I., Eickholz P., Kopp S., and Sayahpour B.. 2024. “Influence of Fixed Orthodontic Steel Retainers on Gingival Health and Recessions of Mandibular Anterior Teeth in an Intact Periodontium‐a Randomized, Clinical Controlled Trial.” BMC Oral Health 24, no. 1: 1–11. [DOI] [PMC free article] [PubMed] [Google Scholar]
- Pini‐Prato, G. , Franceschi D., Cairo F., Nieri M., and Rotundo R.. 2010. “Classification of Dental Surface Defects in Areas of Gingival Recession.” Journal of Periodontology 81, no. 6: 885–890. [DOI] [PubMed] [Google Scholar]
- Rasperini, G. , Acunzo R., Cannalire P., and Farronato G.. 2015. “Influence of Periodontal Biotype on Root Surface Exposure During Orthodontic Treatment: A Preliminary Study.” International Journal of Periodontics and Restorative Dentistry 35, no. 5: 665–675. 10.11607/prd.2239. [DOI] [PubMed] [Google Scholar]
- Renkema, A. M. , Fudalej P. S., Renkema A., Bronkhorst E., and Katsaros C.. 2013. “Gingival Recessions and the Change of Inclination of Mandibular Incisors During Orthodontic Treatment.” European Journal of Orthodontics 35, no. 2: 249–255. [DOI] [PubMed] [Google Scholar]
- Renkema, A. M. , Fudalej P. S., Renkema A. A., Abbas F., Bronkhorst E., and Katsaros C.. 2013. “Gingival Labial Recessions in Orthodontically Treated and Untreated Individuals: A Case–Control Study.” Journal of Clinical Periodontology 40, no. 6: 631–637. [DOI] [PubMed] [Google Scholar]
- Renkema, A.‐M. , Navratilova Z., Mazurova K., Katsaros C., and Fudalej P. S.. 2014. “Gingival Labial Recessions and the Post‐Treatment Proclination of Mandibular Incisors.” European Journal of Orthodontics 37, no. 5: 508–513. [DOI] [PubMed] [Google Scholar]
- Renkema, A.‐M. , Renkema A., Bronkhorst E., and Katsaros C.. 2011. “Long‐Term Effectiveness of Canine‐To‐Canine Bonded Flexible Spiral Wire Lingual Retainers.” American Journal of Orthodontics and Dentofacial Orthopedics 139, no. 5: 614–621. [DOI] [PubMed] [Google Scholar]
- Rody, W., Jr. , Elmaraghy S., McNeight A., et al. 2016. “Effects of Different Orthodontic Retention Protocols on the Periodontal Health of Mandibular Incisors.” Orthodontics & Craniofacial Research 19, no. 4: 198–208. [DOI] [PubMed] [Google Scholar]
- Romandini, M. , Soldini M. C., Montero E., and Sanz M.. 2020. “Epidemiology of Mid‐Buccal Gingival Recessions in NHANES According to the 2018 World Workshop Classification System.” Journal of Clinical Periodontology 47, no. 10: 1180–1190. [DOI] [PubMed] [Google Scholar]
- Ruf, S. , Hansen K., and Pancherz H.. 1998. “Does Orthodontic Proclination of Lower Incisors in Children and Adolescents Cause Gingival Recession?” American Journal of Orthodontics and Dentofacial Orthopedics 114, no. 1: 100–106. [DOI] [PubMed] [Google Scholar]
- Salti, L. , Holtfreter B., Pink C., et al. 2017. “Estimating Effects of Craniofacial Morphology on Gingival Recession and Clinical Attachment Loss.” Journal of Clinical Periodontology 44, no. 4: 363–371. 10.1111/jcpe.12661. [DOI] [PubMed] [Google Scholar]
- Sarfati, A. , Bourgeois D., Katsahian S., Mora F., and Bouchard P.. 2010. “Risk Assessment for Buccal Gingival Recession Defects in an Adult Population.” Journal of Periodontology 81, no. 10: 1419–1425. [DOI] [PubMed] [Google Scholar]
- Schneider, D. , Ender A., Truninger T., et al. 2014. “Comparison Between Clinical and Digital Soft Tissue Measurements.” Journal of Esthetic and Restorative Dentistry 26, no. 3: 191–199. [DOI] [PubMed] [Google Scholar]
- Schütz‐Fransson, U. , Lindsten R., Bjerklin K., and Bondemark L.. 2019. “Mandibular Incisor Alignment in Untreated Subjects Compared With Long‐Term Changes After Orthodontic Treatment With or Without Retainers.” American Journal of Orthodontics and Dentofacial Orthopedics 155, no. 2: 234–242. [DOI] [PubMed] [Google Scholar]
- Slutzkey, S. , and Levin L.. 2008. “Gingival Recession in Young Adults: Occurrence, Severity, and Relationship to Past Orthodontic Treatment and Oral Piercing.” American Journal of Orthodontics and Dentofacial Orthopedics 134, no. 5: 652–656. [DOI] [PubMed] [Google Scholar]
- Tsukiboshi, Y. , Gil J., Sola C., Min S., and Zadeh H. H.. 2023. “A Novel 3D Volumetric Method of Analyzing Gingival Positional and Dimensional Alterations During Orthodontic Therapy: A Pilot Study.” International Journal of Periodontics and Restorative Dentistry 43, no. 3: e135–e140. 10.11607/prd.6393. [DOI] [PubMed] [Google Scholar]
- Turesky, S. 1970. “Reduced Plaque Formation by the Chloromethyl Analogue Vitamine C.” Journal of Periodontology 41: 41–43. [DOI] [PubMed] [Google Scholar]
- Von Elm, E. , Altman D. G., Egger M., Pocock S. J., Gøtzsche P. C., and Vandenbroucke J. P.. 2007. “The Strengthening the Reporting of Observational Studies in Epidemiology (STROBE) Statement: Guidelines for Reporting Observational Studies.” Lancet 370, no. 9596: 1453–1457. [DOI] [PubMed] [Google Scholar]
- Yared, K. F. , Zenobio E. G., and Pacheco W.. 2006. “Periodontal Status of Mandibular Central Incisors After Orthodontic Proclination in Adults.” American Journal of Orthodontics and Dentofacial Orthopedics 130, no. 1: 6.e1–6.e8. 10.1016/j.ajodo.2006.01.015. [DOI] [PubMed] [Google Scholar]
Associated Data
This section collects any data citations, data availability statements, or supplementary materials included in this article.
Supplementary Materials
Data S1. Appendix.
Data Availability Statement
The data that support the findings of this study are available on request from the corresponding author. The data are not publicly available due to privacy or ethical restrictions.