

Abstract
Global oxygen minimum zones (OMZs) often reach hypoxia but seldom reach anoxia. Recently it was reported that Michaelis Menten constants (Km) of oxidative enzymes are orders of magnitude higher than respiratory Km values, and in the Hypoxic Barrier Hypothesis it was proposed that, in ecosystems experiencing falling oxygen, oxygenase enzyme activities become oxygen-limited long before respiration. We conducted a mesocosm experiment with a phytoplankton bloom as an organic carbon source and controlled dissolved oxygen (DO) concentrations in the dark to determine whether hypoxia slows carbon oxidation and oxygen decline. Total oxygen utilization (TOU) in hypoxic treatment (ca. 7.1 µM O2) was 21.7% lower than the oxic treatment (ca. 245.1 µM O2) over the first 43 days of the experiment. In addition, following the restoration of fully oxic conditions to the hypoxic treatment, TOU accelerated, demonstrating that oxidative processes are sensitive to DO concentrations found in large volumes of the ocean. Microbial amplicon-based community composition diverged between oxic treatments, indicating a specialized microbiome that included Thioglobaceae (SUP05 Gammaproteobacteria), OM190 (Planctomycetota), ABY1 (Patescibacteria), and SAR86 subclade D2472, thrived in the hypoxic treatment, while the genus Candidatus Actinomarina and SAR11 alphaproteobacteria were sharply inhibited. Our findings support the hypothesis that oxygenase kinetics might slow the progression of ocean deoxygenation in oxygen-poor regions and be a factor in the evolution of microbial taxa adapted to hypoxic environments.
Subject terms: Environmental microbiology, Biogeochemistry, Climate sciences, Ocean sciences
Introduction
The oxygen content of the global ocean is decreasing as a result of increases in ocean temperature and stratification driven by global climate change1–3. This climate-driven decline in ocean oxygen inventory compounds the risks of hypoxia across systems that are impacted by eutrophication from watershed and atmospheric nutrient inputs4,5. In the global ocean, oxygen minimum zones (OMZs) are ocean regions where oxygen concentrations decline to below 20 μM6. In certain OMZs, dissolved oxygen can reach suboxic (< 5 μM O2) and anoxic values. Above and below OMZs, a much larger volume of hypoxic waters (< 63 μM O2) is found, but only a small fraction of these waters transition into suboxia7,8. For example, the volume of hypoxic waters in the Eastern Tropical Pacific, where the largest OMZ is located, is an order of magnitude larger than those that are suboxic or anoxic9. Such hypoxic waters can be upwelled onto continental shelves where microbial respiration can, at times, generate coastal hypoxic or anoxic zones10. OMZs arise when respiratory O2 demand resulting from the heterotrophic degradation of organic matter exceeds O2 availability in poorly ventilated ocean regions. Currently, OMZ (defined by ≤ 20 μM O2) make up < 1% of the world’s ocean by volume but are projected to double with each 1% decrease in mean global ocean oxygen inventory over the next century, highlighting their potential sensitivity to climate forcing2,6,11.
Expansion of OMZs can cause dramatic shifts in marine biodiversity, particularly in continental shelves where large “dead-zones” can form10,12. Such expansions have important social consequences when fisheries are impaired by mortality events or wholesale movement of fish populations away from oxygen-poor habitats. The northeastern Pacific Shelf offshore of Oregon and Washington is a region where the onset of anoxia and suboxia have important impacts on ecosystems and fisheries but are highly variable in time and space9,13. Interestingly, while sub-surface respiration can be sufficient to drive the system to anoxia, such events are rare and extensive observations across the California Current System indicate that dissolved oxygen (DO) concentrations rarely drop below 25 μM O29. It remains unclear why subsurface respiration in such a productive large marine ecosystem fails to consume the last remaining 25 μM of DO, or why suboxic OMZ volume is currently restricted to < 1% of the ocean. These observations are surprising because the Pasteur Point, signifying the canonical lower limit of aerobic metabolism, is approximately 2.2 μM O2. Moreover, Stolper et al. reported an even lower limit for aerobic growth at ≤ 3 nM O214. The high frequency of DO concentrations ranging from one to three orders of magnitude higher than the observed aerobic lower limits suggests some external factor is preventing the full microbial utilization of the available DO.
According to canonical understanding, microbial oxygen utilization and carbon degradation are not expected to be affected by DO availability until concentrations decline far below hypoxia. Considerable research has focused on the activity of terminal respiratory oxidases at the sub-oxic-anoxic interface15–18. However, there is a noticeable gap in published knowledge about microbial processes in the micromolar range of DO concentrations. Emerging evidence suggests that microbial communities and processes may, in fact, be sensitive to micromolar DO variations. In a seasonally hypoxic estuary, significant changes in bacterial community composition associated with DO concentrations occurred between 162 and 223 µM O219. Time series observations from a coastal station off Chile found bacterial community composition to be modulated by DO concentrations of 70 µM O220 Working in the Eastern Tropical North Pacific and South Pacific OMZs, Tiano et al.15, reported Km (the Michaelis–Menten half-saturation constant) values for microbial respiration that varied from 10 to 200 nM DO, values within the range of Km reported for low- to high-affinity terminal oxidases21. While careful laboratory kinetics measurements have established lower bounds for marine microbial respiration Km at ~ 5 nM DO16, studies across low oxygen systems indicate that whole community Km can vary considerably. In the Arabian Sea22, Nambian17, and Peruvian17 OMZ, as well as hypoxia-impacted Chesapeake Bay23 microbial oxygen consumption rates saturate above 20 μM DO, suggesting that whole community Km may be orders of magnitude higher than those exhibited by high-affinity terminal oxidases24.
The quality and quantity of organic carbon export is centrally recognized as a fundamental control on the consumption of DO in the ocean25. This control is not exclusive as oxygen utilization rates slow as DO declines into nM concentrations has been hypothesized to act as a negative feedback that limits the development of anoxic zones26. Recently, we proposed the Hypoxic Barrier Hypothesis (HBH) that extends DO control of respiration as a mechanism that constrains the formation of hypoxic zones9. The HBH states that complete microbial oxidation of dissolved organic matter (DOM) is inhibited at micromolar DO concentrations by the oxygen requirement of catabolic oxygenase enzymes9. An oxygenase enzyme catalyzes reactions involving the incorporation of molecular oxygen (O2) into organic compounds, often as part of catabolic processes (Fig. 1)27. This hypothesis suggests microbial metabolism of certain types of complex DOM is dependent upon the activity of enzymes (oxygenases) that use oxygen to process complex DOM into forms that can be utilized by metabolism28–30. Extensive meta-analysis indicates that the Km of oxygenase enzymes have a mean of 67 µM O2, in the range of asymptotes of DO in many OMZs, and orders of magnitude above the nanomolar scale Km values of terminal respiratory oxidases9. The relatively high Km values reported for oxygenase enzymes may indicate a potential bottleneck in the supply of electrons from organic matter to respiration.
Fig. 1.

Example of oxygenase-dependent and oxygenase independent catabolic pathways: toluene and glucose degradation pathway in Pseudomonas putida. Oxygen dependent enzymatic reactions are highlighted in blue (enzyme (1) and enzyme (2) and Terminal Cytochrome Oxidase). Oxygen dependent toluene degradation shown with a limiting Km of ca. 54.7 µM. Toluene dioxygenase and 3-methylcatechol-2,3-dioxygenase both involve the incorporation of oxygen into the substrate. Whole cell Km analysis with toluene as a substrate provided a Km of 23.1 µM for Burkholderia pickettii and a Km of 37.5 µM for Pseudomonas putida97. The rate of toluene degradation by Pseudomonas putida has been shown to have a critical oxygen concentration between 20 and 30 µM98. Extensive analysis of Km values for 1,2 and 2,3-catechol dioxygenase have been evaluated and shown to utilize 3-methylcatechol as a substrate with 13.36% activity98–110. The average Km value for enzyme specific assays of 1,2-catechol dioxygenase is 61.9 ∓ 42.5 µM and 2,3-catechol dioxygenase is 50.6 ∓ 111.08 µM9. Enzymes within toluene degradation pathway: (1) Toluene dioxygenase (2) Toluene-cis-dihydrodiol dehydrogenase (3) 3-methylcatechol 2,3-dioxygenase (4) 2-hydroxy-6-oxohepta-2,4-dienoate hydrolase (5) 2-keto-4-pentenoate hydratase (6) 4-hydroxy 2-oxovalerate aldolase (7) acetaldehyde dehydrogenase. Oxygen independent degradation of glucose when used as a substrate for glycolysis. Oxygen dependent oxidative phosphorylation with a limiting Km of ca. 350 nm9. Toluene is an example of a class of dissolved organic matter (DOM) compounds referred to as “oxygenase-dependent DOM (ODDOM)” by Giovannoni et al. for which the rate of catabolism is proposed to slow by the above mechanism in ecosystems as they enter hypoxia9.
The composition of marine DOM is often linked to oxygen availability, with oxygen-dependent processes potentially influencing or being fueled by specific DOM compounds31. However, our understanding of how ocean deoxygenation affects the molecular composition and stability of the marine DOM pool remains incomplete32–35. Studies indicate higher bulk dissolved organic carbon (DOC) concentrations in oxygen-limited environments compared to oxic waters36–38. Beyond quantity, oxygen availability also appears to shape DOM quality39. Working off the coast of Peru, Maßmig and Engel reported a decoupling of the degradation of dissolved combined carbohydrates and dissolved amino acids under suboxic conditions40. In a seasonally hypoxic fjord in Canada, DOM was shown to have greater diversity, decreased bioavailability, and a suggested inefficiency in degradation compared to aerobic conditions, thus contributing to the heightened chemical diversity observed in OMZs41.
Whether the kinetics of oxygenase enzymes scale up to control the kinetics of oxygen utilization by microbial communities has not been tested experimentally but has important implications for future projections of ocean change under deoxygenation. Currently, respiration parameterizations in earth system models vary widely, ranging from oxygen-independent to micromolar DO concentration-dependence (Table S1). This raises key questions about the confidence of projections that arise from divergent assumptions of oxygen utilization kinetics. A slowing of respiration as DO concentration approaches hypoxic values may also contribute to the widely observed enhancement of vertical organic carbon flux through OMZs that have been previously attributed to factors such as reduced carbon lability, formation of anoxic microzones within organic carbon aggregates, and reduced zooplankton activity42,43. Here, we propose that broad kinetic oxygen-limitation of oxygenase activity may serve as a secondary control on microbial respiration and carbon use.
In this study, we investigated the progress of DOM oxidation in a 15-week mesocosm experiment using natural seawater collected on the Oregon Coast to determine microbial response to hypoxic conditions (ca. 7.1 µM O2). We created a 200 L phytoplankton bloom to supply fresh DOM to microbial communities in replicated 20 L experimental mesocosms in either oxic or hypoxic treatments (Fig. 2). The system was designed to control DO concentration at oxic or hypoxic values over the experiment duration of three months. We tracked rates of oxygen utilization through short-term assays. We hypothesized that rates of oxygen utilization would, (1) not initially differ between treatments as microbial utilization was supported by a pool of labile organic carbon, (2) decline as microbes increasingly relied on semi-labile organic carbon that required the use of oxygenases, (3) diverge between treatments as the activities of micromolar Km oxygenases become the bottleneck for the supply of compounds that can be readily oxidized by terminal respiratory oxidases. In addition, we tracked changes in total organic carbon (TOC) concentration to assess the potential for hypoxia to affect apparent respiratory quotient (ARQ) (ratio of carbon remineralization to oxygen consumption). While oxygen had little impact on most of the DOM-degrading community or on changes in TOC, it altered the trajectory of total oxygen use, and strongly impacted a diverse array of taxa, inhibiting some prominent aerobic heterotrophs and stimulating many organisms, including multiple taxa with chemoautotrophic potential, Patescibacteria, and variants of the common uncultured marine heterotroph SAR86.
Fig. 2.

Sample collection and mesocosm experimental design. Surface water from Hatfield Marine Science Center was filtered through 100 µm nylon mesh to remove zooplankton, supplemented with nitrate (441 µM NaNO3), phosphate (18 µM NaH2PO4H2O) silicate (53 µM Na2SiO39H2O), and incubated in the light to stimulate a phytoplankton bloom. After four days of incubation on light/dark cycle, water was transferred to six carboys, three per treatment. Carboys were positioned on stir plates to ensure continuous suspension of particulate organic matter throughout the incubation. The hypoxic carboys received 2.1% oxygen for the first 44 days of the experiment, and atmospheric oxygen thereafter.
Results
Phytoplankton blooms and their degradation over 100 days of incubation in darkness with controlled oxygen concentrations
Chlorophyll a concentrations reached 50 µg L−1 48 h after initiating light incubation. After the transition to darkness in the carboys, chlorophyll a levels continued to rise until day 9, followed by a gradual decline, reaching undetectable levels by day 21 (Figure S1). Observed bacterial cell counts were in the range of 105 to 106 cells mL−1 in both treatments throughout the duration of the experiment (Figure S2).
Oxygen utilization
Oxygen utilization rates were lower in the hypoxic treatment and increased when fully oxic conditions were restored. Initial rates of oxygen utilization in both experimental treatments averaged 103 µM O2 d−1 (± 13.4 oxic, ± 15.1 hypoxic). Oxygen Utilization Rates (OUR) in both treatments gradually decreased over the duration of the experiment, but OUR diverged between treatments. Total oxygen utilization (TOU) integrated over the first 43 days of the experiment revealed that TOU in the hypoxic treatment (avg. 7.1 µM O2 + / − 1.8) was 21.7% lower than the oxic treatment (avg. 245.1 µM O2 + / − 3.1) (Fig. 3B). The hypoxic treatment was upshifted from hypoxia to oxic conditions (avg. 244.8 µM O2 + / − 2.8) on day 44 (Fig. 3A). At the time of the shift, TOU in the hypoxic treatment was significantly lower than in the oxic treatment, as determined by a one-sided t-test (p = 0.04). However, following the oxygenated upshift, OUR increased in the former?? hypoxic treatment (Fig. 3B) and by day 100, the difference in TOU between treatments had declined to 10.6% and no longer was significant (p = 0.2).
Fig. 3.
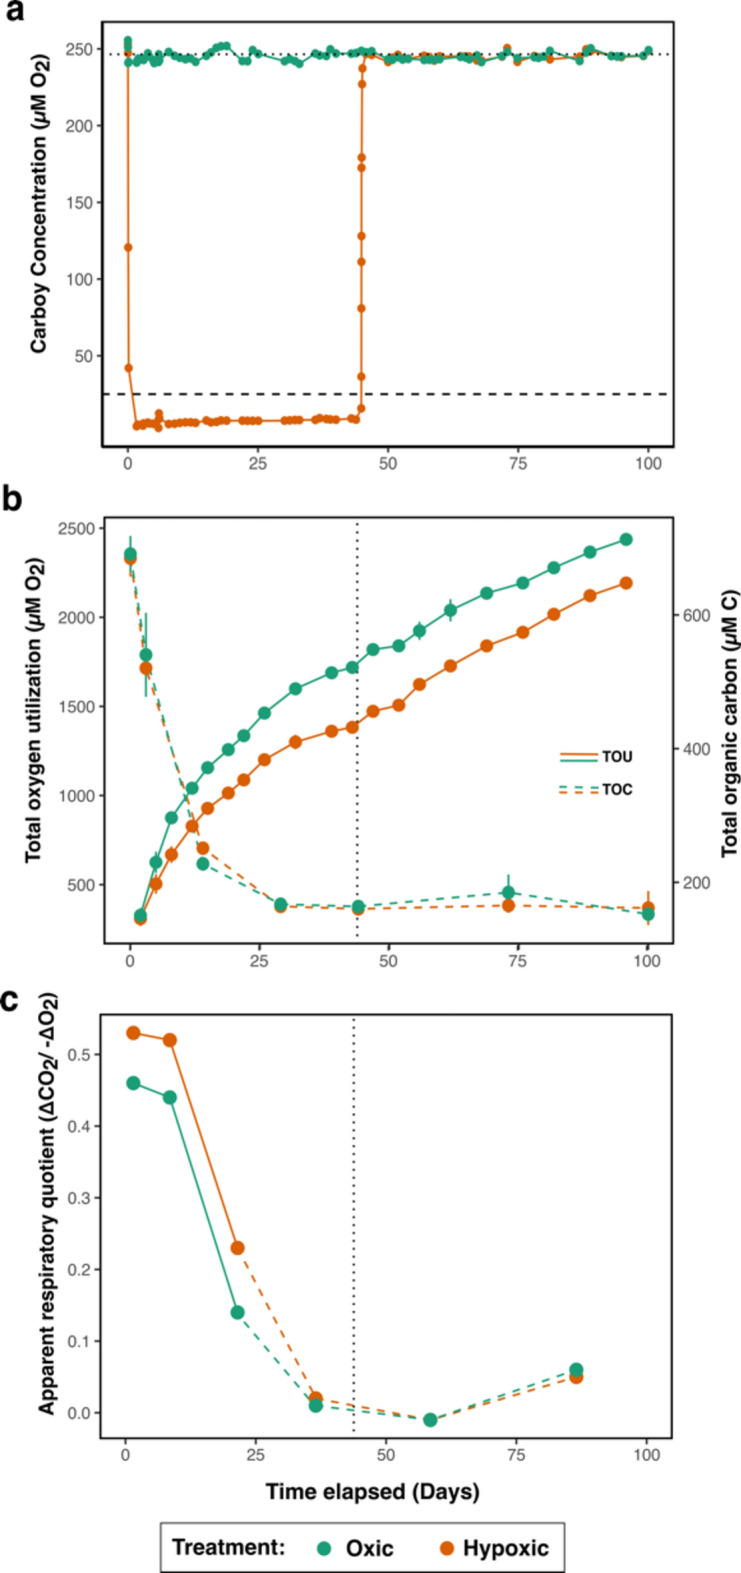
Oxygen utilization and carbon oxidation. (a) Carboy oxygen was delivered consistently at an average concentration of 7.1 µM O2, which is less than the proposed hypoxic barrier of 25 µM O2 (dashed horizontal line). On day 43, the hypoxic treatment was increased to saturation to observe the response of the microbial community to the intrusion of O2. Horizontal dashed line represents the proposed hypoxic barrier (25 µM O2) and the horizontal dotted line represents 100% oxygen saturation (245.1 µM O2). (b) TOU (solid lines) over time reveals oxygen uptake during DOM degradation in hypoxic treatments is lower than in fully oxygenated water. This difference was not reversed by restoring full oxygenation. Black dotted vertical lines indicate the time of oxygen restoration to the hypoxic treatment. TOC concentrations (dashed lines) in both treatments drop despite a steady increase in TOU, suggesting O2 was potentially used by incomplete oxidation of the remaining DOM. Rates of oxygen utilization for individual dates can be found in Tables S6, S10. (c) Apparent respiratory quotient (ARQ; ∆CO2/− ∆O2). The dashed line indicates ARQ values below the range of commonly reported values52.
Total organic carbon (TOC)
TOC declined precipitously in both treatments during dark incubation, with no significant difference between treatments, indicating that total bulk organic matter remineralization was not impacted by hypoxia. Average TOC concentrations at the initiation of the dark incubations were 684.9 and 691.1 µM C for hypoxic and oxic treatments, respectively (Fig. 3B). TOC decreased in both treatments until day 29. From days 29 through 100, the average TOC concentrations for both treatments remained relatively constant at an average of 161.2 ± 7.8 µM C. For both treatments, ca. 22% of the initial TOC persisted by day 100.
Microbial community composition
PERMANOVA statistical analyses using Bray–Curtis dissimilarities demonstrated significant differences between microbial communities over time (p = 0.001) but not between treatments (p = 0.092). When Jaccard distances, which are based on the presence and absence of taxa were used, statistical significance was observed both over time (p = 0.001) and between treatments (p = 0.001), indicating that rare taxa were strongly influenced by the difference in oxygen concentration (Figure S3).
The microbial community in the filtered seawater used to initiate the experiment was dominated by SAR11 Clade 1, Rhodobacteraceae, Flavobacteriaceae, and SAR86 (Fig. 4A; Day -4). After the nutrient addition, on day 0, both treatments were dominated by Rhodobacteraceae, Flavobacteriaceae, and Saprospiraceae. On day 14, the communities of the hypoxic and oxic treatments were nearly indistinguishable. Both treatments contained notable abundances of taxa within families Flavobacteriaceae, Rhodobacteraceae, Saprospiraceae, Cryomorphaceae, Halieaceae, Stappiaceae and Rubritaleaceae (Fig. 4B).
Fig. 4.

Temporal dynamics of mesocosm microbial communities under hypoxic and oxic treatments. (a) Non-Metric Multidimensional Scaling (NMDS) plot of Bray–Curtis dissimilarities from 16S rRNA amplicon sequences (ASVs). Day -4 represents the initial community derived from a natural seawater inoculum from Yaquina Bay, while day 0 signifies the onset of oxygen delivery. The communities in the hypoxic and oxic treatments exhibit noticeable divergence over time, indicating a specialized microbiome colonized the hypoxic treatment between days 14–100. The divergence is canonically unexpected due to the ample oxygen availability at ca.7.1 µM O2. Stress value for the NMDS analysis was 0.07. (b) Microbial community composition at the family level. Microbial communities in oxic and hypoxic treatments showed initial similarities on day 0 but diverged notably by day 44. On day 44, the oxic treatment was dominated by SAR11 Clade 1, while the hypoxic treatment exhibited an increase in an unclassified SAR86 strain. At the terminal time point, both treatments displayed a predominance of an archaeal population of ammonia-oxidizing Nitrosopumilaceae.
By day 44, community differences between the treatments were evident (Figs. 4, 5). ASVs in two common clades of planktonic bacteria, SAR11 alphaproteobacteria and Actinomarinaceae, were far more abundant in the oxic treatment, while SAR86 gammaproteobacteria were more abundant in the hypoxic treatment. By day 100, the two treatments had developed further differences, yet by then, both were dominated by ammonia oxidizing archaea in the family Nitrosopumiliaceae.
Fig. 5.

Differential abundance of taxa across treatments on day 44. The taxa shown differed significantly (p = 0.05) between seawater exposed to hypoxic and oxic treatments on day 44. Positive values indicate taxa that were more abundant in the oxic treatment. ASVs were aggregated at the family level and categorized based on the most specific taxonomic classification available in the SILVA database. This approach was adopted to provide a comprehensive overview of microbial diversity between treatments across various taxonomic levels.
A diverse group of taxa thrived in low oxygen conditions, with many commonly found and others rarely observed in high abundances within marine samples (Fig. 5). Thioglobaceae (SUP05), facultative sulfur-dependent chemolithotrophs that are highly abundant in ocean OMZs, were more successful in the hypoxic treatment44,45. In low oxygen, OM190 bacteria were significantly more abundant. Anerobic growth and increased abundances of OM190 in hypoxic marine environments have been reported, and they are a sister clade of annamox bacteria, but their metabolism is unknown46,47. Hypoxia-stimulated Woesebacteria, which are routinely found to be highly abundant in marine sediments, are thought to be facultative autotrophs based on genomic traits and encode genes for denitrification to nitrous oxide48. ABY1, Candidatus Uhrbacteria in the family Patescibacteria (Candidate Phylum Radiation; CPR), which are known for small cell size, reduced genomes and, in some cases, parasitic lifestyles, were far more abundant in the hypoxic treatment49,50.
Employing approaches that agglomerate ASV abundances by higher taxonomic level for statistical comparisons, such as the family-level analysis in Fig. 4, or by hierarchical taxonomical schemes, as we report in Fig. 5, reveal broad phylogenetic trends in ecological function that are obscured at the level of individual ASVs. These agglomerative approaches increase statistical power, yet conversely miss genotypic, and by association, phenotypic, variability at finer scales. Further insight into the hypoxia sensitivity of marine microbial taxa can be found in Table S2, which shows the individual ASVs that responded the most strongly to the oxygen difference, in rank order by their abundance across the entire data set. For example, the widely distributed and globally abundant genus Candidatus Actinomarina was 2000 times more likely to be observed in the oxic treatment than in the hypoxic treatment on day 44; similarly other well-known and abundant marine taxa, including many SAR11 ASVs, and the less abundant but well-known marine gammaproteobacterium BD1-7, were many orders of magnitude more abundant in the fully oxic treatment. Some clades, such as Flavobacteriales, showed a mixed response, indicating some ASVs responded positively to hypoxia while others were strongly favored by full oxia. SAR11 1A (Pelagibacteriales), the most abundant SAR11 group in the oceans, had a mixed response, with three ASVs favored by oxic conditions but one SAR11 1A ASV (ASV188) was 8.3 × 10⁶ more abundant in the hypoxic treatment. A variety of common coastal planktonic clades (e.g. SAR92, Porticoccaceae and OM43, Methylophilaceae) contributed ASVs to the community responding positively to the hypoxic treatment.
Discussion
In apparent accord with HBH predictions, hypoxia reduced TOU in mesocosms even though oxygen was supplied at concentrations ca. 200-fold higher than conventionally defined respiratory thresholds. The HBH postulates that the oxidation of some classes of chemical compounds will be delayed in hypoxic environments because of the reduced activity of catabolic oxygenase enzymes. In the simplest interpretation of this idea, restoration of a fully oxic state after a period of hypoxia would be predicted to cause rates of oxygen utilization to increase as the activity of oxygenase enzymes accelerated and oxygenase-dependent DOM (ODDOM) was more actively catabolized9. TOU data showed that oxygen utilization was lower in the hypoxic treatment and accelerated when it was transitioned to a fully oxic state on day 44, but a gap in TOU between the treatments persisted until the experiment ended on day 100. The enduring disparity between the treatments suggests that hypoxia might change the path of DOM degradation, leading to the formation of alternate products rather than the accumulation of unreacted substrates for oxidases. Environmental studies in estuaries and fjords have found that oxygen concentration influences DOM composition51, and in some of these reports, it was suggested that refractory DOM production increased in low-oxygen regions41,52.
Analyses of community diversity further showed that a few taxa were responsive to oxygen, in some cases strongly, whereas many taxa were unaffected, as expected if their metabolism required respiration but was rate-independent of oxygenase enzymes. Among the microorganisms strongly responding to the difference in oxygen concentrations were lineages of OM190, which are functionally undescribed, but are a sister clade to annamox bacteria, chemoautotrophs that catalyze nitrogen loss in OMZs and are known to be inhibited by fully oxic environmental conditions53. Other microbes that were sensitive to the differences in oxygen concentrations were unexpected: SAR11 and marine actinobacteria, common marine heterotrophs, were inhibited by hypoxia, but a collection of bacteria associated with chemolithoautotrophy, genome minimization, and parasitism were more abundant in the hypoxic treatment prior to reoxygenation.
To our surprise, members of the SAR86 clade, a microbial group that has previously been detected in hypoxic seawater, but has not been generally regarded as having adaptions to low oxygen, was abundant in the hypoxic treatment on day 4419,54,55. The SAR86 ASVs that were abundant in the hypoxic treatment were in the D2472 subclade of SAR86 (Figure S4), as described in the Genome Taxonomy Database. D2472 SAR86 are globally abundant (Figure S5). SAR86 were reported in a study of marine oxygen minimum zones in the Tropical Mexican Pacific, where they were found in highest abundance in the euphotic zone56. A study of a seasonally hypoxic estuary reported that SAR86 was one of the most abundant groups of microorganisms across both high and low DO samples and increased in abundance as DO decreased19. Our findings raise intriguing questions about the ecology of SAR86 in the context of oxygen-depleted marine ecosystems, further emphasizing the incentives for investigations that resolve impacts of oxygen on the major groups of microbial plankton at concentrations in the hypoxic range and above.
To understand the relationship between TOU and TOC we plotted apparent respiratory quotients (ARQ) over the time course of the experiment (Fig. 3C). ARQ is the ratio of carbon dioxide produced to oxygen consumed (∆TOC:∆O2) by heterotrophic cells, with the assumption that reduced nitrogen, and to a lesser extent sulfur, consumed by chemolithotrophs simultaneously contribute to oxygen utilization57–59. We observed ARQ values in the range of 0.4–0.5 in the first week of the experiment, with higher values consistently in the hypoxic treatment. These values are in the range of common ARQ values for natural seawater58. By the third week of the experiment, ARQ had dropped to very low values (< 0.3), rarely observed in natural systems and unlikely to be explained by organic carbon oxidation to CO2.
A broad range of ARQ values has been reported, reflecting the natural range of DOM composition, which is influenced by variation in the original source of the organic matter and its state of degradation58. Very low ARQ values indicate highly reduced compounds, such as lipids, that demand a considerable amount of oxygen to fully metabolize to carbon dioxide. Models that allow ARQ to change over time as organic matter is degraded are realistic from the perspective of microbial physiology and biochemistry. Cells often show a preferred order for using molecules, which is canonized in prevalent conceptual models of DOM that emphasize a spectrum from the most labile to the most recalcitrant forms. In any case, the very low ARQ values we observed late in the experiment were a clear indication that factors other than TOC oxidation to CO2 were contributing to oxygen uptake after the first 22 days of incubation.
To explain the observation of elevated oxygen uptake relative to TOC decline, particularly after TOC was drawn to relatively constant concentrations, we evaluated the hypothesis that oxidation of reduced nitrogen and sulfur compounds by chemolithoautotrophic microorganisms could consume oxygen in excess of values calculated from bulk ocean mean stoichiometry. Chemolithoautotrophs use inorganic compounds as electron donors to drive their energy needs and can fix CO2 rather than consume organic carbon during respiration. Supporting this hypothesis, ASV’s associated with the family Nitrincolaceae, which degrade nitrogen-rich organic compounds, were always detected in the mesocosms and ammonia-oxidizing archaea (Nitrosopumilaceae) appeared in large numbers between day 44 and day 100 (Fig. 4B). To model the potential for oxygen uptake by ammonium-fueled chemolithotrophy, we assumed that all ammonium was oxidized completely to nitrate over the duration of the experiment (Figure S6). We estimate 202.5 µM of oxygen would be required to oxidize 81.2 µM of organic nitrogen (N), estimated from Redfield ratios and TOC concentrations, from ammonium (NH4+) to nitrate (NO3−) in the hypoxic treatment of the experiment of chemolithoautotrophic ammonium oxidation, if delayed relative to carbon oxidation, as indicated by the late rise of N-oxidizing bacteria and archaea in the experiment, could contribute significantly to explaining the low ARQ values we observed late in the experiment. As illustrated in Figure S6, TOU eventually exceeded predictions based on the lowest realistic ARQs that have been reported, even after accounting for delayed N oxidation. This indicates that factors in addition to a temporal offset between TOC and N oxidation might be contributing to the apparent excess of oxygen uptake that was observed.
We made another calculation to evaluate an alternate hypothesis: that unexplained oxygen uptake could be the result of changes in the oxidation state of TOC over the time course of the experiment. TOU models based on changing TOC, shown in Figure S6, do not consider the possibility that the oxidation state of carbon could change over time due to the transformation of organic carbon (“the microbial pump”) and/or DOM oxidation by cells a postulated but unproven process29. To evaluate the potential of this hypothesis to explain excess oxygen consumption, we assumed that the initial ARQ (∆CO2/-∆O2) of the TOC we detected was 0.30 at T0, but by day 100 was 3.10, which is the extreme of ARQ values reported in the literature58. We estimated that increases in the oxidation state of TOC remaining in the carboys could have consumed 442.3–458.8 µM O2, about 19% of total oxygen use. Deviations in the timing of TOC and DOM oxidation, and changes in the oxidation state of TOC, are not only possible, but indeed likely and both factors would tend to flatten the ARQ curve shown in Fig. 3C by raising ARQ values during the latter phase of the experiment. That said, observed TOU over the duration of the experiment was still higher than expected, suggesting other unexplained factors might be at work (Figure S6)60. These factors could include carbon release by biofilms on the carboy walls, which were not obvious to visual inspection but could impact observations by providing a variable reservoir of organic carbon and thereby influence TOC.
Advanced models for OMZ geochemistry often include biological feedback, including some that focus on respiration inhibition by low oxygen. Canfield et al. modeled biological controls to explain the persistence of sub-micromolar oxygen concentrations in the Bay of Bengal26. These models were conceived in a conceptual framework that included biochemical information about variation in the O2 Km's of alternative terminal electron acceptors and the oxygen sensitivity of nitrogen cycling activities without explicit knowledge that some reactions in catabolic metabolism are sensitive to oxygen declines in the hypoxic range.
Similar to the conceptualization of Canfield et al. 2019 for the persistence of sub-micromolar DO concentrations in the core of some OMZ, our finding that oxygen utilization slows as DO concentrations approach values that are orders of magnitude above the nanomolar Km of terminal respiratory oxidases suggests the biological feedback may shape the persistence of hypoxic water masses26. Globally, and within regions such as the Eastern Tropical Pacific and Eastern Tropical Atlantic, where OMZs are centered, the relative volumes of suboxic or anoxic waters are only a fraction of those that exhibit hypoxia9. Negative feedback between oxygen utilization rate and micromolar oxygen concentration may help explain why large volumes of hypoxic waters never transition into suboxia. Micromolar Km dynamics can also have implications for how oxygen dynamics are modeled in response to climate change and eutrophication. In a survey of Km O2 values among 42 biogeochemical models, we found that the vast majority utilize Km values in the micromolar range (mean = 13 µM) with only 3 models being formulated with nanomolar Km values (Table S1)61. Thus, apparently, in contrast to expectations from canonical microbial biology, many numerical models already depict oxygen utilization as exhibiting negative feedback dynamics as systems become hypoxic. Our results provide a mechanistic rationale for this widely embedded feature of earth system models.
Over 43 days, hypoxia resulted in a cumulative reduction in oxygen utilization by 22%. For coastal systems subject to seasonal hypoxia, such as those in Eastern Boundary Current Upwelling Systems, the rate of oxygen decline can strongly govern the dynamics of hypoxic zone formation13,62. Increasing the rate of oxygen utilization would shorten the time required for hypoxia formation, increase the size of hypoxic zones, and/or determine whether a system will experience anoxia. As additional context, climate change-driven changes in solubility and ventilation are estimated to have reduced upper ocean DO inventory by ~ 2% from preindustrial value3, with anticipated declines of an additional 5.4% that will manifest from CO2 emissions to date63. This global decline is not evenly distributed, with maximal declines in regions such as the North Pacific where subsurface (100–600 m) DO losses are projected to be on the order of 25%64. As such, the scale of oxygen utilization decline from oxygen limitation appears comparable to the scale of observed and projected climate-driven deoxygenation effects.
Using a relatively simple experimental design we made observations that are in some respects surprising and point to the need for fundamental research into the mechanisms of oxygen loss from marine ecosystems. Microbial community analyses revealed a suite of unusual taxa, including OM190, Woesebacteria, Patescibacteria, and ASVs of SAR86, OM43 and SAR92, responding to low oxygen. These observations underscore the need to classify, cultivate and investigate the taxa shown to respond positively to low oxygen, and identify their roles in the biogeochemistry of hypoxic systems. There is a need for more accurate descriptions of the relationship between oxygen utilization and carbon remineralization by bacterioplankton and how it relates to the oxidation state of carbon for improved model predictions of the carbon cycle. Research on microbial processes in OMZs presents an opportunity to develop microbial and biochemical indicators to identify and potentially predict a specific system’s susceptibility to change. Our observations suggest that the current conceptualization of oceanic oxygen dynamics may be missing key elements, including the intersection of microbial diversity and oxygen and carbon cycling, which could substantially impact the results of global ocean models.
Methods
Experimental design
Seawater was collected on June 3rd, 2021, from Yaquina Bay at Hatfield Marine Science Center in Newport, OR during high tide (44°37′’N, 124°02′W, Temp: 12 °C, Time: 0800). Water was filtered through 100 µm Nitex mesh into replicate ten 20 L carboys. In the laboratory, the water was pumped into a 200 L carboy to homogenize the sample. Nutrients were added at the following final concentrations to stimulate a phytoplankton bloom from the natural seawater community: nitrate (441 µM NaNO3), phosphate (18 µM NaH2PO4H2O) silicate (53 µM Na2SiO39H2O). Lights were set to 800 µE/m2/s light to simulate Oregon coastal light patterns on a 19–5-h light–dark cycle for 4 days. All incubations and oxygen measurements were conducted in an environmentally controlled room at 16 °C. Chlorophyll a (Chl a) concentration was used to monitor the density of the bloom. After the Chl a peaked, the 200 L phytoplankton bloom was partitioned into six 20 L carboys (n = 3 per treatment).
The experimental apparatus maintained a constant temperature and excluded light from the six magnetically stirred carboys and delivered gas by sparging at rates of 285 L/day/carboy, a rate designed to exceed estimated respiration rates by at least tenfold and therefore produce an equilibrium gas concentration that was independent of the respiration rates in the carboys. The oxic control treatment consisted of three carboys connected to an aquarium air pump to deliver air filtered through an activated charcoal hydrocarbon trap intended to trap volatile organic compounds originating from air and a 0.2 µM filter. For the hypoxic oxygen treatment, carbon dioxide, nitrogen and oxygen gases were mixed with mass flow controllers (initial settings of 0.05% CO2, 2.1% O2 and 97.9% N2; Alicat Scientific, Tucson, AZ, USA) to achieve 10% of saturating O2 at 16 °C and oxygen flow was adjusted manually thereafter to the final set point of 7.1 µM O2 (+ / − 1.8) dissolved O2 in 16 °C seawater. Figure 3A illustrates that oxygen concentrations remained stable in the carboys over the duration of the experiment. After 40 days, the hypoxic treatment was reoxygenated to the same O2 conditions (avg. 244.8 µM O2 + / − 2.8) as the oxic treatment (avg. 245.1 µM O2 + / − 3.1) using the same aquarium pump configuration as described above until the experiment was terminated on day 100. Dissolved oxygen concentration was monitored using an optode system (Fibox 3, Presens GmbH, Regensburg, Germany) consisting of a luminophore immobilized within a transparent polyester foil (SP-PSt-NAU, Presens GmbH, Regensburg, Germany) and a fluorometer that quantifies the phase shift between excitation and emission lights. A luminophore sensing foil was affixed to the inside wall of each carboy. Optode readings were taken once a day for each carboy. In addition, temperature was recorded in a reference carboy via a Pt100 probe (Presens GmbH, Regensburg, Germany). To account for the effects of salinity, O2 concentration values reported by the Fibox unit were recalculated to account for the effects of salinity according to Bittig et al.65. Expected oxygen solubility for oxic conditions was calculated according to Garcia and Gordon66.
Chlorophyll a concentration
Chl a was measured daily (10 mL in triplicate) while the seawater was in the 200 L carboy. Once the seawater was transferred to the six treatment carboys, Chl a was measured twice weekly (n = 3 per treatment) until concentrations were negligible due to the dark conditions preventing photosynthesis by phytoplankton. Chl a was measured in triplicate by filtering 10 mL of seawater onto 25 mm glass fiber filters (Whatman GF/F, Cytiva, Marlborough, MA, USA) and extracting for 24 h at − 20 °C in 90% acetone. Absorption was measured using a UV–Vis spectrophotometer (Shimadzu, Kyoto, Japan) and calculated using as described in Ritchie67.
Cell enumeration
Direct bacterioplankton cell counting was used to determine for each treatment throughout the duration of the experiment. Three mL samples were collected and counted twice weekly. Cells were fixed with 10% formaldehyde and filtered onto a 0.2 µm filter (cyclopore polycarbonate black membrane, Whatman) with a vacuum pump. Each sample was treated with 500 µL 4′,6-diamidino-2-phenylindole (DAPI) stain and covered for three minutes68. Following filtration, the filter was placed onto a slide with immersion oil and counted by epifluorescence microscopy using the enumeration technique described in Patel et al.69. Replicates (one sample per carboy, three samples total per treatment) were averaged and plotted in R with error bars showing standard deviation.
Total oxygen utilization (TOU)
All oxygen measurements and experiments were conducted in a 16 °C temperature-controlled room. Carboys were covered in black canvas with pockets used to access and measure the optode fastened on the inside of the 20-L carboy. To determine the rates of oxygen utilization across carboys and treatments, 13 mL samples (ground glass stoppered vials, foil covered, parafilm sealed) were collected in triplicate from each carboy biweekly until day 24 and weekly until day 100. The vials were placed into a temperature-controlled water bath within the 16 °C temperature-controlled room and optode readings were measured without removing vials from the water bath. Oxygen concentration (µmol/L) was measured over a duration of hours, not exceeding 12 h. Oxygen concentrations were recorded using optode sensors (PreSens, Regensburg, Germany)65.
Oxygen concentrations were plotted over time and the oxygen utilization rate (OUR) was determined from the linear portion of the line. For TOU, OUR was integrated over the incubation time of the mesocosm experiment and the area under the curve was calculated and plotted cumulatively (Figure S7).
To determine statistical differences between treatments, we performed two one-sided t-tests in R to assess whether the hypoxic treatment demonstrated significantly lower TOU compared to the oxic treatment at two critical integrated time points: day 43 and day 96.
Total organic carbon (TOC)
High-temperature combustion was used to directly measure TOC content. 40 mL samples were collected biweekly/weekly and a selected six sampling sets were sent for analysis. Samples were analyzed on a modified Shimadzu TOC-V as described in Halewood et al.70. Briefly, 3 mL of sample was acidified with 2 mol L−1 HCl (1.5%) and sparged for 1.5 min with CO2-free gas. Three to five replicates (100 μL) of sample were injected into the combustion tube heated to 680 °C that had CO2-free gas flowing through the system at 168 mL min−1. A magnesium perchlorate trap and copper mesh trap were used to ensure the removal of water vapor and halides from the gas line prior to entering a nondispersive infrared detector. The resulting peak area was integrated with Shimadzu chromatographic software. TOC was plotted over time.
Estimated TOU and apparent respiratory quotient (ARQ)
ARQs plotted in Fig. 3C were calculated by ∆ [TOC] /∆ TOU between sampling intervals. Observed TOC values were used to estimate the expected TOU from reported ARQs. Estimated TOU from ARQ was calculated as ∆ [TOC] /ARQ and plotted in Figure S6. Reported ARQ values (0.30, 0.76, 0.88, 3.1) and final TOU estimations are listed in Table S358,59.
DNA extraction and amplicon sequencing
Amplification of 16S rRNA genes was employed to identify taxa present in the mesocosm and track their changes over time in both treatments. One liter of water was collected from each replicate carboy at six different time points in a polypropylene carboy. Microbial biomass was collected onto a 0.22 µm pore-size Sterivex filter (polyethersulfone membrane, Millipore, Burlington, MA, USA) using a three-channel peristaltic pump (flowrate 30 mL/min). 1.5 mL of sucrose lysis buffer was added to the filters and stored at − 80 °C. Nucleic acids were extracted using a phenol:chloroform protocol described previously71,72.
The V4 region of the 16S rRNA gene was amplified by PCR and sequenced using individually barcoded universal primers on an Illumina MiSeq, following protocols described by the Earth Microbiota Project, at the Center for Quantitative Life Sciences (Oregon State University, Corvallis OR)73.
16S rRNA gene amplicon analyses
Raw sequence forward and reverse reads were processed with DADA2 in R using default settings for filtering, learning errors, dereplication, Amplicon Sequence Variant (ASV) inference, and chimera removal74. Truncation quality (truncQ) was set to 2. Truncation length was set to 240, 200. ASVs were assigned taxonomic classification using the SILVA 16S rRNA gene reference database75. Samples with sequencing depths less than 30,000 reads were omitted. Before filtration, the mean sequencing depth was 107,604 with a minimum of 58,213 reads and maximum of 139,392 reads. ASVs present in less than 2 samples were filtered out of the dataset. Taxa annotated as “unknown family” were removed from the dataset using the microViz interactive tax_fix function76. Microbial beta-diversity was assessed with Jaccard Index and Bray–Curtis dissimilarity. Bray Curtis dissimilarity was plotted on non-metric multidimensional scaling (stress value: 0.07). Differences in beta diversity were tested with Permutational Multivariate Analysis of Variance (PERMANOVA) using the adonis2 function of the vegan package in R (vegan, version 2.6–2)77.
The package DESeq2 (v.1.34.0) was used on the ASVs aggregated at the family level to assess the differential abundance of the ASVs across treatments on day 44 of the experiment, where the greatest divergence in taxa was observed78. DESeq2 includes a model based on the negative binomial distribution and a Wald’s post hoc test for significance testing. Amplicon sequence datasets presented in this study have been deposited in NCBI SRA database under the BioProject identifier PRJNA1071672.
SAR86 phylogenetic tree analysis
All SAR86 reference genome nucleotide sequences (taxonomy ID 62672) were downloaded from NCBI on October 21, 2023 (849 genomes) using the NCBI datasets tool79,80. The 16S sequences from each reference genome were queried and extracted from each genome using barrnap v0.9 with default settings, resulting in 694 reference 16S sequences81. The five SAR86 ASVs from our dataset were combined with the reference sequences as a fasta formatted file and were aligned using the SINA aligner v1.7.2 with the SILVA 138.1 SSURef NR99 file used as the reference alignment82,83. Positions with all gaps were removed from the alignment using trimal v1.4.rev15 -noallgaps option84. A phylogenetic tree was generated using FastTree 2.1.11 with the GTR substitution model85,86. The tree was plotted using the ggtree 3.10.0, tidytree 0.4.6, treeio 1.26.0, and ggplot2 3.5.1 packages, and midpoint rooted using the ape 5.7 package in R v4.3.387–92.
The SAR86 reference genomes that had latitude and longitude metadata associated with them were used to examine from where relatives of the ASVs identified in this study were isolated. World maps were plotted using the sp 2.1, sf v 1.0, and rnaturalearth 1.0.1 packages in R v 4.3.393–96.
Supplementary Information
Acknowledgements
We thank Dr. Kristin Kasschau, Dr. Tom Sharpton, and the Oregon State University Center for Qualitative Life Sciences for amplicon sequencing, and Dr. Michael Rappé for phylogenetic identification of the SAR86 ASVs. We thank Keri Opalk at the Marine Science Institute at UCSB for carbon analysis. We thank Dr. Christopher Suffridge, Dr. Chih-Ping Lee, and Adam Schneiderhan for their helpful comments during the experimental design, analysis, writing and editing phases of this manuscript. Figures 1 and 2 were created with BioRender.com.
Author contributions
S.W., S.G., and F.C. contributed to conception and design. S.W. and C.J. contributed to acquisition of data. S.W., F.C., S.G., C.C., E.D., C.D. contributed to analysis and interpretation of the data. S.W., S.G., F.C., C.C., E.D., B.D. drafted and/or revised the article. All authors reviewed the manuscript.
Funding
This work was supported by the Simons Foundation International’s BIOS-SCOPE program and Oregon State University College of Science SciRIS Phase I award.
Availability of data and materials
Amplicon sequence datasets presented in this study have been deposited in NCBI SRA database under the BioProject identifier PRJNA1071672.
Declarations
Competing interests
The authors declare no competing interests.
Footnotes
Publisher’s note
Springer Nature remains neutral with regard to jurisdictional claims in published maps and institutional affiliations.
Contributor Information
Francis Chan, Email: francis.chan@oregonstate.edu.
Stephen J. Giovannoni, Email: steve.giovannoni@oregonstate.edu
Supplementary Information
The online version contains supplementary material available at 10.1038/s41598-024-82438-z.
References
- 1.Oschlies, A., Brandt, P., Stramma, L. & Schmidtko, S. Drivers and mechanisms of ocean deoxygenation. Nat. Geosci.11, 467–473. 10.1038/s41561-018-0152-2 (2018). [Google Scholar]
- 2.Keeling, R. E., Kortzinger, A. & Gruber, N. Ocean deoxygenation in a warming world. Ann. Rev. Mar. Sci.2, 199–229. 10.1146/annurev.marine.010908.163855 (2010). [DOI] [PubMed] [Google Scholar]
- 3.Schmidtko, S., Stramma, L. & Visbeck, M. Decline in global oceanic oxygen content during the past five decades. Nature542, 335–339 (2017). [DOI] [PubMed] [Google Scholar]
- 4.Howarth, R. W. Nutrient limitation of net primary production in marine ecosystems. Ann. Rev. Ecol. Syst.19, 89–110 (1988). [Google Scholar]
- 5.Duce, R. A. et al. Impacts of atmospheric anthropogenic nitrogen on the open ocean. Science320, 893–897 (2008). [DOI] [PubMed] [Google Scholar]
- 6.Lam, P. & Kuypers, M. M. Microbial nitrogen cycling processes in oxygen minimum zones. Ann. Rev. Mar. Sci.3, 317–345. 10.1146/annurev-marine-120709-142814 (2011). [DOI] [PubMed] [Google Scholar]
- 7.Paulmier, A. & Ruiz-Pino, D. Oxygen minimum zones (OMZs) in the modern ocean. Progress Oceanograp.80, 113–128. 10.1016/j.pocean.2008.08.001 (2009). [Google Scholar]
- 8.Deutsch, C., Penn, J. L. & Lucey, N. Climate, oxygen, and the future of marine biodiversity. Ann. Rev. Marine Sci.16, 217–245 (2024). [DOI] [PubMed] [Google Scholar]
- 9.Giovannoni, S. J., Chan, F., Davis, E., Deutsch, C. & Wolf, S. Biochemical barriers on the path to ocean anoxia?. Mbio10.1128/mbio.01332-01321 (2021). [DOI] [PMC free article] [PubMed] [Google Scholar]
- 10.Grantham, B. A. et al. Upwelling-driven nearshore hypoxia signals ecosystem and oceanographic changes in the northeast Pacific. Nature429, 749–754. 10.1038/nature02605 (2004). [DOI] [PubMed] [Google Scholar]
- 11.Ito, T. & Deutsch, C. Variability of the oxygen minimum zone in the tropical North Pacific during the late twentieth century. Global Biogeochem. Cycles27, 1119–1128 (2013). [Google Scholar]
- 12.Chan, F. et al. Emergence of anoxia in the California current large marine ecosystem. Sci.319, 920–920 (2008). [DOI] [PubMed] [Google Scholar]
- 13.Adams, K. A., Barth, J. A. & Chan, F. Temporal variability of near-bottom dissolved oxygen during upwelling off central Oregon. J. Geophys. Res. Oceans118, 4839–4854. 10.1002/jgrc.20361 (2013). [Google Scholar]
- 14.Stolper, D. A., Revsbech, N. P. & Canfield, D. E. Aerobic growth at nanomolar oxygen concentrations. Proc. Natl. Acad. Sci. USA107, 18755–18760. 10.1073/pnas.1013435107 (2010). [DOI] [PMC free article] [PubMed] [Google Scholar]
- 15.Tiano, L. et al. Oxygen distribution and aerobic respiration in the north and south eastern tropical Pacific oxygen minimum zones. Deep Sea Res. Part I Oceanograp. Res. Papers94, 173–183. 10.1016/j.dsr.2014.10.001 (2014). [Google Scholar]
- 16.Gong, X., Garcia-Robledo, E., Schramm, A. & Revsbech, N. P. Respiratory kinetics of marine bacteria exposed to decreasing oxygen concentrations. Appl. Environ. Microbiol.82, 1412–1422. 10.1128/AEM.03669-15 (2015). [DOI] [PMC free article] [PubMed] [Google Scholar]
- 17.Kalvelage, T. et al. Aerobic microbial respiration in oceanic oxygen minimum zones. PLoS One10, e0133526. 10.1371/journal.pone.0133526 (2015). [DOI] [PMC free article] [PubMed] [Google Scholar]
- 18.Zakem, E. J. & Follows, M. J. A theoretical basis for a nanomolar critical oxygen concentration. Limnol. Oceanograp.62, 795–805. 10.1002/lno.10461 (2016). [Google Scholar]
- 19.Spietz, R. L., Williams, C. M., Rocap, G. & Horner-Devine, M. C. A dissolved oxygen threshold for shifts in bacterial community structure in a seasonally hypoxic estuary. PloS One10, e0135731 (2015). [DOI] [PMC free article] [PubMed] [Google Scholar]
- 20.Aldunate, M., De la Iglesia, R., Bertagnolli, A. D. & Ulloa, O. Oxygen modulates bacterial community composition in the coastal upwelling waters off central Chile. Deep Sea Res. Part II Topical Stud. Oceanograp.156, 68–79. 10.1016/j.dsr2.2018.02.001 (2018). [Google Scholar]
- 21.Garcia-Robledo, E. et al. Cryptic oxygen cycling in anoxic marine zones. Proc. Natl. Acad. Sci. USA114, 8319–8324. 10.1073/pnas.1619844114 (2017). [DOI] [PMC free article] [PubMed] [Google Scholar]
- 22.Keil, R. G., Neibauer, J. A., Biladeau, C., van der Elst, K. & Devol, A. H. A multiproxy approach to understanding the" enhanced" flux of organic matter through the oxygen-deficient waters of the Arabian Sea. Biogeosciences13, 2077–2092 (2016). [Google Scholar]
- 23.Sampou, P. & Kemp, W. Factors regulating plankton community respiration in Chesapeake Bay. Marine Ecol. Progress Series110, 249–258 (1994). [Google Scholar]
- 24.D’mello, R., Hill, S. & Poole, R. K. The cytochrome bd quinol oxidase in Escherichia coli has an extremely high oxygen affinity and two oxygen-binding haems: implications for regulation of activity in vivo by oxygen inhibition. Microbiology142, 755–763 (1996). [DOI] [PubMed] [Google Scholar]
- 25.Martin, J. H., Knauer, G. A., Karl, D. M. & Broenkow, W. W. VERTEX: carbon cycling in the northeast Pacific. Deep Sea Res. Part A Oceanograp. Res. Papers34, 267–285 (1987). [Google Scholar]
- 26.Canfield, D. E. et al. The regulation of oxygen to low concentrations in marine oxygen-minimum zones. (2019).
- 27.Hayaishi, O. in Encyclopedia of Biological Chemistry (Second Edition) (eds William J. Lennarz & M. Daniel Lane) 371–374 (Academic Press, 2013).
- 28.Saw, J. H. et al. Pangenomics reveal diversification of enzyme families and niche specialization in globally abundant SAR202 bacteria. bioRxiv, 692848 (2019). [DOI] [PMC free article] [PubMed]
- 29.Landry, Z., Swan, B. K., Herndl, G. J., Stepanauskas, R. & Giovannoni, S. J. SAR202 genomes from the dark ocean predict pathways for the oxidation of recalcitrant dissolved organic matter. mBio10.1128/mBio.00413-17 (2017). [DOI] [PMC free article] [PubMed] [Google Scholar]
- 30.Colatriano, D. et al. Genomic evidence for the degradation of terrestrial organic matter by pelagic Arctic Ocean Chloroflexi bacteria. Commun. Biol.1, 90. 10.1038/s42003-018-0086-7 (2018). [DOI] [PMC free article] [PubMed] [Google Scholar]
- 31.Devol, A. H. & Hartnett, H. E. Role of the oxygen-deficient zone in transfer of organic carbon to the deep ocean. Limnol. Oceanograp.46, 1684–1690 (2001). [Google Scholar]
- 32.Lau, M. P. & Del Giorgio, P. Reactivity, fate and functional roles of dissolved organic matter in anoxic inland waters. Biol. Lett.16, 20190694 (2020). [DOI] [PMC free article] [PubMed] [Google Scholar]
- 33.Lønborg, C., Carreira, C., Jickells, T. & Álvarez-Salgado, X. A. Impacts of global change on ocean dissolved organic carbon (DOC) cycling. Front. Marine Sci.7, 466 (2020). [Google Scholar]
- 34.Seidel, M. et al. Composition and transformation of dissolved organic matter in the Baltic Sea. Front. Earth Sci.5, 31 (2017). [Google Scholar]
- 35.Zhang, C. et al. Evolving paradigms in biological carbon cycling in the ocean. National Sci. Rev.5, 481–499 (2018). [Google Scholar]
- 36.Lorenzoni, L. et al. Spatial and seasonal variability of dissolved organic matter in the Cariaco Basin. J. Geophys. Res. Biogeosci.118, 951–962 (2013). [Google Scholar]
- 37.Ducklow, H. W., Hansell, D. A. & Morgan, J. A. Dissolved organic carbon and nitrogen in the Western Black Sea. Marine Chem.105, 140–150 (2007). [Google Scholar]
- 38.Margolin, A. R., Gerringa, L. J., Hansell, D. A. & Rijkenberg, M. J. Net removal of dissolved organic carbon in the anoxic waters of the Black Sea. Marine Chem.183, 13–24 (2016). [Google Scholar]
- 39.Loginova, A. N., Thomsen, S. & Engel, A. Chromophoric and fluorescent dissolved organic matter in and above the oxygen minimum zone off P eru. J. Geophys. Res. Oceans121, 7973–7990 (2016). [Google Scholar]
- 40.Maßmig, M. & Engel, A. Dissolved organic matter in the upwelling system off Peru: Imprints of bacterial activity and water mass characteristics. J. Geophys. Res. Biogeosci.126, e2020JG006048 (2021). [Google Scholar]
- 41.Chen, X. et al. Oxygen availability driven trends in DOM molecular composition and reactivity in a seasonally stratified fjord. Water Res.220, 118690 (2022). [DOI] [PubMed] [Google Scholar]
- 42.Ploug, H., Iversen, M. H. & Fischer, G. Ballast, sinking velocity, and apparent diffusivity within marine snow and zooplankton fecal pellets: Implications for substrate turnover by attached bacteria. Limnol. Oceanograp.53, 1878–1886 (2008). [Google Scholar]
- 43.Cavan, E. L., Henson, S. A. & Boyd, P. W. The sensitivity of subsurface microbes to ocean warming accentuates future declines in particulate carbon export. Front. Ecol. Evolut.10.3389/fevo.2018.00230 (2019). [Google Scholar]
- 44.Walsh, D. A. et al. Metagenome of a versatile chemolithoautotroph from expanding oceanic dead zones. Science326, 578–582 (2009). [DOI] [PubMed] [Google Scholar]
- 45.Stevens, H. & Ulloa, O. Bacterial diversity in the oxygen minimum zone of the eastern tropical South Pacific. Environ. Microbiol.10, 1244–1259 (2008). [DOI] [PubMed] [Google Scholar]
- 46.Coskun, Ö. K., Özen, V., Wankel, S. D. & Orsi, W. D. Quantifying population-specific growth in benthic bacterial communities under low oxygen using H218O. ISME J.13, 1546–1559 (2019). [DOI] [PMC free article] [PubMed] [Google Scholar]
- 47.Ye, Q. et al. Bacterial diversity in the surface sediments of the hypoxic zone near the Changjiang Estuary and in the East China Sea. MicrobiologyOpen5, 323–339. 10.1002/mbo3.330 (2016). [DOI] [PMC free article] [PubMed] [Google Scholar]
- 48.Mußmann, M., Pjevac, P., Krüger, K. & Dyksma, S. Genomic repertoire of the Woeseiaceae/JTB255, cosmopolitan and abundant core members of microbial communities in marine sediments. ISME J.11, 1276–1281 (2017). [DOI] [PMC free article] [PubMed] [Google Scholar]
- 49.Kuroda, K. et al. Symbiosis between Candidatus Patescibacteria and archaea discovered in wastewater-treating bioreactors. MBio13, e01711-01722 (2022). [DOI] [PMC free article] [PubMed] [Google Scholar]
- 50.Kuroda, K. et al. Microscopic and metatranscriptomic analyses revealed unique cross-domain symbiosis between Candidatus Patescibacteria/candidate phyla radiation (CPR) and methanogenic archaea in anaerobic ecosystems. bioRxiv, 2023.2008. 2025.554742 (2023).
- 51.Li, P. et al. Hypoxia diversifies molecular composition of dissolved organic matter and enhances preservation of terrestrial organic carbon in the Yangtze River Estuary. Sci. Total Environ.906, 167661 (2024). [DOI] [PubMed] [Google Scholar]
- 52.Xiao, X., Yamashita, Y., Gonsior, M. & Jiao, N. The efficiency of the microbial carbon pump as seen from the relationship between apparent oxygen utilization and fluorescent dissolved organic matter. Progress Oceanograp.210, 102929 (2023). [Google Scholar]
- 53.Kalvelage, T. et al. Oxygen sensitivity of anammox and coupled N-cycle processes in oxygen minimum zones. PloS One6, e29299 (2011). [DOI] [PMC free article] [PubMed] [Google Scholar]
- 54.Crump, B. C., Peranteau, C., Beckingham, B. & Cornwell, J. C. Respiratory succession and community succession of bacterioplankton in seasonally anoxic estuarine waters. Appl. Environ. Microbiol.73, 6802–6810 (2007). [DOI] [PMC free article] [PubMed] [Google Scholar]
- 55.Wright, J. J., Konwar, K. M. & Hallam, S. J. Microbial ecology of expanding oxygen minimum zones. Nat. Rev. Microbiol.10, 381–394. 10.1038/nrmicro2778 (2012). [DOI] [PubMed] [Google Scholar]
- 56.Pajares, S., Varona-Cordero, F. & Hernández-Becerril, D. U. Spatial distribution patterns of bacterioplankton in the oxygen minimum zone of the tropical mexican pacific. Microbial Ecol.80, 519–536. 10.1007/s00248-020-01508-7 (2020). [DOI] [PubMed] [Google Scholar]
- 57.Redfield, A. C. The biological control of chemical factors in the environment. Am. Sci.46, 230A-A221 (1958). [PubMed] [Google Scholar]
- 58.Robinson, C. Microbial respiration, the engine of ocean deoxygenation. Front. Marine Sci.10.3389/fmars.2018.00533 (2019). [Google Scholar]
- 59.Li, Y.-H. & Peng, T.-H. Latitudinal change of remineralization ratios in the oceans and its implication for nutrient cycles. Global Biogeochem. Cycles10.1029/2001gb001828 (2002). [Google Scholar]
- 60.Hertkorn, N. et al. Characterization of a major refractory component of marine dissolved organic matter. Geochimica et Cosmochimica Acta70, 2990–3010. 10.1016/j.gca.2006.03.021 (2006). [Google Scholar]
- 61.Wolf, S. Microbial Life Below the Hypoxic Barrier PhD Microbiology thesis, Oregon State University, (2023).
- 62.Pitcher, G. C. et al. Dynamics of oxygen depletion in the nearshore of a coastal embayment of the southern Benguela upwelling system. J. Geophys. Res. Oceans119, 2183–2200 (2014). [Google Scholar]
- 63.Oschlies, A. A committed fourfold increase in ocean oxygen loss. Nat. Commun.12, 2307 (2021). [DOI] [PMC free article] [PubMed] [Google Scholar]
- 64.Kwiatkowski, L. et al. Twenty-first century ocean warming, acidification, deoxygenation, and upper-ocean nutrient and primary production decline from CMIP6 model projections. Biogeosciences17, 3439–3470 (2020). [Google Scholar]
- 65.Bittig, H. C. et al. Oxygen optode sensors: principle, characterization, calibration, and application in the ocean. Front. Marine Sci.10.3389/fmars.2017.00429 (2018). [Google Scholar]
- 66.Garcia, H. E. & Gordon, L. I. Oxygen solubility in seawater: Better fitting equations. Limnol. Oceanograp.37, 1307–1312 (1992). [Google Scholar]
- 67.Ritchie, R. J. consistent sets of spectrophotometric chlorophyll equations for acetone methanol and ethanol solvents. Photosynth. Res.89, 27–41. 10.1007/s11120-006-9065-9 (2006). [DOI] [PubMed] [Google Scholar]
- 68.Porter, K. G. & Feig, Y. S. The use of DAPI for identifying and counting aquatic microflora1. Limnol. Oceanograp.25, 943–948. 10.4319/lo.1980.25.5.0943 (1980). [Google Scholar]
- 69.Patel, A. et al. Virus and prokaryote enumeration from planktonic aquatic environments by epifluorescence microscopy with SYBR Green I. Nat. Protocols2, 269–276. 10.1038/nprot.2007.6 (2007). [DOI] [PubMed] [Google Scholar]
- 70.Halewood, E. et al. Determination of dissolved organic carbon and total dissolved nitrogen in seawater using high temperature combustion analysis. Front. Marine Sci.9, 1061646 (2022). [Google Scholar]
- 71.Giovannoni, S. J., Rappé, M. S., Vergin, K. L. & Adair, N. L. 16S rRNA genes reveal stratified open ocean bacterioplankton populations related to the Green Non-Sulfur bacteria. Proc. National Acad. Sci.93, 7979–7984. 10.1073/pnas.93.15.7979 (1996). [DOI] [PMC free article] [PubMed] [Google Scholar]
- 72.Morris, R. M. et al. Temporal and spatial response of bacterioplankton lineages to annual convective overturn at the Bermuda Atlantic Time-series Study site. Limnol. Oceanograp.50, 1687–1696. 10.4319/lo.2005.50.5.1687 (2005). [Google Scholar]
- 73.Walters, W. et al. Improved bacterial 16S rRNA gene (V4 and V4–5) and fungal internal transcribed spacer marker gene primers for microbial community surveys. Msystems1, e00009-00015 (2016). [DOI] [PMC free article] [PubMed] [Google Scholar]
- 74.Callahan, B. J., McMurdie, P. J. & Holmes, S. P. Exact sequence variants should replace operational taxonomic units in marker-gene data analysis. ISME J.11, 2639–2643. 10.1038/ismej.2017.119 (2017). [DOI] [PMC free article] [PubMed] [Google Scholar]
- 75.Quast, C. et al. The SILVA ribosomal RNA gene database project: improved data processing and web-based tools. Nucleic Acids Res.41, D590-596. 10.1093/nar/gks1219 (2013). [DOI] [PMC free article] [PubMed] [Google Scholar]
- 76.Barnett, D. J., Arts, I. C. & Penders, J. microViz: an R package for microbiome data visualization and statistics. J. Open Source Softw.6, 3201 (2021). [Google Scholar]
- 77.Oksanen, J. et al. vegan: Community Ecology Package. R package version 2.5–7. 2020. Preprint at, 3.1–152 (2022).
- 78.Love, M., Anders, S. & Huber, W. Differential analysis of count data–the DESeq2 package. Genome Biol.15, 10–1186 (2014). [Google Scholar]
- 79.Sayers, E. W. et al. Database resources of the national center for biotechnology information. Nucleic Acids Res.50, D20–D26. 10.1093/nar/gkab1112 (2022). [DOI] [PMC free article] [PubMed] [Google Scholar]
- 80.O’Leary, N. A. et al. Exploring and retrieving sequence and metadata for species across the tree of life with NCBI Datasets. Sci. Data10.1038/s41597-024-03571-y (2024). [DOI] [PMC free article] [PubMed] [Google Scholar]
- 81.Seemann, T. Basic rapid ribosomal RNA predictor. Available online at (2018).
- 82.Quast, C. et al. The SILVA ribosomal RNA gene database project: Improved data processing and web-based tools. Nucleic Acids Res.41, D590–D596 (2012). [DOI] [PMC free article] [PubMed] [Google Scholar]
- 83.Pruesse, E., Peplies, J. & Glöckner, F. O. SINA: Accurate high-throughput multiple sequence alignment of ribosomal RNA genes. Bioinformatics28, 1823–1829. 10.1093/bioinformatics/bts252 (2012). [DOI] [PMC free article] [PubMed] [Google Scholar]
- 84.Capella-Gutiérrez, S., Silla-Martínez, J. M. & Gabaldón, T. trimAl: a tool for automated alignment trimming in large-scale phylogenetic analyses. Bioinformatics25, 1972–1973. 10.1093/bioinformatics/btp348 (2009). [DOI] [PMC free article] [PubMed] [Google Scholar]
- 85.Price, M. N., Dehal, P. S. & Arkin, A. P. FastTree: Computing large minimum evolution trees with profiles instead of a distance matrix. Molecular Biol. Evolut.26, 1641–1650. 10.1093/molbev/msp077 (2009). [DOI] [PMC free article] [PubMed] [Google Scholar]
- 86.Price, M. N., Dehal, P. S. & Arkin, A. P. FastTree 2 – Approximately maximum-likelihood trees for large alignments. PLoS One5, e9490. 10.1371/journal.pone.0009490 (2010). [DOI] [PMC free article] [PubMed] [Google Scholar]
- 87.Xu, S. et al. A serialized data object for visualization of a phylogenetic tree and annotation data. iMeta10.1002/imt2.56 (2022). [DOI] [PMC free article] [PubMed] [Google Scholar]
- 88.Yu, G. Data integration, manipulation and visualization of phylogenetic trees (Chapman and Hall/CRC, 2022). [Google Scholar]
- 89.Wang, L.-G. et al. Treeio: An R package for phylogenetic tree input and output with richly annotated and associated data. Molecular Biol. Evolut.37, 599–603. 10.1093/molbev/msz240 (2020). [DOI] [PMC free article] [PubMed] [Google Scholar]
- 90.Wilkinson, L. (Oxford University Press, 2011).
- 91.Paradis, E. & Schliep, K. ape 5.0: an environment for modern phylogenetics and evolutionary analyses in R. Bioinformatics35, 526–528. 10.1093/bioinformatics/bty633 (2019). [DOI] [PubMed] [Google Scholar]
- 92.Team, R. C. R: A language and environment for statistical computing. Foundation for Statistical Computing, Vienna, Austria (2013).
- 93.Pebesma, E. & Bivand, R. S. Classes and methods for spatial data: the sp package. R News5, 9–13 (2005). [Google Scholar]
- 94.Pebesma, E. & Bivand, R. Spatial data science: With applications in R (Chapman and Hall/CRC, 2023). [Google Scholar]
- 95.Pebesma, E. J. Simple features for R: standardized support for spatial vector data. R J.10, 439 (2018). [Google Scholar]
- 96.Massicotte, P., South, A. & Hufkens, K. rnaturalearth: World map data from natural earth. R package version 0.32 (2023).
- 97.Alagappan, G. & Cowan, R. M. Effect of temperature and dissolved oxygen on the growth kinetics of Pseudomonas putida F1 growing on benzene and toluene. Chemosphere54, 1255–1265 (2004). [DOI] [PubMed] [Google Scholar]
- 98.Leahy, J. G., Johnson, G. R. & Olsen, R. H. Cross-regulation of toluene monooxygenases by the transcriptional activators TbmR and TbuT. Appl. Environ. Microbiol.63, 3736–3739 (1997). [DOI] [PMC free article] [PubMed] [Google Scholar]
- 99.Balcke, G. U. et al. Kinetics of chlorobenzene biodegradation under reduced oxygen levels. Biodegradation19, 507–518 (2008). [DOI] [PubMed] [Google Scholar]
- 100.Nakai, C., Nakazawa, T. & Nozaki, M. Purification and properties of catechol 1, 2-dioxygenase (pyrocatechase) from Pseudomonas putida mt-2 in comparison with that from Pseudomonas arvilla C-1. Arch. Biochem. Biophys.267, 701–713 (1988). [DOI] [PubMed] [Google Scholar]
- 101.Gardner, P. R. et al. Nitric-oxide dioxygenase activity and function of flavohemoglobins: Sensitivity to nitric oxide and carbon monoxide inhibition. J. Biol. Chem.275, 31581–31587 (2000). [DOI] [PubMed] [Google Scholar]
- 102.Kukor, J. J. & Olsen, R. H. Catechol 2, 3-dioxygenases functional in oxygen-limited (hypoxic) environments. Appl. Environ. Microbiol.62, 1728–1740 (1996). [DOI] [PMC free article] [PubMed] [Google Scholar]
- 103.Ishida, T., Tanaka, H. & Horiike, K. Quantitative structure-activity relationship for the cleavage of C3/C4-substituted catechols by a prototypal extradiol catechol dioxygenase with broad substrate specificity. J. Biochem.135, 721–730 (2004). [DOI] [PubMed] [Google Scholar]
- 104.Ridder, L. et al. Quantitative structure/activity relationship for the rate of conversion of C4− substituted catechols by catechol-1, 2-dioxygenase from Pseudomonas putida (arvilla) C1. Eur. J. Biochem.257, 92–100 (1998). [DOI] [PubMed] [Google Scholar]
- 105.Nakajima, H., Tahida, T., Tanaka, H. & Horiike, K. Accurate measurement of near-micromolar oxygen concentrations in aqueous solutions based on enzymatic extradiol cleavage of 4-chlorocatechol: applications to improved low-oxygen experimental systems and quantitative assessment of back diffusion of oxygen from the atmosphere. J. Biochem.131, 523–531 (2002). [DOI] [PubMed] [Google Scholar]
- 106.Sauret-Ignazi, G. et al. Characterisation of a chromosomally encoded catechol 1, 2-dioxygenase (EC 1.13 11.1) from Alcaligenes eutrophus CH34. Archiv. Microbiol.166, 42–50 (1996). [DOI] [PubMed] [Google Scholar]
- 107.Nakai, C., Horiike, K., Kuramitsu, S., Kagamiyama, H. & Nozaki, M. Three isozymes of catechol 1, 2-dioxygenase (pyrocatechase), alpha alpha, alpha beta, and beta beta, from Pseudomonas arvilla C-1. J. Biol. Chem.265, 660–665 (1990). [PubMed] [Google Scholar]
- 108.Kobayashi, T. et al. Overexpression of Pseudomonas putida catechol 2, 3-dioxygenase with high specific activity by genetically engineered Escherichia coli. J. Biochem.117, 614–622 (1995). [DOI] [PubMed] [Google Scholar]
- 109.Kojima, Y. et al. Studies on Pyrocatechase: I. Purification and spectral properties. J. Biol. Chem.242, 3270–3278 (1967). [PubMed] [Google Scholar]
- 110.Cerdan, P., Wasserfallen, A., Rekik, M., Timmis, K. N. & Harayama, S. Substrate specificity of catechol 2, 3-dioxygenase encoded by TOL plasmid pWW0 of Pseudomonas putida and its relationship to cell growth. J. Bacteriol.176, 6074–6081 (1994). [DOI] [PMC free article] [PubMed] [Google Scholar]
Associated Data
This section collects any data citations, data availability statements, or supplementary materials included in this article.
Supplementary Materials
Data Availability Statement
Amplicon sequence datasets presented in this study have been deposited in NCBI SRA database under the BioProject identifier PRJNA1071672.