

Abstract
Transthyretin (TTR) is a natively tetrameric thyroxine transporter in blood and cerebrospinal fluid whose misfolding and aggregation causes TTR amyloidosis. A rational drug design campaign identified the small molecule tafamidis (Vyndamax) as a stabilizer of the native TTR fold, and this aggregation inhibitor is regulatory agency approved for the treatment of TTR amyloidosis. Here we used cryo-EM to investigate the conformational landscape of this 55 kDa tetramer in the absence and presence of one or two ligands, revealing inherent asymmetries in the tetrameric architecture and previously unobserved conformational states. These findings provide critical mechanistic insights into negatively cooperative ligand binding and the structural pathways responsible for TTR amyloidogenesis, underscoring the capacity of cryo-EM to identify pharmacological targets suppressed by the confines of the crystal lattice, opening uncharted territory in structure-based drug design.
Transthyretin amyloidosis (ATTR) is a life-threatening degenerative disease associated with the misfolding and aggregation of the transthyretin (TTR) protein, leading to the accumulation of aggregates, including amyloid fibrils, in the heart, peripheral and autonomic nerves, brain and gastrointestinal tract. Hereditary forms of ATTR (ATTRv), linked to mutations in one TTR allele, destabilize the resulting TTR heterotetramers comprising mutant and WT subunits and hasten dissociation, the rate-limiting step of TTR aggregation. In addition, the aggregation of WT TTR upon aging leads to a life-threatening cardiomyopathy that affects many more patients than ATTRv (ATTRwt), making ATTRwt the third most common amyloid disease behind Alzheimer’s disease and Parkinson’s disease1,2.
TTR is a transporter of thyroid hormone (thyroxine, T4) and holo-retinol-binding protein in blood and cerebrospinal fluid, and there is evidence that TTR may also be involved in nerve regeneration and protein homeostasis3. It was previously shown that TTR amyloid formation is initiated by the dissociation of native tetrameric TTR, followed by monomer misfolding into a misassembly-prone species, although the details of this process remain the subject of debate4. The small molecule tafamidis was found to stabilize the native TTR tetramer by occupying the T4 binding pocket, thereby preventing dissociation, misfolding and aggregation5. Tafamidis-mediated stabilization of TTR was shown to effectively inhibit the amyloidogenesis cascade and stop or slow disease progression, and in 2019 the US Food and Drug Administration approved tafamidis (Vyndaqel and Vyndamax) for the treatment of ATTR-associated heart failure.
Despite this successful structure-based drug design campaign, there remains a notable dearth of structural insights into TTR ligand-binding allostery. Moreover, there is not much structural information on amyloidogenic TTR unfolding intermediates. In this study, we used single-particle cryo-electron microscopy (cryo-EM) to resolve different conformations that TTR adopted in solution. The TTR protomer natively adopts a β-sandwich fold that oligomerizes as a ‘dimer of dimers’ to form a D2-symmetric homotetramer. Two TTR subunits form a dimer via pairing of the ‘H’ β-strands, which connects the hydrophobic cores of the neighboring β-sandwiches (Fig. 1a and Extended Data Fig. 1). The peripheral strands of each β-sandwich fold are ‘capped’ by a structured loop connecting strands D and E (Fig. 1a). A pair of dimers then form the tetramer through four contact points between the A–B and G–H loops of opposing subunits, comprising the two T4 binding sites (Fig. 1a and Extended Data Fig. 1). Tafamidis binds at the two T4 sites to stabilize this weaker dimer–dimer interface (Extended Data Fig. 1), thereby inhibiting tetramer dissociation, which is rate-limiting for the misfolding and misassembly of TTR. Despite the binding pockets being symmetrically equivalent according to previous crystallographic structure determinations, the association constant of tafamidis, T4 and a host of other small molecules is substantially higher (as much as 100-fold) for the first binding event compared with the second5,6. This has led to decades of speculation and dispute regarding the mechanistic source of this negative cooperativity7. The single-particle cryo-EM reconstructions presented in this work shed light on two paramount aspects of TTR biochemistry: the basis of negatively cooperative small-molecule binding and the propensity for amyloidogenic unfolding.
Fig. 1 |. Unliganded tetrameric TTR adopts multiple asymmetric conformations, as determined by cryo-EM.

a, A cartoon ribbon representation of TTR (PDB ID: 1ICT) is colored and labeled by protomer. Regions of the β-sheets that form the ligand binding sites (green ovals) are denoted with more saturated coloring. On the right is an orthogonal view where the individual strands of the A–B dimer are labeled. b, Cryo-EM reconstructions of the canonical, compressed and frayed states of tetrameric TTR (all resolved to ~3.3 Å resolution), colored by subunit. To emphasize the disordering of the B and D subunits in the frayed state, a twofold symmetrized semi-transparent TTR density is underlaid beneath the reconstruction. c, Ribbon representations of β-strands A, D, G and H, which comprise the binding pocket, are shown with transparent cryo-EM density to highlight the quality of the reconstruction in this region. The different dihedral angles between opposing H β-strand angles in the canonical and compressed states are denoted in black text, and the different pocket volumes corresponding to each ligand binding site are labeled in green text. d, Licorice representations of the peptide backbones of the canonical TTR conformation determined by cryo-EM (blue) fit to the closest matching crystallography-based atomic model identified in the PDB (ID: 4PVN, light brown). e, A licorice representation of the peptide backbones of the canonical (blue) and compressed (gold) TTR conformations determined by cryo-EM is superimposed to emphasize the compaction of the structure in the compressed state. f, A ribbon representation of the β-strands shown in c is superimposed to emphasize the differences in β-sheet architecture at the dimer–dimer interface.
Results
TTR adopts multiple conformations with distinct pockets
At 55 kDa, the TTR tetramer is a small target for single-particle cryo-EM analysis, given the theoretical limit of approximately 35 kDa. Initial cryo-EM imaging studies revealed a strong interaction between TTR and the air–water interface, which prevented structure determination of TTR using traditional open-hole transmission electron microscopy (TEM) grids (Supplementary Fig. 1a). To overcome this issue, we used TEM grids modified with a monolayer of crystalline graphene, a technique that has been successful for high-resolution structure determination of other ~50 kDa proteins8. Notably, these cryo-EM studies provided an opportunity to examine the three-dimensional (3D) TTR structure free of crystal packing and enforced symmetry, and thus we did not impose any symmetry constraints to the final reconstructions (Table 2 and Supplementary Figs. 1–3).
Table 2 |.
Cryo-EM data collection, analysis and modeling statistics
| Canonical | Compressed | Frayed | Canonical | Compressed | Compressed | Frayed | |
|---|---|---|---|---|---|---|---|
| PDB ID | 8VE2 | 8VE3 | 8VE4 | 8VE1 | 8VE0 | 8VE5 | 8VE6 |
| EMDB ID | EMD-43162 | EMD-43163 | EMD-43164 | EMD-43161 | EMD-43160 | EMD-43165 | EMD-43166 |
| Data acquisition | |||||||
| Microscope | Talos Arctica | Talos Arctica | Talos Arctica | ||||
| Detector | Gatan K2 Summit | Gatan K2 Summit | Gatan K2 Summit | ||||
| Magnification (nominal/calibrated at detector) | 73,000/88,968 | 73,000/88,968 | 73,000/88,968 | ||||
| Voltage (kV) | 200 | 200 | 200 | ||||
| Defocus range (μm) | −1.0 to −1.5 | −1.0 to −1.5 | −1.0 to −1.5 | ||||
| Total electron exposure (or fluence, e− Å−2) | 55 | 55 | 55 | ||||
| Exposure rate (or flux, e− per pixel per second) | 2.3 | 2.3 | 2.3 | ||||
| Number of frames collected | 50 | 50 | 50 | ||||
| Pixel size (Å) | 0.562 | 0.562 | 0.562 | ||||
| Automation software | Leginon | Leginon | Leginon | ||||
| Data analysis | |||||||
| Number of micrographs used | 3,739 | 3,739 | 3,739 | 4,536 | 4,536 | 7,939 | 7,939 |
| Total number of extracted particles | 1,950,142 | 1,950,142 | 1,950,142 | 1,085,771 | 1,085,771 | 2,650,295 | 2,650,295 |
| Total number of refined particles | 1,301,827 | 1,301,827 | 1,301,827 | 1,030,175 | 1,030,175 | 2,432,152 | 2,432,152 |
| Number of particles in final map | 335,266 | 130,181 | 202,700 | 289,981 | 105,961 | 168,443 | 110,253 |
| Estimated error of translations/rotations | 3.17/0.72 | 2.81/0.60 | 3.02/0.66 | 2.17/0.49 | 2.78/0.64 | 2.82/0.67 | 3.31/0.85 |
| Resolution (Å, unmasked/masked at 0.143 FSC) | 3.7/3.3 | 3.7/3.3 | 3.7/3.3 | 3.0/2.7 | 3.3/3.1 | 3.8/3.4 | 4.4/4.1 |
| Local resolution range (Å) | 3.2–3.9 | 3.2–3.9 | 3.2–3.9 | 2.7–3.3 | 3.1–3.8 | 3.4–4.0 | 4.0–4.8 |
| 3D FSC sphericity value | 0.857 | 0.886 | 0.917 | 0.969 | 0.951 | 0.97 | 0.81 |
| Map sharpening B factor (Å2) | −60 | −55 | −55 | −60 | −60 | −70 | −80 |
| Atomic modeling | |||||||
| Atomic modeling refinement package | PHENIX | PHENIX | PHENIX | PHENIX | PHENIX | PHENIX | PHENIX |
| Model composition | |||||||
| Chains | 4 | 4 | 4 | 5 | 5 | 5 | 5 |
| Nonhydrogen atoms | 3,105 | 3,210 | 3,148 | 3,656 | 3,529 | 3,386 | 3,181 |
| Protein residues | 465 | 466 | 465 | 464 | 464 | 467 | 465 |
| Water | 0 | 0 | 0 | 27 | 0 | 0 | 0 |
| Ligands | 0 | 0 | 0 | A2K: 2 | A2K: 2 | P2C:1 | P2C:1 |
| CCvol/CCmask | 0.75/0.77 | 0.77/0.78 | 0.74/0.75 | 0.83/0.85 | 0.77/0.79 | 0.79/0.81 | 0.79/0.81 |
| B factors (Å2) | |||||||
| Protein | 95.0 | 91.39 | 89.61 | 42.10 | 61.16 | 95.89 | 95.92 |
| Ligands | – | – | – | 30.67 | 47.79 | 83.23 | 68.54 |
| Water | – | – | – | 32.67 | – | – | – |
| Molprobity score18 | 1.27 | 1.83 | 1.38 | 1.1 | 1.35 | 1.45 | 1.76 |
| Clashscore | 5.05 | 11.69 | 6.96 | 2.69 | 6.3 | 7.39 | 9.75 |
| Poor rotamers (%) | 0.00 | 0.00 | 0.00 | 0.00 | 0.00 | 0.0 | 0.0 |
| Ramachandran plot (%) | |||||||
| Outliers | 0.00 | 0 | 0 | 0 | 0 | 0 | 0 |
| Allowed | 1.09 | 3.71 | 1.31 | 2.21 | 0.22 | 2.18 | 3.72 |
| Favored | 98.91 | 96.29 | 98.69 | 97.79 | 99.78 | 97.82 | 96.28 |
| CaBLAM outliers (%) | 1.78 | 1.78 | 1.34 | 1.78 | 0.67 | 2.00 | 2.45 |
| EMRinger score19 | 4.10 | 5.02 | 4.32 | 5.84 | 4.24 | 4.97 | 4.64 |
| Qscore20 | 0.63 | 0.65 | 0.62 | 0.76 | 0.68 | 0.64 | 0.60 |
Data collection and refinement statistics for the unliganded, (Stilbene)2-TTR and (biarylamine-FT2-WT)1(C10A)3 TTR cryo-EM structures.
Unexpectedly, and in stark contrast to previous crystallographic studies, our cryo-EM analyses revealed that unliganded TTR is an asymmetric tetramer in solution. Further, we observed distinct asymmetric conformational states of unliganded TTR, characterized by a shearing motion of the β-sheets along the axis of the weaker dimer–dimer interface bisecting the T4 sites (Fig. 1b,c). One of these asymmetric states, resolved to a global resolution of ~3.3 Å, most closely resembles previously determined crystal structures of TTR, as indicated by the H β-strand dihedral angles (Fig. 1d and Extended Data Fig. 2a) and, thus, will be referred to as the canonical state. We also resolved a previously unobserved conformation, characterized by an accordion-like compression of the tetramer along the axis bisecting the T4 binding pockets (hereafter referred to as the compressed state; Fig. 1b,c and Supplementary Video 1). The β-strands accommodate this compression by undergoing a shearing rearrangement that results in an increase in the dihedral angle between opposingly directed β-strands (Fig. 1c,e).
Intriguingly, we identified a subset of the particles within the compressed-state data that lacked density at the periphery of the β-sandwiches. We refer to this structure as ‘frayed’, since its appearance evokes frayed fabric. The fraying of the density in this state is asymmetric, with the density for the C terminus of strand C and loops flanking strand D being particularly weaker on one side of the tetramer than the other, as indicated by visual inspection and reflected in the B factors (Fig. 1b and Extended Data Fig. 3). We considered the possibility that the loss of density could be arising from partial denaturation at the air–water interface or by graphene interactions, but analysis of two-dimensional (2D) class averages and particle orientation distribution suggested otherwise (Supplementary Note 1). Thus, we attribute the weakened density to greater mobility and entropy of the structural elements in this region.
The observed disordering of strands C and D and their flanking loops in our structures is consistent with conformational rearrangements toward formation of a partially unfolded amyloidogenic state previously hypothesized to be adopted by a TTR monomer upon tetramer dissociation9. It is also consistent with nuclear magnetic resonance (NMR) experiments suggesting that TTR occupies multiple states in solution10, and with H/D exchange experiments showing that the amide NHs in the region of strands C and D exchange faster than core amide NHs11. Local instability and fraying in the C–D region of the protein may increase with mutation, thereby promoting dissociation, followed by aggregation (possibly with aberrant proteolysis). The involvement of these disordered structural elements in the unfolding and aggregation process is supported by the fact that the most common ATTR-associated mutation, V30M, positioned near the N-terminal end of strand B, is located proximal to one of these disordered regions in the frayed state (Extended Data Fig. 4). This mutation of a small amino acid with a high β-strand propensity to a bulky one with lower β-strand propensity probably12 destabilizes the pairing of strands B and C in a region that we observe to already be labile in wild-type TTR. In the context of a dissociated monomer, a destabilizing V30M mutation would probably further promote unfolding, exacerbating irreversible aggregation, including amyloid formation. Another ATTR-associated mutation, L55P, is likely to abolish pairing between strands D and A to drive unfolding and aggregation through a similar mechanism (Extended Data Fig. 4). Observation of this proposed amyloidogenic intermediate in our ligand-free TTR tetramer strongly supports this mechanism of amyloidogenesis, which was initially proposed over 30 years ago13. The distinct TTR tetramers captured during sample preparation for cryo-EM are probably in rapid exchange in solution. Thus, processes that occur on slower timescales, such as rate-limiting dissociation followed by chemical denaturation or subunit exchange, remain rigorously monoexponential6.
The asymmetric structural arrangement of the frayed TTR tetramer prompted us to further investigate the asymmetry within the canonical and compressed TTR conformations. Nearly all of the more than 200 available crystallographically derived TTR structures were based on crystallization in the P21212 space group, with the dimer as the asymmetric unit and a crystallographic symmetry axis running through the T4 binding pockets (Fig. 1a, green ovals), giving rise to binding pockets of equivalent size and shape. In contrast to these crystal structures, the calculated volume of the binding cavities in each of our unliganded TTR tetramer structures are notably different from one another. Whereas the binding pockets within each tetramer differ by ~6%, the compressed and frayed states each contain binding pockets that are up to 5% larger in volume than those in the canonical state (Fig. 1c, Extended Data Fig. 5 and Supplementary Note 2). Together, these data confirm an inherent asymmetry of the native TTR tetramer assembly that, combined with conformational variation, gives rise to a range of structurally and chemically distinct T4 binding pockets, which may explain the previously established differences in binding affinity of ligands for the two TTR binding sites, as well as the capacity of TTR to bind diverse small-molecule structures.
TTR with a ligand in each pocket maintains asymmetry
We sought to further investigate by cryo-EM how ligand binding to both T4 binding sites influences the TTR tetramer. For this, we examined TTR tetramers that were stabilized by covalent attachment of a stilbene substructure to one of the two Lys15 ε-amino groups within both T4 binding pockets (see Supplementary Fig. 4 for a line drawing of the (Stilbene)2-TTR conjugate and Supplementary Note 3)14. Crystallography has historically prevented visualization of asymmetry between the two different TTR binding sites, given that the crystallographic symmetry axis runs through the T4 binding pockets. This is compounded by degeneracy that arises from each binding site (Fig. 1a and Extended Data Fig. 1, showing one site formed by chains A and C and the other by chains B and D) due to the inherent twofold symmetry of the binding pockets. Our cryo-EM image analysis workflow enabled us to examine any asymmetry in the organization of the subunits that comprise the TTR tetramer, as well as in the positioning of the tethered stilbene substructures within the two T4 binding sites (Fig. 2 and Supplementary Figs. 5–7).
Fig. 2 |. Asymmetric binding pose of stilbene tethered to both TTR binding pockets.

a, Orthogonal views of the cryo-EM reconstructions of the canonical (above) and compressed (below) conformations of TTR, resolved to ~2.7 and ~3.0 Å resolution, respectively, colored by subunit as in Fig. 1. The center image is a cross-sectional view of the cryo-EM density showing the density corresponding to the covalently bound ligand (green). b, The cryo-EM density of each stilbene moiety in the binding pockets of the canonical state reconstruction is shown as a mesh with the atomic model shown as a stick model. The stilbene covalently attached to Lys15 of chain C in the A–C binding pocket (top) is better resolved as a single conformation than the stilbene in the B–D binding pocket (bottom). c, Ribbon representations of β-strands A, D, G and H along with the stick representation of the bound stilbene ligand as a green stick representation are shown with transparent cryo-EM density to highlight the quality of the reconstruction in this region. The different H β-strand dihedral angles in the canonical and compressed states are denoted. To the right, a cutaway view of the surface representation of the ligand binding pockets with the stilbene ligand as a green stick representation is shown, with the different pocket volumes denoted in green text. d, A ribbon representation of the β-strands shown in c is superimposed to emphasize the differences in β-sheet architecture at the dimer–dimer interface.
We expected that covalent tethering of the stilbene ligand within both binding pockets would stabilize a single symmetric conformation, structurally consistent with previous TTR crystallographic studies. Surprisingly, our cryo-EM data revealed that the (Stilbene)2-TTR conjugate similarly adopts the asymmetric canonical and compressed conformations as previously observed in the unliganded TTR dataset (Extended Data Fig. 2b). However, we were unable to identify the presence of the frayed state in the (Stilbene)2-TTR dataset, indicating that ligand binding in both T4 binding sites stabilizes the C and D strands of the tetramer. Notably, we were able to unambiguously distinguish the precise asymmetric pose of the stilbene ligand covalently linked to one of the two Lys15 ε-amino side chains in the smaller binding pocket (comprising subunits A and C) in the canonical state (Fig. 2a,b and Extended Data Fig. 6). We also noted that the quality of the covalently bound stilbene density worsens as the size of the binding pocket increases, indicating that the ligand is more flexible in the larger binding pocket made up by the B and D subunits (Fig. 2b and Extended Data Fig. 7). This observation is supported by molecular dynamics simulations showing greater mobility of the ligand and nearby backbone in the larger T4 pocket of the canonical conformer (Supplementary Fig. 8 and Supplementary Note 4). Although the pockets in the (Stilbene)2-TTR tetramers had a smaller volume than in the corresponding unliganded TTR conformers, the difference is probably due to distinct side-chain positions in the presence or absence of ligand, as the interchain distances around the pocket are preserved whether liganded or not (Extended Data Figs. 5 and 7). These cryo-EM structures confirm that, even in the presence of a covalently bound stabilizing ligand at both of the T4 sites, the TTR tetramer is an asymmetric entity that adopts different conformations and that variability in the size of the T4 binding pockets correlates with the flexibility of the bound ligand.
Cryo-EM structures of TTR bound to a single ligand
One of TTR’s most prominent characteristics is the negative cooperativity with which it binds small-molecule ligands. With the unliganded and (Stilbene)2-TTR conjugate structures in hand, we next aimed to shed light on the mechanism of negative cooperativity by imaging a TTR complex engineered to produce a homogeneous population of TTR tetramers disulfide-tethered to a biarylamine ligand in only one of the two T4 binding sites6. Thus, we synthesized ((biarylamine-FT2-WT)1(C10A)3) TTR (Supplementary Fig. 9), hereafter referred to as single-liganded TTR (where FT2 is a double Flag-tag.) In brief, we synthesized and purified a (FT2-WT)1(C10A)3 TTR tetramer, wherein only the single FT2-WT subunit harbors a Cys-10 residue that was quantitatively labeled with 2-((3,5-dichloro-4-(2-(2-(2-(pyridin-2-yldisulfaneyl) ethoxy)ethoxy)ethoxy)phenyl)amino)benzoate to covalently position a 2-(3,5-dichlorophenylamino)benzoic acid stabilizer in only one of the two TTR T4 binding sites. Covalent occupancy of one T4 site with a stabilizing ligand prevents subsequent scrambling of subunits by tetramer dissociation followed by subunit exchange6. Accordingly, our cryo-EM reconstructions of this sample contained ligand density exclusively present in one binding pocket (Fig. 3, Extended Data Fig. 8 and Supplementary Figs. 10–13). Surprisingly, we did not observe the canonical state in the single-liganded TTR sample, instead only observing the compressed and frayed states (Fig. 3). As observed in the unliganded TTR dataset, fraying is seen only in the presence of a compressed sheet state, indicating that fraying is dependent on sheet compression (Supplementary Note 5). This relationship between disordering of certain regions and the tertiary organization of the sheets is further supported by previously published NMR studies, where the mutants V30M and L55P (Extended Data Fig. 4), located at the peripheral edge of the β-sandwich, affect the chemical environment of the rest of the β-sheet3. In this context, the region around β-sheet D could be thought of as a linchpin that, once disengaged, leads to sheet compression and the observed compressed state (Supplementary Note 5).
Fig. 3 |. Asymmetric single-liganded TTR structures determined by cryo-EM.

a, Cryo-EM reconstructions of the (biarylamine-FT2-WT)1(C10A)3 TTR compressed state (determined to ~3.4 Å resolution), colored by subunit. On the right is a cross-sectional view of the cryo-EM density showing the density corresponding to the single bound ligand (green) in the A–C binding pocket, while the B–D binding pocket is empty. b, The cryo-EM density corresponding to the area denoted by the dashed box in a is shown as a mesh with the atomic model shown as a stick model. The pocket volume of each binding site is denoted in green text. c, A cryo-EM reconstruction of the (biarylamine-FT2-WT)1(C10A)3 TTR compressed frayed state (determined to ~4.1 Å resolution), colored by subunit. d, A cross-sectional view of the cryo-EM density showing the density corresponding to the single-bound ligand (green) in the A–C binding pocket, while the B–D binding pocket, which is associated with the less-ordered protomers, is empty.
The previously published crystal structure of this (biarylamine-FT2-WT)1(C10A)3 TTR contains ligand density in both pockets owing to averaging across the crystal lattice, and TTR is in an intermediate conformation between canonical and compressed, with opposing H strand dihedral angles of 105° and 110° (ref. 6). Considering the asymmetry distinguishing the two T4 binding sites observed across the seven reconstructions of TTR in this study, it is evident that the TTR pockets are inherently asymmetric and malleable. Subtle changes in the positions of the β-strands within the TTR tetramer are linked to the varied volume and chemical environments of the T4 binding sites, explaining the ability of TTR to bind a host of distinct small-molecule structures with varying affinities (Supplementary Note 6). In this context, we speculate that the higher overall symmetry of the canonical state, as quantified by the similarity of H-strand cross angles across the dimers (Extended Data Fig. 2), is responsible for its prevalence in crystallographic studies.
Discussion
Many homo-oligomeric proteins bind their ligands with negative cooperativity, a phenomenon that has been proposed to endow these proteins with the capacity to respond to a range of ligands that are present at widely varying concentrations. Accordingly, TTR is known to bind a diverse array of chemicals, a characteristic that has been proposed to enable the tetramer to function as a broadly functioning detoxification agent15. Negative cooperativity is generally understood in terms of the Koshland–Némethy–Filmer sequential binding model, in which the first ligand binding event allosterically induces asymmetry in the complex that reduces compatibility for a second binding event. Although it is generally assumed that unliganded homooligomers such as TTR are symmetric in nature, we show that structural asymmetry with distinct ligand binding pockets is inherent to the TTR tetramer, with or without bound ligands (Extended Data Fig. 9). Thus, the entropic penalty associated with ligand binding is likely to be different for each binding pocket, both within a single tetramer and across conformational states.
The TTR protomers comprising the ligand-bound pocket of our single-liganded TTR reconstructions are better ordered than the protomers forming the unoccupied pocket, as indicated by B factors in both the compressed and frayed conformations (Supplementary Fig. 13). Given that a frayed state is observed in both the single-bound TTR and unliganded TTR datasets, but not in the (Stilbene)2-TTR conjugate dataset, we reason that the second ligand binding event has a generally less negative ΔG due to a greater loss of chain entropy upon binding. Our unliganded and (biarylamine-FT2-WT)1(C10A)3 TTR datasets suggest that the disordered regions associated with the frayed state can become ordered, but we expect that this ordering would incur an entropic cost. As outlined in Fig. 4, we propose that the initial ligand binding event would occur in the ordered half of TTR without incurring this entropic penalty, whereas the second binding event must be coupled to substantial ordering, especially in the region around the D β-strand. Previous thermodynamic experiments support this hypothesis, in that the entropic contribution to the binding ΔG is generally less favorable for the second ligand binding event3,16,17. The strongly negatively cooperative binding of ligands to TTR in blood is of unknown physiological benefit, but this feature is a crucial aspect of tafamidis’ role as an aggregation inhibitor to ameliorate TTR amyloidosis. Negative cooperativity allows a single equivalent of tafamidis to nearly fully occupy one of TTR’s binding sites, instead of yielding a mixture of unbound, single-bound and double-bound complexes. This is notable, since the binding of one site is sufficient to stabilize the TTR tetramer against dissociation, the rate-limiting step of TTR aggregation6. Given this circumstance, a second small-molecule kinetic stabilizer designed to interact preferentially with the second expanded thyroid hormone binding site observed in the structure of (biarylamine-FT2-WT)1(C10A)3 TTR when used in combination with tafamidis could, in principle, afford better kinetic stabilization of TTR tetramers than those designed on the basis of the symmetrized structures observed by X-ray crystallography, especially for unstable mutant heterotetramers.
Fig. 4 |. A schematic outlining the conformational landscape of TTR and how it is influenced by ligand binding.

A cartoon representation of the TTR tetramer is colored by subunit as in other figures, with the ligand represented as a diamond. In the absence of ligand, the TTR tetramer adopts an equilibrium of conformational states described in this work, with some fraction of the tetramer having a propensity to dissociate into dimers, which could subsequently further dissociate and aggregate. A small-molecule ligand can bind one of the two available binding pockets in the TTR tetramer. This binding occurs without incurring a substantial entropic cost, as the ligand binds to the distinct binding pocket that more readily accommodates the interaction. This single ligand binding event is sufficient to increase the stability of the dimer–dimer interactions, lowering the propensity for dimer dissociation and aggregation. The next binding event by the same ligand will incur a much larger entropic cost, as the remaining binding pocket requires structural rearrangements to accommodate the ligand. Furthermore, stabilization of the dimer–dimer interfaces induces an ordering of the loops associated with the frayed state, which comes with an entropic cost.
It is not yet possible to explain why WT TTR dissociates, misfolds and aggregates in about 10% of the elderly, leading to cardiomyopathy and peripheral neuropathy. We can now explore whether an aging-associated change in the distribution of the canonical, compressed and frayed states, or the population of a new TTR state, could render a subpopulation of WT TTR amyloidogenic.
Our findings highlight the role of the inherent asymmetry in the quaternary structure of TTR and the asymmetric rearrangements occurring upon ligand binding to the second T4 binding site (properties either averaged or suppressed in previous crystallographic studies) to explain the basis of TTR’s negatively cooperative ligand binding. We present previously unobserved TTR tetramer conformations, including a frayed state that could be prone to aberrant proteolysis and aggregation (Extended Data Fig. 10), particularly if the population of this state increased upon aging, for example due to proteostasis network deficiencies. Our observations suggest that proteins exhibiting apparently symmetrical quaternary structures could benefit from being reexamined by single-particle cryo-EM to discern whether less-populated or asymmetric states exist natively. Given that TTR was used to exemplify structure-based drug design, the potential of single-particle cryo-EM studies to upend our understanding of structural biology should be considered, even for proteins that have been historically considered too small to visualize using these methods or that have been studied for decades and where fundamentally new insights were not expected.
Methods
Batch preparation of gold-substrate grids for coating with graphene
We applied graphene to 24 R1.2/1.3 or R0.6/1.0 UltrAuFoil holey gold grids using an established protocol21 where the grids were washed by submersion in ~100 ml of chloroform while slowly stirring on an orbital shaker for 30 min. This washing step was carried out in a crystallizing dish covered with tin foil, with grids placed at the bottom, on a clamping TEM aluminum grid holder block (PELCO brand, purchased from Ted Pella prod. 16830–45) without the lid on. Two more washes were carried out in the same manner, first with acetone and subsequently with isopropanol. Between washes, grids were quickly transferred by initially placing the holder lid on the submerged lower half of the holder and scooping the assembly out with a metal fork bent to form an upright scoop, then submerging the assembly into the next organic solvent bath at an angle of ~45° to avoid bubble formation at the bottom. Finally, the lid was removed by pulling it up by the central holes with 8-inch stainless-steel tweezers with curved pointed serrated tips. After the final isopropanol bath, grids were picked up one by one and left to dry on air on filter paper for 15 min. Grids were then immediately coated with monolayer graphene.
Preparation of ~1.5 × 1.5 cm graphene film for coating of gold-substrate grids
A 15 × 15 cm graphene film generated through chemical vapor deposition on a Cu was purchased from Graphenea. To transfer a single layer of graphene to gold-support TEM grids, the purchased film was coated with methyl methacrylate (MMA, ‘MMA EL 6’ from Kayaku Advanced Materials, M310006 0500L1GL) using a homemade spin coater8. The large chemical vapor deposition film on Cu was cut into small squares that fit the spin coater glass slide (~1.5 × 1.5 cm). Before MMA coating, filter paper was placed between the bottom of the Cu–graphene stack and the spin coater glass slide to prevent MMA from seeping under and coating the Cu from the bottom. Once coated, the MMA–graphene–Cu stack was placed Cu-side-up on a glass slide and plasma cleaned for 20 s at 25 W (75% argon/25% oxygen atmosphere) using a Solarus plasma cleaner (Gatan). To etch the Cu layer, the MMA-coated and plasma-cleaned stack was floated MMA-side-up on 200 ml of freshly made 200 mM ammonium persulfate in a crystallizing dish for 3 h. For rinsing, the graphene–MMA film was carefully picked up with a glass slide and transferred to a new crystallization dish with 200 ml of MilliQ water for 1 h. Immediately after that, the film was used to coated grids. The leftover uncoated graphene was stored in the dark and under vacuum.
Batch coating of gold-substrate grids with monolayer graphene
Right after cleaning, the grids were submerged in water inside a grid coating trough (LADD Research Industries, Smith Grid Coating Trough 10840) on a small filter paper square that was cut to fit the metal tray of the trough. Grids were placed very closely to one another, forming as tight a square array as possible. The rinsed MMA–graphene film was then floated onto the trough’s water surface. Using a pair of glass Pasteur pipettes whose tips had been closed by melting, we aligned the MMA–graphene film and grids. By extracting water with the syringe attached to the trough and guiding the MMA–graphene film as the water level went down, we coated 12–24 grids at the same time. The coated grids were left to dry for 30 min and then further dried at 65 °C for another 30 min. After letting the grids cool down at room temperature for 5 min, we proceeded to remove the MMA layer by rinsing grids in a series of organic solvents, using the same setup as for the initial grid cleaning. We used two baths of acetone for 30 min each, then a final isopropanol bath for 30 min. Grids were left to dry at room temperature on filter paper for 10 min and then stored in the dark under vacuum until use. Grids were used up to 1 month later without noticeable issues.
UV–ozone treatment of monolayer graphene grids
To allow the monolayer graphene to take aqueous sample, we treated the graphene grids with UV–ozone using the T10×10 system from Ultraviolet Ozone Cleaning Systems Inc.8,21. To achieve consistent performance, we followed the manufacturers’ instructions and carried out a 10 min ‘warmup’ run before immediately inserting and treating grids for 4 min.
Expression and purification of WT, C10A and FT2-WTTetrameric TTR
Expression of WT tetrameric TTR.
BL21 (DE3) competent Escherichia coli (New England BioLabs, #C2527H) were transformed with the pMMHa vector encoding the WT TTR gene. The transformed cells were selected by growing them on agar plates containing 100 μg ml−1 ampicillin at 37 °C. E. coli starter cultures were initiated by taking a single colony from the agar plate and culturing it in 50 ml Luria–Bertani (LB) medium in a 250 ml shake flask containing 100 μg ml−1 ampicillin at 37 °C. These cultures were grown at 37 °C with shaking until bacterial growth indicated by turbidity in the medium was observed. The expression cultures were prepared by inoculating a 1 l shake flask containing 100 μg ml−1 ampicillin with a 1:20 dilution of the starter cultures. The expression cultures were grown at 37 °C until an optical density at 600 nm (OD600) reached approximately 0.5, at which point they were induced with 1 mM isopropyl-β-d-thiogalactopyranoside (IPTG) and incubated overnight at 30 °C with shaking. These cultures were then collected by centrifugation at 4,355g for 30 min at 4 °C. The supernatants were removed, and the pellets were stored at −80 °C until ready for subsequent purification steps.
Expression of C10A tetrameric TTR.
BL21 (DE3) competent E. coli (New England BioLabs, #C2527H) were transformed with the pMMHa vector encoding the C10A TTR gene. The transformed cells were selected by growing them on agar plates containing 100 μg ml−1 ampicillin at 37 °C. E. coli starter cultures were initiated by taking a single colony from the agar plate and culturing it in 50 ml LB medium in a 250 ml shake flask containing 100 μg ml−1 ampicillin at 37 °C. These cultures were grown at 37 °C with shaking until bacterial growth indicated by turbidity in the medium was observed. The expression cultures were prepared by inoculating a 1 l shake flask containing 100 μg ml−1 ampicillin with a 1:20 dilution of the starter cultures. The expression cultures were grown at 37 °C until OD600 was approximately 0.5, at which point they were induced with 1 mM IPTG and incubated overnight at 30 °C with shaking. These cultures were then collected by centrifugation at 4,355g for 30 min at 4 °C. The supernatants were removed, and the pellets were stored at −80 °C until ready for subsequent purification steps.
Expression of FT2-WT tetrameric TTR.
BL21 (DE3) competent E. coli (New England BioLabs, #C2527H) were transformed with the pET-29a vector encoding the N-terminal dual-Flag-tagged WT TTR gene. The transformed cells were selected by growing them on agar plates containing 50 μg ml−1 kanamycin at 37 °C. E. coli starter cultures were initiated by taking a single colony from the agar plate and culturing it in 50 ml LB medium in a 250 ml shake flask containing 50 μg ml−1 kanamycin. These cultures were grown at 37 °C with shaking until bacterial growth indicated by turbidity in the medium was observed. The expression cultures were prepared by inoculating a 1 l shake flask containing 50 μg ml−1 kanamycin with a 1:20 dilution of the starter cultures. The expression cultures were grown at 37 °C until OD600 was approximately 0.5, at which point they were induced with 1 mM IPTG and incubated overnight at 30 °C with shaking. These cultures were then collected by centrifugation at 4,355g for 30 min at 4 °C. The supernatants were removed, and the pellets were stored at −80 °C until ready for subsequent purification steps.
Purification of tetrameric TTR.
The pellets were thawed and resuspended with 50 ml Tris-buffered saline with an added protease inhibitor tablet (Thermo Scientific Pierce Protease Inhibitor Tablets EDTA-Free, #A32965), followed by three cycles of probe sonication (Qsonica Q125; 3 min sonication/3 min rest at 4 °C). The supernatants were collected with centrifugation at 27,216g for 30 min, subjected to 50% ammonium sulfate precipitation (w/v) and stirred for 45 min at room temperature; then, supernatant was collected via centrifugation at 27,216g for 30 min at 4 °C. The supernatants were further precipitated with 90% ammonium sulfate (w/v) and stirred for 45 min at 25 °C (room temperature). The solutions were then centrifuged, and the pellets were collected and dialyzed with 3,500 molecular weight cutoff dialysis tubing (SnakeSkin Dialysis Tubing, #68035) overnight against 25 mM Tris pH 8.0 buffer in a 4 °C cold room.
The protein mixtures were filtered using a low-protein-binding filter (Millipore Sigma) and purified on a SourceQ15 anion exchange column (Cytiva) at a flow rate of 2 ml min−1. Protein mixtures were injected at 5% Buffer A (25 mM Tris pH 8.0) and eluted over a 60 min gradient up to 100% Buffer B (25 mM Tris and 1.0 M NaCl) at room temperature. The eluates were then subjected to further purification step using a Superdex 75 gel filtration column. TTR proteins were eluted with 10 mM sodium phosphate pH 7.6 and 100 mM KCl, confirmed for purity and mass by liquid chromatography–mass spectrometry (LC–MS), aliquoted and stored at −80 °C.
Subunit exchange to generate (FT2-WT)1(C10A)3 TTR tetramer
Subunit exchange between recombinant C10A TTR (40 μM) and recombinant dual-Flag-tagged WT (20 μM) was carried out by adding stocks of each TTR variant to the same buffer sample and incubating the sample for 2 days. Subsequently, the sample was injected into a 4.6 × 100 mm Waters Protein-Pak Hi-Res Q ion exchange column (5 μm particle size) using Buffer A (25 mM Tris pH 8.0) as mobile phase in a Waters Ultra-Performance Liquid Chromatography system. The sample was eluted using a linear gradient 24–39% Buffer B (25 mM Tris pH 8.0 and 1.0 M NaCl) with a flow rate of 0.5 ml min−1, in which separation of the five peaks resulting from subunit exchange was observed. The second peak, which corresponds to (FT2-WT)1(C10A)3 TTR, was isolated and confirmed for purity via high-performance liquid chromatography. The concentration of (FT2-WT)1(C10A)3 TTR was determined using NanoDrop based on the molar absorptivity (ε = 75,829 M−1 cm−1). The purified heterotetramer was stored at −80 °C.
Modification of (FT2-WT)1(C10A)3 TTR tetramer with biarylamine 7
Previously purified (FT2-WT)1(C10A)3 (40 μM) was reacted with a tenfold molar excess of biarylamine 7 for 2 h at room temperature (25 °C) with occasional vortexing. The samples were then purified using a Microcon 3,000 molecular weight cutoff centrifugal filter column (Milipore Sigma) spun at 13,523g (4 °C). The identity of the conjugate eluting ((biarylamine-FT2-WT)1(C10A)3 TTR, also referred to as single-bound TTR) was then confirmed using liquid chromatography coupled to time-of-flight mass spectrometry (Agilent LC/MS TOF) using an Agilent Zorbax 300SB-C8 4.6 × 50 mm column, confirming that only the dual-Flag-tagged WT TTR peak was modified by biarylamine 7. (C10A TTR 13,860 Da, FT2-WT TTR 15,882 Da, FT2-WT + biarylamine 7 minus the 2-thiopyridine leaving group = 16,325 Da)
Synthesis of small-molecule covalent modifier 2-((3,5-dichloro-4-(2-(2-(2-(pyridin-2-yldisulfaneyl)ethoxy)ethoxy)ethoxy)phenyl)amino)benzoate biarylamine 7
Synthesis of the covalent small molecule 7 was adapted from the synthetic route previously published and described below6.
General synthetic procedures.
All starting materials and solvents were purchased commercially from Sigma-Aldrich, Acros, Alfa Aesar, Combi-blocks and EMD Millipore and were used without further purification. Thin-layer chromatography was carried out using Merck silica plates (60-F254), using UV light for visualization to monitor reaction progress. LC–MS was performed using a ZORBAX RRHT StableBond C18, 2.1 × 50 mm, 1.8 μm column (Agilent Infinity; mobile phase A, 0.1% formic acid in H2O; mobile phase B, 0.1% formic acid in MeCN) coupled to an Agilent G6125B single-quadrupole mass spectrometer (Agilent Infinity) to monitor reaction progress. Flash column chromatography was carried out using a Teledyne Isco Combiflash Nextgen 300+ machine using Luknova SuperSep columns (SiO2, 25 μm) with ethyl acetate and hexanes used as eluents. 1H NMR spectra were recorded on Bruker 400 or 500 MHz spectrometer. Characterization data are reported as follows: chemical shift, multiplicity (s, singlet; d, doublet; t, triplet; q, quartet; br, broad; m, multiplet), coupling constants and number of protons.
4-Benzyloxy-3,5-dichloroaniline (compound 3).
Di-tert-butyl dicarbonate (11 mmol, 2.4 g, 1.1 equiv.) was added dropwise to a stirring solution of 4-amino-2,6-dichlorophenol (10 mmol, 1.96 g, 1.0 equiv.) in 50 ml tetrahydrofuran (THF). The resulting solution was refluxed for 12 h before concentration in vacuo. The crude solid was dissolved in dimethylformamide before addition of potassium carbonate (20 mmol, 2.76 g, 2.0 equiv.) and tetra-n-butylammonium iodide (1 mmol, 369 mg, 0.1 equiv.). Benzyl bromide (1 mmol, 1.78 ml, 1.5 equiv.) was added dropwise to the stirring solution and stirred at room temperature for 1 h. Upon reaction completion as discerned by thin layer chromatography, the solution was diluted with NH4Cl and water and extracted with ethyl acetate (EtOAc) (3 × 100 ml). The combined organics were concentrated, and in the same flask, 30% trifluoroacetic acid in dichloromethane was added dropwise. After stirring for 1 h, the solution was neutralized with NaCO3 and saturated NaHCO3, extracted with EtOAc (3 × 50 ml) and concentrated. Flash column chromatography purification (SiO2, 4:1 hexanes:EtAOc) afforded 4-benzyloxy-3,5-dichloroaniline as a white powder (1.1 g, 41% yield). 1H NMR (500 MHz, CDCl3) δ 7.58 (d, J = 7.4 Hz, 2H), 7.42 (t, J = 7.4 Hz, 2H), 7.38 (d, J = 7.3 Hz, 1H), 6.66 (s, 2H), 4.97 (s, 2H), 3.56 (s, 2H) (Supplementary Fig. 15).
tert-Butyl 2-((4-(benzyloxy)-3,5-dichlorophenyl)amino)benzoate (compound 4).
Compound 3 (0.5 mmol, 134 mg, 1.0 equiv.), tert-butyl 2-bromobenzoate (0.6 mmol, 116 μL,1.2 equiv.), cesium carbonate (0.7 mmol, 228 mg, 1.4 equiv.) and RuPhos Pd G3 (0.05 mmol, 41.8 mg, 0.1 equiv.) were dissolved in toluene under argon. After refluxing under inert atmosphere for 24 h, the reaction was filtered through celite and concentrated in vacuo. Flash column chromatography purification (SiO2, 95:5 hexanes:EtAOc) afforded tert-Butyl 2-((4-(benzyloxy)-3,5-dichlorophenyl)amino)benzoate as a yellow solid (96 mg, 43%). 1H NMR (500 MHz, CDCl3) δ 9.57 (s, 1H), 7.93 (dd, J = 8.0, 1.7 Hz, 1H), 7.60–7.55 (m, 2H), 7.44–7.40 (m, 2H), 7.36 (ddt, J = 10.2, 4.9, 1.5 Hz, 3H), 7.24 (dd, J = 8.5, 1.1 Hz, 1H), 7.22 (s, 2H), 6.80 (ddd, J = 8.1, 7.1, 1.1 Hz, 1H), 5.03 (s, 2H), 1.61 (s, 9H) (Supplementary Fig. 16).
tert-Butyl 2-((3,5-dichloro-4-hydroxyphenyl)amino)benzoate (compound 5).
Compound 4 (0.2 mmol, 90 mg, 1 equiv.) and 10% palladium on carbon (0.017 mmol, 18 mg, 0.09 equiv.) were dissolved in a 1:1 MeOH:EtOAc mixture and stirred under an H2 atmosphere balloon for 5 h. Upon observation of complete consumption of the starting material by thin layer chromatography, the reaction was diluted with dichloromethane, filtered through celite and concentrated in vacuo. Flash column chromatography purification (SiO2, 5:1 hexanes:EtOAc) afforded tert-butyl 2-((3,5-dichloro-4-hydroxyphenyl)amino)benzoate as a yellow solid (70 mg, 98% yield). The physical and spectral data are consistent with those reported previously6.
S-(2-(2-(2-hydroxyethoxy) ethoxy) ethyl) ethanethioate (compound iii).
Thioacetic acid (5 mmol, 350 μl, 1 equiv.) and potassium carbonate (5 mmol, 690 mg, 1 equiv.) were dissolved in anhydrous dimethylformamide (10 ml) and stirred for 10 min. To the resulting solution 2-(2-(2-bromoethoxy)ethoxy)ethan-1-ol (4.7 mmol,1.065 g, 0.95 equiv.) was added dropwise before stirring at 40 °C for 2 h. The solvent was removed under reduced pressure and crude residue purified by flash column chromatography (SiO2, 1:1 hexanes:EtOAc) to give a clear yellow oil (755 mg, 77% yield). 1H NMR (400 MHz, CDCl3) δ 3.67 (dd, J = 5.4, 3.8 Hz, 2H), 3.64–3.51 (m, 8H), 3.04 (t, J = 6.5 Hz, 2H), 2.28 (s, 3H) (Supplementary Fig. 17).
tert-Butyl 2-((4-(2-(2-(2-(acetylthio) ethoxy) ethoxy) ethoxy)-3,5-dichlorophenyl) amino) benzoate (compound 6).
Diisopropyl azodicarboxylate (80.8 μl, 0.4 mmol, 2 equiv.) and triphenylphosphine (104.8 mg, 0.4 mmol, 2 equiv.) were dissolved in 4 ml anhydrous THF and stirred for 30 min at room temperature. After 30 min, compounds 5 (70 mg, 0.2 mmol, 1 equiv.) and iii (83.2 mg, 0.4 mmol, 2 equiv.), each dissolved in 0.2 ml THF, were added dropwise and stirred at room temperature for 2 h. The reaction was concentrated in vacuo, and the crude residue was purified by column chromatography (SiO2, 4:1 Hex:EtOAc) to afford yellow syrup (35.4 mg, 32.6% yield). 1H NMR (400 MHz, ACETONE-D6) δ 9.47 (s, 1H), 7.91 (dd, J = 8.0, 1.7 Hz, 1H), 7.41 (ddd, J = 8.7, 7.1, 1.7 Hz, 1H), 7.32–7.23 (m, 3H), 6.83 (ddd, J = 8.1, 7.0, 1.1 Hz, 1H), 4.15 (dd, J = 5.6, 4.1 Hz, 2H), 3.86–3.80 (m, 2H), 3.68–3.61 (m, 2H), 3.61–3.49 (m, 4H), 3.02 (t, J = 6.5 Hz, 2H), 2.27 (s, 3H), 1.58 (s, 9H) (Supplementary Fig. 18).
2-((3,5-Dichloro-4-(2-(2-(2-(pyridin-2-yldisulfaneyl)ethoxy)ethoxy)ethoxy)phenyl)amino)benzoate (biarylamine 7) (step 7).
Compound 6 (22.5 mg, 0.0414 mmol, 1 equiv.) and 2,2′-dithiopyridine (11 mg, 1.2 equiv., 0.05 mmol) were dissolved in 1 ml anhydrous THF under an argon atmosphere. To the resulting solution was added freshly prepared NaOMe in THF (110 μl, 1.2 equiv., 0.05 mmol) dropwise at 0 °C. The reaction was allowed to warm to room temperature over 2 h before diluting with EtOAc and sequential brine and water washes. The combined organic extracts were removed under reduced pressure before addition of 1 ml trifluoroacetic acid. After stirring at room temperature for 2 h, the solvent was removed under reduced pressure and the final compound biarylamine 7 was purified via preparative high-performance liquid chromatography (6.2 mg, 27% yield over two steps). 1H NMR (500 MHz, dimethyl sulfoxide (DMSO)) δ 9.49 (s, 1H), 8.44 (dd, J = 4.8, 1.5 Hz, 1H), 7.92 (dd, J = 8.0, 1.7 Hz, 1H), 7.87–7.80 (m, 2H), 7.46 (ddd, J = 8.7, 7.1, 1.7 Hz, 1H), 7.34 (s, 2H), 7.27–7.19 (m, 2H), 6.89 (t, J = 7.5 Hz, 1H), 4.12–4.07 (m, 2H), 3.81–3.75 (m, 2H), 3.67–3.58 (m, 4H), 3.51 (dd, J = 5.8, 3.6 Hz, 2H), 3.03 (d, J = 12.1 Hz, 2H) (Supplementary Fig. 19).
Crystallization and structure determination of (Stilbene)2-TTR
Crystals of (Stilbene)2-TTR were grown with the covalent kinetic stabilizer 4-fluorophenyl 3-[(E)-2-(4-hydroxy-3,5-dimethylphenyl)ethenyl] benzoate (A93, Protein Data Bank (PDB) 3HJ0)22. Data were collected at beamline 5.0.1 at the Advanced Light Source (Berkeley, CA) at a wavelength of 0.97741 Å and a temperature of 100 K. Frames were indexed and integrated using the X-ray Detector Software (XDS) program package23, the space group was assigned as P21212 using Pointless and data were scaled using Scala, which are part of the CCP4 software24. Five percent of reflections (randomly distributed) were flagged for model cross-validation using Rfree (ref. 25).
The (Stilbene)2-TTR crystal structure was solved by molecular replacement with Phaser26, using one monomer of human WT TTR as a search model. This model was generated from the co-crystal structure of tafamidis-bound WT TTR (PDB code 3TCT ref. 5) with the ligands removed. Two subunits (one dimer) were found in the asymmetric unit. A small-molecule stabilizer CIF dictionary was generated using AceDRG27. The model was refined with iterative cycles of manual adjustment in Coot28 and refinement in Refmac5 using isotropic thermal parameters and hydrogen atoms at calculated positions29. Final adjustments were made after analysis with MolProbity and the wwPDB Validation System18. Due to the poor electron density surrounding the Lys15–Stilbene linkage, the Lys15 side-chain and amide linkage could not be modeled with certainty. Data acquisition and modeling metrics are reported in Table 1. The crystal structure was deposited to the PDB under accession code 8U52.
Table 1 |.
(Stilbene)2-TTR conjugate crystallographic data collection and modeling statistics
| PDB code | 8U52 |
|---|---|
| Data collection | |
| Beamline | ALS 5.0.1 |
| Space group | P21212 |
| (a, b, c) (Å) | 42.96, 85.20, 63.75 |
| (α, β, γ) (°) | 90, 90, 90 |
| Resolution range (Å) | 42.60–1.50 (1.58–1.50) |
| Unique reflections | 36,591 (4,326) |
| Completeness (%) | 95.7 (79.8) |
| R sym | 0.029 (0.411) |
| R pim | 0.008 (0.136) |
| CC(1/2) | 1.00 (0.94) |
| I/σ (I) | 42.8 (4.9) |
| Redundancy | 12.4 (9.6) |
| Wilson B factor (Å2) | 16 |
| Refinement | |
| Resolution range (Å) | 42.64–1.50 |
| No. reflections—work | 34,712 |
| No. reflections—free | 1,672 |
| R work | 0.165 |
| R free | 0.194 |
| RMS bond length (Å) | 0.050 |
| RMS bond angle (°) | 2.89 |
| Mean B value (Å2) | |
| Overall | 25 |
| Protein | 24 |
| Ligand | 31 |
| Water | 36 |
| Ramachandran favored (%) | 97.7 |
| Ramachandran allowed (%) | 100.0 |
| Clashscore | 4.9 |
| No. atoms | |
| Total | 2,040 |
| Protein | 1,832 |
| Ligand | 44 |
| Water | 164 |
Data collection and refinement statistics for the (Stilbene)2-TTR crystal structure. The structure was determined from one crystal. Values for the highest-resolution shell are given in parentheses. RMS, root mean square.
Mass spectrometry analysis of the (Stilbene)2-TTR conjugate for cryo-EM sample preparation
Before sample freezing, to verify that the major species in the (Stilbene)2-TTR sample is conjugated at both TTR binding sites, we carried out LC–MS (with LC equipment Agilent 1260 and mass spectrometer Agilent 6230 ESI-TOF) on a 3× diluted aliquot taken 3 h after starting the reaction. For this, 5 μl of sample was injected in a reverse phase column (Agilent PLRP-S 2.1 × 50 mm, 100 A, 5 μm) held at 60 °C and eluted with a water-to-acetonitrile gradient from 95% to 50% water and a flow of 0.5 ml min−1, 95% for 2 min then 50% water for 6 min.
To probe for the existence of A2 hydrolysis products, we carried out a time series of the A2 + TTR reaction (same concentrations as used for sample preparation), injecting sample every 30 min for 5 h. We monitored UV absorbance at 280 and 305 nm, as well as total ion count. We also analyzed samples containing only A2 (150 μM A2 in TTR buffer + 10% DMSO) and only TTR (21 μM TTR in TTR buffer). The baseline was removed using the ZhangFit method from the BaselineRemoval Python package30. The exponential labeling temporal curves were generated by normalizing the area under the curve dividing by the maximum, after baseline removal. See results in Supplementary Fig. 21 and Supplementary Note 4.
Unliganded human TTR cryo-EM sample preparation
A 50 μl solution of 1.7 mg ml−1 TTR in 100 mM KCl and 10 mM phosphate buffer pH 7.6 (1 mM EDTA) was thawed at room temperature and centrifuged for 10 min at 16,000g, then diluted to 0.85 mg ml−1. To make 20 μl of sample, we added 5 μl of TTR, 5 μl of TTR buffer and 10 μl of 0.1% w/v β-octyl glucoside (BOG) in TTR buffer, resulting in a final concentration of 7.31 μM TTR and 0.01% w/v BOG. For grid preparation, R1.2/1.3 UltrAuFoil Holey Gold grids covered with monolayer graphene were oxidized using UV–ozone immediately before use. A manual plunger in a cold room at 6 °C and 90% humidity was used for flash freezing samples: 3 μl of sample were applied onto the graphene side of the grid after it was mounted on the plunger (always at the same height) and immediately blotted for 6 s by holding a ~1 × 6 cm piece of Whatman #1 filter paper parallel to the grid, in full contact. Timing was kept with the help of a metronome. The blotting countdown was started after the blotted liquid spot on the filter paper stopped spreading, and the grid was plunged in liquid ethane at the same time as the blotting paper was pulled back, in a single motion. Four grids were prepared this way; two pairs of identical grids were blotted for 4 and 6 s and were later clipped right before the imaging session. Imaging was performed on one of the grids blotted for 4 s.
(Stilbene)2-TTR sample preparation for cryo-EM
A 50 μl solution of 1.7 mg ml−1 TTR in 100 mM KCl, 10 mM phosphate buffer pH 7.6 and 1 mM EDTA was thawed at room temperature and spun down for 10 min at 16,000g. The TTR + A2 reaction was set up by adding 1 μl of a 1.5 mM solution of A2 in DMSO to 19 μl of the TTR stock solution specified immediately above. The A2 + TTR reaction was incubated for 4 h in the dark at room temperature. To make 20 μl of sample, we added 5 μl of TTR + A2 incubation reaction, 5 μl of TTR buffer and 10 μl of 0.1% w/v BOG in TTR buffer, resulting in the final concentrations 7.31 μM TTR, 18.75 μM A2, 0.01% w/v BOG and 1.25% v/v DMSO. The grids were prepared in the same way as the unliganded TTR conjugate sample, except that the sample was blotted for 6 and 8 s.
Single-bound (biarylamine-FT2-WT)1(C10A)3 TTR cryo-EM sample preparation
A frozen (FT2-WT)1(C10A)3 TTR tetramer sample at 0.9 mg ml−1 was thawed at room temperature for 10 min and then used to prepare grids. Grids were prepared in the same way as the (Stilbene)2-TTR conjugate sample, except that sample was blotted for 3 s.
Cryo-EM data acquisition for single-particle analysis
Movies of all frozen-hydrated TTR samples were collected using a Talos Arctica TEM (Thermo Fisher Scientific) with a field emission gun operating at 200 keV, equipped with a K2 Summit direct electron detector (Gatan). Images were acquired using the Leginon automated data collection software31. Alignments were performed to minimize coma and establish parallel illumination32,33, and stage movement was used to center image holes in a 4 × 4 array for (Stilbene)2-TTR and unliganded TTR samples (graphene-coated R1.2/1.3 UltrAuFoil grids) and 8 × 8 array (graphene-coated 0.6/1 UltrAuFoil grids) for all other samples. Image shift with beam tilt compensation was used to acquire images within each hole in the centered array. Movies were collected in counting mode (0.562 Å per pixel) with an exposure rate of 2.3 e− per pixel per second, with 50 frames (150 ms each) over 7.5 s, totaling an exposure of 55 e− Å−2. A nominal defocus between −0.8 μm and −1.5 μm was used. The Appion image analysis environment34 was used to carry out real-time frame alignment and estimation of the contrast transfer function (CTF) to assess the quality of ongoing data acquisition.
Data analysis of unliganded TTR
Frames from 4,634 movies were aligned and combined applying a dose-weighting scheme using MotionCor235 from within the RELION 3.1 interface36. The aligned micrographs were imported to cryoSPARC 3.1.037 and CTF was estimated using CTFFind438, from within the cryoSPARC interface. Micrographs with estimated defocus values higher than 1.5 μm and reported CTF resolutions lower than 4 Å were discarded. Micrographs displaying no particles and torn or crumpled and stacked graphene were also discarded, resulting in 3,739 micrographs. For template-based particle picking, a density model of PDB 1TTR chains A, B, A′ and B′ (full native homotetramer) was generated using UCSF Chimera39 and low-pass filtered to 20 Å resolution in cryoSPARC. A maximum of 2,000 picks was allowed per micrograph. Picks were inspected and curated using a normalized cross correlation (NCC) and local power (LP) thresholds. Based on visual inspection, using an NCC of ~0.5 provided the most accurate particle selection results, and lowering the LP threshold diminished the number of false positive picks on crumpled graphene areas. A total of 1.95 million particle picks were extracted in 256-pixel boxes, and 2D averages were obtained using the 2D classification node in cryoSPARC, changing default settings to 120 classes, 1,000 particles per class and 80 iterations, turning off ‘force Max over poses/shifts’ and using an inner mask radius of 75 Å and outer mask radius of 90 Å. Using a lower number of particles per class or keeping ‘force Max over poses/shifts’ selected resulted in a much lower number of different 2D classes with secondary structure features. We were not particularly stringent at the 2D cleanup stage, opting to maintain all classes remotely resembling TTR, which corresponded to 1.49 million particles. We then carried out a second round of 2D classification with the same parameters, which resulted in most classes being identifiable as TTR and with secondary structure features (Supplementary Fig. 1). The particles from these classes (1.3 million) were pooled and exported to RELION 3.1 using scripts from the pyem Github repository40.
In RELION 3.1, duplicates were removed and the particles were reextracted with a binning factor of 2. The rest of the workflow was carried out in RELION 3.2 (Supplementary Fig. 2). We performed a 3D classification imposing C2 symmetry, with the symmetry axis going through the TTR binding pockets, with K = 6, τ = 4 for 100 iterations. From the six resulting classes, four contained features clearly resembling secondary structure elements. We pooled these classes (870,899 particles) and carried out further 3D classification with C2 symmetry, K = 4, τ = 4, and 52 iterations. From the resulting four distinct classes, three had well-defined secondary structure elements, which we subsequently 3D refined separately. We used class 1 particles (335,266 particles) as input for 3D auto-refine without imposing symmetry and obtained a 3.5 Å resolution reconstruction. Using K-means clustering, we grouped micrographs by image shift using associated values stored in the Leginon database and assigned them to distinct optic groups. CTF refinement of per-particle, per-micrograph astigmatism and per-optic group beam tilt using the K-means clustering of image shifts resulted in a 3.5 Å resolution reconstruction. The reextraction of particles without binning, Bayesian polishing (model parameters s_vel = 1.2855, s_div = 4755 and s_acc = 2.175, used for all polishing jobs in this dataset) and further CTF refinement improved the resolution to 3.3 Å. Based on atomic structure modeling and comparison with previously determined TTR structures in the PDB, we termed class 1 as canonical, based on its overall similarity to the most common TTR structures determined by crystallography (Fig. 1 and Supplementary Figs. 2 and 3). Class 3 and 4 particles represented similarly compacted conformers of TTR relative to the canonical conformation, although class 4 particles appeared to have better overall structural integrity, particularly at the periphery of the loops. We used class 4 particles (130,181 particles) as input for 3D auto-refine without imposing symmetry and obtained a 3.5 Å resolution reconstruction. CTF refinement of per-particle, per-micrograph astigmatism and per-optic group (see image shift clustering above) beam tilt resulted in a 3.5 Å resolution reconstruction. The reextraction of particles without binning, Bayesian polishing and further CTF refinement improved the resolution to 3.3 Å. We refer to this reconstruction as representative of a ‘compressed’ TTR structural state (Fig. 1 and Supplementary Fig. 3). We finally further analyzed the class 3 particles (202,700 particles) with 3D auto-refine without imposing symmetry, and obtained a 3.5 Å resolution reconstruction. CTF refinement of per-particle, per-micrograph astigmatism and per-optic group (see image shift clustering above) beam tilt resulted in a 3.5 Å resolution reconstruction. The reextraction of particles without binning, Bayesian polishing and further CTF refinement improved the resolution to 3.3 Å. While this subset of particles was similar in conformation to the compressed class 4 reconstruction, the disordering of the peripheral loops led us to name this conformation as frayed (Fig. 1 and Supplementary Fig. 3). The three resulting maps were sharpened by applying an overall B factor being roughly ~1/2 of the sharpening B factor suggested by RELION 3.1 postprocessing node, to avoid excessive noise in the form of ‘dust’ in the final density. The B factor applied to the canonical, compressed and frayed reconstructions was −60, −55 and −55, respectively. See Table 2 for further details.
Cryo-EM data analysis of (Stilbene)2-TTR conjugate
Frames from 4,536 movies were aligned and combined applying a dose-weighting scheme using MotionCor235 from within the RELION 3.1 interface36. The aligned micrographs were imported to cryoSPARC 3.1.037 and CTF was estimated using CTFFind438, from within the cryoSPARC interface. Micrographs with estimated defocus values higher than 1.5 μm and reported CTF resolutions lower than 4 Å were discarded. Micrographs displaying no particles and torn or crumpled and stacked graphene were also discarded. For template-based particle picking, a density model of PDB 1TTR chains A, B, A′ and B′ (full native homotetramer) made generated using UCSF Chimera39 and low-pass filtered to 20 Å resolution in cryoSPARC. A maximum of 2,000 picks was allowed per micrograph. Picks were inspected and curated using an NCC and LP thresholds. Based on visual inspection, using an NCC of ~0.5 provided the most accurate particle selection results, and lowering the LP threshold diminished the number of false positive picks on crumpled graphene areas. Picks were extracted in 256-pixel boxes, and 2D averages were obtained using the 2D classification node in cryoSPARC, changing default settings to 120 classes, 1,000 particles per class and 80 iterations, turning off ‘force Max over poses/shifts’ and using an inner mask radius of 75 Å and outer mask radius of 90 Å. Using a lower number of particles per class or keeping ‘force Max over poses/shifts’ selected resulted in a much lower number of different 2D classes with secondary structure features. We were not particularly stringent at the 2D cleanup stage, opting to maintain all classes remotely resembling TTR, which contained approximately half of the particles. We then carried out a second round of 2D classification with the same parameters, which resulted in most classes being identifiable as TTR and with secondary structure features (Supplementary Fig. 5). The particles from these classes (1.03 million) were pooled and exported to RELION 3.1 using scripts from the pyem Github repository40.
Duplicate particles were removed, and the remaining particles were recentered and extracted to the same box size using RELION 3.1. The rest of the workflow was carried out in RELION 3.2 (Supplementary Fig. 6). Initial 3D auto-refinement without imposing symmetry led to a 4 Å reconstruction according to a Fourier shell correlation (FSC) cutoff at 0.143. CTF refinement of per-particle defocus, per-micrograph astigmatism and per-group beam tilt using K-means clustering of image shifts (see unliganded TTR image processing methods) led to a reconstruction at 3.4 Å resolution. Further CTF refinement including third-order aberrations improved resolution to 3.1 Å, and Bayesian polishing (model parameters s_vel = 0.96, s_div = 10020 and s_acc = 5.88) improved the resolution further to 2.9 Å. While the preceding steps improved resolution, the resulting density seemed stretched or smeared in one direction, indicating anisotropic resolution. To solve this, we attempted several 3D-classification schemes, hoping to identify a subset of particles that might produce a more isotropic-resolution reconstruction. Three-dimensional classification with six classes, a τ value of 4, a circular mask of 90 Å and no limitation in the E-step resolution resulted in two seemingly isotropic classes after 86 iterations (containing a total of 289,981 particles). Particles from these classes were combined, and 3D auto-refinement led to a 2.7-Å-resolution reconstruction where a single stilbene rotamer could be identified in the pocket formed by chains A and C. We categorized this reconstruction as having a canonical conformation due to its similarity to our unliganded TTR canonical structure (Fig. 2, Extended Data Fig. 2 and Supplementary Fig. 7). All other classes resembling TTR (736,525 particles) were pooled and used for 3D classification with six classes, τ = 4, and enforcing C2 symmetry with the symmetry axis (Z axis) going through the binding sites. From this classification, we were able to isolate two more states via 3D auto-refinement without imposed symmetry, one of which was a lower-resolution version of the canonical reconstruction (133,817 particles), while the other (105,961 particles, 3.1 Å resolution) we categorized as compressed based on its similarity to the unliganded compressed conformer (Fig. 2 and Supplementary Fig. 7). The two resulting maps were sharpened by applying an overall B factor being roughly ~1/2 of the sharpening B-factor suggested by RELION 3.1 postprocessing node, to avoid excessive noise in the form of dust in the final density. The B factor applied to the canonical and compressed reconstructions was −60 in both cases. See Table 2 for further details.
Data analysis of single-bound (biarylamine-FT2-WT)1(C10A)3 TTR
Two datasets consisting of 6,017 and 6,088 movies were acquired using two different grids prepared in the same freezing session and processed separately using the same processing strategies as for the previous two datasets, resulting in 4,002/3,937 micrographs yielding 1.23/1.42 million particle picks, and 1.17/1.26 million particles after 2D cleanup (Supplementary Fig. 10). The particles were combined for 3D processing in RELION 3.1 (Supplementary Fig. 11), where duplicates were removed and particles reextracted with a binning factor of 2. Three-dimensional classification into six classes was performed with τ = 4 for 58 iterations imposing C2 symmetry (symmetry axis going through the binding sites). From the six resulting classes, four had discernible secondary structure elements. We refined (3D auto-refine) each of them separately, but only class 3 (233,376 particles, corresponding to the compressed state) and class 5 (432,655 particles corresponding to the frayed state) had isotropic directional resolution and yielded ligand density in one binding site (Fig. 3 and Supplementary Fig. 11).
Three-dimensional auto-refinement of class 3 imposing C2 symmetry yielded a 4 Å reconstruction. CTF refinement of per-particle defocus, per-micrograph astigmatism and per-optic group beam tilt (see image shift clustering above) led to an improved reconstruction at 3.7 Å resolution. Reextraction without binning and further CTF refinement improved the resolution to 3.6 Å (C2 imposed). Bayesian polishing improved the resolution to 3.5 Å (C2 imposed). Refinement of per-particle defocus, per-micrograph astigmatism, beam tilt and third- and fourth-order aberrations as well as 3D auto-refinement without imposing symmetry yielded a reconstruction at 3.5 Å resolution. However, this reconstruction did not contain clear ligand density in either of the two binding sites. To separate different states with a ligand in each binding site, we created two spherical masks encompassing one binding site each and subtracted the signal outside of it from each of them in each particle, using the ‘Particle Subtraction’ node in RELION 3.1. From this process, we obtained two new particle stacks in which only the signal from one of the binding sites remained. We carried out 3D classification without alignment with two classes and a τ value of 2 for 100 iterations and obtained two classes for each of them. One of those classification runs yielded a class with apparent ligand density (class 1, 168,443 particles) and one without (class 2, 64,933 particles). Three-dimensional auto-refinement without imposed symmetry of these classes after reconstitution of subtracted signal yielded a 3.4 Å reconstruction with clear ligand density in the binding site (168,443 particles from class 1, (biarylamine-FT2-WT)1(C10A)3 TTR compressed state; Table 2) and one at 3.8 Å without any density in the pocket (64,933 particles from class 2) (Fig. 3 and Supplementary Figs. 11 and 12).
In contrast to class 3, class 5 displayed a small bi-lobed body of density in one of the binding pockets, which we attributed to the biarylamine moiety, even before refinement. Since per-optic group beam tilt was already calculated for class 3, they were imparted on class 5 particles before carrying out any further analysis. 3D auto-refinement did not improve the resolution or interpretability of class 5, so 3D classification was performed with 6 classes, τ = 4 and 70 iterations, which yielded a class (class 6, 110,253 particles) that when refined with 3D auto-refinement imposing C2 symmetry, yielded a 4.1 Å reconstruction. Three-dimensional auto-refinement with C2 symmetry after reextraction without binning, CTF refinement (per-particle defocus, per-micrograph astigmatism and per-optic group beam tilt) and Bayesian polishing yielded a reconstruction at 3.9 Å. Further CTF refinement (per-particle defocus, per-micrograph astigmatism and per-optic group beam tilt as well as third- and fourth-order aberrations) yielded a 4.1 Å reconstruction after 3D auto-refinement without imposing symmetry (biarylamine-FT2-WT)1(C10A)3 TTR frayed state (Table 2 and Supplementary Figs. 11 and 12).
Calculation of TTR H-strand dihedral angles and elongation distance
The dihedral angle between H strands of monomers on opposing sides of a binding pocket is defined by the Cα atoms of residues 114A → 17A → 117C → 114C and 114B → 117B → 117D → 114D. The overall TTR extension lengths, as labeled in the cartoons in Figs. 1–3, are the averages of the distances between Cα atoms pairs from Leu58 in chains A and B and chains C and D.
Calculation of Cα dihedral changes between conformations
The change in Cα dihedral angles, as initially presented in ref. 41, is used to describe hinge-like molecular motions. The Cα dihedral angle at a given position X is calculated from the position of the Cα of positions X + 2, X + 1, X and X − 1. This angle is defined in the −180° to 180° space, and changes are expressed in absolute values to facilitate visualization.
Modeling of atomic coordinates in cryo-EM-derived density for all analyzed samples
All atomic coordinate modeling used to create models for cryo-EM datasets presented in this work followed a similar procedure as described below. We began with a model from human wild-type TTR, PDB 2QGB. Symmetry expansion was applied in PyMol42 to generate a tetramer, and chains A′ and B′ were changed to C and D, respectively. Nonprotein atoms and alternative rotamers were removed. The initial model was docked and aligned to density in UCSF Chimera. The saved and translated copy of the starting model was docked in the density using the ‘Dock in map’ node in Phenix43. The resulting model was refined in real space using the ‘Real-space refinement’ node in Phenix, with options ‘minimization_global’, ‘rigid_body’, ‘local_grid_search’ and ‘adp’ turned on. Secondary structure or initial model restraints were not used. The resulting model was inspected in Coot44, where side-chain atoms without density were deleted and ‘real-space refine zone’ was applied to eight to ten overlapping residue stretches throughout the whole protein. Attempts to remove Ramachandran and side-chain geometry outliers were made by real-space and manual refinement, as well as peptide bond flipping. When considered adequate by local resolution, water molecules were modeled considering their location and likely coordination, as well as their modeling in other TTR structures. For data derived from the (Stilbene)2-TTR sample, lysine 15 covalently modified with the stilbene was modeled as a non-canonical amino-acid with the three-letter code A2K. Parameters for A2K were generated using eLBOW and the Lys–Stilbene amide bond was modeled in cis as suggested by the density in the highest-resolution binding site (chains A and C of the canonical state density). For data derived from the (biarylamine-FT2-WT)1(C10A)3 TTR sample, parameter files and models for the small-molecule moiety were obtained from the PDB, as crystal structures of this complex have already been published6. In (biarylamine-FT2-WT)1(C10A)3 TTR position B10 was modeled as cysteine, while A10, C10 and D10 were modeled as alanine. This decision was based on the local density features in the compressed state, given its higher resolution.
In all models, after the initial manual refinement in coot the model was refined again using the ‘Real-space refinement’ node in Phenix43. This process was repeated until no changes were considered by manually inspecting the model in Coot, that is, ‘Real-space refinement’ in Phenix was the last step in all modeling. Data modeling statistics produced with Phenix43 are reported in Table 2. Map-to-model Fourier correlation plots are presented in Supplementary Figs. 3, 7 and 12.
Figure generation
The DeepEMHancer45 software package was used to sharpen the density maps for generating figure panels depicting the TTR reconstructions. These DeepEMHancer-generated maps were not used for modeling or interpretation. UCSF ChimeraX46 was used to create the surface representations of cryo-EM densities and ribbon/licorice representations of atomic models. UCSF Chimera39 was used to generate the wire-mesh representations that include the atomic models.
Ligand-binding pocket volume measurement with Fpocket
Measuring pocket volume in a consistent and comparable way can be challenging, as automatic detection may produce very different results in similar structures depending on the area accessible to a solvent-like probe, methods for defining the limits of the pocket, and slight structural differences such as side-chain conformation. For these reasons, we decided to use the Fpocket functionality47 that defines pockets by the presence of a ligand, and modeled missing side chains in our seven TTR structures using Rosetta48 (see below). To account for ambiguities in the density, we generated ten models per cryo-EM density (70 in total), which enabled us to estimate the error associated with the measurements (Extended Data Fig. 9). To minimize noise coming from ligand placement and chemistry, and to enable ligand-based pocket volume measurement in unliganded TTR, we took the canonical (Stilbene)2-TTR conjugate structure, aligned it to each of the other six species, and grafted the atomic coordinates of the stilbene moiety in each of them. We then ran Fpocket in the newly generated artificial (Stilbene)2-TTR complexes.
Full-atom model refinement with Rosetta
To obtain reasonable estimates of pocket volume, we used Rosetta to generate full-atom models from the partial (missing side chains) models made in Coot. We followed the protocol described in ref. 49. In brief, rotamer positions were optimized by Monte Carlo optimization of the Rosetta score function49 and density values, followed by gradient minimization of all atom positions, allowing covalent interactions to deviate lightly from their theoretical optima. These steps were carried for four iterations going from low-repulsion (‘soft ball’ atoms) to full-repulsion van der Waals potential, in a routine called ‘FastRelax’. The necessary scripts and command-line options are provided in Supplementary Information. Ten structures were produced for each initial Coot model to account for uncertainty derived from the lack of density. It should be emphasized that, given the conservative nature of the FastRelax protocol, the resulting full atom models differ only by small backbone and side-chain motions.
Molecular dynamics simulations of the (Stilbene)2-TTR conjugate
TTR structures with covalent stilbene were prepared with pdb4amber within AmberTools21 (ref. 50), including residue protonation-state determination with the REDUCE software51. Structurally determined water molecules were also removed. Antechamber52 was used to calculate AM1-BCC partial charges for the ligand-residue adduct via the SQM method. Lysine 15 with attached stilbene ligand was given N-methyl and C-acetyl caps before Antechamber calculations. The ff19SB53 forcefield was used for protein residues, while the GAFF2 forcefield54 was used for the stilbene ligand. To maintain planarity of the amide linkage between the K15 residue and the stilbene ligand, the Nz was explicitly parameterized with the GAFF2 sp2 amide N atom type (‘n’) instead of the N3 ff19SB atom type. A box with the OPC55 water model was placed around the protein atoms with at least a 15 Å buffer; then, Na+ and Cl− ions were added to neutralize the system. Minimization and simulation were performed with OpenMM v7.7.0 (ref. 56). Following an energy minimization, the simulation was equilibrated for 0.1 ns before the production run of 500 ns. The simulation was run with an NPT ensemble at 310 K and 1.0 atm with periodic boundary conditions. A Monte Carlo barostat was used with an interval of 25 steps along with a Langevin Middle integrator/thermostat with friction coefficient of 1.0 ps−1. A 2 fs timestep was used. The particle mesh Ewald method57 was used for electrostatic interactions with a nonbonded cutoff of 1.2 nm and a tolerance of 0.0005. The length of bonds involving hydrogen atoms were constrained and water molecules were kept rigid with a constraint tolerance of 0.000001. The resulting trajectory was autoimaged with CPPTRAJ58 and analyzed with MDAnalysis in Python59.
Extended Data
Extended Data Fig. 1 |. TTR quaternary structure, presented using a TTR crystal structure bound to thyroxine (PDB 1ICT).

a, TTR dimers, shown using molecular surface and ribbon representations, interact through an extensive hydrogen bond network between neighboring H- and F- β-strands from neighboring subunits. The inter-strand interactions are highlighted in the right panels, where the A-B dimer is viewed perpendicular to the H- and F- β-strands, and the hydrogen bond network is depicted with the atomic model overlaid with the ribbon representation. b, Two TTR dimers assemble into a tetramer via interactions between the A-B and G-H loops from opposing subunits. On the left the TTR tetramer is shown as a molecular surface and ribbon representation. Thyroxine (colored green) is bound in each of the two binding pockets. On the right, a detailed view of the A-B loop interactions with the G-H loop of the opposing subunit is shown. For all images, each chain is colored as in Fig. 1.
Extended Data Fig. 2 |. Comparison of H-strand cross angles for our cryo-EM structures and published crystal structures of unliganded and covalently liganded TTR.

a, The dihedral angles between opposing H β-strands, measured as shown in Fig. 1E, are plotted as a line with dihedral angle value of the A / C subunits as the upper point and the B / D subunit dihedral angle as the lower point. The PDB codes for previously characterized unliganded complexes are labeled in the figure inset. The majority of the crystal structures have values that are similar to the cryo-EM structure we refer to as the canonical state. b, The same measurement of dihedral angles for our (Stilbene)2-TTR cryo-EM structures and published covalently liganded TTR crystal structures are plotted as in (a). The PDB codes for previously characterized complexes are labeled in the figure inset.
Extended Data Fig. 3 |. Local resolution and B-factors for the unliganded TTR conformations.

a, Reconstructions of the three unliganded TTR conformations are colored according to the estimated local resolution, as calculated by RELION. b, Models for the unliganded TTR states shown as backbone “tube” cartoons, colored by B-factor using the same scale. Chains B in all structures have the highest B-factors in the structures, and these values are substantially higher in the frayed state. c, B-factors are presented for residue numbers in areas that appear most disordered in the frayed state. B-factors for the same residues in the compressed state are presented for comparison.
Extended Data Fig. 4 |. Location of common hATTR mutations (V30M and L55P) in the context of the unliganded TTR model based on the frayed state density.

The backbone-only cartoon model (left) is colored by B-factor values, and an inset to the right highlights hATTR mutation sites V30 and L55 as sticks. The V30P mutation results in a larger residue in the core of TTR, near the frayed region. The L55P mutation abolishes a hydrogen bond (dashed lines in the inset) between position 55 and 14, which weakens the association of strand D and adjacent loops with the rest of the structure.
Extended Data Fig. 5 |. Differences in pocket geometry between canonical and compressed conformations of unliganded TTR.
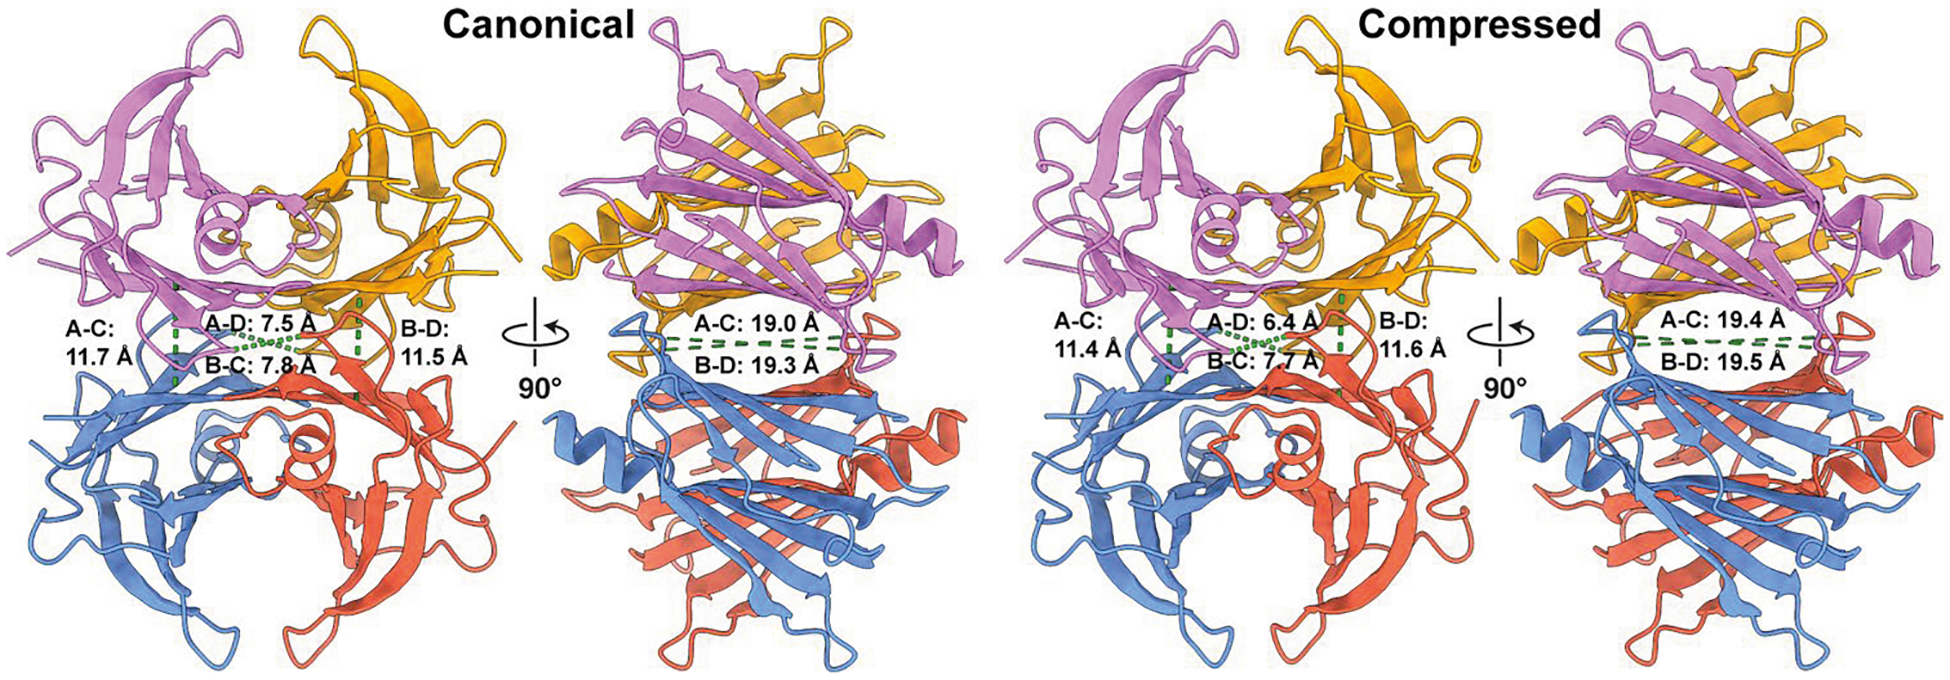
Ribbon representation of the unliganded TTR conformations, with subunits colored as in Fig. 1 and pairwise distances between Cα shown as dotted green lines. On the left, distances between Cα atoms of Val20 between the subunits A-D and B-C are shown at the center, and measured distances between the Cα atoms of Ala108 are shown at the periphery. On the right the distances between the between the Cα atoms of Ala19, oriented horizontally across the binding pockets, are shown.
Extended Data Fig. 6 |. Stilbene conjugation site in the binding pocket formed by the A and C subunits determined by crystallography and cryo-EM.

The top panels show electron density below noise level from a 1.5 Å resolution crystal structure. The stilbene moiety seats at a crystallographic symmetry axis, resulting in two-fold averaging of the density. The bottom panels show the same region in our cryo-EM canonical state reconstruction, which was generated without imposing symmetry, showing the asymmetric binding pose of the ligand.
Extended Data Fig. 7 |. Local resolution and differences in pocket dimensions between canonical and compressed conformations of the (Stilbene)2-TTR conjugate.

a, Reconstructions of the canonical and compressed double-liganded TTR conformations are colored according to the estimated local resolution, as calculated by RELION. b, Ribbon representation of the double-liganded TTR conformations, with subunits colored as in Fig. 1 and pairwise distances between Cα shown as dotted green lines. On the left the distances between the Cα atoms of Ala108, which are oriented vertically across the binding pockets, are measured and shown. On the right the distances between the between the Cα atoms of Ala19, oriented horizontally across the binding pockets, are shown.
Extended Data Fig. 8 |. Local resolution and differences in pocket geometry between occupied and unoccupied binding sites in the (biarylamine-FT2-WT)1(C10A)3 TTR structures.
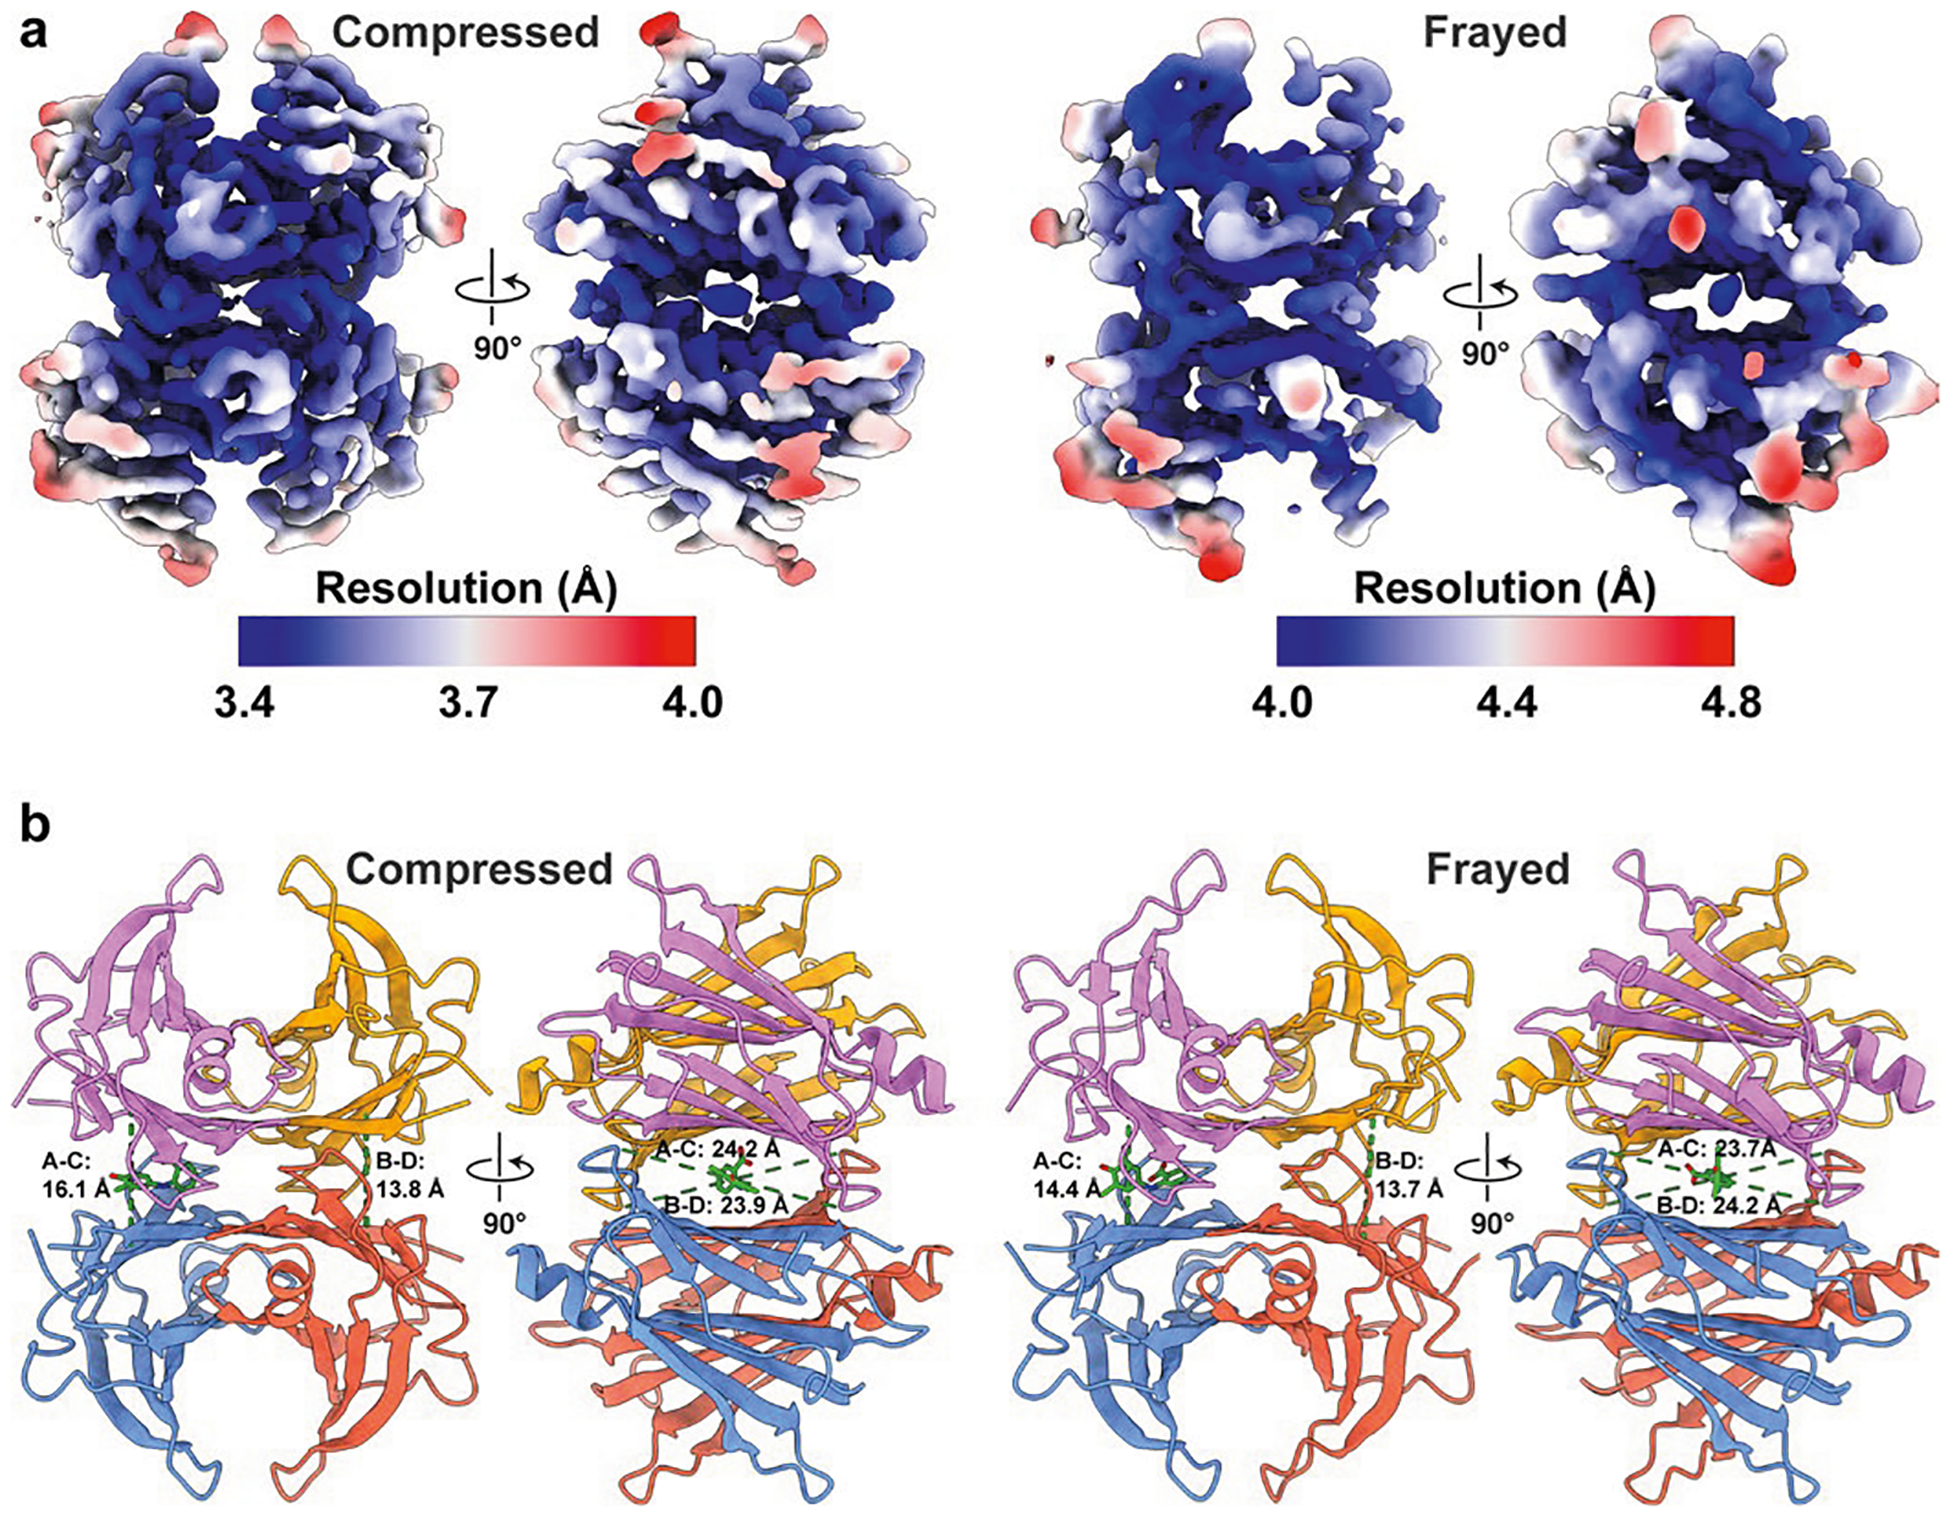
a, Reconstructions of the compressed and frayed single-liganded TTR colored according to the estimated local resolution, as calculated by RELION. b, Ribbon representation of the single-liganded compressed and frayed TTR conformations, with subunits colored as in Fig. 1, and pairwise distances between Cα shown as dotted green lines. On the left, measured distances between Cα atoms of Lys15 between the subunits A-C and B-D are shown. On the right the distances between the between the Cα atoms of Gly22, oriented horizontally across the binding pockets, are shown.
Extended Data Fig. 9 |. Fpocket analysis of TTR binding pockets.

A box and whisker plot is shown for each of the binding pockets for all of the conformational states of TTR reported in this study. Ten atomic models were generated for each cryo-EM reconstruction using Rosetta to model any missing side-chains, and Fpocket was used to measure the volume of each binding site (see Methods). The central line in the box plot is the median and the rectangles extend to the central quartiles. The whiskers extend to contain the rest of the data, except for points that are further than 1.5 times the inter-quartile range from the closest hinge, which are considered outliers (denoted by diamonds). The mean and standard deviation of each binding pocket for the conformational states are as follows (AC, BD pocket, respectively in Å3): unliganded canonical: 1997 + /− 36, 1880 + /− 69; unliganded compressed: 1935 + /− 59, 2061 + /− 59; unliganded frayed: 1945 + /− 91, 2080 + /− 85; single-bound compressed: 1883 + /− 22, 1582 + /− 170; single-bound frayed: 1827 + /− 139, 1691 + /− 84; double-bound canonical: 1384 + /− 79, 1723 + /− 21; double-bound compressed: 1681 + /− 311, 1815 + /− 91.
Extended Data Fig. 10 |. Conformational changes around Phe64 between the canonical and compressed TTR conformations.

On the left, a transparent surface representation of the unliganded canonical (above) and compressed (below) conformations of TTR are shown with transparency over the the ribbon model. The surface corresponding to the D-E loop has been removed to highlight its location. On the right, the surface representation of TTR is colored according to hydrophobicity according to the Kyte-Doolittle scale, with brown representing hydrophobic surfaces and blue as hydrophilic. The D-E loop is shown as a ribbon with residues Phe64 and Leu58 shown as sticks, highlighting how these residues anchor the D-E loops to the rest of the structure by interacting with the hydrophobic core of each subunit. When TTR transitions from the canonical to compressed conformations, the hydrophobic pockets with which these residues interact become wider. We hypothesize this decreases the stability of the D-E loop interaction relative to the rest of the structure, enabling sampling of the frayed state.
Supplementary Material
Acknowledgements
We thank B. Anderson and C. Bowman at the Scripps Research Electron Microscopy Facility for microscopy and technical support. We thank J.-C. Ducom at Scripps Research High Performance Computing core for computational support. We also thank M. Jager for helpful discussions in the design and execution of experiments and advice for revising the paper. Editing support was provided by E. P. Bentley and J.-H. Schäfer. This work was supported by the National Institutes of Health (NIH) grants GM142196 and AG067594 to G.C.L., DK046335 to J.W.K, and GM069832 to S.F. B.B. is supported by a Postdoctoral Fellowship from the George E. Hewitt Foundation for Medical Research. Beamline 5.0.1 of the Advanced Light Source, a DOE Office of Science User Facility under contract no. DE-AC02-05CH11231, is supported in part by the ALS-ENABLE program funded by NIH P30 GM124169-01.
Competing interests
J.W.K. and E.T.P. discovered tafamidis and receive royalty payments for its sales. J.W.K. was a founder and shareholder in FoldRx, which first developed tafamidis as a therapeutic. J.W.K. is a paid consultant for and has received support for travel and accommodations from Pfizer, which sells tafamidis. The other authors declare no competing interests.
Footnotes
Reporting summary
Further information on research design is available in the Nature Portfolio Reporting Summary linked to this article.
Online content
Any methods, additional references, Nature Portfolio reporting summaries, source data, extended data, supplementary information, acknowledgements, peer review information; details of author contributions and competing interests; and statements of data and code availability are available at https://doi.org/10.1038/s41594-024-01472-7.
Extended data is available for this paper at https://doi.org/10.1038/s41594-024-01472-7.
Supplementary information The online version contains supplementary material available at https://doi.org/10.1038/s41594-024-01472-7.
Data availability
Atomic coordinates and structure factors for crystal structure of the (Stilbene)2-TTR conjugate were deposited to the PDB with accession code 8U52. Cryo-EM maps and associated atomic models were deposited to the Electron Microscopy Databank (EMDB) and the PDB, respectively, with the following EMDB and PDB IDs: unliganded canonical TTR—EMD-43162, 8VE2; unliganded compressed TTR—EMD-43163, 8VE3; unliganded frayed TTR—EMD-43164, 8VE4; double-bound canonical TTR—EMD-43161, 8VE1; double-bound compressed TTR—EMD-43160, 8VE0; single-bound compressed TTR—EMD-43165, 8VE5; and single-bound frayed TTR—EMD-43166, 8VE6.
References
- 1.Schmidt HH et al. Estimating the global prevalence of transthyretin familial amyloid polyneuropathy. Muscle Nerve 57, 829–837 (2018). [DOI] [PMC free article] [PubMed] [Google Scholar]
- 2.Obi CA, Mostertz WC, Griffin JM & Judge DP ATTR epidemiology, genetics, and prognostic factors. Methodist Debakey Cardiovasc J. 18, 17–26 (2022). [DOI] [PMC free article] [PubMed] [Google Scholar]
- 3.Giao T et al. Undiscovered roles for transthyretin: from a transporter protein to a new therapeutic target for Alzheimer’s disease. Int. J. Mol. Sci 21, 2075 (2020). [DOI] [PMC free article] [PubMed] [Google Scholar]
- 4.Si JB, Kim B & Kim JH Transthyretin misfolding, a fatal structural pathogenesis mechanism. Int. J. Mol. Sci 22, 4429 (2021). [DOI] [PMC free article] [PubMed] [Google Scholar]
- 5.Bulawa CE et al. Tafamidis, a potent and selective transthyretin kinetic stabilizer that inhibits the amyloid cascade. Proc. Natl Acad. Sci. USA 109, 9629–9634 (2012). [DOI] [PMC free article] [PubMed] [Google Scholar]
- 6.Wiseman RL et al. Kinetic stabilization of an oligomeric protein by a single ligand binding event. J. Am. Chem. Soc 127, 5540–5551 (2005). [DOI] [PubMed] [Google Scholar]
- 7.Palaninathan SK Nearly 200 X-ray crystal structures of transthyretin: what do they tell us about this protein and the design of drugs for TTR amyloidoses? Curr. Med. Chem 19, 2324–2342 (2012). [DOI] [PubMed] [Google Scholar]
- 8.Han Y et al. High-yield monolayer graphene grids for near-atomic resolution cryoelectron microscopy. Proc. Natl Acad. Sci. USA 117, 1009–1014 (2020). [DOI] [PMC free article] [PubMed] [Google Scholar]
- 9.Serpell LC, Goldsteins G, Dacklin I, Lundgren E & Blake CCF The ‘edge strand’ hypothesis: prediction and test of a mutational ‘hot-spot’ on the transthyretin molecule associated with FAP amyloidogenesis. Amyloid 3, 75–85 (1996). [Google Scholar]
- 10.Sun X, Jaeger M, Kelly JW, Dyson HJ & Wright PE Mispacking of the Phe87 side chain reduces the kinetic stability of human transthyretin. Biochemistry 57, 6919–6922 (2018). [DOI] [PMC free article] [PubMed] [Google Scholar]
- 11.Liu K, Kelly JW & Wemmer DE Native state hydrogen exchange study of suppressor and pathogenic variants of transthyretin. J. Mol. Biol 320, 821–832 (2002). [DOI] [PubMed] [Google Scholar]
- 12.Jiang B, Guo T, Peng LW & Sun ZR Folding type-specific secondary structure propensities of amino acids, derived from α-helical, β-sheet, α/β, and α+ β proteins of known structures. Biopolymers 45, 35–49 (1998). [Google Scholar]
- 13.Kelly JW & Lansbury PT A chemical approach to elucidate tin mechanism of transthyretin and β-protein amyloid fibril formation. Amyloid 1, 186–205 (1994). [Google Scholar]
- 14.Choi S, Ong DS & Kelly JW A stilbene that binds selectively to transthyretin in cells and remains dark until it undergoes a chemoselective reaction to create a bright blue fluorescent conjugate. J. Am. Chem. Soc 132, 16043–16051 (2010). [DOI] [PMC free article] [PubMed] [Google Scholar]
- 15.Buxbaum JN & Reixach N Transthyretin: the servant of many masters. Cell. Mol. Life Sci 66, 3095–3101 (2009). [DOI] [PMC free article] [PubMed] [Google Scholar]
- 16.Trivella DB, dos Reis CV, Lima LM, Foguel D & Polikarpov I Flavonoid interactions with human transthyretin: combined structural and thermodynamic analysis. J. Struct. Biol 180, 143–153 (2012). [DOI] [PubMed] [Google Scholar]
- 17.Tess DA et al. Relationship of binding-site occupancy, transthyretin stabilisation and disease modification in patients with tafamidis-treated transthyretin amyloid cardiomyopathy. Amyloid 30, 208–219 (2023). [DOI] [PubMed] [Google Scholar]
- 18.Chen VB et al. MolProbity: all-atom structure validation for macromolecular crystallography. Acta Crystallogr. D 66, 12–21 (2010). [DOI] [PMC free article] [PubMed] [Google Scholar]
- 19.Barad BA et al. EMRinger: side chain–directed model and map validation for 3D cryo-electron microscopy. Nat. Methods 12, 943–946 (2015). [DOI] [PMC free article] [PubMed] [Google Scholar]
- 20.Pintilie G et al. Measurement of atom resolvability in cryo-EM maps with Q-scores. Nat. Methods 17, 328–334 (2020). [DOI] [PMC free article] [PubMed] [Google Scholar]
- 21.Basanta B, Chen W, Pride DE & Lander GC Fabrication of monolayer graphene-coated grids for cryoelectron microscopy. J. Vis. Exp 10.3791/65702 (2023). [DOI] [PMC free article] [PubMed] [Google Scholar]
- 22.Choi S, Connelly S, Reixach N, Wilson IA & Kelly JW Chemoselective small molecules that covalently modify one lysine in a non-enzyme protein in plasma. Nat. Chem. Biol 6, 133–139 (2010). [DOI] [PMC free article] [PubMed] [Google Scholar]
- 23.Kabsch W XDS. Acta Crystallogr. D 66, 125–132 (2010). [DOI] [PMC free article] [PubMed] [Google Scholar]
- 24.Evans P Scaling and assessment of data quality. Acta Crystallogr. D 62, 72–82 (2006). [DOI] [PubMed] [Google Scholar]
- 25.Brünger AT Free R value: a novel statistical quantity for assessing the accuracy of crystal structures. Nature 355, 472–475 (1992). [DOI] [PubMed] [Google Scholar]
- 26.McCoy AJ et al. Phaser crystallographic software. J. Appl. Crystallogr 40, 658–674 (2007). [DOI] [PMC free article] [PubMed] [Google Scholar]
- 27.Long F et al. AceDRG: a stereochemical description generator for ligands. Acta Crystallogr. D 73, 112–122 (2017). [DOI] [PMC free article] [PubMed] [Google Scholar]
- 28.Emsley P, Lohkamp B, Scott WG & Cowtan K Features and development of Coot. Acta Crystallogr. D 66, 486–501 (2010). [DOI] [PMC free article] [PubMed] [Google Scholar]
- 29.Murshudov GN, Vagin AA & Dodson EJ Refinement of macromolecular structures by the maximum-likelihood method. Acta Crystallogr. D 53, 240–255 (1997). [DOI] [PubMed] [Google Scholar]
- 30.Zhang ZM, Chen S & Liang YZ Baseline correction using adaptive iteratively reweighted penalized least squares. Analyst 135, 1138–1146 (2010). [DOI] [PubMed] [Google Scholar]
- 31.Cheng A et al. Leginon: new features and applications. Protein Sci. 30, 136–150 (2021). [DOI] [PMC free article] [PubMed] [Google Scholar]
- 32.Herzik MA, Wu M & Lander GC Achieving better-than-3-Å resolution by single-particle cryo-EM at 200 keV. Nat. Methods 14, 1075–1078 (2017). [DOI] [PMC free article] [PubMed] [Google Scholar]
- 33.Lander GC, Herzik MA Jr & Wu M Setting up the Talos Arctica electron microscope and Gatan K2 direct detector for high-resolution cryogenic single-particle data acquisition. Protoc. Exch 10.1038/protex.2017.108 (2017). [DOI] [Google Scholar]
- 34.Stagg SM & Mendez JH Processing apoferritin with the Appion pipeline. J. Struct. Biol 204, 85–89 (2018). [DOI] [PMC free article] [PubMed] [Google Scholar]
- 35.Zheng SQ et al. MotionCor2: anisotropic correction of beam-induced motion for improved cryo-electron microscopy. Nat. Methods 14, 331–332 (2017). [DOI] [PMC free article] [PubMed] [Google Scholar]
- 36.Zivanov J et al. New tools for automated high-resolution cryo-EM structure determination in RELION-3. eLife 7, e42166 (2018). [DOI] [PMC free article] [PubMed] [Google Scholar]
- 37.Punjani A, Rubinstein JL, Fleet DJ & Brubaker MA cryoSPARC: algorithms for rapid unsupervised cryo-EM structure determination. Nat. Methods 14, 290–296 (2017). [DOI] [PubMed] [Google Scholar]
- 38.Rohou A & Grigorieff N CTFFIND4: fast and accurate defocus estimation from electron micrographs. J. Struct. Biol 192, 216–221 (2015). [DOI] [PMC free article] [PubMed] [Google Scholar]
- 39.Pettersen EF et al. UCSF Chimera—a visualization system for exploratory research and analysis. J. Comput. Chem 25, 1605–1612 (2004). [DOI] [PubMed] [Google Scholar]
- 40.Asarnow D, Palovcak E & Cheng Y asarnow/pyem: UCSF pyem. Zenodo 10.5281/zenodo.3576630 (2019). [DOI] [Google Scholar]
- 41.Marvin JS, Schreiter ER, Echevarria IM & Looger LL A genetically encoded, high-signal-to-noise maltose sensor. Proteins 79, 3025–3036 (2011). [DOI] [PMC free article] [PubMed] [Google Scholar]
- 42.DeLano WL Pymol: an open-source molecular graphics tool. CCP4 Newsl. Protein Crystallogr 40, 82–92 (2002). [Google Scholar]
- 43.Adams PD et al. PHENIX: a comprehensive Python-based system for macromolecular structure solution. Acta Crystallogr. D 66, 213–221 (2010). [DOI] [PMC free article] [PubMed] [Google Scholar]
- 44.Emsley P & Cowtan K Coot: model-building tools for molecular graphics. Acta Crystallogr. D 60, 2126–2132 (2004). [DOI] [PubMed] [Google Scholar]
- 45.Sanchez-Garcia R et al. DeepEMhancer: a deep learning solution for cryo-EM volume post-processing. Commun. Biol 4, 874 (2021). [DOI] [PMC free article] [PubMed] [Google Scholar]
- 46.Meng EC et al. UCSF ChimeraX: tools for structure building and analysis. Protein Sci. 32, e4792 (2023). [DOI] [PMC free article] [PubMed] [Google Scholar]
- 47.Le Guilloux V, Schmidtke P & Tuffery P Fpocket: an open source platform for ligand pocket detection. BMC Bioinf. 10, 168 (2009). [DOI] [PMC free article] [PubMed] [Google Scholar]
- 48.Wang RY et al. Modeling disordered regions in proteins using Rosetta. PLoS ONE 6, e22060 (2011). [DOI] [PMC free article] [PubMed] [Google Scholar]
- 49.Wang RY-R et al. Automated structure refinement of macromolecular assemblies from cryo-EM maps using Rosetta. eLife 5, e17219 (2016). [DOI] [PMC free article] [PubMed] [Google Scholar]
- 50.Case DA et al. Amber2021 (Univ. California, San Francisco, 2021). [Google Scholar]
- 51.Word JM, Lovell SC, Richardson JS & Richardson DC Asparagine and glutamine: using hydrogen atom contacts in the choice of side-chain amide orientation. J. Mol. Biol 285, 1735–1747 (1999). [DOI] [PubMed] [Google Scholar]
- 52.Outerbridge RE Perosseous venography in the diagnosis of viability in subcapital fractures of the femur. ONA J. 5, 143–148 (1978). [PubMed] [Google Scholar]
- 53.Tian C et al. ff19SB: amino-acid-specific protein backbone parameters trained against quantum mechanics energy surfaces in solution. J. Chem. Theory Comput 16, 528–552 (2020). [DOI] [PubMed] [Google Scholar]
- 54.Wang J, Wolf RM, Caldwell JW, Kollman PA & Case DA Development and testing of a general amber force field. J. Comput. Chem 25, 1157–1174 (2004). [DOI] [PubMed] [Google Scholar]
- 55.Izadi S, Anandakrishnan R & Onufriev AV Building water models: a different approach. J. Phys. Chem. Lett 5, 3863–3871 (2014). [DOI] [PMC free article] [PubMed] [Google Scholar]
- 56.Eastman P et al. OpenMM 7: rapid development of high performance algorithms for molecular dynamics. PLoS Comput. Biol 13, e1005659 (2017). [DOI] [PMC free article] [PubMed] [Google Scholar]
- 57.Essmann U et al. A smooth particle mesh Ewald method. J. Chem. Phys 103, 8577–8593 (1995). [Google Scholar]
- 58.Roe DR & Cheatham TE 3rd PTRAJ and CPPTRAJ: software for processing and analysis of molecular dynamics trajectory data. J. Chem. Theory Comput 9, 3084–3095 (2013). [DOI] [PubMed] [Google Scholar]
- 59.Michaud-Agrawal N, Denning EJ, Woolf TB & Beckstein O MDAnalysis: a toolkit for the analysis of molecular dynamics simulations. J. Comput. Chem 32, 2319–2327 (2011). [DOI] [PMC free article] [PubMed] [Google Scholar]
Associated Data
This section collects any data citations, data availability statements, or supplementary materials included in this article.
Supplementary Materials
Data Availability Statement
Atomic coordinates and structure factors for crystal structure of the (Stilbene)2-TTR conjugate were deposited to the PDB with accession code 8U52. Cryo-EM maps and associated atomic models were deposited to the Electron Microscopy Databank (EMDB) and the PDB, respectively, with the following EMDB and PDB IDs: unliganded canonical TTR—EMD-43162, 8VE2; unliganded compressed TTR—EMD-43163, 8VE3; unliganded frayed TTR—EMD-43164, 8VE4; double-bound canonical TTR—EMD-43161, 8VE1; double-bound compressed TTR—EMD-43160, 8VE0; single-bound compressed TTR—EMD-43165, 8VE5; and single-bound frayed TTR—EMD-43166, 8VE6.