

Abstract
Aims
Intraductal carcinoma (IDC) is an independent pathological parameter for adverse prostate cancer (PCa) outcome. Although most IDC are believed to originate from retrograde spread of established PCa, rare IDC cases may represent precursor lesions. The actual transition areas between intraductal and invasive cancer, however, have not yet been identified. Our objective was to identify intraductal‐invasive PCa transitions using 2‐ and 3‐dimensional microscopy.
Methods and results
Seventy‐five samples from 46 radical prostatectomies with PCa were immunohistochemically stained for basal cell keratins. In 35 samples, atypical glands that were indistinguishable from invasive adenocarcinoma (IAC) had focal 34BE12‐positive basal cells. These IAC‐like glands were present adjacent to IDC and prostatic intra‐epithelial neoplasia (PIN) in 21 of 45 (46.7%) and 16 of 58 (27.6%) cases, respectively. Whole‐mount confocal imaging of immunofluorescent Ker5/18 double‐stained and cleared 1‐mm‐thick intact tissues revealed spatial continuity between IDC, IAC‐like glands and IAC with a gradual loss of basal cells. In 24 of 35 (68.6%) samples more than one IAC‐like focus (median 3.0) was present.
Conclusions
We identified areas of spatial transition between PIN, IDC and IAC, characterised by remnant basal cells in IAC‐like glands. Based on the coexistence of IDC and PIN, the gradual loss of basal cells in IAC‐like glands and IAC‐like glands’ multifocality, we propose a novel hypothesis on intraductal carcinogenesis, which we term ‘repetitive invasion, precursor progression’ (RIPP).
Keywords: basal cell, IDC, intraductal, prostate cancer, PTEN, three‐dimensional, transition
This study identifies the spatial transitions between intraductal and invasive prostate cancer using 2D and 3D imaging. The findings lead to the proposal of a completely new, unifying model for the pathogenesis of intraductal carcinoma of the prostate.
Abbreviations
- 2D
two‐dimensional
- 3D
three‐dimensional
- AIP
atypical intraductal proliferation
- CR/IDC
invasive cribriform or intraductal carcinoma
- ERG
ETS‐related gene
- FFPE
formalin‐fixed paraffin‐embedded
- GG
grade group
- GUPS
Genitourinary Pathology Society
- H&E
haematoxylin and eosin
- IAC
invasive adenocarcinoma
- IDC
intraductal carcinoma
- ISUP
International Society of Urological Pathology
- PCa
prostate cancer
- PIN
prostatic intra‐epithelial neoplasia
- PTEN
phosphatase and tensin homologue deleted on chromosome 10
- RIPP
repetitive invasion, precursor progression
- ROI
region of interest
- RP
radical prostatectomy
- WHO
World Health Organisation
Introduction
Intraductal carcinoma (IDC) is an independent marker for prostate cancer (PCa) outcome. It is defined as a dense cribriform or solid atypical epithelial cell proliferation within pre‐existent distended prostate glands. 1 , 2 Numerous studies on biopsy and radical prostatectomy (RP) specimens have shown that IDC is associated with adverse pathological features, biochemical recurrence, metastasis and disease‐specific death. 3 , 4 , 5 , 6 Therefore, the International Society of Urological Pathology (ISUP) and Genitourinary Pathology Society (GUPS) both recommend reporting the presence of IDC in prostate specimens. 7 , 8
High‐grade prostatic intra‐epithelial neoplasia (PIN) is the generally accepted precursor lesion of PCa. It is characterised by a flat, tufted or micropapillary proliferation of atypical luminal cells within pre‐existent glands. 1 Some intraglandular proliferations exceed the architectural features of PIN, but fall short of a definitive IDC diagnosis. These intermediate lesions have been termed ‘atypical intraductal proliferation’ (AIP), and refer mainly to loose cribriform proliferations in distended glands or small cribriform proliferations in non‐distended glands, formerly named cribriform PIN. 1 The presence of AIP on biopsy is predictive for IDC at subsequent RP and both lesions have similar ERG and phosphatase and tensin homologue deleted on chromosome 10 (PTEN) alterations. 9 , 10 , 11
The pathogenesis of IDC has been a matter of debate, with the existence of two hypotheses. 12 , 13 , 14 , 15 Most believe that IDC represents retrograde colonisation of pre‐existent prostatic glands by malignant invasive tumour cells. This theory is supported by the fact that (a) the vast majority of IDC is concurrently present with invasive ISUP grade group (GG) ≥ 2 PCa and (b) IDC has similar genomic alterations as adjacent invasive PCa, such as loss of PTEN. 12 Conversely, IDC can rarely be observed as an isolated lesion or adjacent to low‐volume GG1 PCa in RP specimens, which is unlikely to result from retrograde colonisation. In these cases, IDC would more probably represent a precursor lesion. 13 , 14 Both hypotheses are now considered to be simultaneously true, with most IDC lesions thought to represent retrograde spread and rare IDC lesions being precursors.
Despite the popularity of the retrograde colonisation theory, one question remains unanswered: what is the spatial organisation of the transition areas where invasive PCa enters and expands pre‐existent glands? This issue is difficult to resolve because microscopical assessment is generally performed on 5‐μm‐thick slides, which hampers the reconstruction of the three‐dimensional (3D) coherence of glandular structures. Recently, we have developed a methodology for 3D imaging of intact formalin‐fixed paraffin‐embedded (FFPE) tissue specimens, which provides profound insight into the actual 3D organisation of benign and malignant prostate samples. 16 , 17 The objective of the current study is to identify and characterise IDC‐invasive PCa transitions in RP specimens combining 2D and 3D. Based on our findings, we propose an alternative unifying hypothesis on the pathogenesis of IDC.
Materials and methods
Study population
This study includes PCa patients who had undergone RP without prior hormonal or radiation therapy at Erasmus MC Cancer Institute, Rotterdam, the Netherlands between 2005 and 2013. All specimens were totally embedded and had previously been reviewed for study purposes, with recording of Gleason score/GG, invasive cribriform or intraductal carcinoma (CR/IDC), pT‐stage and surgical margin status. 18 We selected 75 samples from 46 PCa patients with CR/IDC from our database, with one (n = 23), two (n = 17) or three (n = 6) representative tissue blocks per patient. The study was approved by Erasmus MC Ethical Committee (MEC‐2024‐0281).
Histopathological evaluation
Selected haematoxylin and eosin (H&E) slides were reviewed by two genitourinary pathologists (L.R., G.v.L.) in common sessions. The presence of IDC, AIP, PIN and invasive PCa was recorded for each slide according to the World Health Organisation (WHO) 5th edition definitions. 1 An arbitrary distinction was made between IDC, AIP, PIN and invasive PCa being adjacent to (≤ 1 mm) or distant from (> 1 mm) each other.
Immunohistochemistry
For the evaluation of prostate basal cells, automated immunohistochemistry using the Ventana Benchmark ULTRA (Ventana Medical Systems, Tucson, AZ, USA) was used. Sequential 4‐μm FFPE sections were stained for mouse anti‐human keratin 34BE12 with the Ultraview (UV) 3,3’‐diaminobenzidine (DAB) detection. In brief, following deparaffinisation and heat‐induced antigen retrieval with CC1 for 64 min, tissue samples were incubated with the primary antibody for 32 min at 37°C. Incubation was followed by UV detection and haematoxylin II counterstain for 8 min followed by a blue colouring reagent for 8 min, according to the manufacturer's instructions. For double‐stainings, after deparaffinisation and heat‐induced antigen retrieval with CC1 for 32 min, samples were incubated first with rabbit anti‐human PTEN for 120 min at 37°C followed by OV detection. Secondly, 34BE12 was incubated for 32 min at 37°C and detected with UVR, followed by haematoxylin II counterstain. Photographs of H&E and immunohistochemical stainings were collected after NanoZoomer HT2.0 digital scanning (Hamamatsu, Honshu, Japan).
Three‐dimensional imaging
Six representative tissue slides containing either putative IDC (n = 3), AIP (n = 2) or PIN (n = 1) transitions to invasive PCa were selected, and respective regions of interest (ROIs) were marked on the immunohistochemical slide. Tissue punches were taken from corresponding FFPE blocks using a 1.5‐mm diameter needle (Estigen, Tartu, Estonia). Tissue punching, immunofluorescent labelling, clearing and imaging were performed as described previously. 19 Briefly, tissue punches were deparaffinised and progressively rehydrated. After treatment with 5% hydrogen peroxide and 3% milk, punches were incubated with 1:100 anti‐keratin 5 (Abcam, Cambridge, UK) and 1:100 anti‐keratin 8/18 antibodies (Thermo Fisher Scientific, Waltham, MA, USA), followed by 1:200 anti‐rabbit Alexa‐514 and anti‐mouse Alexa‐647 (Thermo Fisher Scientific, Eindhoven, the Netherlands). Finally, punches were gradually dehydrated in methanol, optically cleared using benzyl alcohol–benzyl benzoate and stored at 4°C in the dark until imaging. Tissue punches were imaged using an upright Leica SP5 confocal microscope equipped with a 1.95‐mm working distance 20 × NA1.0 APO water‐dipping objective (Leica Microsystems, Wetzlar, Germany). The 488‐nm Argon and 633‐nm HeNe lasers were used to create Z‐stacks of images of 369 × 369 μm size (1024 × 1024‐pixels) and 0.25‐μm step size. Deconvolution of Z‐stack images was performed by Huygens Professional software (SVI, Hilversum, the Netherlands), and processed images, image stacks and 3D projections were created using open source software Fiji. 20
Results
Patient characteristics
Patient characteristics are summarised in Supporting information, Table S1. Twenty‐two of 46 patients (47.8%) had GG2, 18 (39.1%) GG3 and six (13.0%) GG4 or GG5, and all had CR/IDC in their RP specimen.
Histopathological evaluation
Of 75 tissue sections, 45 (60.0%) contained IDC, 52 (69.3%) AIP and 58 (77.3%) PIN. In 44 of 45 (97.8%) samples having IDC, loose cribriform AIP was directly continuous or adjacent (≤ 1 mm) to dense cribriform IDC. PIN was present adjacent to IDC in 40 of 45 (88.9%) samples with IDC and adjacent to AIP in 48 of 52 (92.3%) samples with AIP (Figure 1).
Figure 1.

Prostate cancer with high‐grade prostatic intra‐epithelial neoplasia (PIN, green asterisk), atypical intraductal proliferation (AIP, red asterisk) and intraductal carcinoma (IDC, black asterisk) being present at close proximity. [Color figure can be viewed at wileyonlinelibrary.com]
Two‐dimensional identification of IDC‐invasive transitions
Basal cells either formed a continuous or scattered layer around IDC, AIP and PIN, and were absent in distant invasive PCa. In 35 slides, atypical glands that were morphologically indistinguishable from invasive adenocarcinoma (IAC) had scattered or continuous 34BE12‐positive basal cells. These IAC‐like glands were present directly adjacent to IDC, AIP and PIN, and were located between in‐situ and clearly IAC without basal cells (Figure 2). In some IDC cases, cribriform PIN‐like AIP and IAC‐like glands were directly adjacent and morphologically continuous. IAC‐like glands were observed adjacent to IDC, AIP or PIN in 21 of 45 (46.7%), 17 of 52 (32.7%) and 16 of 58 (27.6%) slides, respectively. In 24 of 35 (68.6%) samples containing IAC‐like glands, more than one focus was identified per slide (median = 3.0; range = 1–8). In total, 112 IAC‐like foci were recognised, 45 of which were adjacent to IDC, 37 to AIP and 30 to PIN (Supporting information, Table S1).
Figure 2.

A, High‐grade prostatic intra‐epithelial neoplasia (PIN, green asterisk), atypical intraductal proliferation (AIP, red asterisk) and intraductal carcinoma (IDC, black asterisk) surrounded by basal cells. B–D, Putative transitions of IDC (black asterisk) and AIP (red asterisk) to invasive adenocarcinoma (IAC)‐like glands, which have an irregular invasive architecture with remnant basal cells (black arrowhead). The IAC‐like glands are located adjacent to IDC and AIP, and spatially situated in between IDC and AIP at one side and invasive adenocarcinoma without basal cells at the other side; 34BE12, original magnifications. [Color figure can be viewed at wileyonlinelibrary.com]
PTEN status in IDC and IAC‐like glands
PTEN immunohistochemistry was assessed in IDC and adjacent invasive PCa in 31 samples from 29 patients. Fifteen samples had homogeneous PTEN status in IDC, IAC‐like glands, adjacent and distant invasive PCa, with complete loss in nine and intact expression in six. Heterogeneous PTEN expression was observed in 16 of 31 (51.6%) samples. In 14 (45.2%) cases PTEN was lost in IDC, IAC‐glands and adjacent PCa while being retained in distant PCa (Figure 3). In two (6.5%) cases, PTEN was retained in IDC, AIP, IAC‐like glands and adjacent PCa, while being lost in distant PCa. Together these findings show that although PTEN expression was heterogeneous in half the samples, PTEN expression status was consistent within local regions of IDC, IAC‐like glands and directly adjacent PCa in all cases.
Figure 3.

Phosphatase and tensin homologue deleted on chromosome 10 (PTEN) expression in high‐grade prostatic intra‐epithelial neoplasia (PIN, green asterisk), atypical intraductal proliferation (AIP, red asterisk), intraductal carcinoma (IDC, black asterisk), invasive adenocarcinoma (IAC)‐like glands and invasive adenocarcinoma. A, PTEN heterogeneity in invasive adenocarcinoma with retained (left) and lost (right) expression. B, PTEN heterogeneity in invasive adenocarcinoma with retained (left) and lost (right) expression; PTEN expression is retained in PIN and lost in AIP. C, PTEN loss in IAC‐glands (black arrowhead) and invasive adenocarcinoma. D, PTEN loss in IDC, IAC‐like glands and invasive adenocarcinoma; area of retained PTEN expression in right upper corner. Double‐staining PTEN (brown)/34BE12 (red), original magnifications. [Color figure can be viewed at wileyonlinelibrary.com]
3D identification of transitions
3D‐whole mount confocal microscopy was performed on three IDC and two AIP samples and one PIN sample with IAC‐like glands, based on immunohistochemical basal cell staining. Typically, basal cells were present as a contiguous layer or as scattered cells surrounding IDC, AIP and PIN, and were completely absent in distant invasive PCa. In each case, direct spatial continuity was observed between in‐situ lesions and invasive PCa. In five samples, IAC‐like glands were intermediate between the in‐situ lesion and invasive PCa. Three‐dimensionally, these IAC‐like structures represented well‐delineated and poorly formed epithelial tubules with branching and interconnections. Basal cells were present contiguously, individually or in small clusters around IAC‐like glands adjacent to IDC, AIP and PIN, and were gradually lost in the direction of invasive PCa (Figure 4A–C; Supporting information, Videos S1, S3, S4). In one case, poorly formed invasive PCa was directly continuous with IDC with abrupt basal cell loss (Figure 4D–F; Supporting information, Video S2).
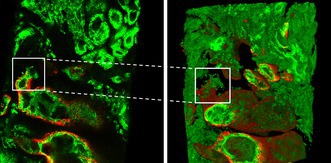
Figure 4.

Representations of atypical intraductal proliferation (AIP; A–C) and intraductal carcinoma (IDC; D–F) transitions to invasive prostate cancer (PCa). A–C, Spatial transition (white box) from AIP to poorly formed Gleason pattern 4 PCa with gradual loss of basal cells (red). D–F, Spatial transition (white box) of IDC to poorly formed Gleason pattern 4 PCa with abrupt complete loss of basal cells. A, B, D, E, Two‐dimensional microscopy of representative Z‐stack image. C, F, Three‐dimensional representation of complete Z‐stack. Keratin 5 red, keratin 8/18 green. [Color figure can be viewed at wileyonlinelibrary.com]
Discussion
Recognition of IDC's independent prognostic value has been a major pathological contribution to PCa clinical management, optimising personalised treatment for a large group of patients. Despite the clinical impact of IDC, its pathogenesis has been a matter of debate. The most accepted hypothesis states that IDC originates from retrograde colonisation of pre‐existent glands by invasive PCa. Conversely, in rare cases IDC can occur in the absence of invasive PCa, supporting the hypothesis that some forms of IDC represent precursor lesions. However, the location and morphology of the transitions between invasive PCa and IDC have not yet been recognised. In the current study, we aimed to identify spatial transitions of IDC and invasive PCa and made the following observations: (a) PIN, AIP and IDC were frequently located close together, suggesting that they might be clonally related in these areas; (b) multiple areas of spatial continuity between in‐situ lesions and invasive PCa were identified using 2D and 3D imaging through intermediate branching structures forming IAC‐like glands; and (c) at these transition sites, basal cells were gradually lost from IDC to invasive PCa. Based on these findings, we propose a new unifying model on IDC pathogenesis which we label ‘repetitive invasion, precursor progression’ (RIPP).
The RIPP model assumes that PIN is the general precursor of PCa. After accumulation of sufficient or specific genomic alterations, some luminal PIN cells infiltrate adjacent stroma and establish mainly low‐grade invasive PCa. While the molecular profile of invasive PCa has been studied extensively, little attention has been paid to the remnant PIN cells in pre‐existent glands. After stromal invasion, we propose that the remaining PIN cells that did not infiltrate through this focus contribute to cancer progression in two ways. First, these cells proliferate, expand and are able to infiltrate the stroma again at another location, because of their acquired genomic alterations that facilitate invasion. This biological process of stromal infiltration may be repeated several times (‘repetitive invasion’), as supported by the presence of multiple foci (median = 3.0; range = 1–8) of transitional IAC‐like glands, even within one tissue slide. At the same time, remnant non‐invasive PIN cells may progressively accumulate genomic alterations, which finally results in the formation of IDC lesions with AIP being present at the interface of PIN and IDC (‘precursor progression’). Following the repetitive invasion capacity, luminal AIP and IDC cells could also subsequently infiltrate adjacent stroma. At the end, RIPP is microscopically mirrored by the heterogeneous disease that PCa is known to be, with multiple precursor PIN, AIP and IDC lesions having transitioned towards invasive PCa within the same prostate. The RIPP model is schematically summarised in Figure 5.
Figure 5.

Schematic overview of the ‘repetitive invasion, precursor progression’ (RIPP) model. A, Within a pre‐existent prostate gland luminal epithelial cells (grey) acquire genomic alteration and develop into prostatic intra‐epithelial neoplasia (PIN) (green); the pre‐existent gland and PIN are surrounded by basal epithelial cells (red). B, Luminal PIN cells infiltrate adjacent stroma with gradual loss of basal cells, named invasive adenocarcinoma (IAC)‐like glands. C, Upon further proliferation, invasive tumour glands completely lose basal cells. As remnant luminal PIN cells had acquired infiltrative capacity, they invade adjacent stroma again at another location (‘repetitive invasion’). D, Intraglandular remnant PIN cells further accumulate genomic alterations finally resulting in progression towards intraductal carcinoma (IDC, blue) (‘precursor progression’). E, IDC cells subsequently infiltrate adjacent stroma with gradual loss of basal cells (‘repetitive invasion’). [Color figure can be viewed at wileyonlinelibrary.com]
The RIPP model can explain and unify observations of both the precursor and retrograde colonisation hypotheses for intraductal carcinogenesis. The model is compatible with the rare finding of IDC existing without invasive PCa. 14 , 21 This can be explained by progressive molecular derangement of PIN cells without having yet infiltrated surrounding stroma. The coexistence of IDC with GG1 could be explained in the same way, with prior invasion of PIN into surrounding stroma with subsequent or concomitant intraglandular progression towards AIP and IDC.
The histopathological and molecular arguments that have supported the retrograde colonisation model can also be explained by the RIPP hypothesis. The fact that IDC is clonally related to adjacent high‐grade invasive PCa has frequently been used as an argument for retrograde colonisation. 12 , 22 , 23 , 24 , 25 , 26 However, this clonal relation could also have resulted from precursor IDC, with subsequent stromal invasion. Some studies found more pronounced genomic alterations in IDC and directly adjacent invasive PCa than in other invasive tumour parts. For instance, Haffner et al. found loss of PTEN in invasive PCa, IDC and adjacent PIN, while other areas of invasive PCa had retained PTEN expression, which is completely in line with our finding of PTEN loss in IDC while PTEN was retained in distant invasive PCa in 45% of cases. 12 As invasive PCa with retained PTEN expression cannot be derived from IDC with genomic PTEN loss, one might deduce that IDC originates from invasive PCa colonising pre‐existent glands. Alternatively, according to the RIPP model, invasive PCa with retained PTEN would be derived from PIN with intact PTEN. Precursor progression with PTEN loss in PIN and IDC with subsequent invasion would then result in adjacent PTEN‐negative invasive PCa. The accumulation of genomic alterations in IDC compared to PIN, the observation that some PIN and IDC are clonally related and that IDC and invasive PCa have a common ancestor are all also in accordance with a precursor progression model. 12 , 27 , 28 , 29
Two observations can be explained by the RIPP model more easily than by retrograde colonisation. First, the rare occurrence of IDC without invasive PCa cannot be explained by retrograde spread and requires the concomitant acceptance of the alternative precursor hypothesis, but is part of the RIPP model. Secondly, if invasive PCa penetrates pre‐existent glandular structures, it is expected that basal cells would be pushed inward. Retrograde colonisation does not easily explain the presence and gradual loss of basal cells in IAC‐like glands which are spatially intermediate between IDC and invasive PCa. Interestingly, rare clinicopathological studies report basal cells to be present surrounding morphologically invasive PCa or even in an anecdotal lymph node metastasis. 30 , 31 Oliai et al. described 25 PCa needle biopsies with retained basal cells, most of which were localised adjacent to PIN. 30 Following our hypothesis, these transition areas represent IAC‐like glands with partially retained basal cells. Such a feature had already been described more than 30 years ago by McNeal et al., who identified ‘transitive’ glands which appeared to represent a new architecture with occasional basal cells, between ‘duct‐acinar dysplasia’ and invasive cancer. 32 Whereas McNeal et al. mainly included low‐grade ‘microcarcinomas’ of < 0.05 cm3, our findings indicate that the same mechanism also occurs in IDC to invasive PCa transition. A phenomenon where infiltrating glands are ‘dragging’ basal cells from the in‐situ precursor to distant invasive PCa can explain basal cell retainment in invasive PCa and the anecdotal lymph node metastasis. As such, the ‘dragging’ of basal cells is not compatible with retrograde colonisation.
Definitive evidence of either the RIPP or retrograde colonisation model is lacking, as dynamic human in‐vivo models are not currently available to investigate the temporal and spatial progression of PCa. Detailed clonal ancestry analysis and 3D imaging of PIN, AIP, IDC and their surrounding transition areas are likely to provide supportive evidence of either model. Using detailed copy number alteration analysis of 34 morphologically distinct regions in one RP specimen, Lindberg et al. found IDC to represent the clone most closely related to metastasis. 33 As IDC as an intraglandular lesion may not be able to metastasise on itself, invasive PCa derived from IDC would have this capacity. However, the respective IDC‐invasive PCa transitional area could still be easily missed, even when sampling such a relatively large number of regions. It cannot be excluded that both models coexist in the pathogenesis of IDC. However, based on our findings, RIPP seems more likely and probably more common than retrograde colonisation.
The strengths of this study are its unique focus on IDC‐invasive PCa transitions by using both 2D and 3D image analyses. However, the latter is limited by the small number of cases tested due to technical complexity. 3D whole‐mount microscopy was challenging, as the sampling of the ROI in deeper punched areas often lacked the structure previously identified on the glass slide, or did not contain the full spectrum of in‐situ lesion, IAC‐like glands and invasive PCa in the same field of view. Furthermore, we limited our molecular analysis to PTEN immunohistochemistry to demonstrate potential common genomic alterations between IDC, IAC‐like glands and invasive PCa. More precision could be obtained by deeper single‐cell molecular analysis of the transition areas, providing clearer insight into mutual clonal and ancestral relations. As our study provides a classification of IAC‐like glands, future research could elucidate upon their clinicopathological characteristics in more detail.
In conclusion, this study investigated the previously undescribed transition area between IDC and invasive PCa. This allowed for the definition of intermediate IAC‐like glands characterised by gradual loss of basal cells from precursor lesions to distant invasive PCa. Based upon our 2D and 3D image analyses, we propose a new unifying model for the pathogenesis of IDC, which we term ‘repetitive invasion, precursor progression’ (RIPP).
Conflicts of interest
None of the authors declare any conflicts of interest.
Supporting information
Data S1.
Video S1. 3D stack of a transition of atypical intraductal proliferation (AIP) to invasive poorly‐formed Gleason pattern 4 prostate cancer, originally depicted in Figure 4A–C.
Video S2. 3D stack of a transition of intraductal carcinoma (IDC) to invasive poorly‐formed Gleason pattern 4 prostate cancer, originally depicted in Figure 4D–F.
Video S3. 3D stack of a transition of atypical intraductal proliferation (AIP) to invasive Gleason pattern 3 prostate cancer.
Video S4. 3D stack of a transition of high‐grade prostatic intraepithelial neoplasia (PIN; left upper corner), atypical intraductal proliferation (AIP) and intraductal carcinoma (IDC; left lower corner) to invasive Gleason pattern 3 prostate cancer, with gradual loss of basal cells (centre). Keratin 5 red, keratin 8/18 green.
Acknowledgements
We thank the Jaap Schouten Foundation for their generous funding of this study.
Data availability statement
The data that support the findings of this study are available from the corresponding author upon reasonable request.
References
- 1. Moch H. WHO classification of tumours: urinary and male genital tumours. 5th ed. International Agency for Research on Cancer (IACR), 2022. Lyon, France. [Google Scholar]
- 2. Guo CC, Epstein JI. Intraductal carcinoma of the prostate on needle biopsy: histologic features and clinical significance. Mod. Pathol. 2006; 19; 1528–1535. [DOI] [PubMed] [Google Scholar]
- 3. Hollemans E, Verhoef EI, Bangma CH et al. Large cribriform growth pattern identifies isup grade 2 prostate cancer at high risk for recurrence and metastasis. Mod. Pathol. 2019; 32; 139–146. [DOI] [PMC free article] [PubMed] [Google Scholar]
- 4. Kweldam CF, Kümmerlin IP, Nieboer D et al. Disease‐specific survival of patients with invasive cribriform and intraductal prostate cancer at diagnostic biopsy. Mod. Pathol. 2016; 29; 630–636. [DOI] [PubMed] [Google Scholar]
- 5. McKenney JK, Wei W, Hawley S et al. Histologic grading of prostatic adenocarcinoma can be further optimized: analysis of the relative prognostic strength of individual architectural patterns in 1275 patients from the canary retrospective cohort. Am. J. Surg. Pathol. 2016; 40; 1439–1456. [DOI] [PubMed] [Google Scholar]
- 6. Trudel D, Downes MR, Sykes J, Kron KJ, Trachtenberg J, van der Kwast TH. Prognostic impact of intraductal carcinoma and large cribriform carcinoma architecture after prostatectomy in a contemporary cohort. Eur. J. Cancer 2014; 50; 1610–1616. [DOI] [PubMed] [Google Scholar]
- 7. van Leenders G, van der Kwast TH, Grignon DJ et al. The 2019 International Society of Urological Pathology (ISUP) consensus conference on grading of prostatic carcinoma. Am. J. Surg. Pathol. 2020; 44; e87–e99. [DOI] [PMC free article] [PubMed] [Google Scholar]
- 8. Epstein JI, Amin MB, Fine SW et al. The 2019 Genitourinary Pathology Society (GUPS) white paper on contemporary grading of prostate cancer. Arch. Pathol. Lab Med. 2021; 145; 461–493. [DOI] [PubMed] [Google Scholar]
- 9. Hickman RA, Yu H, Li J et al. Atypical intraductal cribriform proliferations of the prostate exhibit similar molecular and clinicopathologic characteristics as intraductal carcinoma of the prostate. Am. J. Surg. Pathol. 2017; 41; 550–556. [DOI] [PubMed] [Google Scholar]
- 10. Shah RB, Nguyen JK, Przybycin CG et al. Atypical intraductal proliferation detected in prostate needle biopsy is a marker of unsampled intraductal carcinoma and other adverse pathological features: a prospective clinicopathological study of 62 cases with emphasis on pathological outcomes. Histopathology 2019; 75; 346–353. [DOI] [PubMed] [Google Scholar]
- 11. Shah RB, Yoon J, Liu G, Tian W. Atypical intraductal proliferation and intraductal carcinoma of the prostate on core needle biopsy: a comparative clinicopathological and molecular study with a proposal to expand the morphological spectrum of intraductal carcinoma. Histopathology 2017; 71; 693–702. [DOI] [PubMed] [Google Scholar]
- 12. Haffner MC, Weier C, Xu MM et al. Molecular evidence that invasive adenocarcinoma can mimic Prostatic Intraepithelial Neoplasia (PIN) and intraductal carcinoma through retrograde glandular colonization. J. Pathol. 2016; 238; 31–41. [DOI] [PMC free article] [PubMed] [Google Scholar]
- 13. Khani F, Epstein JI. Prostate biopsy specimens with gleason 3+3=6 and intraductal carcinoma: radical prostatectomy findings and clinical outcomes. Am. J. Surg. Pathol. 2015; 39; 1383–1389. [DOI] [PubMed] [Google Scholar]
- 14. Miyai K, Divatia MK, Shen SS, Miles BJ, Ayala AG, Ro JY. Heterogeneous clinicopathological features of intraductal carcinoma of the prostate: a comparison between ‘precursor‐like’ and ‘regular type’ lesions. Int. J. Clin. Exp. Pathol. 2014; 7; 2518–2526. [PMC free article] [PubMed] [Google Scholar]
- 15. Zong Y, Montironi R, Massari F et al. Intraductal carcinoma of the prostate: pathogenesis and molecular perspectives. Eur. Urol. Focus 2021; 7; 955–963. [DOI] [PubMed] [Google Scholar]
- 16. Verhoef EI, van Cappellen WA, Slotman JA et al. Three‐dimensional architecture of common benign and precancerous prostate epithelial lesions. Histopathology 2019; 74; 1036–1044. [DOI] [PMC free article] [PubMed] [Google Scholar]
- 17. Verhoef EI, van Cappellen WA, Slotman JA et al. Three‐dimensional analysis reveals two major architectural subgroups of prostate cancer growth patterns. Mod. Pathol. 2019; 32; 1032–1041. [DOI] [PMC free article] [PubMed] [Google Scholar]
- 18. Hollemans E, Verhoef EI, Bangma CH et al. Prostate carcinoma grade and length but not cribriform architecture at positive surgical margins are predictive for biochemical recurrence after radical prostatectomy. Am. J. Surg. Pathol. 2020; 44; 191–197. [DOI] [PubMed] [Google Scholar]
- 19. van Royen ME, Verhoef EI, Kweldam CF et al. Three‐dimensional microscopic analysis of clinical prostate specimens. Histopathology 2016; 69; 985–992. [DOI] [PubMed] [Google Scholar]
- 20. Schindelin J, Arganda‐Carreras I, Frise E et al. Fiji: an open‐source platform for biological‐image analysis. Nat. Methods 2012; 9; 676–682. [DOI] [PMC free article] [PubMed] [Google Scholar]
- 21. Khani F, Wobker SE, Hicks JL et al. Intraductal carcinoma of the prostate in the absence of high‐grade invasive carcinoma represents a molecularly distinct type of in situ carcinoma enriched with oncogenic driver mutations. J. Pathol. 2019; 249; 79–89. [DOI] [PubMed] [Google Scholar]
- 22. Han B, Suleman K, Wang L et al. Ets gene aberrations in atypical cribriform lesions of the prostate: implications for the distinction between intraductal carcinoma of the prostate and cribriform high‐grade prostatic intraepithelial neoplasia. Am. J. Surg. Pathol. 2010; 34; 478–485. [DOI] [PubMed] [Google Scholar]
- 23. Schneider TM, Osunkoya AO. Erg expression in intraductal carcinoma of the prostate: comparison with adjacent invasive prostatic adenocarcinoma. Mod. Pathol. 2014; 27; 1174–1178. [DOI] [PubMed] [Google Scholar]
- 24. Sorvina A, Martini C, Prabhakaran S et al. Appl1, sortilin and syndecan‐1 immunohistochemistry on intraductal carcinoma of the prostate provides evidence of retrograde spread. Pathology 2023; 55; 792–799. [DOI] [PubMed] [Google Scholar]
- 25. Vormittag‐Nocito E, Acosta AM, Agarwal S et al. In‐depth comparison of genetic variants demonstrates a close relationship between invasive and intraductal components of prostate cancer. Mod. Pathol. 2023; 36; 100130. [DOI] [PubMed] [Google Scholar]
- 26. Watanabe R, Miura N, Kurata M, Kitazawa R, Kikugawa T, Saika T. Unveiling the genomic landscape of intraductal carcinoma of the prostate using spatial gene expression analysis. Int. J. Mol. Sci. 2024; 25; 4818. [DOI] [PMC free article] [PubMed] [Google Scholar]
- 27. Bettendorf O, Schmidt H, Staebler A et al. Chromosomal imbalances, loss of heterozygosity, and immunohistochemical expression of tp53, rb1, and pten in intraductal cancer, intraepithelial neoplasia, and invasive adenocarcinoma of the prostate. Genes Chromosomes Cancer 2008; 47; 565–572. [DOI] [PubMed] [Google Scholar]
- 28. Lotan TL, Gumuskaya B, Rahimi H et al. Cytoplasmic pten protein loss distinguishes intraductal carcinoma of the prostate from high‐grade prostatic intraepithelial neoplasia. Mod. Pathol. 2013; 26; 587–603. [DOI] [PMC free article] [PubMed] [Google Scholar]
- 29. Taylor RA, Fraser M, Livingstone J et al. Germline BRCA2 mutations drive prostate cancers with distinct evolutionary trajectories. Nat. Commun. 2017; 8; 13671. [DOI] [PMC free article] [PubMed] [Google Scholar]
- 30. Oliai BR, Kahane H, Epstein JI. Can basal cells be seen in adenocarcinoma of the prostate? An immunohistochemical study using high molecular weight cytokeratin (clone 34betae12) antibody. Am. J. Surg. Pathol. 2002; 26; 1151–1160. [DOI] [PubMed] [Google Scholar]
- 31. Varma M, Alchami FS, Griffiths DF. Retained basal cells in metastatic prostate cancer. Histopathology 2016; 69; 338–340. [DOI] [PubMed] [Google Scholar]
- 32. McNeal JE, Villers A, Redwine EA, Freiha FS, Stamey TA. Microcarcinoma in the prostate: its association with duct‐acinar dysplasia. Hum. Pathol. 1991; 22; 644–652. [DOI] [PubMed] [Google Scholar]
- 33. Lindberg J, Kristiansen A, Wiklund P, Grönberg H, Egevad L. Tracking the origin of metastatic prostate cancer. Eur. Urol. 2015; 67; 819–822. [DOI] [PubMed] [Google Scholar]
Associated Data
This section collects any data citations, data availability statements, or supplementary materials included in this article.
Supplementary Materials
Data S1.
Video S1. 3D stack of a transition of atypical intraductal proliferation (AIP) to invasive poorly‐formed Gleason pattern 4 prostate cancer, originally depicted in Figure 4A–C.
Video S2. 3D stack of a transition of intraductal carcinoma (IDC) to invasive poorly‐formed Gleason pattern 4 prostate cancer, originally depicted in Figure 4D–F.
Video S3. 3D stack of a transition of atypical intraductal proliferation (AIP) to invasive Gleason pattern 3 prostate cancer.
Video S4. 3D stack of a transition of high‐grade prostatic intraepithelial neoplasia (PIN; left upper corner), atypical intraductal proliferation (AIP) and intraductal carcinoma (IDC; left lower corner) to invasive Gleason pattern 3 prostate cancer, with gradual loss of basal cells (centre). Keratin 5 red, keratin 8/18 green.
Data Availability Statement
The data that support the findings of this study are available from the corresponding author upon reasonable request.