

Abstract
Background
Heart failure (HF) is frequently associated with malnutrition or malnutrition risk. The delivery of medically tailored meals (MTM) to the homes of patients with HF and malnutrition risk or malnutrition after hospital discharge holds promise for improving outcomes. However, the number of MTM needed to provide benefit is not established.
Methods
A random order crossover study was designed to compare the delivery of 7 versus 21 MTM for four weeks each to patients discharged from the hospital with HF and malnutrition risk. Telephone surveys were conducted at baseline, 30, and 60 days post-discharge to evaluate change in malnutrition risk, American Heart Association (AHA) diet goals, sarcopenia risk, and 30-day readmissions.
Results
Forty-six patients were enrolled. Patients had reduced odds of having malnutrition risk relative to the baseline score at one and two months (OR 0.18, 95% CI 0.04–0.74 and OR 0.21, 95% CI 0.05–0.99, respectively). The AHA diet score improved over time from baseline by 0.73 ± 0.22 units at one month (p = 0.0014), and by 0.48 ± 0.23 units at two months (p = 0.0430), regardless of the number of MTM provided. Sarcopenia risk improved over time (p = 0.01), decreasing by 0.43 ± 0.2 units by one (p = 0.03) and 0.59 ± 0.21 units by two months (p = 0.007) regardless of the number of MTM provided. Readmissions by 30 days were not significantly different based on the number of MTM provided (9% for 21 MTM vs 12.5% for 7 MTM), but well below national data at 23%.
Conclusion
The provision of at least seven MTM per week in the early window after hospital discharge to patients with HF and malnutrition or malnutrition risk is a promising strategy to improve malnutrition and sarcopenia risk and diet adherence, while keeping readmissions below national averages.
Trial registration
Clinicaltrials.gov NCT06142903, registered 11/23/2023.
Keywords: Heart failure, Medically tailored meals, Malnutrition risk, MST, SARC-F
Introduction
Heart failure (HF) is a prevalent, serious medical condition with great economic significance. Heart failure is caused by the heart’s inability to maintain adequate cardiac output to deliver blood and oxygen to meet metabolic demands [1]. There are more than six million adults in the US diagnosed with HF [2], and 26 million cases globally, a rate that is steadily increasing [3]. In the US in 2012, HF was associated with a cost of $30.7 million due to health care services, medications, and missed days of work, and with excess hospitalization and mortality globally [3].
The chronic inflammatory response that characterizes HF has profound negative effects on nutritional status. Systemic inflammation, mediated by pro-inflammatory cytokines, results in increased catabolism and reduced anabolism with a resulting loss of muscle mass and body weight [4, 5]. Insulin resistance further compromises cellular energy homeostasis. Hepatic congestion and edema in the gut may increase nausea and result in early satiety [6]. Cardiac cachexia, driven by pro-inflammatory cytokines, occurs in 10–39% of patients with HF, resulting in weight loss of 6% or more in 6–12 months, as well as loss of muscle mass and protein catabolism [7, 8]. Sarcopenia, a loss of muscle mass and strength, increases with aging and may complicate HF by reducing physical performance and cardiorespiratory fitness [6, 8]. Dyspnea and the work of breathing consume energy and may also complicate the patient’s ability to prepare and ingest appropriate foods. The result of these combined processes is negative energy and protein balance, weight loss, and muscle wasting [6, 9], characteristic signs of disease-associated malnutrition [4, 10]. Thus, all patients with HF carry a risk of developing malnutrition.
Malnutrition risk is typically assessed by patient report of unintentional weight loss and compromised food intake [11, 12]. Some patients with HF and malnutrition risk ultimately receive a diagnosis of frank malnutrition. The presence of an inflammation-linked diagnosis (such as HF) is a potential etiologic factor and more detailed assessment of the extent and duration of unintentional weight loss and loss of muscle mass can result in the diagnosis of protein-energy malnutrition [4, 10, 13], and potentially cachexia [6].
Malnutrition is associated with worse clinical outcomes. In an observation of 4000 patients with HF, 57% had malnutrition and mortality was increased relative to those without malnutrition [14]. In fact, malnutrition in patients with HF is consistently associated with increased mortality [15–17], infectious risk [18], and poor quality of life [17].
Diet therapy is a mainstay of HF management. In the context of a diet with appropriate energy intake, the American Heart Association (AHA) has recommended a parsimonious set of dietary intake goals aligned with the Diet Approach to Stop Hypertension [19–21] to prevent and treat cardiac diseases. Intake of fruits, vegetables, whole grains, nuts/seeds/legumes are encouraged, together with limited intake of red and cured meat, sugary beverages, salt, and saturated fats [22]. Patients with HF should follow a sodium-restricted diet as a strategy to limit fluid accumulation that can exacerbate symptoms of edema, bloating and dyspnea. However, there is a risk that severe salt restriction during more advanced phases of HF may compromise caloric and protein intake due to decreased meal palatability with unfavorable impact on food intake, nutrition status, quality of life, and health [20, 23, 24].
Interventions such as provision of medically tailored meals (MTM) to the patient’s home hold the potential to improve malnutrition and clinical outcomes for patients with HF. Medically tailored meals for patients with HF can be designed to deliver foods consistent with the AHA Diet Goals as well as any modifications needed for diabetes or other conditions [25]. A systematic review concluded that patients with HF treated with 7 MTM/week have 16% fewer readmissions and a 38-day shorter length of hospital stay [26]. An economic projection of the impact of providing 10 MTM/week for eight months to patients with diet-sensitive conditions, including HF, suggested that insurance coverage of MTM would save the US more than $13 billion annually in prevention of hospitalizations [27]. However, the number of MTM needed to achieve clinical impact in patients with HF, whose disease symptoms are complex, is not yet established.
In a random order crossover design, this project was designed to compare the effectiveness of provision of seven versus 21 MTM/week, each for one month, to patients with HF and a malnutrition diagnosis or risk of malnutrition on the primary outcome of malnutrition risk after hospital discharge. Secondary outcomes were adherence to the AHA Diet Goals, healthcare utilization (unplanned emergency department visits and readmissions), and sarcopenia risk. We hypothesized that MTM would reduce malnutrition risk, improve diet adherence, reduce healthcare utilization and sarcopenia risk, and that 21 MTM might have a stronger impact than 7 MTM/week.
Methods
This random order crossover trial was conducted in accordance with all applicable University of Pennsylvania Research Policies and Procedures and with use of a consent form approved by the Institutional Review Board. The study was carried out in full compliance with the Helsinki Declaration.
Patients with HF who were identified with malnutrition either using the Academy ASPEN Indicators of Malnutrition [28] or malnutrition risk using the Malnutrition Screening Tool (MST) [12] during their hospital admission were offered participation if they were adults with age ≥ 18 and < 90 years who had a diagnosis of HF (NYHA Class 1–3/ ACC/AHA Stage C). Patients were excluded if they had HF NYHA Class 4 or stage D, chronic kidney disease stage 5 or were dialysis dependent, had dementia or cognitive decline, unstable COPD, active cancer therapy, pregnancy, residence in a facility (prison, long-term care, rehabilitation) where meals could not be delivered, allergy to foods on the menus, persistent hyperkalemia or persistent hypotension during the hospital admission, or active substance or alcohol use.
Consented patients were randomized using a computer-generated scheme to either seven MTM (dinner) or 21 MTM (seven breakfast, seven lunch, seven dinner meals) each week delivered to their home for four weeks duration then switched to the other MTM treatment arm in a crossover study design (Fig. 1). Because the study meals were provided using the same foods, a washout period between the two MTM treatment arms was not indicated. The MTM were provided by the Metropolitan Area Neighborhood Nutrition Alliance (MANNA), a non-profit community-based food and nutrition organization that delivers MTM according to diet prescription and dietary guidelines to clients with medical conditions [29]. The MTM designed for this study provided food group servings consistent with the AHA Diet Goals in a 1900-kcal diet with a sodium restriction to two g daily, and 95 g protein. This moderate sodium restriction was elected to provide palatable foods with less risk of compromising energy and protein intake. The MANNA registered dietitians also provided dietary counseling to patients who requested this service. The meal delivery service was aware of the MTM arm assignment and the patient’s home address, but the study personnel collecting diet surveys and the statistician were blinded.
Fig. 1.
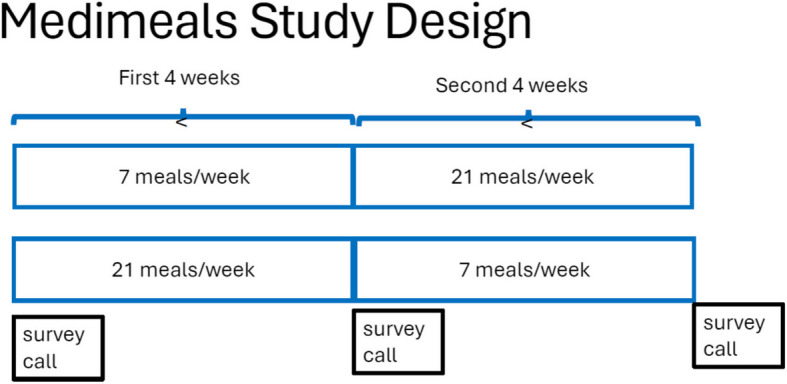
Crossover study design for the medimeals trial
Each patient’s participation was a total of two months. At approximately day 0, 30 and 60 after consent to participate and discharge from the hospital, patients were contacted by telephone to obtain survey data. A gift card was given to study patients who completed study participation ($25 after the baseline call, $25 after the 30-day call, and $50 after the 60-day call) to total $100 for completion of all three telephone calls. The payments were added virtually to the gift card after each study call.
The validated 2-item Malnutrition Screening Tool (MST) [12] was used to evaluate the risk of malnutrition during each post-discharge call (baseline, day 30, day 60) with modification of the timeframe from “recently” to in the past month. The MST asks about the extent of any unintended weight loss and reduced appetite, with scores ranging from zero to five. Greater weight loss results in higher scores that indicate greater risk of malnutrition. Patients with a score of two or greater were considered at high malnutrition risk, as in the tool’s validation [12].
The validated 36-item Penn Healthy Diet Survey (PHD) [30, 31] was used to assess self-reported intake of servings of food groups included in the American Heart Association (AHA) Diet Goals [21]. The PHD requests servings of groups of foods in the past day or past week, but does not compute nutrient intake due to the lack of information on portion size. The AHA Goals include daily intake of ≥ 2 servings of fruit, ≥ 2.5 servings of vegetables, and ≥ 3 servings of whole grains. Weekly intake of ≥ 2 servings of fish, ≥ 4 servings of legumes, nuts, or seeds but ≤ 2 servings of cured meat and ≤ 3 servings of sugary beverages. The AHA Diet goals also include restriction of sodium intake to < 1500 mg and saturated fat to < 7% of kcal. A goal of ≤ 2 servings/week of red meat was added to represent the low saturated fat goal. The MTM were provided with a restriction of 2 g sodium daily. The PHD survey results were scored relative to achievement of each dietary goal with a total score of 0–8, higher scores indicating greater adherence to the AHA Diet Goals.
Sarcopenia, a condition of reduced muscle mass and increased muscle weakness that may accompany HF and/or malnutrition, was assessed using the SARC-F survey [32]. This survey was validated for internal consistency and risk of adverse outcomes using National Health and Nutrition Examination Survey data [32]. The SARC-F survey uses five questions to assess current function in domains of strength, assistance with ambulation, rising from a chair, climbing stairs and falls with a score range of 1–10, where higher scores indicate greater debility. SARC-F scores ≥ 4 are considered suggestive of sarcopenia.
At each telephone contact, patients were asked if they had visited the hospital. The electronic medical record was also surveyed by study staff for patient emergency department visits (ED) or readmissions. The primary medical service was asked to determine whether the visit was planned or unplanned, and the study Safety Officer (who was blinded to the treatment arm) adjudicated relatedness of the EDV or readmission to the MTM intervention.
A five-question patient experience survey was administered during the final call to evaluate the patient’s experience of the meals. The questions assessed change in their eating habits, meal stress, financial stress, and their ability to follow the diet for HF.
Statistical analysis
In this crossover design, a sample size of 75 was planned and increased by 20% for possible attrition to 90 to have 80% power to detect a 1.47 SD change in the MST score as observed in preliminary data from MANNA. In unpublished data from MANNA in 488 patients receiving 21 MTM/week for three months, the MST score at intake was 1.90 ± 1.47 and at follow-up was improved to 1.25 ± 1.29, p < 0.001.
Patients’ baseline characteristics were summarized and compared between treatment arms. Two-sample t-tests and chi squared tests were used to assess bivariate associations for continuous and categorical measures, respectively. To assess the extent to which patients’ attrition may introduce bias to study results, baseline characteristics were also compared between those patients who completed all three study calls and those who did not.
The statistical analysis was conducted according to intent-to-treat analysis, where patient outcomes were evaluated according to the treatment group they were randomized to even if they stopped the meals. To analyze the MST score outcome, the measure was dichotomized (scores ≥ 2) to reflect greater risk of malnutrition. A generalized estimating equation (GEE) model was constructed which included an interaction between time and randomization group. An unstructured covariance matrix was utilized to account for the anticipated correlation between patients’ repeated measures.
Healthcare utilization was summarized across the full sample using frequencies and percentages. Healthcare utilization consisted of EDV and hospital readmissions. A GEE model utilizing a binomial distribution was developed to assess the relationship between number of MTM and 30-day hospital readmission. An unstructured covariance matrix was utilized to account for the anticipated correlation between patients’ repeated measures.
The AHA Diet Goal score, SARC-F score, and percent weight change outcomes were summarized using frequencies and percentages and then analyzed using a linear mixed effects model. Each model included a group by time interaction and utilized a random intercept to account for within-subject correlation.
For each outcome, the model results were visualized and postestimation was used to compute comparisons of interest. Statistical analysis was conducted using SAS 9.4 for windows (SAS, Carey, NC). An alpha level of 0.05 was used to determine statistical significance.
Results
Patient demographic, nutritional, and dietary intake characteristics at enrollment are in Table 1. We screened 790 patient admissions to identify 47 who met inclusion criteria and provided consent, one of whom was no longer eligible to participate by hospital discharge. We were not able to reach our intended enrollment of 90 patients because acuity was higher than anticipated in the hospital setting within the slated timeframe for the study.
Table 1.
Demographic and clinical characteristics of study patients at baseline
| Characteristic | Overall (n = 46) N (%) or mean ± SD (range) |
21/week vs 7/week (n = 22) |
7/week vs 21/week (n = 24) |
P value* |
|---|---|---|---|---|
| Age | 67.8 ± 13.10 (39–88) | 70.3 ± 13.49 (41–88) | 65.5 ± 12.57(39–84) | 0.213 |
| Sex | 23F/23 M | 12F/10 M | 11F/13 M | 0.555 |
| Race | ||||
| Black/African American | 22 (51.2%) | 11 (57.9%) | 11 (45.8%) | 0.432 |
| White/Caucasian | 21 (48.8%) | 8 (42.1%) | 13 (54.2%) | |
| Health Insurance | ||||
| • Medicaid | 7(15.2%) | 2 (14.3%) | 5 (15.6%) | 0.493 |
| • Medicare | 32 (69.6%) | 9 (64.3%) | 23 71.9%) | |
| • Private | 6 (13%) | 2 (14.3%) | 4 (12.5%) | |
| • Veterans Association | 1 (2.2%) | 1 (7.7%) | ||
| Average Income for Zip Code | $76,405 ± 33,983 | $81,244 ± $33,983 | $74,288 ± $38,258 | 0.529 |
| ACC/AHA Stage 3 Heart | ||||
| Failure | 43 (93.5%) | 21 (95.5%) | 22 (91.7%) | 0.490 |
| Left Ventricular Ejection Fraction (%) | 42.9 ± 16.80(14–85) | 46.4 ± 17.01 (20–85) | 39.8 ± 16.33(14–75) | 0.188 |
| Ischemic Heart Disease | 18 (39.1%) | 9 (40.9%) | 9 (37.5%) | 0.813 |
| Diabetes | 19(41.3%) | 10 (45.5%) | 9 (37.5%) | 0.584 |
| Hypertension | 33 (71.7%) | 15 (68.2%) | 18 (75.0%) | 0.608 |
| Chronic Obstructive Pulmonary Disease | 12 (26.15) | 5 (22.7%) | 7 (29.2%) | 0.619 |
| Cancer | 3 (6.5%) | 3 (13.6%) | 0 | 0.101 |
| Number of Comorbid Conditions | 3.7 ± 1.38 (1–7) | 3.9 ± 1.34 (1–7) | 3.5 ± 1.41 (1–6) | 0.321 |
| Current Smoker | 8 (17.4%) | 3(13.6%) | 5(20.8%) | 0.520 |
| Body Mass Index (kg/m2) | 26.9 ± 6.76 (16.3–52) | 26.4 ± 6.48 (16–39) | 27.4 ± 7.11(17.5–52) | 0.664 |
| Malnutrition Diagnosis | ||||
| • Moderate | 21 (45.7%) | 11 (52.4%) | 10 (41.7%) | 0.332 |
| • Severe | 14 (30.4%) | 5 (23.8%) | 9 (37.5%) | |
| MST Score (0–5) | 1.2 ± 1.13 (0 – 4) | 0.9 ± 0.99 (0 – 3) | 1.5 ± 1.18 (0 – 4) | 0.055 |
| Malnutrition Risk MST ≥ 2 | ||||
| • Yes | 15 (32.6%) | 5 (22.7%) | 10 (41.7%) | 0.171 |
| • No | 31 (67.4%) | 17 (77.3%) | 14 (58.3%) | |
| SARC-F Score (0–10) | 3.46 ± 2.29 (1 – 10) | 3.77 ± 2.18 (0 – 10) | 3.16 ± 2.39 (0 – 9) | 0.177 |
| SARC-F ≥ 4 | 22 (47.8%) | 12 (54.5%) | 10 (41.6%) | |
| AHA Diet Goals (servings) | ||||
| • Whole Grains (≥ 3/day) | 0.5 ± 0.72 (0–3) | 0.5 ± 0.86 (0–3) | 0.40 ± 0.58 (0–2) | |
| • Fruits (≥ 2/day) | 1.8 ± 1.78 (0–8) | 2.0 ± 2.08 (0–8) | 1.5 ± 1.44 (0–5) | |
| • Vegetables(≥ 2.5/day) | 1.2 ± 0.87 (0–3) | 1.3 ± 0.83 (0–3) | 1.0 ± 2.24 (0–5) | |
| • Fish(≥ 2/week) | 0.8 ± 1.3 (0–5) | 0.9 ± 1.41 (0–5) | 0.7 ± 1.20 (0–4) | |
| • Legumes and Nuts or Seeds (≥ 4/week) | 2.1 ± 2.24 (0–9) | 2.9 ± 2.37 (0–9) | 1.3 ± 1.86 (0–6) | |
| • Red Meat (≤ 2/week) | 1.4 ± 1.25 (0–5) | 1.1 ± 1.11 (0–4) | 1.6 ± 1.35 (0–5) | |
| • Processed Meat (≤ 2/week) | 1.8 ± 2.21 (0–8) | 2.0 ± 2.40 (0–8) | 1.7 ± 2.07 (0–6) | |
| • Sugary Beverages (≤ 3/week) | 1.7 ± 1.88 (0–5) | 1.9 ± 1.82 (0–5) | 1.4 ± 1.93 (0–5) | |
| AHA Diet Score (0–8) | 3.6 ± 1.21 (1–7) | 3.80 ± 1.18 (2–7) | 3.4 ± 1.23 (1–6) | 0.243 |
F female, M male, MST Malnutrition Screening Tool, SARC-F sarcopenia risk score, AHA American Heart Association
*Baseline difference between those ordered 21 versus 7 meals/week for first month in study
The analytic sample consisted of 46 patients with a mean age of 67.8 ± 13.10 years, half of whom were male. Most patients (93.5%) had ACC/AHA Class 3 HF. Hypertension was common (72%) but only 17% were current smokers. The mean BMI was 26.9 ± 6.67 kg/m2. At hospital discharge, 46% had moderate malnutrition and 30% had severe malnutrition. The mean MST score after discharge was 1.2 ± 1.13, and 32.6% had score ≥ 2, indicative of malnutrition risk. The mean SARC-F score was 3.46 ± 2.29 and 48% had a score ≥ 4, suggesting sarcopenia risk. On a scale of 0–8, with higher scores indicating adherence to more diet goals, the mean score was 3.6 ± 1.21. The reported servings of healthy food groups (whole grains, fruits, vegetables, fish, legumes/nuts/seeds) relative to the AHA Diet Goals were less than desired levels. However, patients on average met the limitation goals (≤ 2 servings/week of red meat, ≤ 2 servings/week of cured meat, and ≤ 3 servings/week of sugary beverages).
The clinical, sociodemographic, malnutrition, and diet goal measures were balanced across the two treatment arms (p > 0.05) with one exception. The group receiving 21 MTM/week for the first month reported eating significantly more legumes, nuts and seeds than the group receiving seven MTM first at baseline (p = 0.015).
After beginning the study, 15 patients (32.6%) withdrew from receiving meals. The reasons for declining meals varied (dislike of meals, too much food, family members preferred to cook) with a few who were no longer eligible due to moving out of state, requiring admission to a facility, or to death. By protocol, patients were permitted to continue the telephone call-based surveys even if they declined the meals after receiving at least one delivery.
Eight patients did not complete the phone call after one month of meals, and an additional six patients did not complete the second month phone call leaving 32 patients at the final call. Analysis of patient attrition revealed that attrition was more common among patients who were White/Caucasian than among patients who were Black/African American (p = 0.015). There were no other patient characteristics significantly associated with attrition.
Primary outcome: change in MST score
The number of MTM/week (7 vs 21) was not a significant predictor of change in MST score over time (p = 0.97). However, regardless of the treatment group, by model-based estimates, patients had reduced odds of having high malnutrition risk (MST score ≥ 2) after one month, OR = 0.18 (95% CI: 0.04 – 0.74) or two months of MTM OR = 0.21 (95% CI: 0.05 – 0.99) respectively, each compared to the baseline score (p = 0.04) (Fig. 2).
Fig. 2.

Probability of patients having malnutrition risk score greater than two after one and two months of medically tailored meals delivered to their homes according to number of meals provided. There was no difference in this score by the number of meals (p = 0.97) but both scores decreased over time (p = 0.04). Data presented as mean and 95% confidence interval. MST = Malnutrition Screening Tool
Weight loss, a subcomponent of the MST score, was reported by 47.83% of patients at baseline, reflecting the prior month. The number of MTM/week (7 vs 21) was not significantly associated with per cent weight change (p = 0.5830), but a significant effect of time was observed (p = 0.0004). Specifically, mean per cent weight change within the past thirty days at baseline was reported as −3.64 ± 0.64%. Compared to baseline, mean percent weight change was significantly lower at both one-month (−0.48 ± 0.71 percent, p = 0.0014) and two-months (0.12 ± 0.78, p = 0.0003) (Fig. 3).
Fig. 3.

Change in self-reported weight over the past month. There was no difference in percentage change in body weight by the number of meals (p = 0.5830) but weight loss decreased over time (p = 0.0004). Data presented as mean and 95% confidence interval
Secondary outcomes
At the baseline call after hospital discharge, patients’ mean AHA Diet Goal score was 3.60 ± 1.21, meaning the patients on average met less than four of the diet goals even though they had just been receiving hospital meals. The number of MTM/week (7 vs 21) was not a significant predictor of change in AHA diet score over time (p = 0.17) though a significant effect of time was observed (p = 0.0049). Specifically, mean AHA score was estimated to increase by 0.7275 ± 0.2173 units from baseline to one month (p = 0.0014), and by 0.4773 ± 0.2311 units from baseline to two months (p = 0.0430) (Fig. 4).
Fig. 4.

Mean American Heart Association Diet Adherence Score at baseline and after one and two months of medically tailored meals according to the number of meals provided. There was no difference by the number of meals provided (p = 0.17) but the score increased over time (p = 0.0049). Data presented as mean and 95% confidence interval
Five patients (10.9%) had readmissions within the first 30 days, and seven patients (15.2%) within the second 30-day period (Table 2). By intent to treat analysis, readmission rates were not different by number of MTM/week in the first 30 days or second 30 days, regardless of whether the readmission was preceded by an ED visit. The number of MTM/week (7 vs. 21) was not a significant predictor of hospital readmissions across time (p = 0.76). All readmissions were due to HF management, not adverse events related to the diet.
Table 2.
Survey question in the first block and then response n(%). Hospital Utilization by Visit Type and Meal Randomization Order
| Days 0–30 | Days 31–60 | |||||
|---|---|---|---|---|---|---|
| Visit Type | 21/ vs 7/MTM/ week (n = 22) |
7/ vs 21/MTM/week (n = 24) |
P value | 21/ vs 7/MTM/ week (n = 22) |
7/ vs 21/MTM/week (n = 24) |
P value |
| Emergency Department Visit without Readmission | 1a (4.55%) | 0 | n/a | 1a (4.55%) | 0 | 0.478 |
| Emergency Department Visit with Subsequent Readmission | 2(9.09%) | 0 | 0.223 | 1(4.55%) | 2(8.33%) | > 0.999 |
| Direct Readmission | 0 | 3(12.5%) | 0.235 | 3(13.64%) | 1(4.17%) | 0.336 |
| Total 30-day Readmissions | 2(9.09%) | 3(12.5%) | > 0.999 | 4(18.18%) | 3(12.5%) | 0.694 |
MTM Medically Tailored Meals
aThe same patient experienced an emergency department visit without readmission in each time period
When the SARC-F scores were evaluated at each call (baseline, day 30, day 60), the proportion of patients with score ≥ 4 declined from 47.8% to 45% to 35%, suggesting that the level of disability was declining over the course of the study. While a significant group-by-time interaction was not observed for the SARC-F outcome, a significant effect of time was observed (p = 0.01). Specifically, SARC-F scores decreased by 0.43 ± 0.20 units from baseline to one month (p = 0.03) and by 0.59 ± 0.21 units from baseline to two months (p = 0.0067), indicating continued improvement in physical functioning (Fig. 5).
Fig. 5.

Estimated Sarcopenia Risk Score (SARC-F) by Treatment Group Over the Study Time Points. The difference by number of meals was not significant (p = 0.50) but the scores for both groups reduced over time (p = 0.01). Data presented as mean and 95% confidence interval
At the final call, the patient’s rating of their experience of receiving meals was generally positive (Table 3). All reported that the meals reduced their stress in meal preparation, 94% reported the meals helped them follow their HF diet, 71% reported the meals reduced their financial stress, and 58% would like to continue a similar MTM service in the future.
Table 3.
Patient experience of the meal delivery service (n = 31)
| Did the meals help you to change your eating habits? | 22 (70.9%) yes |
| Did the meals reduce your stress in meal preparation? | 31 (100%) yes |
| Will you use a similar food delivery service in the future? | 18 (58.1%) yes |
| Did the meals reduce your financial stress? | 22 (70.9%) yes |
| Did the meals help you to follow your diet for heart failure? | 29 (93.5%) yes |
Discussion
In this crossover study comparing home delivery of seven versus 21 MTM per week to patients with malnutrition or malnutrition risk and HF, the odds of having malnutrition risk dropped, sarcopenia risk improved, and adherence to AHA diet goals improved from baseline, but 21 MTM per week were not significantly better than seven. The number of MTM provided was not associated with different 30-day readmissions after hospital discharge in this small study where the readmission rates were 9–13%, lower than expected.
When diagnosed at hospital admission, patients with malnutrition have worse clinical outcomes than those who do not. Patients with moderate or severe malnutrition during a stay in our hospital have significantly more frequent 30-day readmissions, as well as greater mortality, and longer length of stay than patients who do not meet criteria for malnutrition [33]. In data from the 2012–2014 Nationwide Inpatient Sample, malnutrition is associated with increased mortality, almost double the admission cost, and longer length of stay of [34]. Findings from these large samples suggest that efforts to treat malnutrition post-discharge may be a promising strategy to reduce readmissions, improve clinical outcomes, and reduce healthcare costs.
Even though our current sample was small and the baseline MST score of 1.2 was relatively low at hospital discharge, the odds of having malnutrition risk were reduced by provision of seven or 21 MTM per week for one or two months after hospital discharge. The weight loss reported in the MST score reflecting the month prior to enrollment was 4%, while provision of MTM was associated with a reduction to < 1% weight loss/month, regardless of the number of meals provided. This positive impact on stabilizing weight patterns was also reported concurrently with a reduction in sarcopenia risk over time. While it is difficult to separate the effects of MTM provided from recovery time since admission, the direction is encouraging with regards to quality of life.
The AHA Diet Goals were evaluated at baseline based on the food provided during the hospital admission prior to enrollment, then after one and two months of MTM. Provision of MTM was associated with increased adherence to AHA diet goals, regardless of the number of meals provided. Furthermore, 94% of enrolled patients reported that the MTM helped them to adhere to HF diet goals. Adherence to AHA Diet Goals may have played an important role in influencing so many positive clinical outcomes (weight stabilization, improving malnutrition and sarcopenia risks, stably low readmission rates) over the first month and holding the results steady in the second month.
The rate of 30-day readmissions for patients with both HF and malnutrition or malnutrition risk is not yet established. However, it is expected to be greater than that of patients with either condition alone. Thirty-day readmissions for patients with HF at the Hospital of the University of Pennsylvania were 17.1% in FY21, 17.3% in FY22, 16.99% in FY23 (unpublished data). Readmissions for patients with malnutrition were 40% in a quality improvement survey and more than double the odds of readmission compared to patients admitted without malnutrition [33]. Readmissions in a national HF registry of more than 79,000 patients were 23% overall, 24.7% for African Americans and 22.2% for Caucasians [35]. A reduction of HF readmissions to 16% was predicted by the provision of MTM in an economic projection [26]. The 30-day readmission rates of 9–13% in this MTM intervention study compare favorably to other MTM intervention studies [25, 36] despite the high prevalence of diagnosed malnutrition (76%) in addition to their HF and the greater proportion of African American participants where higher rates would be expected.
Not all patients who enrolled in the study chose to continue receiving meals. Attrition was more common in White than Black patients. Black and Hispanic patients have a disproportionately high burden of HF, with greater 30-day mortality and younger age at onset [37, 38]. Intervention with MTMs may be a promising strategy to meet nutritional needs of these target populations, with potential to reduce disparities in health outcomes.
The patient experience was positive in patients who continued to receive MTM. Both the stress of preparing meals and the financial stress of purchasing foods were reduced. Additionally, patients reported that their understanding of the principles of the HF diet improved because of the meals provided. Diet education is often provided during a hospital stay when a patient is very ill and may be overwhelmed with information. Seeing and tasting palatable, therapeutically appropriate foods in the home setting may be a more impactful learning experience than hospital-based education efforts. Many patients reported that they relied on the MTM to eat more and become more organized about their diet. The meals reinforced recommended dietary changes and helped patients become more aware of what they were consuming. These meals also made it easier for patients to develop the habit of eating more home-cooked meals, which in turn inspired them with new ideas for foods that suited their health condition.
This trial should be evaluated relative to its strengths and limitations. Enrollment was challenging. When a pattern of exclusion of patients who lived outside the MANNA catchment area was noted, the organization responded by shipping meals via a commercial delivery service to reach patients outside their existing delivery perimeter. The enrollment hospital is a tertiary facility for advanced HF treatment. During the active enrollment period of the trial, admissions for NYHA Level 1–3 heart failure were reduced and those for advanced HF (Stage D/NYHA Class 4) that required exclusion from participation in this study were increased. Enrollment in the trial was stopped prior to achieving the planned sample size, thus findings may lack statistical power. As a prospective random-order crossover study situated within a low socioeconomic area of Philadelphia, the study examines a potential response to patients likely experiencing nutrition insecurity and poor dietary adherence. Our attrition analysis suggests that results may be more representative of patients who are Black/African American than of patients who are White/Caucasian. The loss of White/Caucasian patients who had enrolled also risks selection bias in the results. Because of the low enrollment and possible selection bias, these findings are only hypothesis-generating. While several patient outcomes exhibited improvement over time following discharge when receiving MTM, without a control group it cannot be inferred that MTM causes improvement in outcomes following discharge. The surveys used to assess malnutrition risk, diet change, and sarcopenia risk each carried the risk of recall bias. However, the time frame of each was limited to 1 month, 1 week, and current time respectively to minimize this possible risk of bias.
Conclusion
The provision of at least seven MTM per week in the early window after hospital discharge to patients with NYHA stage 1–3 HF and malnutrition or malnutrition risk is a promising strategy to reduce malnutrition and sarcopenia risk and improve diet adherence while keeping readmissions at a low rate.
Acknowledgements
The study team appreciates the assistance of Elizabeth Bader, BA and Joseph Rhodes, MPH in early phases of database management.
Abbreviations
- AHA
American Heart Association
- EDV
Emergency department visit
- HF
Heart failure
- GEE
Generalized estimating equation
- MST
Malnutrition Screening Tool
- MTM
Medically tailored meals
- NYHA
New York Heart Association
- PHD
Penn Healthy Diet Survey
- SARC-F
Sarcopenia and Frailty risk score
Authors’ contributions
Contributions to the conception or design of the work (CWC, MA, JAH, DRS); or the acquisition, analysis, or interpretation of data for the work (CWC, JT, AS, EE, RQ, AGC, DRS); AND Drafting the work or reviewing it critically for important intellectual content (all authors); AND Final approval of the version to be published (all authors); AND Agreement to be accountable for all aspects of the work in ensuring that questions related to the accuracy or integrity of any part of the work are appropriately investigated and resolved (all authors).
Funding
The investigator-initiated study was funded by an unrestricted grant from the Metropolitan Area Neighborhood Nutrition Alliance.
Data availability
The data that support the findings of this study are not openly available due to reasons of sensitivity and are available from the corresponding author, Charlene Compher compherc@upenn.edu, upon reasonable request. Data are located in controlled access data storage at the University of Pennsylvania.
Declarations
Ethics approval and consent to participte
Ethics approval was obtained from the University of Pennsylvania Institutional Review Board number 1 protocol number 814914, and all patients gave informed consent using an approved consent document. The study was conducted in compliance with the Declaration of Helsinki.
Consent for publication
N/a.
Competing interests
The authors declare no competing interests.
Footnotes
Publisher’s Note
Springer Nature remains neutral with regard to jurisdictional claims in published maps and institutional affiliations.
References
- 1.WS C. Overview of the management of heart failure with reduced ejection fraction in adults: UpToDate; 2024 [updated 03/04/2024. Available from: https://pennmedaccess.uphs.upenn.edu/f5-w-68747470733a2f2f7777772e7570746f646174652e636f6d$$/contents/f5-h-$$/f5-h-$$/contents/overview-of-the-management-of-heart-failure-with-reduced-ejection-fraction-in-adults?search=heart%20failure&source=search_result&selectedTitle=2%7E150&usage_type=default&display_rank=2.
- 2.Prevention CfDCa. Heart Disease Facts 2021 [cited 2021 10/17]. Available from: https://www.cdc.gov/heartdisease/facts.htm.
- 3.Habaybeh D, de Moraes MB, Slee A, Avgerinou C. Nutritional interventions for heart failure patients who are malnourished or at risk of malnutrition or cachexia: a systematic review and meta-analysis. Heart Fail Rev. 2021;26(5):1103–18. [DOI] [PMC free article] [PubMed] [Google Scholar]
- 4.Jensen GL, Cederholm T, Correia M, Gonzalez MC, Fukushima R, Higashiguchi T, et al. GLIM Criteria for the Diagnosis of Malnutrition: A Consensus Report From the Global Clinical Nutrition Community. JPEN J Parenter Enteral Nutr. 2019;43(1):32–40. [DOI] [PubMed] [Google Scholar]
- 5.Jensen GL, Cederholm T, Ballesteros-Pomar MD, Blaauw R, Correia M, Cuerda C, et al. Guidance for assessment of the inflammation etiologic criterion for the GLIM diagnosis of malnutrition: A modified Delphi approach. JPEN J Parenter Enteral Nutr. 2024;48(2):145–54. [DOI] [PubMed] [Google Scholar]
- 6.Rahman A, Jafry S, Jeejeebhoy K, Nagpal AD, Pisani B, Agarwala R. Malnutrition and Cachexia in Heart Failure. JPEN J Parenter Enteral Nutr. 2016;40(4):475–86. [DOI] [PubMed] [Google Scholar]
- 7.Valentova M, Anker SD, von Haehling S. Cardiac Cachexia Revisited: The Role of Wasting in Heart Failure. Cardiol Clin. 2022;40(2):199–207. [DOI] [PubMed] [Google Scholar]
- 8.Curcio F, Testa G, Liguori I, Papillo M, Flocco V, Panicara V, et al. Sarcopenia and Heart Failure. Nutrients. 2020;12(1):211. 10.3390/nu12010211. [DOI] [PMC free article] [PubMed]
- 9.Corsetti G, Pasini E, Romano C, Chen-Scarabelli C, Scarabelli TM, Flati V, et al. How Can Malnutrition Affect Autophagy in Chronic Heart Failure? Focus and Perspectives. Int J Mol Sci. 2021;22(7):3332. 10.3390/ijms22073332. [DOI] [PMC free article] [PubMed]
- 10.White JV, Guenter P, Jensen G, Malone A, Schofield M, Academy Malnutrition Work G, et al. Consensus statement: Academy of Nutrition and Dietetics and American Society for Parenteral and Enteral Nutrition: characteristics recommended for the identification and documentation of adult malnutrition (undernutrition). JPEN J Parenter Enteral Nutr. 2012;36(3):275–83. [DOI] [PubMed]
- 11.Skipper A, Ferguson M, Thompson K, Castellanos VH, Porcari J. Nutrition screening tools: an analysis of the evidence. JPEN J Parenter Enteral Nutr. 2012;36(3):292–8. [DOI] [PubMed] [Google Scholar]
- 12.Ferguson M, Capra S, Bauer J, Banks M. Development of a valid and reliable malnutrition screening tool for adult acute hospital patients. Nutrition. 1999;15(6):458–64. [DOI] [PubMed] [Google Scholar]
- 13.Cederholm T, Jensen GL, Correia M, Gonzalez MC, Fukushima R, Higashiguchi T, et al. GLIM criteria for the diagnosis of malnutrition - A consensus report from the global clinical nutrition community. Clin Nutr. 2019;38(1):1–9. [DOI] [PubMed] [Google Scholar]
- 14.Sze S, Pellicori P, Kazmi S, Rigby A, Cleland JGF, Wong K, et al. Prevalence and Prognostic Significance of Malnutrition Using 3 Scoring Systems Among Outpatients With Heart Failure: A Comparison With Body Mass Index. JACC Heart Fail. 2018;6(6):476–86. [DOI] [PubMed] [Google Scholar]
- 15.Zainul O, Perry D, Pan M, Lau J, Zarzuela K, Kim R, et al. Malnutrition in heart failure with preserved ejection fraction. J Am Geriatr Soc. 2023;71(11):3367–75. [DOI] [PMC free article] [PubMed] [Google Scholar]
- 16.Sze S, Pellicori P, Zhang J, Clark AL. Malnutrition, congestion and mortality in ambulatory patients with heart failure. Heart. 2019;105(4):297–306. [DOI] [PubMed] [Google Scholar]
- 17.Rahman A, Hasan RM, Agarwala R, Martin C, Day AG, Heyland DK. Identifying critically-ill patients who will benefit most from nutritional therapy: Further validation of the “modified NUTRIC” nutritional risk assessment tool. Clin Nutr. 2016;35(1):158–62. [DOI] [PubMed] [Google Scholar]
- 18.Tirandi A, Montecucco F, Liberale L. Malnutrition predicts mortality in heart failure patients. Intern Emerg Med. 2023;18(4):979–80. [DOI] [PubMed] [Google Scholar]
- 19.Abu-Sawwa R, Dunbar SB, Quyyumi AA, Sattler ELP. Nutrition intervention in heart failure: should consumption of the DASH eating pattern be recommended to improve outcomes? Heart Fail Rev. 2019;24(4):565–73. [DOI] [PMC free article] [PubMed] [Google Scholar]
- 20.Billingsley HE, Hummel SL, Carbone S. The role of diet and nutrition in heart failure: A state-of-the-art narrative review. Prog Cardiovasc Dis. 2020;63(5):538–51. [DOI] [PMC free article] [PubMed] [Google Scholar]
- 21.Lloyd-Jones DM, Hong Y, Labarthe D, Mozaffarian D, Appel LJ, Van Horn L, et al. Defining and setting national goals for cardiovascular health promotion and disease reduction: the American Heart Association’s strategic Impact Goal through 2020 and beyond. Circulation. 2010;121(4):586–613. [DOI] [PubMed] [Google Scholar]
- 22.Miller PE, Cross AJ, Subar AF, Krebs-Smith SM, Park Y, Powell-Wiley T, et al. Comparison of 4 established DASH diet indexes: examining associations of index scores and colorectal cancer. Am J Clin Nutr. 2013;98(3):794–803. [DOI] [PMC free article] [PubMed] [Google Scholar]
- 23.Driggin E, Cohen LP, Gallagher D, Karmally W, Maddox T, Hummel SL, et al. Nutrition Assessment and Dietary Interventions in Heart Failure: JACC Review Topic of the Week. J Am Coll Cardiol. 2022;79(16):1623–35. [DOI] [PMC free article] [PubMed] [Google Scholar]
- 24.Kida K, Miyajima I, Suzuki N, Greenberg BH, Akashi YJ. Nutritional management of heart failure. J Cardiol. 2023;81(3):283–91. [DOI] [PubMed] [Google Scholar]
- 25.Hummel SL, Karmally W, Gillespie BW, Helmke S, Teruya S, Wells J, et al. Home-Delivered Meals Postdischarge From Heart Failure Hospitalization. Circ Heart Fail. 2018;11(8):e004886. [DOI] [PMC free article] [PubMed] [Google Scholar]
- 26.Chen AMH, Draime JA, Berman S, Gardner J, Krauss Z, Martinez J. Food as medicine? Exploring the impact of providing healthy foods on adherence and clinical and economic outcomes. Explor Res Clin Soc Pharm. 2022;5:100129. [DOI] [PMC free article] [PubMed] [Google Scholar]
- 27.Hager K, Cudhea FP, Wong JB, Berkowitz SA, Downer S, Lauren BN, et al. Association of National Expansion of Insurance Coverage of Medically Tailored Meals With Estimated Hospitalizations and Health Care Expenditures in the US. JAMA Netw Open. 2022;5(10):e2236898. [DOI] [PMC free article] [PubMed] [Google Scholar]
- 28.White JV, Guenter P, Jensen G, Malone A, Schofield M, Academy of N, et al. Consensus statement of the Academy of Nutrition and Dietetics/American Society for Parenteral and Enteral Nutrition: characteristics recommended for the identification and documentation of adult malnutrition (undernutrition). J Acad Nutr Diet. 2012;112(5):730–8. [DOI] [PubMed]
- 29.Gurvey J, Rand K, Daugherty S, Dinger C, Schmeling J, Laverty N. Examining health care costs among MANNA clients and a comparison group. J Prim Care Community Health. 2013;4(4):311–7. [DOI] [PubMed] [Google Scholar]
- 30.Compher CW, Quinn R, Burke F, Piccinin D, Sartor L, Lewis JD, et al. Development of the Penn Healthy Diet screener with reference to adult dietary intake data from the National Health and Nutrition Examination Survey. Nutr J. 2022;21(1):70. [DOI] [PMC free article] [PubMed] [Google Scholar]
- 31.Compher CW, Quinn R, Haslam R, Bader E, Weaver J, Dudek S, et al. Penn Healthy Diet survey: pilot validation and scoring. Br J Nutr. 2024;131(1):156–62. [DOI] [PubMed] [Google Scholar]
- 32.Malmstrom TK, Miller DK, Simonsick EM, Ferrucci L, Morley JE. SARC-F: a symptom score to predict persons with sarcopenia at risk for poor functional outcomes. J Cachexia Sarcopenia Muscle. 2016;7(1):28–36. [DOI] [PMC free article] [PubMed] [Google Scholar]
- 33.Hudson L, Chittams J, Griffith C, Compher C. Malnutrition Identified by Academy of Nutrition and Dietetics/American Society for Parenteral and Enteral Nutrition Is Associated With More 30-Day Readmissions, Greater Hospital Mortality, and Longer Hospital Stays: A Retrospective Analysis of Nutrition Assessment Data in a Major Medical Center. JPEN J Parenter Enteral Nutr. 2018;42(5):892–7. [DOI] [PubMed]
- 34.Adejumo AC, Adejumo KL, Adegbala OM, Chinedozi I, Ndansi J, Akanbi O, et al. Protein-Energy Malnutrition and Outcomes of Hospitalizations for Heart Failure in the USA. Am J Cardiol. 2019;123(6):929–35. [DOI] [PubMed] [Google Scholar]
- 35.Greene SJ, DeVore AD, Sheng S, Fonarow GC, Butler J, Califf RM, et al. Representativeness of a Heart Failure Trial by Race and Sex: Results From ASCEND-HF and GWTG-HF. JACC Heart Fail. 2019;7(11):980–92. [DOI] [PMC free article] [PubMed] [Google Scholar]
- 36.Go AS, Tan TC, Horiuchi KM, Laws D, Ambrosy AP, Lee KK, et al. Effect of Medically Tailored Meals on Clinical Outcomes in Recently Hospitalized High-Risk Adults. Med Care. 2022;60(10):750–8. [DOI] [PMC free article] [PubMed] [Google Scholar]
- 37.Lewsey SC, Breathett K. Racial and ethnic disparities in heart failure: current state and future directions. Curr Opin Cardiol. 2021;36(3):320–8. [DOI] [PMC free article] [PubMed] [Google Scholar]
- 38.Mwansa H, Lewsey S, Mazimba S, Breathett K. Racial/Ethnic and Gender Disparities in Heart Failure with Reduced Ejection Fraction. Curr Heart Fail Rep. 2021;18(2):41–51. [DOI] [PMC free article] [PubMed] [Google Scholar]
Associated Data
This section collects any data citations, data availability statements, or supplementary materials included in this article.
Data Availability Statement
The data that support the findings of this study are not openly available due to reasons of sensitivity and are available from the corresponding author, Charlene Compher compherc@upenn.edu, upon reasonable request. Data are located in controlled access data storage at the University of Pennsylvania.