

Abstract
Background
There is a vast prevalence of mental disorders, but patient responses to psychiatric medication fluctuate. As food choices and daily habits play a fundamental role in this fluctuation, integrating machine learning with network medicine can provide valuable insights into disease systems and the regulatory leverage of lifestyle in mental health.
Methods
This study analyzed coexpression network modules of MDD and PTSD blood transcriptomic profile using modularity optimization method, the first runner-up of Disease Module Identification DREAM challenge. The top disease genes of both MDD and PTSD modules were detected using random forest model. Afterward, the regulatory signature of two predominant habitual phenotypes, diet-induced obesity and smoking, were identified. These transcription/translation regulating factors (TRFs) signals were transduced toward the two disorders’ disease genes. A bipartite network of drugs that target the TRFS together with PTSD or MDD hubs was constructed.
Results
The research revealed one MDD hub, the CENPJ, which is known to influence intellectual ability. This observation paves the way for additional investigations into the potential of CENPJ as a novel target for MDD therapeutic agents development. Additionally, most of the predicted PTSD hubs were associated with multiple carcinomas, of which the most notable was SHCBP1. SHCBP1 is a known risk factor for glioma, suggesting the importance of continuous monitoring of patients with PTSD to mitigate potential cancer comorbidities. The signaling network illustrated that two PTSD and three MDD biomarkers were co-regulated by habitual phenotype TRFs. 6-Prenylnaringenin and Aflibercept were identified as potential candidates for targeting the MDD and PTSD hubs: ATP6V0A1 and PIGF. However, habitual phenotype TRFs have no leverage over ATP6V0A1 and PIGF.
Conclusion
Combining machine learning and network biology succeeded in revealing biomarkers for two notoriously spreading disorders, MDD and PTSD. This approach offers a non-invasive diagnostic pipeline and identifies potential drug targets that could be repurposed under further investigation. These findings contribute to our understanding of the complex interplay between mental disorders, daily habits, and psychiatric interventions, thereby facilitating more targeted and personalized treatment strategies.
Supplementary Information
The online version contains supplementary material available at 10.1186/s40246-025-00733-w.
Keywords: Mental disorders, Depression, PTSD, Network biology, Machine learning, Drug repurposing, Unhealthy food, Obesity, Smoking, Signal transduction
Background
Psychiatric disorders are prominent risk factors for people in different age groups worldwide. [1]. With special attention given to the elderly population, the World Health Organization (WHO) reported that approximately 14% of the elderly population suffers from mental health conditions that develop due to numerous factors, including previous disease history, life events, environmental surroundings, lifestyle, and daily habits [2]. MDD and PTSD have emerged in the population due to several horrifying events, of which COVID-19 is the leading cause [3, 4]. Therefore, there is a dire need for preventive procedures and early diagnosis methods to prevent the adverse effects of MDD and PTSD, the deadliest of which is suicide [1].
However, misdiagnosis of mental disorders opposes global efforts to address mental health conditions. Various studies discuss issues with misleading and biased diagnoses of psychiatric diseases attributable to the complexity of the disorder system, the presence of similar symptoms across multiple disorders, or even incorrect diagnoses by psychiatrists due to patients’ misleading information [5–8].Additionally, misdiagnosis of mental disorders often leads to incorrect psychotic drug prescriptions [9], followed by pivotal consequences such as overmedication, drug side effects, or abuse of the prescribed medication [10, 11]. Consequently, scientific endeavors have intensified to personalize medications, aiming to address improper medication prescription issues in general, and psychiatric drug resistance, in particular [12–15].
One of the strata for approaching individual-tailored medication is nutrition and lifestyle, whereas certain therapeutic approaches require a shift in daily habits and nutrition along with prescribed medications to ensure promising results [16–19]. Nevertheless, creating a meticulous protocol for each individual using traditional behavioral and molecular tests is tedious. Thus, personalized medicine relies on sophisticated strategies, among which network medicine is paramount. Since network medicine works by organizing and merging big data from distinct biological levels (multiple omics layers) in conjunction with social and environmental factors. Subsequently, a network is constructed to aid in the selection of suitable therapies [20–23].
Network medicine has been extensively used to study disease characteristics, ranging from hubs prediction to the multilevel interaction between biological layers of the disease network [24]. One of the most important approaches employed to analyze and detect network modules is the disease module identification challenge of DREAM community. The benchmark challenge was constructed to determine the most effective network analysis algorithms, leading to the identification of the three algorithms that ranked the highest according to the established criteria [25]. Since psychiatric disorders are complex and interconnected [26], network medicine could serve the purpose of discovering the vague network underlaying disorders development, lifestyle correlates, and aid on the development of effective and personalized drugs.
Therefore, multiple studies employed network biology to either uncover molecular complexity of certain mental disorders or lifestyle implications on MDD and PTSD, Some studies investigated the transcriptomic-based network of depression and sleep [27]. Additional research endeavors have sought to identify the association between depression, anxiety, and health-promoting lifestyles by building a psychiatric-scale-based network [28, 29]. The scientific community has attempted to elucidate the molecular mechanisms of MDD utilizing systems biology approaches by compiling previously identified candidate genes into networks or integrating multiple molecular layers. These studies aimed to define the dysregulated biological processes involved in immune dysfunction or the metabolic syndrome prevalent in MDD patients [30, 31].
On the other hand, network analysis of PTSDs’ fMRI provides a better understanding of disorder psychopathology in different brain regions [32]. Multiple attempts have been made to construct and analyze mental health scale-based networks to identify central PTSD symptoms during traumatic life events such as combat experiences and the COVID-19 Pandemic [33, 34]. At the molecular level, the field of network medicine has contributed to revealing the key players in the disorder system. Not only did this field expand to encompass multiple layers, but it also included the identification of potential PTSD hubs in various tissues (reviewed in [35, 36]). Nevertheless, previous research has not used the advantages of machine learning in combination with systems biology approaches to unleash effective and noninvasive diagnostic modules for MDD and PTSD [37, 38]. Moreover, the molecular underpinnings of the relationship between mental health and unhealthy habits are not fully understood. This motivated the rationale of the study pipeline to utilize both the random forest model and co-expression network analysis. Furthermore, the datasets utilized, whether for discovery or validation purposes, were confined to the blood-derived gene expression microarray data. Ultimately, two of the most prevalent detrimental behaviors were selected to investigate how the predominance of poor dietary habits or tobacco consumption elevates the chance of mental well-being deterioration globally [39, 40].
This study aimed to identify MDD and PTSD biomarkers, followed by tracking the causal molecular inference between lifestyle and these disorders. Initially, the pipeline targets the identification of phenotype-specific transcriptomic signatures by integrating statistical-based dataset harmonization. Subsequently, co-expression network analysis and machine-learning model are built to uncover hub genes. The study then examined the transduction of signals from habitual phenotype TRFs into MDD and PTSD biomarkers. In the final stage, a bipartite network connecting candidate genes and drugs is built to yield drug candidates for repurposing in the treatment of patients with MDD and/or PTSD, tailored to their individual lifestyles.
Methods
Data harmonization: data filtration, normalization, and batch correction
This study collected blood gene expression raw data from publicly available databases: Gene Expression Omnibus [41],and ArrayExpress [42]. The databases were filtered to include only the microarray series matching the following words (Blood, Whole blood, PBMC, and Peripheral blood) to subtract the results of the expression datasets that only used blood samples. To collect the datasets for obesity, the following words were used: "diet" OR "dietary pattern" OR "food" OR "calorie" OR "eating" OR "eating pattern" OR "BMI" OR "obese" OR "obesity". Search words used to collect the datasets for smoking tobacco were “smoking”, “smoker”, “tobacco”, “smoke”, “smoking behavior”, “cigarette smoking”, and “cigarette”. In addition, the words used to search for the MDD and PTSD datasets were (MDD, major depressive disorder, depression, depressed, and depressive episode) (PTSD, trauma, traumatic, stressful events, stress, and posttraumatic syndrome disorder). The collected data were divided into two parts: discovery and validation. In addition, each dataset encompassed only one of the four phenotypes, in addition to the control cases, and any other phenotype was filtered. The discovery datasets were collected from one platform, whereas the validation datasets were collected from different platforms. All data were normalized in the same manner using the robust multichip average, RMA normalization. Affy [43], Oligo [44] packages normalized Affymetrix datasets, and limma [45] package was used to normalize the Illumina and Agilent datasets. ComBat algorithm from SVA package was used to remove batch effects between the discovery and validation datasets [46], whereas a model was built by considering one of the four phenotypes as a covariate using the generic function model.matrix() in R. Gene Symbols were used to annotate all the probes in both the discovery and validation metadata sets. Meanwhile, the replicated probes for the same gene were summarized by taking the mean probe signal using aggregate() generic function in R. Supplementary Data (Addtional file two) contains the datasets used in this study and their corresponding platforms.
Identifying blood transcriptomic signatures for MDD, PTSD, obesity, and smoking metadatasets
Differentially expressed genes (DEGs) were identified using a linear regression model [47] implemented through limma package. The model was fitted to the data by designing a matrix for the control and test samples. For each of the four phenotypes, the matrix was employed to construct the regression model, and the false discovery rate (FDR) was corrected using the Benjamini–Hochberg method [48] to yield the adjusted p-value. The adjustment was performed using the eBayes() function in limma package. DEGs discovered in each dataset were cross-validated one more time with 2500 iterations, after which the intersection between the discovery and validation cross-validated DEGs was taken. Only positively correlated Log FC values between the two metadata genes were considered for the final differentially expressed gene sets. Ultimately, the gene set for each phenotype was used as the input for further downstream analyses.
MDD and PTSD transcriptomic signature enrichment
The two disorders were compared with respect to biological processes and immune gene sets that were enriched by the identified DEGs. To enrich the biological processes [49, 50] enrichGO() command from Clusterprofiler package [51] were used. In order to relate the terms to their ancestor terms, a tree plot and an emaplot were generated to visualize the enriched terms of the MDD and PTSD DEGs, respectively. Additionally, MsigDB immunologic gene set was downloaded to reveal the enriched gene set identified from the C7 set [52]. Finally, pathway enrichment was performed using three databases: Reactome [53], KEGG [54, 55], and Wikipathways [56]. The results were displayed using a chord and a bar plot generated from the GOplot and ggpubr R packages, respectively [57, 58].
Weighted gene co-expression network generation and analysis
A co-expression network was generated with highly correlated gene sets between the discovery and validation DEGs of the two phenotypes of interest: MDD and PTSD. Initially, psych package [59] in R was used to generate the similarity matrix using Spearman correlation, as Spearman correlation is less sensitive to outliers [60]. The matrix was filtered only to contain gene pairs with a correlation higher than 0.9 to readily reduce false positives. Analysis was performed using the MoNET [61] package of M1 module, the first runner of the Disease Module Identification Dialogue on Reverse Engineering and Assessment (DREAM) Challenge [25]. M1 method involves testing different resolutions to determine the appropriate topological scale of a module [62, 63]. A filtered correlation network was used as the input for M1 module. The network was directed, and the default limits of the clusters were set at 3 and 100, minimum and maximum, respectively.
Biomarker discovery for MDD and PTSD
The module importance was predicted using a random forest (RF) model [64]. For every permutation, the model randomly split the data to hide 30% of the data, which is an out-of-the-bag sample. This strategy renders RF models immune to overfitting and does not necessarily require training or a test set; thus, RF models have been used for gene prioritization [65]. The RF model was built using randomForest package in R [66] with a number of trees (ntrees) equal to 50,001. The importance of each gene, sample size of the controls, and phenotypes were calculated. The out-of-the-bag error was retrieved along with the phenotype and the control error, and the randomForestExplainer R package was employed to find the importance frame and calculate the minimum depth frame [67]. Finally, the area under the curve was computed using PRROC R package [68] and the receiver operating characteristic (ROC) curve was plotted for the MDD and PTSD RF models.
Constructing signal transduction network and bipartite network for TRFs and uncovering candidate drug for repurposing
Obesity and smoking signature genes with regulatory functions, whether transcription- or translation-related, were retrieved from MsigDB [52, 69]. A signaling network of the source genes, TRFs, was constructed with the top MDD and PTSD genes as the target nodes. Signor database [70] plugin in Cytoscape 3.10 [71] was used to determine the shortest path between the TRFs of both habitual phenotypes and the top-ranked gene derived from the RF model. This process was repeated for nine transcription factors for the top disease genes built by the model, that is, 10 for MDD and 22 for PTSD. Furthermore, the source signaling genes and signal target genes were retrieved from the Drug–Gene Interaction database (DGIdb), and the repurposing hub was obtained from BROAD Institute [72, 73].
Statistical analysis
The p-value threshold used in this study was set at 0.05. Cross-validation was performed by randomly sampling each metadata point for every phenotype 2500 times. Gene set enrichment analysis (GSEA) was corrected using FDR, and the accepted p-value was 0.05. Finally, the random forest model features were identified by a minimum importance of two (P < 0.05). All analyses were performed using R version 4.3.1.
Results
Datasets preprocessing and harmonization results
This study includes 32 microarray raw series divided into discovery and validation metadata sets, as described in supplementary data T1: MDD metadatasets have 534 samples collected from either Peripheral Blood Mononuclear Cells (PBMC) or peripheral blood of diagnosed MDD patients and 119 control samples collected similarly. The total sample size of the PTSD metadatasets encompasses 273 PTSDs and 320 controls. Additionally, the number of obese and smokers is 209 and 611, respectively. Furthermore, there are 123 controls for obesity and 504 controls for smoking. The preprocessing step involves RMA normalization followed by batch effect removal. In both the discovery and validation metadata, two plots are displayed to prove the validity of the harmonization, and the first plot is the ComBat Quality Check (QC) plots created for PTSD Discovery metadataset (Fig. 1a). The left panel shows the density plots for the batch mean and variance overlap between the kernel estimate (black line) and the parametric estimate (red line) of the empirical batch effect density. The right panel shows that the two lines of parametric and actual ordered batch effects follow similar distributions. Figure 1b is a box plot that tests the variance between MDD discovery metadatast values before and after batch effect removal, indicating a significant reduction in variance (P < 2e−16). The final validation graph presents a Multidimensional Scaling (MDS) plot for MDD discovery metadataset before and after batch effect removal, demonstrating the reduction in the first dimension from 55 to 16% following the application of the ComBat function. The validation plots have provided primary confirmation for the subsequent analysis of the four phenotypes under investigation.
Fig. 1.

The plots discern the Quality Control (QC) of the harmonization process, a shows the density and Q-Q plots generated by the ComBat function using the datasets mean and variance on the upper and lower parts, respectively. While b shows that the array variance differed significantly before and after batch correction. The last QC stage is the MDS plot in c, which illustrates that batch correction was successful for the MDD discovery metadata datasets
Gene ontology terms, immunologic sets, and pathways enriched by MDD and PTSD transcriptomic signature
After normalizing all datasets, the probe sets were annotated with gene symbols and aggregated, yielding 17,312 genes for all the discovery metadatasets. In contrast, the probe sets for each phenotype varied. For example, MDD validation metadataset comprised 6968 genes after aggregation and probe set annotation, whereas the obesity validation metadata set contained 9453 genes. For the smoking and PTSD validation metadata sets, the aggregation and merging processes yielded 8819 and 6535 genes, respectively. Upon harmonization, DEGs associated with MDD and PTSD were evaluated using two criteria: a significant difference (P < 0.05) according to the Microarray Quality Control (MAQC) project [74] and a positive correlation between the discovery and validation LogFC values. A total of 352 and 866 DEGs were associated with MDD and PTSD, respectively. The biological process enrichment yielded 68 terms, which were clustered in a tree plot for MDD DEGs. Figure 2a illustrates that three parental terms have positive normalized enrichment scores (NESs). Nevertheless, the cellular positive response secretion term had some downregulated terms, such as regulation of T cell activation and negative regulation of intracellular signal transduction that have NES of 1.54 (P = 0.03) and 1.58 (P = 0.02), respectively. Moreover, the DEGs related to PTSD (Fig. 2b) are centered around five major terms from a total of 126 terms, two of which are commonly identified in the GSEA of MDD signature. The first common descendant term is defense response to bacterium that has NES equal to 2.30 and 1.79 in PTSD (P = 0.004) and MDD (P = 0.001), respectively. However, the second term shared between the two analyses has different NESs, as the regulation of response to wounding in the PTSD GSEA exhibited negative enrichment of NES equal to ~ 2.21 (P = 0.002), unlike the positive regulation of wound healing in MDD, which had NES equal to ~ 1.75 (P = 0.01).
Fig. 2.

Represents the enriched biological processes of MDD and PTSD DEGs. a shows a tree plot for the five ancestral terms enriched by MDD DEGs colored in blue, light-green, red, purple, and green. On the other hand, b displays an emaplot for the five ancestral biological terms enriched by PTSD DEGs, the clusters colored uniquely in the following: purple, pink, brown, mint, and light blue. Two scales were found on the right of both plots: the upper scale represents the number of genes detected in each term; the larger the size of the circle, the larger the gene set size of the term, while the lower scale classifies the terms according to its sign the negatively enriched terms found in red, while the positively enriched terms are colored in blue
To investigate DEGs behavior in terms of immunologic gene set enrichment, a ridge plot was generated to compare the NESs of the common terms between PTSD and MDD DEGs (Fig. 3a). Almost all 17 common terms have positive NES except for three gene sets, GSE11961, GSE26488, and GSE43955. While the first one represents genes upregulated in day 7 memory B cells versus day 40 germinal center B cells, it adopts a different pattern: negative enrichment in MDD of NES ranging from 1 to 2 (P ~ 0.03), and positive enrichment in PTSD of NES ranging from 1 to 1.5 (P = 0.03). The other overlapping gene sets, GSE26488 and GSE43955, are obviously positively enriched in the PTSD DEGs, with a broad peak ranging from 1.2 to 1.6 (P < 0.01) and a sharper one at 1.3 (P = 0.03), respectively. In contrast, both exhibit an inconsistent pattern in MDD GSEA. Furthermore, the three common pathway databases, Reactome, Wikipathways, and KEGG, were scrutinized for enrichment using the transcriptome signature developed in the present study. In the case of MDD, only 12 pathways were successfully enriched, Fig. 3b shows the presence of three pathways associated with immunogenic reactions involving either innate immune cell activation with NES of 1.87 (P = 0.04), antimicrobial peptide formation with NES of 2.05 (P = 0.0008), or neutrophil degranulation with NES of 2.6 (P = 0.0000977). Three disease pathways were enriched: Smith Magenis and Potocki Lupski syndrome copy number variation, and disease of metabolism with NES of 1.6 (P = 0.03), 1.7 (P = 0.004), respectively. Surprisingly, the epidermal growth factor receptor (EGFR) pathway and the interferon signaling pathway demonstrate downregulation and scoring the same (NES = − 1.05, 0.03 < P < 0.04). For PTSD, 72 pathways were enriched according to the transcriptomic signature (Supplementary Data T2). Figure 3c pinpoints that PTSD transcriptomic signature are positively enriched in viral infection pathways, especially those related to human immunodeficiency virus (HIV) infection which have NES ranging from 1.5 to 1.7 (0.01 < P < 0.04). Additionally, three of the fibroblast growth factor receptor (FGFR) protein families were negatively enriched in the neurotrophic tyrosine receptor kinase (NTRK) signaling pathway, all of which has NES of 1.78 (P = 0.008). Focusing on homeostasis, zinc and copper homeostasis pathways were found to be negatively enriched with an NES of ~ 1.9 (0.006 > P > 0.008), and the transport of bile salts and organic acids, metal ions, and amine compounds pathways were suppressed, with a negative NES of − 1.6 (P = 0.01). Some pathways related to neuronal activity, such as circadian rhythm genes and protein–protein interactions at synapses, scored negatively for NES, whereas the scores range between 1.8 and 2 (0.003 < P < 0.02). Although MDD and PTSD signatures exhibited enrichment of two pathways: metabolic disease and neutrophil degranulation, the NES was slightly lower in the case of PTSD as metabolic disease enrichment score is 1.58 (P = 0.03) and Neutrophil degranulation NES is 2.12 (P = 0.0000782).
Fig. 3.

The figure collectively represents a comparison between the MDD and PTSD DEGs in two terms. a: compares the commonly enriched C7 gene sets between MDD and PTSD in the form of a ridge plot; the higher the significance of the set, the more it tends to be represented in blue, and vice versa. b, c: display the cyclic chord and bar plots of enriched pathways of MDD and PTSD DEGs, respectively. The chord color is a code for each enriched pathway, and the square color of each gene represents the LogFC value, whereas red indicates upregulation and cyan indicates downregulation. While the color of each dot in the PTSD bar plot identifies the source database, pathways are ordered from top to bottom in descending order according to the NES value
Co-expression network analysis and biomarkers detection from the transcriptomic signatures of MDD and PTSD.
The correlation matrix built by computing the Spearman correlation between MDD signatures yielded 34 nodes and three communities, whereas the PTSD matrix yielded 592 nodes and 57 communities upon running M1 module analysis. Subsequently, a random forest model was constructed for communities to detect hubs. As shown in Table 1, ten genes passed the significance threshold (P < 0.01) from the MDD signature. Figure 4a shows the ROC curve, which illustrates that the model had an AUC value of 0.85. The distribution of mean minimum depths for MDD top features is displayed in Fig. 4b. This figure illustrates that the top hub ANKRD36 exhibits a mean minimum depth distribution of 3.61.
Table 1.
Lists the importance of MDD modules in the RF model, which is composed of three columns
| Gene symbol | Significance | Importance |
|---|---|---|
| ANKRD36 | Yes | 10.95144 |
| NUP205 | Yes | 8.793977 |
| BRIX1 | Yes | 8.507454 |
| FOXO1 | Yes | 7.451071 |
| CENPJ | Yes | 7.038324 |
| SETDB2 | No | 6.300239 |
| CR2 | No | 6.131017 |
| RTTN | No | 6.010109 |
| INTS7 | Yes | 5.623512 |
| CHD6 | No | 5.449391 |
| GTF3C3 | No | 4.8632 |
| ABCD2 | No | 4.861166 |
| TUBE1 | No | 4.784869 |
| RALGAPA1 | No | 3.798688 |
| PFKFB4 | Yes | 3.64415 |
| PGD | Yes | 3.612938 |
| ATP6V0A1 | Yes | 3.595073 |
| GPR180 | No | 3.444351 |
| C4orf48 | Yes | 3.441046 |
| PTPRK | No | 3.257066 |
| HSF2 | No | 3.227333 |
| TNFSF14 | No | 3.191718 |
| TST | No | 3.145025 |
| SLC16A3 | No | 3.112939 |
| CBLB | No | 3.087692 |
| PAQR3 | No | 3.04582 |
| CWF19L2 | No | 3.034433 |
| CEACAM4 | No | 3.005688 |
| MFN2 | No | 2.865313 |
| TFEB | No | 2.862644 |
| PHC1 | No | 2.829178 |
| EVI5L | No | 2.815048 |
| CLDND1 | No | 2.681666 |
| UNC93B1 | No | 2.536419 |
The gene symbols their corresponding importance values is in the first and last one, respectively. The second one indicates whether each module passed the significance threshold or failed; the default p-value threshold in the model was 0.01
Fig. 4.
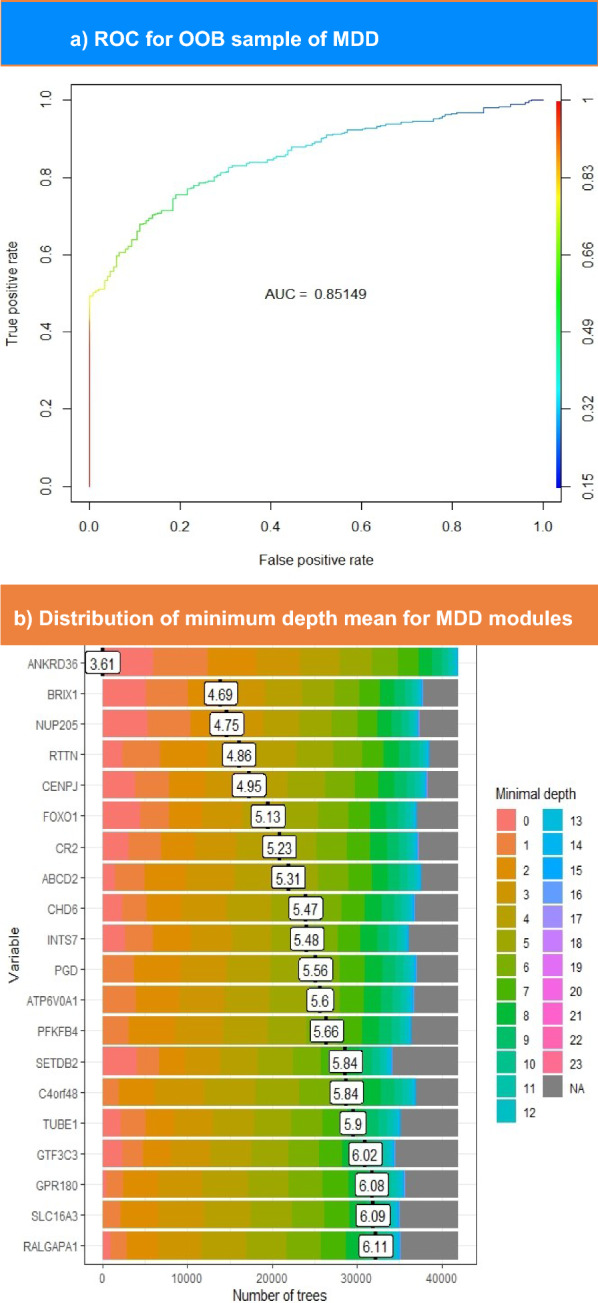
The upper part shows the ROC curve for OOB sampling built for MDD modules. This plot illustrates the performance of the model in distinguishing between patients with MDD and controls. The color scale ranges from blue to red, such that blue indicates the lowest AUC value and red indicates higher values. The lower section represents the distribution of the mean minimum depth for top-ranked MDD genes. The genes with the lowest minimal depth are colored pink, and the color of the scale changes until it reaches gray at the end of the permutations
In the RF model of PTSD modules, 22 genes exceeded an importance value of 2. The ROC curve and minimum depth distribution graph were produced for PTSD hubs, as illustrated in Fig. 5a and b, respectively. However, Fig. 5a shows that PTSD model demonstrates a slightly higher AUC (0.9) compared to MDD model. As presented in Table 2, TMEM126A exhibits the highest importance score of 4.17. Nevertheless, the latter does not own the minimal mean depth, as FANCM records the lowest mean depth of 4.2, while TMEM126A ranks sixth lowest, scoring 6.75 (Fig. 5b). Overall, MDD hubs seem to have higher importance scores than PTSD hubs. In contrast, PTSD mean minimum depth scores is slightly higher than those of MDD hubs, as presented in Tables 1 and 2.
Fig. 5.
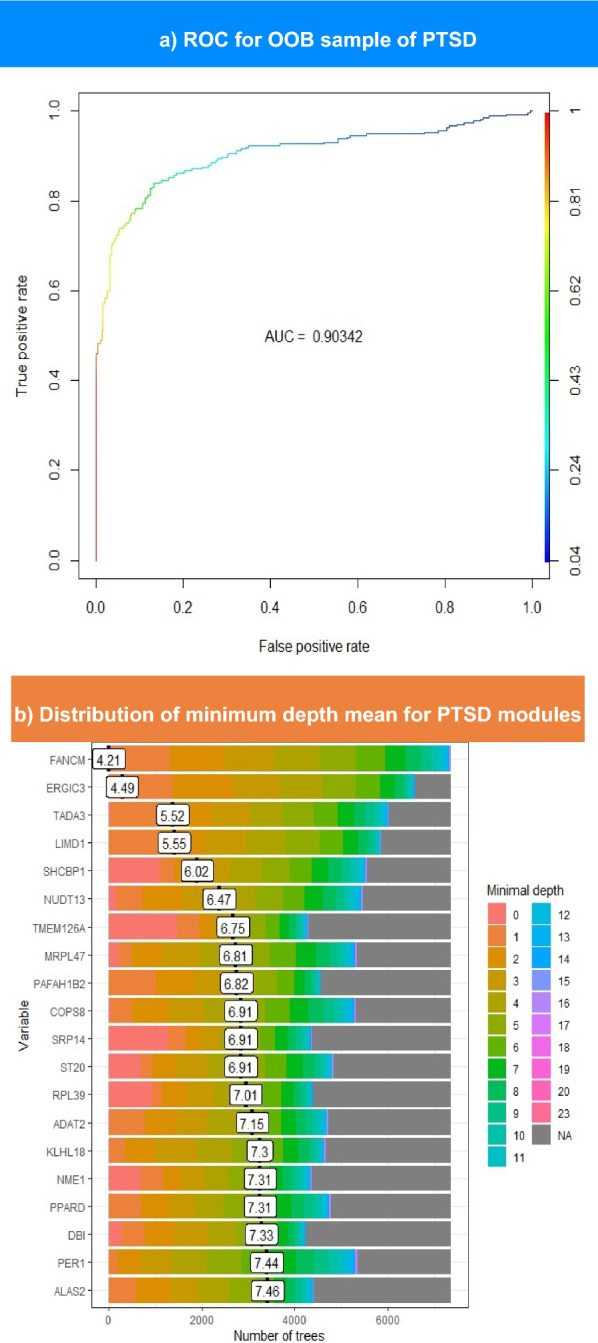
The upper part shows the ROC curve for OOB sampling built for PTSD modules. This plot illustrates the performance of the model in distinguishing between patients with PTSD and controls. The color scale ranges from blue to red, such that blue indicates the lowest AUC value and red indicates higher values. The lower section represents the distribution of the mean minimum depth for top-ranked PTSD genes. The genes with the lowest minimal depth are colored pink, and the color of the scale changes until it reaches gray at the end of the permutations
Table 2.
Lists the importance of PTSD modules in the RF model, which is composed of three columns
| Gene symbol | Significance | Importance |
|---|---|---|
| TMEM126A | Yes | 4.171664721 |
| SRP14 | Yes | 3.612324079 |
| SHCBP1 | Yes | 3.200501377 |
| GGCT | Yes | 3.182622332 |
| ACAT2 | No | 3.16227449 |
| CHCHD7 | Yes | 2.955685014 |
| INPP1 | Yes | 2.884858403 |
| POLR2G | Yes | 2.758969793 |
| RPL39 | Yes | 2.652354724 |
| GPD1L | Yes | 2.590220474 |
| CDC26 | Yes | 2.565066794 |
| MFAP1 | Yes | 2.541240161 |
| TTF1 | Yes | 2.538019041 |
| NDUFAF1 | Yes | 2.531358526 |
| TBCC | No | 2.521683911 |
| EIF2AK4 | Yes | 2.489983947 |
| ZNF738 | Yes | 2.359461135 |
| PIGF | Yes | 2.142219187 |
| ALG6 | Yes | 2.088173914 |
| NME1 | Yes | 2.0754141 |
| ST20 | Yes | 2.070198423 |
| GYPC | Yes | 2.058727396 |
| TAF7 | Yes | 2.042329917 |
| PIGC | Yes | 2.023403725 |
The gene symbols their corresponding importance values is in the first and last one, respectively. The second one indicates whether each module passed the significance threshold or failed; the default p-value threshold in the model was 0.01
Exploring the signaling relationship between habits and mental health.
To determine the regulatory relationship between habitual phenotypes (diet-induced obesity and smoking) and the two disorder hubs, the same preprocessing procedure was used to construct a transcriptomic signature. In the obesity signature, eight genes were found to possess regulatory functions: COPS5, GATA2, MORF4L1, OPTN, PFDN5, SETBP1, TCF4, and ZBTB16. Moreover, smoking signature included one transcription factor: MYC. The shortest path between the nine regulatory genes and MDD and PTSD disease genes was identified. The PTSD hubs, SHCBP1 and TTF1, were predicted to indirectly receive signals from the regulatory signatures of obesity and smoking. The signal transduction networks associated with the four regulatory factors that target TTF1 are shown in Fig. 6a. In contrast, the MDD hub genes FOXO1, CENPJ, and PGD were hypothesized to have signals transduced from the TRF signatures of the habitual phenotypes. Figure 6b shows the shortest paths of FOXO1 for the four TRFs. Of the nine TRFs, two genes, ZBTB16 and PFDN5, were found to have no connection with any MDD or PTSD hub. Generally, TRFs seemed to transduce shorter signal paths toward PTSD disease genes than MDD. After retrieving the drugs that interacted with either TRFs or hub genes, MYC, the smoking regulatory signature, was predicted to interact with 71 compounds. The Obesity TRFs GATA2 and TCF4 were predicted to interact with four and two interactors, respectively. Azacitidine commonly interacts with GATA2 and MYC. With respect to the drugs retrieved, only FOXO1, PGD, and ATP6V0A1 from the MDD hubs were predicted to have 5, 3, and 10 interactors, respectively. In contrast, 6 of the top 20 PTSD genes were hypothesized to interact with compounds retrieved from DGIdb and BROAD repurposing hub. Notably, one PTSD hub, INPP1, has one common FDA-approved drug with MYC,lithium, as shown in Fig. 6c.
Fig. 6.

The figure shows the signal transduction network and drug-gene interaction network. a, b shows the four signal transduction paths of the four TRFs toward TTF1 gene in the upper part and FOXO1 gene in the lower part. The blue line in the network represents positive regulation, and the red-colored edges represent negative regulation of the target node. In c the drugs targeting lifestyle-based and disease genes are shown. Drug nodes are colored as follows: purple, dark blue, and faint yellow for drugs targeting MDD, PTSD hubs, and TRFs (MYC, GATA2, TCF4), respectively. In contrast, the gene source nodes are green
Discussion
This study began with sample harmonization and the QC plots for the process were repeated for all phenotypes. MDS plots demonstrated expression patterns across different dataset [75], highlighting how MDS illustrates the difference before and after batch correction. After sample harmonization, MDD DEGs positively enriched the regulation of interleukin-6 (IL-6) production, which is consistent with the results of multiple previous studies proving that multiple interleukins are dysregulated in the blood of MDD patients, including IL-6 [76–79]. Moreover, T-cell activation was downregulated, whereas neutrophil chemotaxis was upregulated. The surge in (NLR) in patients with MDD has been discussed as an inflammatory biomarker for depression or as another disease etiology associated with MDD [80–84].
Overall, pathway enrichment of the MDD DEGs supported the biological process results, as shown in Fig. 3b. Moreover, interferon (IFN) signaling was found to be influenced by pathway enrichment. IFN plays a crucial role in the pathogenesis of depression-related inflammation, especially in patients receiving IFN-induced treatment for hepatitis C infection, However, previous research results have been inconsistent. One study either reported that IFN-induced treatment does not necessitate depression development [85] or that IFN blood levels are downregulated [86], and aligned with the GSEA results (Fig. 3b). Thus, personalized check-ups should be conducted before prescribing medications to restore the IFN levels.
Notably, the child terms in the embryonic heart tube asymmetry cluster have negative NESs, consistent with previous association studies investigating the impact of prenatal depression on fetal development and embryonic heart development [87–90]. Thus, this observation entails mentoring infants' heart health by examining the maternal blood of MDD patients.
The enrichment of DEGs identified in PTSD signature indicated that the biological processes involved in dendritic spine development were both impaired and downregulated. This finding is in agreement with those of previous studies [91, 92]. Previous research have investigated the causal mechanism of this impairment upon exposure to chronic stress, and some have concluded that the reason for dendritic spine dysmorphogenesis is the substantial increase in glucocorticoid levels [93, 94]. Pathway enrichment analysis complemented the biological process enrichment analysis, revealing many of the FGFR family members (FGFR1,3, and 4); the NTRK1 signaling pathway was negatively enriched, whereas the dysregulation of both families is vital for the development of cognitive impairment and neural stem cell abnormal differentiation [95–97], which were preliminarily reported in PTSD pathogenesis [98, 99].
Nakajima et al. studied the effect of NTRK1 mutation in mice and reported that the mice exhibited depression-like behavior, suggesting that NTKR1 may serve as a prognostic marker for bipolar and depressive disorders [100]. However, the FGFR system is dysregulated in MDD patients [101]. This link suggests that redirecting treatment for MDD patients with comorbid PTSD could trigger rebalancing of the NTKR and FGFR signaling systems. Furthermore, the impact of PTSD on plasma membrane homeostasis was clear (Fig. 3c). Similarly, zinc and copper homeostasis was downregulated. Previously, zinc homeostasis disruption was suggested to crucially contribute to the development of neurodegenerative disease neuroinflammation, and oxidative stress in the central nervous system has increased [102, 103]. These findings are consistent with the upregulation of several pathways enriched in the PTSD GSEA, which included the alpha oxidation of phytanate and biological oxidation, as displayed in Fig. 3c. Notably, a decreased zinc balance is correlated with various mood disorders, among which the most noticeable was depression [104]. For this purpose, it is advisable to either use zinc rebalancing strategies as one of the treatment paths or repurpose quondam drugs for PTSD treatment, as these agents act on membrane transporter modulation to regulate zinc ions.
Despite the high similarity between MDD and PTSD-enriched immunologic-related gene sets, only PTSD enrichment analysis revealed the negative regulation of the extracellular signal-regulated kinase 1,2 (ERK1/2) cascade in the same cluster of genes involved in the negative regulation of smooth muscle migration. The ERK1/2 cascade fluctuate due to PTSD [105, 106] and is further associated with gluconeogenesis [107], a key player in the development of diabetes mellitus type 2 (T2D) [108–110]. This finding explains why the wound healing cascade is negatively regulated by PTSD signature (Fig. 2b), unlike in MDD signature (Fig. 2a). Subsequently, this study endorses the avoidance of selective serotonin reuptake inhibitor (SSRI) intake in patients with MDD and PTSD comorbidity, since SSRIs can prevent blood coagulation [111–113].
Disease gene identification has been essential in multiple fields, including diagnostic field, drug discovery, and personalized medicine [114, 115]. Forkhead box protein O1 (FOXO1) is among the most important hubs that contributes to the coordination of stress tolerance, cell differentiation, and proliferation [116, 117]. Considerable evidence has proven that the expression of FOXO1 is manipulated by phosphorylation during depression [118, 119]. Previous studies have suggested that 6-phosphogluconate dehydrogenase (PGD) expression is interrupted due to microRNA expression in schizophrenia and bipolar disorder [120] and fluctuates during frontotemporal lobar degeneration (FTLD) [121]. Additionally, centromere protein J (CENPJ) depletion has been strongly associated with reduced brain size as emphasized in primary microcephaly 6 (MCPH6), severe intellectual disability, and abnormal cilia disassembly in adult neural stem cells [122, 123]. In addition to research on the roles of these genes in brain homeostasis and normal neurogenesis, this study showed that FOXO1, CENPJ, and PGD were significantly interrupted in MDD (Table 1), suggesting that these genes are MDD biomarkers.
Eukaryotic translation initiation factor 2 alpha kinase 4 (EIF2AK4), which has been intensively studied as a psychotic drug target, was also detected [124, 125]. Most of the top 22 genes associated with PTSD were mapped to functions related to transcriptional regulation, mRNA posttranscriptional modification, or translation-related proteins. Most of the top 20 genes associated with PTSD were mapped to functions related to transcriptional regulation, post-transcriptional mRNA modification, or translation-related proteins. Among these proteins, src homology collagen (SHC) SH2 domain-binding protein 1 (SHCBP1) was prioritized in the RF model. The nucleoprotein SHCBP1 has been mentioned in multiple studies as a potential prognostic agent for many types of cancers. [126, 127], one of which was glioma [128, 129]. Additionally, excessive phosphatidylinositol glycan C (PIGC) gene expression contributes to hepatocellular carcinoma lethality [130, 131], while a mutation in the PIGC gene is correlated with epilepsy and seizure disorders [132]. Furthermore, thorough investigation of the thyroid transcription factor 1 (TTF1) gene revealed its crucial role in lung adenocarcinoma as either a diagnostic agent or a target for treatment [133–136]. The results from disease gene discovery for PTSD prove the strong correlation between stress and development (Table 2). Lifestyle has been intensively discussed as a driving factor for mental well-being [137–140]. Although the signaling pathways from TRFs to MDD and PTSD hubs are circuitous (Fig. 6a, b), such paths support the previous hypothesis that an unhealthy lifestyle is a risk factor for mental disorders.
Drug repurposing provides an optimal solution for drug discovery, as it eliminates several steps required for the approval of traditional drugs. Various methods have been used to predict the repositioning of candidate compounds. Methods for repurposing differ based on the availability of data related to either disease or drug candidates. To aid such a purpose, deep learning technologies have led the field of computational methods. Neural Matrix Factorization (NMF) has been widely used in repurposing because of its ability to handle sparse data from disease-drug matrices. NMF depends on latent feature factors (drugs and diseases, for example) to drive a relationship between each using Euclidean distance calculation [141, 142]. These properties have encouraged further enhancements to the model such as Neural Matrix Factorization++(NeuMF + +) and Neural Collective Matrix Factorization (NCMF). Although the two models adopted the same strategy as the traditional NMF, the algorithm either depended on auxiliary data representation, as in NeuMF++, or utilized collected data from manifold matrices, such as NCMF. The former uses Multilayer Perceptrons (MLP) with NMF to handle auxiliary data and integrate it into a representation task that allows NeuMF++ to capture nonlinear relationships, while the latter involves the use of Variational Autoencoders (VAE) so that NCMF can handle noisy data. The last example of advancement in NMF is the Additional Neural Matrix Factorization (ANMF) method, which provides the advantage of using two matrices, a drug-drug and disease-disease similarity matrix, to learn from known associations before proceeding to the final step that involves negative sampling [143–145]. Negative sampling is widely used in drug reprocessing tasks as a savior strategy to handle data sparsity, but in turn introduces a huge bias in the representation task. Several models have counteracted the negative sampling bias, such as self-supervised learning (SSL). SSL handles data sparsity through three consecutive strategies: The first is creating variables of the original data matrices in a process called data augmentation; hence, it uses "self" data instead of negative samples. The second one is comparing drug similarities to each other through contrastive learning, the last one being joint training where the two previous steps take place coherently to feed the representation task of drug-disease association [146]. A more specific model was developed to predict drug-target binding affinity, which is Graph-Contrastive Learning for Drug-Target binding Affinity prediction (GraphCL-DTA). The main difference between SSL and GraphCL-DTA is that the latter uses molecular graph semantics during the contrastive learning process and relies on distinguishing the views of the graph upon augmentation [147]. Therefore, GraphCL-DTA is recommended for further analysis of the drug targets identified in the current study.
This study reports that diet-induced obesity and smoking TRFs transduce signals to genes related to stress and normal intellectual skills, drug repositioning could inspire hope in patients with drug-resistant infections. Cures that reduce inflammation, such as nonsteroidal anti-inflammatory drugs (NSAIDs) [148, 149], ABT-639 [150–152], and 6-Prenylnaringenin[153–155] were shown to interact with either lifestyle-related TRFs or lifestyle-affected hubs (Fig. 6c). Thus, we recommend using one of these candidates along with an appropriate treatment protocol, as previous drugs can alleviate physiological inflammation.
Knowing that PTSD is a risk factor for visual disturbances [156, 157], Supplementary Data T3 reported that aflibercept had the highest interaction score with PIGC. These findings demonstrate the strong potential of PIGF as a PTSD biomarker and suggest the use of aflibercept for the treatment of PTSD patients if signs of blurry vision are present [158, 159]. Moreover, research has shown that penicillamine [160, 161] might resolve symptoms of rheumatoid arthritis (RA) in MDD patients, as depression and RA are strongly correlated [162, 163]. Critically, the observed interaction between MDD hub, PGD, and phenobarbital explains why several case studies have reported a decrease in the psychological state of patients with epilepsy upon long-term intake of these drugs [164, 165].
Conclusion
This study revealed potential biomarkers for MDD and PTSD by analyzing their transcriptomic signatures. By examining the signal transduction of diet-induced obesity and smoking TRFs, this research provides new insights into the effect of these habits on the regulation of MDD and PTSD biomarkers. It is worth mentioning that this study relies on a single omics layer, which may limit the comprehensive understanding of complex cellular systems for these disorders. Nevertheless, this study presents a reliable pipeline, which is a potential resolution for the persistent challenge in biological research that requires larger sample sizes to enhance the reliability of the analysis results. These findings indicate a novel approach for biomarker detection, drug repurposing, and personalized treatment strategies that take into account patients' lifestyle factors and blood transcriptomic profiles.
Supplementary Information
Acknowledgements
Not Applicable.
Abbreviations
- TRFs
Transcription-regulating factors
- MDD
Major depressive disorder
- PTSD
Post-traumatic stress disorder
- WHO
World Health Organization
- DREAM
Dialogue on reverse engineering and assessment
- RMA
Robust multichip average
- FDR
False discovery rate
- DEGs
Differentially expressed genes
- MoNet
Multi-omic network analysis
- RF
Random forest
- ROC
Receiver operating characteristic
- DGidb
Drug-gene interaction database
- LogFC
Logarithmic fold change
- GSEA
Gene set enrichment analysis
- QC
Quality check
- UMAP
Uniform manifold approximation and projection
- MAQC
MicroAarray quality control
- EGFR
Epidermal growth factor receptor
- HIV
Human immunodeficiency virus
- FGFR
Fibroblast growth factor receptor
- NTRK
Neurotrophic tyrosine receptor kinase
- PBMC
Peripheral blood mononuclear cell
- PCA
Principal component analysis
- IL-6
Interleukin-6
- NLR
Neutrophil/lymphocyte ratio
- IFN
Interferon
- ERK
Extracellular signal-regulated kinases
- FOXO1
Forkhead box protein O1
- BNDF
Brain-derived neurotrophic factor
- PGD
6-Phosphogluconate dehydrogenase
- FTLD
Frontotemporal lobar degeneration
- CENPJ
Centromere protein J
- MCPH6
Primary microcephaly-6
- EIF2AK4
Eukaryotic translation initiation factor 2 alpha kinase 4
- SHCBP1
Src homology collagen (SHC) SH2 domain-binding protein 1
- PIGC
PhosphatidylInositol glycan C
- TIFF1
Thyroid transcription factor 1
- NMF
Neural matrix factorization
- NeuMF++
Neural matrix factorization++
- NCMF
Neural collective matrix factorization
- MLP
Multilayer perceptrons
- VAE
Variational autoencoders
- ADMF
Additional neural matrix factorization
- SSL
Self-supervised learning
- GraphCL-DTA
Graph-contrastive learning for drug-target binding affinity prediction
- FDA
Food and drug administration
- NSAIDs
Non-steroidal anti-inflammatory drugs
- RA
Rheumatoid arthritis
Author contributions
M.A.T. are the main contributing authors; they wrote the preliminary manuscript, and collected the figures. A.A. supervised the biological interpretation of the data and commented on the interpretation of the results. I.Y. supervised the statistical procedure, and revised the manuscript and codes generated by M.A.T. All the authors read and approved the final manuscript.
Funding
Open access funding provided by The Science, Technology & Innovation Funding Authority (STDF) in cooperation with The Egyptian Knowledge Bank (EKB). The authors declare that no funds, grants, or other support were received during the preparation of this manuscript.
Availability of data and materials
All the data analyzed during this study are included in this published article [found in its supplementary information Additional file two].
Declarations
Ethics approval and consent to participate
This is an observational study. The Institutional Animal Care & Use Committee (IACUC) Cairo University has confirmed that no ethical approval is required.
Consent for publication
Not applicable.
Competing interests
The authors declare that they have no competing interest.
Footnotes
Publisher's Note
Springer Nature remains neutral with regard to jurisdictional claims in published maps and institutional affiliations.
References
- 1.Mental disorders. [cited 2024 Feb 7]; Available from: https://www.who.int/news-room/fact-sheets/detail/mental-disorders
- 2.Mental health of older adults. [Internet]. [cited 2024 Feb 7]. Available from: https://www.who.int/news-room/fact-sheets/detail/mental-health-of-older-adults
- 3.Depressive disorder (depression). [Internet]. [cited 2024 Feb 7]. Available from: https://www.who.int/news-room/fact-sheets/detail/depression
- 4.Mental Health and COVID-19: Early evidence of the pandemic’s impact: Scientific brief. [cited 2024 Feb 7]; Available from: https://www.who.int/publications/i/item/WHO-2019-nCoV-Sci_Brief-Mental_health-2022.1
- 5.Solmi M, Radua J, Olivola M, Croce E, Soardo L, de Pablo GS, et al. Mol Psychiatry. 2022;27:281–95. [DOI] [PMC free article] [PubMed] [Google Scholar]
- 6.Vermani M, Marcus M, Katzman MA. Rates of detection of mood and anxiety disorders in primary care. Prim Care Companion CNS Disord. 2011;13(2):27211. [DOI] [PMC free article] [PubMed] [Google Scholar]
- 7.Ayano G, Demelash S, Yohannes Z, Haile K, Tulu M, Assefa D, et al. Misdiagnosis, detection rate, and associated factors of severe psychiatric disorders in specialized psychiatry centers in Ethiopia. Ann Gen Psychiatry. 2021;20:10. [DOI] [PMC free article] [PubMed] [Google Scholar]
- 8.Mandy W, Midouhas E, Hosozawa M, Cable N, Sacker A, Flouri E. Mental health and social difficulties of late-diagnosed autistic children, across childhood and adolescence. J Child Psychol Psychiatry. 2022;63:1405–14. [DOI] [PMC free article] [PubMed] [Google Scholar]
- 9.Hefner G, Hahn M, Toto S, Hiemke C, Roll SC, Wolff J, et al. Potentially inappropriate medication in older psychiatric patients. Eur J Clin Pharmacol. 2021;77:331–9. [DOI] [PubMed] [Google Scholar]
- 10.Fincke BG, Miller DR, Spiro A. The interaction of patient perception of overmedication with drug compliance and side effects. J Gen Intern Med. 1998;13:182–5. [DOI] [PMC free article] [PubMed] [Google Scholar]
- 11.Schjøtt J, Aßmus J. A retrospective comparison of inappropriate prescribing of psychotropics in three Norwegian nursing homes in 2000 and 2016 with prescribing quality indicators. BMC Med Inform Decis Mak. 2019;19:102. [DOI] [PMC free article] [PubMed] [Google Scholar]
- 12.Akhondzadeh S. Personalized medicine: a tailor made medicine. Avicenna J Med Biotechnol. 2014;6:191. [PMC free article] [PubMed] [Google Scholar]
- 13.Verdezoto NX, Wolff Olsen J. Personalized medication management. In Proceedings of the 2nd ACM SIGHIT international health informatics symposium. New York, NY, USA: ACM; 2012. p. 813–8.
- 14.Hein A-E, Vrijens B, Hiligsmann M. A Digital Innovation for the Personalized Management of Adherence: Analysis of Strengths, Weaknesses, Opportunities, and Threats. Front Med Technol. 2020;2. [DOI] [PMC free article] [PubMed]
- 15.Howes OD, Thase ME, Pillinger T. Treatment resistance in psychiatry: state of the art and new directions. Mol Psychiatry. 2022;27:58–72. [DOI] [PMC free article] [PubMed] [Google Scholar]
- 16.Minich DM, Bland JS. Personalized lifestyle medicine: relevance for nutrition and lifestyle recommendations. Sci World J. 2013;2013:1–14. [DOI] [PMC free article] [PubMed] [Google Scholar]
- 17.Arena R, Ozemek C, Laddu D, Campbell T, Rouleau CR, Standley R, et al. Applying precision medicine to healthy living for the prevention and treatment of cardiovascular disease. Curr Probl Cardiol. 2018;43:448–83. [DOI] [PubMed] [Google Scholar]
- 18.Delpierre C, Lefèvre T. Precision and personalized medicine: What their current definition says and silences about the model of health they promote. Implication for the development of personalized health. Front Sociol. 2023;8. [DOI] [PMC free article] [PubMed]
- 19.Alzeer J. Integrating medicine with lifestyle for personalized and holistic healthcare. J Public Health Emerg. 2023;7:33–33. [Google Scholar]
- 20.Barabási A-L, Gulbahce N, Loscalzo J. Network medicine: a network-based approach to human disease. Nat Rev Genet. 2011;12:56–68. [DOI] [PMC free article] [PubMed] [Google Scholar]
- 21.Chen JY, Piquette-Miller M, Smith BP. Network medicine: finding the links to personalized therapy. Clin Pharmacol Ther. 2013;94:613–6. [DOI] [PubMed] [Google Scholar]
- 22.Infante T, Del Viscovo L, De Rimini ML, Padula S, Caso P, Napoli C. Network medicine: a clinical approach for precision medicine and personalized therapy in coronary heart disease. J Atheroscler Thromb. 2020;27:279–302. [DOI] [PMC free article] [PubMed] [Google Scholar]
- 23.Sonawane AR, Weiss ST, Glass K, Sharma A. Network medicine in the age of biomedical big data. Front Genet. 2019;10. [DOI] [PMC free article] [PubMed]
- 24.Maron BA, Altucci L, Balligand J-L, Baumbach J, Ferdinandy P, Filetti S, et al. A global network for network medicine. NPJ Syst Biol Appl. 2020;6:29. [DOI] [PMC free article] [PubMed] [Google Scholar]
- 25.Choobdar S, Ahsen ME, Crawford J, Tomasoni M, Fang T, Lamparter D, et al. Assessment of network module identification across complex diseases. Nat Methods. 2019;16:843–52. [DOI] [PMC free article] [PubMed] [Google Scholar]
- 26.Fried EI, Robinaugh DJ. Systems all the way down: embracing complexity in mental health research. BMC Med. 2020;18:205. [DOI] [PMC free article] [PubMed] [Google Scholar]
- 27.Scarpa JR, Jiang P, Gao VD, Fitzpatrick K, Millstein J, Olker C, et al. Cross-species systems analysis identifies gene networks differentially altered by sleep loss and depression. Sci Adv. 2018;4. [DOI] [PMC free article] [PubMed]
- 28.Sun C, Zhu Z, Zhang P, Wang L, Zhang Q, Guo Y, et al. Exploring the interconnections of anxiety, depression, sleep problems and health-promoting lifestyles among Chinese university students: a comprehensive network approach. Front Psychiatry. 2024;15. [DOI] [PMC free article] [PubMed]
- 29.Wang S-B, Xu W-Q, Gao L-J, Tan W-Y, Zheng H-R, Hou C-L, et al. Bridge connection between depression and anxiety symptoms and lifestyles in Chinese residents from a network perspective. Front Psychiatry. 2023;14. [DOI] [PMC free article] [PubMed]
- 30.Oommen AM, Cunningham S, O’Súilleabháin PS, Hughes BM, Joshi L. An integrative network analysis framework for identifying molecular functions in complex disorders examining major depressive disorder as a test case. Sci Rep. 2021;11:9645. [DOI] [PMC free article] [PubMed] [Google Scholar]
- 31.Fan T, Hu Y, Xin J, Zhao M, Wang J. Analyzing the genes and pathways related to major depressive disorder via a systems biology approach. Brain Behav. 2020;10. [DOI] [PMC free article] [PubMed]
- 32.Kennis M, van Rooij SJH, van den Heuvel MP, Kahn RS, Geuze E. Functional network topology associated with posttraumatic stress disorder in veterans. Neuroimage Clin. 2016;10:302–9. [DOI] [PMC free article] [PubMed] [Google Scholar]
- 33.Segal A, Wald I, Lubin G, Fruchter E, Ginat K, Ben Yehuda A, et al. Changes in the dynamic network structure of PTSD symptoms pre-to-post combat. Psychol Med. 2020;50:746–53. [DOI] [PMC free article] [PubMed] [Google Scholar]
- 34.Jiang W, Ren Z, Yu L, Tan Y, Shi C. A network analysis of post-traumatic stress disorder symptoms and correlates during the COVID-19 pandemic. Front Psychiatry. 2020;11. [DOI] [PMC free article] [PubMed]
- 35.Neylan TC, Schadt EE, Yehuda R. Biomarkers for combat-related PTSD: focus on molecular networks from high-dimensional data. Eur J Psychotraumatol. 2014;5. [DOI] [PMC free article] [PubMed]
- 36.Ressler Kerry J, Berretta S, Bolshakov VY, Rosso IM, Meloni EG, Rauch SL, et al. Post-traumatic stress disorder: clinical and translational neuroscience from cells to circuits. Nat Rev Neurol. 2022;18:273–88. [DOI] [PMC free article] [PubMed] [Google Scholar]
- 37.van Dam S, Võsa U, van der Graaf A, Franke L, de Magalhães JP. Gene co-expression analysis for functional classification and gene–disease predictions. Brief Bioinform. 2017;bbw139. [DOI] [PMC free article] [PubMed]
- 38.Zitnik M, Nguyen F, Wang B, Leskovec J, Goldenberg A, Hoffman MM. Machine learning for integrating data in biology and medicine: Principles, practice, and opportunities. Inform Fus. 2019;50:71–91. [DOI] [PMC free article] [PubMed] [Google Scholar]
- 39.The vicious cycle of tobacco use and mental illness – a double burden on health. World Health Organization (WHO). 2021.
- 40.Dabravolskaj J, Patte KA, Yamamoto S, Leatherdale ST, Veugelers PJ, Maximova K. Association between diet and mental health outcomes in a sample of 13,887 adolescents in Canada. Prev Chronic Dis. 2024;21: 240187. [DOI] [PMC free article] [PubMed] [Google Scholar]
- 41.Barrett T, Wilhite SE, Ledoux P, Evangelista C, Kim IF, Tomashevsky M, et al. NCBI GEO: archive for functional genomics data sets—update. Nucl Acids Res. 2012;41:D991–5. [DOI] [PMC free article] [PubMed] [Google Scholar]
- 42.Athar A, Füllgrabe A, George N, Iqbal H, Huerta L, Ali A, et al. ArrayExpress update – from bulk to single-cell expression data. Nucleic Acids Res. 2019;47:D711–5. [DOI] [PMC free article] [PubMed] [Google Scholar]
- 43.Gautier L, Cope L, Bolstad BM, Irizarry RA. affy—analysis of Affymetrix GeneChip data at the probe level. Bioinformatics. 2004;20:307–15. [DOI] [PubMed] [Google Scholar]
- 44.Carvalho BS, Irizarry RA. A framework for oligonucleotide microarray preprocessing. Bioinformatics. 2010;26:2363–7. [DOI] [PMC free article] [PubMed] [Google Scholar]
- 45.Ritchie ME, Phipson B, Wu D, Hu Y, Law CW, Shi W, et al. limma powers differential expression analyses for RNA-sequencing and microarray studies. Nucl Acids Res. 2015;43:e47–e47. [DOI] [PMC free article] [PubMed] [Google Scholar]
- 46.Leek JT, Johnson WE, Parker HS, Fertig EJ, Jaffe AE, Zhang Y, et al. sva: Surrogate Variable Analysis. R package version 3500. 2023.
- 47.Schneider A, Hommel G, Blettner M. Linear regression analysis. Dtsch Arztebl Int. 2010. [DOI] [PMC free article] [PubMed]
- 48.Benjamini Y, Hochberg Y. Controlling the false discovery rate: a practical and powerful approach to multiple testing. J Roy Stat Soc: Ser B (Methodol). 1995;57:289–300. [Google Scholar]
- 49.Gene Ontology data from the 2023-01-01 release . made available under the terms of the CC BY 4.0 license.
- 50.Thomas PD, Ebert D, Muruganujan A, Mushayahama T, Albou L, Mi H. <scp>PANTHER</scp> : making genome-scale phylogenetics accessible to all. Protein Sci. 2022;31:8–22. [DOI] [PMC free article] [PubMed] [Google Scholar]
- 51.Wu T, Hu E, Xu S, Chen M, Guo P, Dai Z, et al. clusterProfiler 4.0: a universal enrichment tool for interpreting omics data. Innov. 2021;2:100141. [DOI] [PMC free article] [PubMed] [Google Scholar]
- 52.Liberzon A, Birger C, Thorvaldsdóttir H, Ghandi M, Mesirov JP, Tamayo P. The molecular signatures database hallmark gene set collection. Cell Syst. 2015;1:417–25. [DOI] [PMC free article] [PubMed] [Google Scholar]
- 53.Milacic M, Beavers D, Conley P, Gong C, Gillespie M, Griss J, et al. The reactome pathway knowledgebase 2024. Nucl Acids Res. 2024;52:D672–8. [DOI] [PMC free article] [PubMed] [Google Scholar]
- 54.Kanehisa M, Goto S. KEGG: kyoto encyclopedia of genes and genomes. Nucl Acids Res. 2000;28:27–30. [DOI] [PMC free article] [PubMed] [Google Scholar]
- 55.Kanehisa M. Toward understanding the origin and evolution of cellular organisms. Protein Sci. 2019;28:1947–51. [DOI] [PMC free article] [PubMed] [Google Scholar]
- 56.Agrawal A, Balcı H, Hanspers K, Coort SL, Martens M, Slenter DN, et al. WikiPathways 2024: next generation pathway database. Nucleic Acids Res. 2024;52:D679–89. [DOI] [PMC free article] [PubMed] [Google Scholar]
- 57.Walter W, Sánchez-Cabo F, Ricote M. GOplot: an R package for visually combining expression data with functional analysis. Bioinformatics. 2015;31:2912–4. [DOI] [PubMed] [Google Scholar]
- 58.Kassambara A. ggpubr: ‘ggplot2’ Based Publication Ready Plots. 2023.
- 59.William Revelle. psych: Procedures for Psychological, Psychometric, and Personality Research. Northwestern University, Evanston, Illinois R package version 243. 2024.
- 60.Rousselet GA, Pernet CR. Improving standards in brain-behavior correlation analyses. Front Hum Neurosci. 2012;6. [DOI] [PMC free article] [PubMed]
- 61.Li J, Chen F, Liang H, Yan J. MoNET: an R package for multi-omic network analysis. Bioinformatics. 2022;38:1165–7. [DOI] [PMC free article] [PubMed] [Google Scholar]
- 62.Arenas A, Duch J, Fernández A, Gómez S. Size reduction of complex networks preserving modularity. New J Phys. 2007;9:176–176. [Google Scholar]
- 63.Arenas A, Fernández A, Gómez S. Analysis of the structure of complex networks at different resolution levels. New J Phys. 2008;10: 053039. [Google Scholar]
- 64.Breiman L. Random forests. Mach Learn. 2001;45:5–32. [Google Scholar]
- 65.Díaz-Uriarte R, de Andrés SA. Gene selection and classification of microarray data using random forest. BMC Bioinform. 2006;7:3. [DOI] [PMC free article] [PubMed] [Google Scholar]
- 66.Liaw A, Wiener M. Classification and regression by randomForest. R News. 2022;2:18–22. [Google Scholar]
- 67.Ishwaran H, Kogalur UB, Gorodeski EZ, Minn AJ, Lauer MS. High-dimensional variable selection for survival data. J Am Stat Assoc. 2010;105:205–17. [Google Scholar]
- 68.Grau J, Grosse I, Keilwagen J. PRROC: computing and visualizing precision-recall and receiver operating characteristic curves in R. Bioinformatics. 2015;31:2595–7. [DOI] [PMC free article] [PubMed] [Google Scholar]
- 69.Subramanian A, Tamayo P, Mootha VK, Mukherjee S, Ebert BL, Gillette MA, et al. Gene set enrichment analysis: a knowledge-based approach for interpreting genome-wide expression profiles. Proc Natl Acad Sci. 2005;102:15545–50. [DOI] [PMC free article] [PubMed] [Google Scholar]
- 70.Lo Surdo P, Calderone A, Cesareni G, Perfetto L. SIGNOR: a database of causal relationships between biological entities—a short guide to searching and browsing. Curr Protoc Bioinform. 2017;58. [DOI] [PubMed]
- 71.Shannon P, Markiel A, Ozier O, Baliga NS, Wang JT, Ramage D, et al. Cytoscape: a software environment for integrated models of biomolecular interaction networks. Genome Res. 2003;13:2498–504. [DOI] [PMC free article] [PubMed] [Google Scholar]
- 72.Freshour SL, Kiwala S, Cotto KC, Coffman AC, McMichael JF, Song JJ, et al. Integration of the drug-gene interaction database (DGIdb 4.0) with open crowdsource efforts. Nucl Acids Res. 2021;49:D1144–51. [DOI] [PMC free article] [PubMed] [Google Scholar]
- 73.Corsello SM, Bittker JA, Liu Z, Gould J, McCarren P, Hirschman JE, et al. The Drug Repurposing Hub: a next-generation drug library and information resource. Nature Publishing Group [Internet]. 2017 [cited 2024 Jul 13]; Available from: www.broadinstitute.org/repurposing [DOI] [PMC free article] [PubMed]
- 74.Shi L, Shi L, Reid LH, Jones WD, Shippy R, Warrington JA, et al. The MicroArray Quality Control (MAQC) project shows inter- and intraplatform reproducibility of gene expression measurements. Nat Biotechnol. 2006;24:1151–61. [DOI] [PMC free article] [PubMed] [Google Scholar]
- 75.Barral-Arca R, Pardo-Seco J, Bello X, Martinón-Torres F, Salas A. Ancestry patterns inferred from massive RNA-seq data. RNA. 2019;25:857–68. [DOI] [PMC free article] [PubMed] [Google Scholar]
- 76.Cattaneo A, Gennarelli M, Uher R, Breen G, Farmer A, Aitchison KJ, et al. Candidate genes expression profile associated with antidepressants response in the GENDEP study: differentiating between Baseline ‘predictors’ and longitudinal ‘targets.’ Neuropsychopharmacology. 2013;38:377–85. [DOI] [PMC free article] [PubMed] [Google Scholar]
- 77.Rizavi HS, Ren X, Zhang H, Bhaumik R, Pandey GN. Abnormal gene expression of proinflammatory cytokines and their membrane-bound receptors in the lymphocytes of depressed patients. Psychiatry Res. 2016;240:314–20. [DOI] [PMC free article] [PubMed] [Google Scholar]
- 78.Castrén E, Rantamäki T. The role of BDNF and its receptors in depression and antidepressant drug action: reactivation of developmental plasticity. Dev Neurobiol. 2010;70:289–97. [DOI] [PubMed] [Google Scholar]
- 79.Cattaneo A, Ferrari C, Turner L, Mariani N, Enache D, Hastings C, et al. Whole-blood expression of inflammasome- and glucocorticoid-related mRNAs correctly separates treatment-resistant depressed patients from drug-free and responsive patients in the BIODEP study. Transl Psychiatry. 2020;10:232. [DOI] [PMC free article] [PubMed] [Google Scholar]
- 80.Singh D, Guest PC, Dobrowolny H, Vasilevska V, Meyer-Lotz G, Bernstein H-G, et al. Changes in leukocytes and CRP in different stages of major depression. J Neuroinflammation. 2022;19:74. [DOI] [PMC free article] [PubMed] [Google Scholar]
- 81.Aydin Sunbul E, Sunbul M, Yanartas O, Cengiz F, Bozbay M, Sari I, et al. Increased neutrophil/lymphocyte ratio in patients with depression is correlated with the severity of depression and cardiovascular risk factors. Psychiatry Investig. 2016;13:121–6. [DOI] [PMC free article] [PubMed] [Google Scholar]
- 82.Demir S, Atli A, Bulut M, İbiloğlu AO, Güneş M, Kaya MC, et al. Neutrophil-lymphocyte ratio in patients with major depressive disorder undergoing no pharmacological therapy. Neuropsychiatr Dis Treat. 2015;11:2253–8. [DOI] [PMC free article] [PubMed] [Google Scholar]
- 83.Feng J, Lu X, Li H, Wang S. High neutrophil-to-lymphocyte ratio is a significant predictor of depressive symptoms in maintenance hemodialysis patients: a cross-sectional study. BMC Psychiatry. 2022;22:313. [DOI] [PMC free article] [PubMed] [Google Scholar]
- 84.Andersen BL, Myers J, Blevins T, Park KR, Smith RM, Reisinger S, et al. Depression in association with neutrophil-to-lymphocyte, platelet-to-lymphocyte, and advanced lung cancer inflammation index biomarkers predicting lung cancer survival. PLoS ONE. 2023;18: e0282206. [DOI] [PMC free article] [PubMed] [Google Scholar]
- 85.Hepgul N, Cattaneo A, Agarwal K, Baraldi S, Borsini A, Bufalino C, et al. Transcriptomics in interferon-α-treated patients identifies inflammation-, neuroplasticity- and oxidative stress-related signatures as predictors and correlates of depression. Neuropsychopharmacology. 2016;41:2502–11. [DOI] [PMC free article] [PubMed] [Google Scholar]
- 86.Daria S, Proma MA, Shahriar M, Islam SMA, Bhuiyan MA, Islam MdR. Serum interferon-gamma level is associated with drug-naïve major depressive disorder. SAGE Open Med. 2020;8:205031212097416. [DOI] [PMC free article] [PubMed]
- 87.Cattane N, Räikkönen K, Anniverno R, Mencacci C, Riva MA, Pariante CM, et al. Depression, obesity and their comorbidity during pregnancy: effects on the offspring’s mental and physical health. Mol Psychiatry. 2021;26:462–81. [DOI] [PMC free article] [PubMed] [Google Scholar]
- 88.Semeia L, Bauer I, Sippel K, Hartkopf J, Schaal NK, Preissl H. Impact of maternal emotional state during pregnancy on fetal heart rate variability. Compr Psychoneuroendocrinol. 2023;14: 100181. [DOI] [PMC free article] [PubMed] [Google Scholar]
- 89.Grote NK, Bridge JA, Gavin AR, Melville JL, Iyengar S, Katon WJ. A meta-analysis of depression during pregnancy and the risk of preterm birth, low birth weight, and intrauterine growth restriction. Arch Gen Psychiatry. 2010;67:1012. [DOI] [PMC free article] [PubMed] [Google Scholar]
- 90.Ackerman‐Banks CM, Lipkind HS, Palmsten K, Pfeiffer M, Gelsinger C, Ahrens KA. Association of prenatal depression with new cardiovascular disease within 24 months postpartum. J Am Heart Assoc. 2023;12. [DOI] [PMC free article] [PubMed]
- 91.Heun-Johnson H, Levitt P. Differential impact of Met receptor gene interaction with early-life stress on neuronal morphology and behavior in mice. Neurobiol Stress. 2018;8:10–20. [DOI] [PMC free article] [PubMed] [Google Scholar]
- 92.Zhao M, Wang W, Jiang Z, Zhu Z, Liu D, Pan F. Long-term effect of post-traumatic stress in adolescence on dendrite development and H3K9me2/BDNF expression in male rat hippocampus and prefrontal cortex. Front Cell Dev Biol. 2020;8. [DOI] [PMC free article] [PubMed]
- 93.Kaul D, Smith CC, Stevens J, Fröhlich AS, Binder EB, Mechawar N, et al. Severe childhood and adulthood stress associates with neocortical layer-specific reductions of mature spines in psychiatric disorders. Neurobiol Stress. 2020;13: 100270. [DOI] [PMC free article] [PubMed] [Google Scholar]
- 94.Joëls M, Pu Z, Wiegert O, Oitzl MS, Krugers HJ. Learning under stress: how does it work? Trends Cogn Sci. 2006;10:152–8. [DOI] [PubMed] [Google Scholar]
- 95.Yang K, Wu J, Li S, Wang S, Zhang J, Wang Y, et al. NTRK1 knockdown induces mouse cognitive impairment and hippocampal neuronal damage through mitophagy suppression via inactivating the AMPK/ULK1/FUNDC1 pathway. Cell Death Discov. 2023;9:404. [DOI] [PMC free article] [PubMed] [Google Scholar]
- 96.Klimaschewski L, Claus P. Fibroblast growth factor signalling in the diseased nervous system. Mol Neurobiol. 2021;58:3884–902. [DOI] [PMC free article] [PubMed] [Google Scholar]
- 97.Zhang Q, Chen Z, Zhang K, Zhu J, Jin T. FGF/FGFR system in the central nervous system demyelinating disease: recent progress and implications for multiple sclerosis. CNS Neurosci Ther. 2023;29:1497–511. [DOI] [PMC free article] [PubMed] [Google Scholar]
- 98.Sherin JE, Nemeroff CB. Post-traumatic stress disorder: the neurobiological impact of psychological trauma. Dialog Clin Neurosci. 2011;13:263–78. [DOI] [PMC free article] [PubMed] [Google Scholar]
- 99.Aliev G, Beeraka NM, Nikolenko VN, Svistunov AA, Rozhnova T, Kostyuk S, et al. Neurophysiology and psychopathology underlying PTSD and recent insights into the PTSD therapies—a comprehensive review. J Clin Med. 2020;9:2951. [DOI] [PMC free article] [PubMed] [Google Scholar]
- 100.Nakajima K, Miranda A, Craig DW, Shekhtman T, Kmoch S, Bleyer A, et al. Ntrk1 mutation co-segregating with bipolar disorder and inherited kidney disease in a multiplex family causes defects in neuronal growth and depression-like behavior in mice. Transl Psychiatry. 2020;10:407. [DOI] [PMC free article] [PubMed] [Google Scholar]
- 101.Evans SJ, Choudary PV, Neal CR, Li JZ, Vawter MP, Tomita H, et al. Dysregulation of the fibroblast growth factor system in major depression. Proc Natl Acad Sci. 2004;101:15506–11. [DOI] [PMC free article] [PubMed] [Google Scholar]
- 102.Prajapati SK, Krishnamurthy S. Non-selective orexin-receptor antagonist attenuates stress-re-stress-induced core PTSD-like symptoms in rats: Behavioural and neurochemical analyses. Behav Brain Res. 2021;399: 113015. [DOI] [PubMed] [Google Scholar]
- 103.Liu S, Wang N, Long Y, Wu Z, Zhou S. Zinc homeostasis: an emerging therapeutic target for neuroinflammation related diseases. Biomolecules. 2023;13:416. [DOI] [PMC free article] [PubMed] [Google Scholar]
- 104.Piao M, Cong X, Lu Y, Feng C, Ge P. The role of zinc in mood disorders. Neuropsychiatry. 2018;07.
- 105.Shi Y-X. Single-prolonged stress induces increased phosphorylation of extracellular signal-regulated kinase in a rat model of post-traumatic stress disorder. Mol Med Rep. 2011;4(3):445–9. [DOI] [PubMed] [Google Scholar]
- 106.Xiang M, Jiang Y, Hu Z, Yang Y, Botchway BOA, Fang M. Stimulation of anxiety-like behavior via ERK pathway by competitive serotonin receptors 2A and 1A in post-traumatic stress disordered mice. Neurosignals. 2017;25:39–53. [DOI] [PubMed] [Google Scholar]
- 107.Muhie S, Gautam A, Yang R, Misganaw B, Daigle BJ, Mellon SH, et al. Molecular signatures of post-traumatic stress disorder in war-zone-exposed veteran and active-duty soldiers. Cell Rep Med. 2023;4: 101045. [DOI] [PMC free article] [PubMed] [Google Scholar]
- 108.Hatting M, Tavares CDJ, Sharabi K, Rines AK, Puigserver P. Insulin regulation of gluconeogenesis. Ann N Y Acad Sci. 2018;1411:21–35. [DOI] [PMC free article] [PubMed] [Google Scholar]
- 109.Gerich JE, Nurjhan N. Gluconeogenesis in Type 2 Diabetes. 1993. p. 253–8. [DOI] [PubMed]
- 110.Jiang S, Young J, Wang K, Qian Y, Cai L. Diabetic-induced alterations in hepatic glucose and lipid metabolism: the role of type 1 and type 2 diabetes mellitus (Review). Mol Med Rep. 2020;22:603–11. [DOI] [PMC free article] [PubMed] [Google Scholar]
- 111.Halperin D, Reber G. Influence of antidepressants on hemostasis. Dialog Clin Neurosci. 2007;9:47–59. [DOI] [PMC free article] [PubMed] [Google Scholar]
- 112.Quinn GR, Hellkamp AS, Hankey GJ, Becker RC, Berkowitz SD, Breithardt G, et al. Selective serotonin reuptake inhibitors and bleeding risk in anticoagulated patients with atrial fibrillation: an analysis from the ROCKET AF trial. J Am Heart Assoc. 2018;7. [DOI] [PMC free article] [PubMed]
- 113.Hallbäck I, Hägg S, Eriksson AC, Whiss PA. In vitro effects of serotonin and noradrenaline reuptake inhibitors on human platelet adhesion and coagulation. Pharmacol Rep. 2012;64:979–83. [DOI] [PubMed] [Google Scholar]
- 114.Carlsten C, Brauer M, Brinkman F, Brook J, Daley D, McNagny K, et al. Genes, the environment and personalized medicine. EMBO Rep. 2014;15:736–9. [DOI] [PMC free article] [PubMed] [Google Scholar]
- 115.Green S, Carusi A, Hoeyer K. Plastic diagnostics: The remaking of disease and evidence in personalized medicine. Soc Sci Med. 2022;304: 112318. [DOI] [PMC free article] [PubMed] [Google Scholar]
- 116.Lu H, Huang H. FOXO1: a potential target for human diseases. Curr Drug Targets. 2011;12:1235–44. [DOI] [PMC free article] [PubMed] [Google Scholar]
- 117.Calissi G, Lam EW-F, Link W. Therapeutic strategies targeting FOXO transcription factors. Nat Rev Drug Discov. 2021;20:21–38. [DOI] [PubMed] [Google Scholar]
- 118.Rana T, Behl T, Sehgal A, Mehta V, Singh S, Sharma N, et al. Elucidating the possible role of FoxO in depression. Neurochem Res. 2021;46:2761–75. [DOI] [PubMed] [Google Scholar]
- 119.Polter A, Yang S, Zmijewska AA, van Groen T, Paik J-H, DePinho RA, et al. Forkhead box, class O transcription factors in brain: regulation and behavioral manifestation. Biol Psychiatry. 2009;65:150–9. [DOI] [PMC free article] [PubMed] [Google Scholar]
- 120.Kim AH, Reimers M, Maher B, Williamson V, McMichael O, McClay JL, et al. MicroRNA expression profiling in the prefrontal cortex of individuals affected with schizophrenia and bipolar disorders. Schizophr Res. 2010;124:183–91. [DOI] [PMC free article] [PubMed] [Google Scholar]
- 121.Martins-de-Souza D, Guest PC, Mann DM, Roeber S, Rahmoune H, Bauder C, et al. Proteomic analysis identifies dysfunction in cellular transport, energy, and protein metabolism in different brain regions of atypical frontotemporal lobar degeneration. J Proteome Res. 2012;11:2533–43. [DOI] [PubMed] [Google Scholar]
- 122.Cuccurullo C, Miele G, Piccolo G, Bilo L, Accogli A, D’Amico A, et al. Hydranencephaly in CENPJ-related Seckel syndrome. Eur J Med Genet. 2022;65: 104659. [DOI] [PubMed] [Google Scholar]
- 123.Ding W, Wu Q, Sun L, Pan NC, Wang X. Cenpj regulates cilia disassembly and neurogenesis in the developing mouse cortex. J Neurosci. 2019;39:1994–2010. [DOI] [PMC free article] [PubMed] [Google Scholar]
- 124.Drago A, Giegling I, Schäfer M, Hartmann AM, Konte B, Friedl M, et al. Genome-wide association study supports the role of the immunological system and of the neurodevelopmental processes in response to haloperidol treatment. Pharmacogenet Genom. 2014;24:314–9. [DOI] [PubMed] [Google Scholar]
- 125.Porcelli S, Crisafulli C, Calabrò M, Serretti A, Rujescu D. Possible biomarkers modulating haloperidol efficacy and/or tolerability. Pharmacogenomics. 2016;17:507–29. [DOI] [PubMed] [Google Scholar]
- 126.Jiang F, Shi Y, Wang Y, Ge C, Zhu J, Fang H, et al. Characterization of SHCBP1 to prognosis and immunological landscape in pan-cancer: novel insights to biomarker and therapeutic targets. Aging. 2023;15:2066–81. [DOI] [PMC free article] [PubMed] [Google Scholar]
- 127.Zhou M, Duan L, Chen J, Li Y, Yin Z, Song S, et al. The dynamic role of nucleoprotein SHCBP1 in the cancer cell cycle and its potential as a synergistic target for DNA-damaging agents in cancer therapy. Cell Commun Signal. 2024;22:131. [DOI] [PMC free article] [PubMed] [Google Scholar]
- 128.Li C, Pu B, Gu L, Zhang M, Shen H, Yuan Y, et al. Identification of key modules and hub genes in glioblastoma multiforme based on co-expression network analysis. FEBS Open Bio. 2021;11:833–50. [DOI] [PMC free article] [PubMed] [Google Scholar]
- 129.Zhou Y, Tan Z, Chen K, Wu W, Zhu J, Wu G, et al. Overexpression of SHCBP1 promotes migration and invasion in gliomas by activating the NF-κB signaling pathway. Mol Carcinog. 2018;57:1181–90. [DOI] [PubMed] [Google Scholar]
- 130.Guo X, Tian S, Cao P, Xie Y, Dong W. High expression of PIGC predicts unfavorable survival in hepatocellular carcinoma. J Hepatocell Carcinoma. 2021;8:211–22. [DOI] [PMC free article] [PubMed] [Google Scholar]
- 131.Zhao Q, Shen C, Wei J, Zhao C. Phosphatidylinositol glycan anchor biosynthesis, class C is a prognostic biomarker and correlates with immune infiltrates in hepatocellular carcinoma. Front Genet. 2022;13. [DOI] [PMC free article] [PubMed]
- 132.Edvardson S, Murakami Y, Nguyen TTM, Shahrour M, St-Denis A, Shaag A, et al. Mutations in the phosphatidylinositol glycan C ( PIGC ) gene are associated with epilepsy and intellectual disability. J Med Genet. 2017;54:196–201. [DOI] [PubMed] [Google Scholar]
- 133.Guan L, Zhao X, Tang L, Chen J, Zhao J, Guo M, et al. Thyroid transcription factor-1: structure, expression, function and its relationship with disease. Biomed Res Int. 2021;2021:1–10. [DOI] [PMC free article] [PubMed] [Google Scholar]
- 134.Verset L. TTF-1 positive small cell cancers: Don’t think they’re always primary pulmonary! World J Gastrointest Oncol. 2011;3:144. [DOI] [PMC free article] [PubMed] [Google Scholar]
- 135.Takanashi Y, Tajima S, Hayakawa T, Neyatani H, Funai K. KRAS mutation-positive bronchial surface epithelium (BSE)-type lung adenocarcinoma with strong expression of TTF-1: a case providing a further insight as for the role of TTF-1 in the oncogenesis. Int J Clin Exp Pathol. 2015;8:15338–43. [PMC free article] [PubMed] [Google Scholar]
- 136.Runkle EA, Rice SJ, Qi J, Masser D, Antonetti DA, Winslow MM, et al. Occludin is a direct target of thyroid transcription factor-1 (TTF-1/NKX2–1). J Biol Chem. 2012;287:28790–801. [DOI] [PMC free article] [PubMed] [Google Scholar]
- 137.Velten J, Lavallee KL, Scholten S, Meyer AH, Zhang X-C, Schneider S, et al. Lifestyle choices and mental health: a representative population survey. BMC Psychol. 2014;2:58. [DOI] [PMC free article] [PubMed] [Google Scholar]
- 138.Farhud DD. Impact of Lifestyle on Health. Iran J Public Health. 2015;44:1442–4. [PMC free article] [PubMed] [Google Scholar]
- 139.Velten J, Bieda A, Scholten S, Wannemüller A, Margraf J. Lifestyle choices and mental health: a longitudinal survey with German and Chinese students. BMC Public Health. 2018;18:632. [DOI] [PMC free article] [PubMed] [Google Scholar]
- 140.Hautekiet P, Saenen ND, Martens DS, Debay M, Van der Heyden J, Nawrot TS, et al. A healthy lifestyle is positively associated with mental health and well-being and core markers in ageing. BMC Med. 2022;20:328. [DOI] [PMC free article] [PubMed] [Google Scholar]
- 141.Yang X, Yang G, Chu J. The neural metric factorization for computational drug repositioning. IEEE/ACM Trans Comput Biol Bioinform. 2023;20:731–41. [DOI] [PubMed] [Google Scholar]
- 142.Rapicavoli RV, Alaimo S, Ferro A, Pulvirenti A. Computational Methods for Drug Repurposing. 2022. p. 119–41. [DOI] [PubMed]
- 143.Ong K, Ng K-W, Haw S-C. Neural matrix factorization++ based recommendation system. F1000Res. 2021;10:1079. [DOI] [PMC free article] [PubMed] [Google Scholar]
- 144.Yang X, Zamit L, Liu Y, He J. Additional neural matrix factorization model for computational drug repositioning. BMC Bioinform. 2019;20:423. [DOI] [PMC free article] [PubMed] [Google Scholar]
- 145.Mariappan R, Jayagopal A, Sien HZ, Rajan V. Neural collective matrix factorization for integrated analysis of heterogeneous biomedical data. Bioinformatics. 2022;38:4554–61. [DOI] [PubMed] [Google Scholar]
- 146.Yang X, Yang G, Chu J. Self-supervised learning for label sparsity in computational drug repositioning. IEEE/ACM Trans Comput Biol Bioinform. 2023;20:3245–56. [DOI] [PubMed] [Google Scholar]
- 147.Yang X, Yang G, Chu J. GraphCL-DTA: a graph contrastive learning with molecular semantics for drug-target binding affinity prediction. IEEE J Biomed Health Inform. 2024;28:4544–52. [DOI] [PubMed] [Google Scholar]
- 148.Zhu GH, Wong BCY, Ching CK, Lai KC, Lam S-K. Differential apoptosis by indomethacin in gastric epithelial cells through the constitutive expression of wild-type p53 and/or up-regulation of c-myc. Biochem Pharmacol. 1999;58:193–200. [DOI] [PubMed] [Google Scholar]
- 149.Wilson AJ, Velcich A, Arango D, Kurland AR, Shenoy SM, Pezo RC, et al. Novel detection and differential utilization of a c-myc transcriptional block in colon cancer chemoprevention. Cancer Res. 2002;62:6006–10. [PubMed] [Google Scholar]
- 150.Jarvis MF, Scott VE, McGaraughty S, Chu KL, Xu J, Niforatos W, et al. A peripherally acting, selective T-type calcium channel blocker, ABT-639, effectively reduces nociceptive and neuropathic pain in rats. Biochem Pharmacol. 2014;89:536–44. [DOI] [PubMed] [Google Scholar]
- 151.Munikishore R, Liu R, Zhang S, Zhao Q-S, Nian Y, Zuo Z. Structurally modified Cyclovirobuxine-D Buxus alkaloids as effective analgesic agents through Cav32 T-Type calcium channel inhibition. Bioorg Chem. 2023;135:106493. [DOI] [PubMed] [Google Scholar]
- 152.Antunes FTT, Huang S, Chen L, Zamponi GW. Effect of ABT-639 on Cav3.2 channel activity and its analgesic actions in mouse models of inflammatory and neuropathic pain. Eur J Pharmacol. 2024;967:176416. [DOI] [PubMed] [Google Scholar]
- 153.Wang S, Dunlap TL, Howell CE, Mbachu OC, Rue EA, Phansalkar R, et al. Hop (Humulus lupulus L.) Extract and 6-prenylnaringenin induce P450 1A1 catalyzed estrogen 2-hydroxylation. Chem Res Toxicol. 2016;29:1142–50. [DOI] [PMC free article] [PubMed] [Google Scholar]
- 154.Karim N, Jia Z, Zheng X, Cui S, Chen W. A recent review of citrus flavanone naringenin on metabolic diseases and its potential sources for high yield-production. Trends Food Sci Technol. 2018;79:35–54. [Google Scholar]
- 155.Salehi B, Fokou PVT, Sharifi-Rad M, Zucca P, Pezzani R, Martins N, et al. The therapeutic potential of Naringenin: a review of clinical trials. Pharmaceuticals (Basel). 2019;12. [DOI] [PMC free article] [PubMed]
- 156.Trachtman JN. Post-traumatic stress disorder and vision. Optomet J Am Optomet Assoc. 2010;81:240–52. [DOI] [PubMed] [Google Scholar]
- 157.van der Ham AJ, van der Aa HP, Brunes A, Heir T, de Vries R, van Rens GH, et al. The development of posttraumatic stress disorder in individuals with visual impairment: a systematic search and review. Ophthalmic Physiol Opt. 2021;41:331–41. [DOI] [PMC free article] [PubMed] [Google Scholar]
- 158.Freund KB, Mrejen S, Gallego-Pinazo R. An update on the pharmacotherapy of neovascular age-related macular degeneration. Expert Opin Pharmacother. 2013;14:1017–28. [DOI] [PubMed] [Google Scholar]
- 159.Van Bergen T, Etienne I, Cunningham F, Moons L, Schlingemann RO, Feyen JHM, et al. The role of placental growth factor (PlGF) and its receptor system in retinal vascular diseases. Prog Retin Eye Res. 2019;69:116–36. [DOI] [PubMed] [Google Scholar]
- 160.Suarez-Almazor ME, Spooner C, Belseck E. Penicillamine for rheumatoid arthritis. Cochrane Database Syst Rev. 2000;2000:CD001460. [DOI] [PMC free article] [PubMed] [Google Scholar]
- 161.Munro R, Capell HA. Penicillamine. Br J Rheumatol. 1997;36:104–9. [DOI] [PubMed] [Google Scholar]
- 162.Vallerand IA, Patten SB, Barnabe C. Depression and the risk of rheumatoid arthritis. Curr Opin Rheumatol. 2019;31:279–84. [DOI] [PMC free article] [PubMed] [Google Scholar]
- 163.Ng CYH, Tay SH, McIntyre RS, Ho R, Tam WWS, Ho CSH. Elucidating a bidirectional association between rheumatoid arthritis and depression: a systematic review and meta-analysis. J Affect Disord. 2022;311:407–15. [DOI] [PubMed] [Google Scholar]
- 164.Brent DA, Crumrine PK, Varma R, Brown RV, Allan MJ. Phenobarbital treatment and major depressive disorder in children with epilepsy: a naturalistic follow-up. Pediatrics. 1990;85:1086–91. [PubMed] [Google Scholar]
- 165.Schmitz B. Depression and mania in patients with epilepsy. Epilepsia. 2005;46:45–9. [DOI] [PubMed] [Google Scholar]
Associated Data
This section collects any data citations, data availability statements, or supplementary materials included in this article.
Supplementary Materials
Data Availability Statement
All the data analyzed during this study are included in this published article [found in its supplementary information Additional file two].