

ABSTRACT
Increasing demand for recombinant adeno‐associated virus (rAAV)‐based gene therapies necessitates increased manufacturing production. Transient transfection of mammalian cells remains the most commonly used method to produce clinical‐grade rAAVs due to its ease of implementation. However, transient transfection processes are often characterized by suboptimal yields and low fractions of full‐to‐total capsids, both of which contribute to the high cost of goods of many rAAV‐based gene therapies. Our previously developed mechanistic model for rAAV2/5 production indicated that the inadequate capsid filling is due to a temporal misalignment between viral DNA replication and capsid synthesis within the cells and the repression of later phase capsid formation by Rep proteins. We experimentally validated this prediction and showed that performing multiple, time‐separated doses of plasmid increases the production of rAAV. In this study, we use the insights generated by our mechanistic model to develop an intensified process for rAAV production that combines perfusion with high cell density re‐transfection. We demonstrate that performing multiple, time‐separated doses at high cell density boosts both cell‐specific and volumetric productivity and improves plasmid utilization when compared to a single bolus at standard operating conditions. Our results establish a new paradigm for continuously manufacturing rAAV via transient transfection that improves productivity and reduces manufacturing costs.
Keywords: adeno‐associated virus, continuous manufacturing, gene therapy, mechanistic modeling, transfection
1. Introduction
Adeno‐associated virus (AAV) is a non‐enveloped, single‐stranded DNA virus that infects both humans and primate species (Wang et al. 2019). Replication‐incompetent recombinant AAV (rAAV) is the most commonly used viral vector for in vivo gene therapy due to its non‐pathogenicity, broad tissue tropism, and ability to transduce both dividing and non‐dividing cells (Naso et al. 2017; Wang et al. 2019; Li and Samulski 2020). rAAV‐based therapeutics were the first gene therapy treatments approved in both the United States (Smalley 2017) and European Union (Moran 2012) and are currently being studied in over 200 active clinical trials worldwide (ClinicalTrials.gov 2022). The pace of rAAV‐based gene therapies entering the market is expected to continue to grow (ClinicalTrials.gov 2022; Evaluate Pharma 2022), with three of the five US‐approved rAAV‐based gene therapies receiving regulatory clearance in 2022 and 2023. This growing pipeline of clinical and commercial development, coupled with the considerable production requirements for diseases characterized by large patient populations (e.g., Sickle Cell) or high doses per patient (e.g., Duchenne Muscular Dystrophy), drives the need for intensified rAAV manufacturing processes (Sha et al. 2021; Fu et al. 2023).
A variety of cell culture‐based methods have been developed for rAAV production (Sha et al. 2021). Of these, the transient transfection of human kidney embryo (HEK) 293 cells with multiple plasmids remains the most widely used to produce clinical material (Clément and Grieger 2016). Transient transfection systems offer several advantages that make them advantageous for early development, including rapid setup and flexible operation. However, only a small fraction of the crude harvest produced by transient transfection systems contains the therapeutic transgene, typically between 1% and 30% (Gimpel et al. 2021). Removing empty capsids from the crude harvest is difficult because of their structural similarity to capsids containing the transgene, leading to costly separations that require additional process development based on serotype (Wright 2014; Gimpel et al. 2021). In addition, the upstream productivity of state‐of‐the‐art transient transfection systems lags that of the main production alternative, baculovirus infection of Sf9 insect cells, often by an order of magnitude or more (Liu et al. 2024).
Upstream process intensification techniques such as continuous perfusion and high cell density culture are frequently used to manufacture legacy biopharmaceuticals such as monoclonal antibodies (Chen et al. 2018; Konstantinov and Cooney 2015). Nonetheless, the application of these techniques to transient rAAV production is still nascent. Recently, (Mendes et al. 2022) demonstrated improved cell‐specific rAAV titers in perfusion operation when compared to batch. The rAAV titer per cell decreased by ~65% when the cell density was increased from to , implicating the high cell density effect, which is a blanket term used to describe the phenomenon of decreased cell‐specific productivity at increased cell density in transient transfection systems (Lavado‐García et al. 2022). The high cell density effect was further interrogated by (Moço et al. 2023), who showed that media supplementation could rectify the decrease in measured full capsids at high cell density but that the functional titer remained lower.
Our previously published mechanistic model of a transient rAAV batch culture suggested that the accumulation of cell debris and toxic byproducts limits rAAV production and that dosing plasmids at multiple time points can extend the productive window and boost volumetric productivity (Srinivasan et al. 2024). This strategy of re‐transfection had been previously demonstrated for recombinant protein and virus‐like‐particle production (Cervera et al. 2015; Lavado‐García et al. 2020). However, re‐transfection in previous studies has not demonstrated increased recovery of transfected cells percentage or leveraged the potentials of the high cell density that a perfusion system can maintain; the approach also has not been applied to more complex systems involving multiple plasmids dosing such as triple transfection for rAAV production.
In this study, we develop and demonstrate an intensified process for transient rAAV production that combines perfusion with re‐transfection performed at high cell density. We use our previously developed mechanistic model (Nguyen et al. 2021; Srinivasan et al. 2024) to guide plasmid dose timing and dosage levels, observing improved production and plasmid utilization at high cell density when the plasmid dose per cell was administered over multiple time‐separated boluses. With modifications to a limited subset of parameters, the kinetic model maintains predictability of measured cellular and protein states, empowering its continued use as an effective process development tool.
2. Results
2.1. Development of Perfusion System for Extended Production of rAAV and Model‐Guided Re‐Transfection Strategy
A schematic of the perfusion bioreactor system used in this experiment is shown in Figure 1A and the laboratory setup is shown in Supporting Information S1: Figure S1. During operation the harvest flow was filtered through a tangential flow filtration system, which allows the rAAV to pass through while retaining the cells in the bioreactor. The tangential flow filtration system, referred to as a Viral Harvest Unit (VHU), has been shown to be effective for viral vector harvesting (Hein et al. 2023). Cell culture containing both cells and rAAV was occasionally removed via the bleed flow to maintain the culture cell density at a desired level. The system was controlled to maintain constant volume by adding fresh media at the same rate liquid was removed via the harvest and bleed flows. The rate of fresh media addition was maintained between 1 and 3 vvd for most of the culture. The experimental flow rates are plotted in Supporting Information S1: Figure S2.
Figure 1.
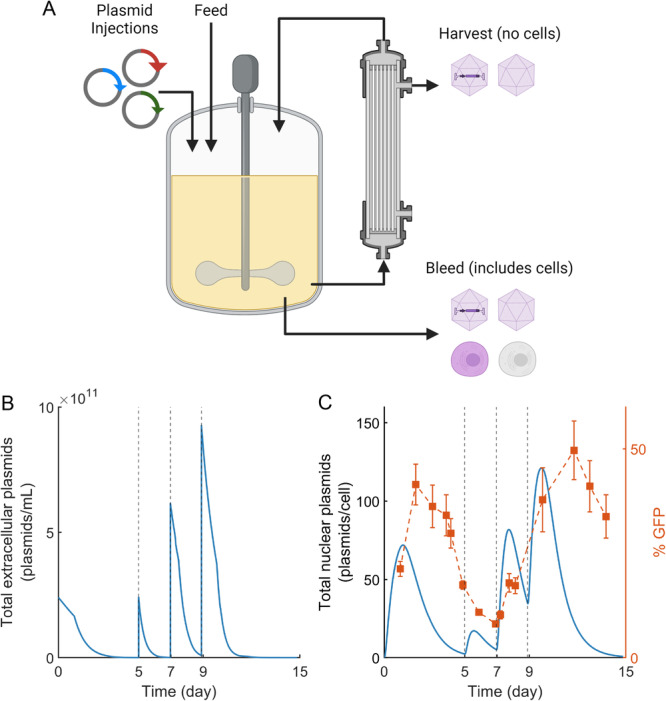
Model‐based re‐transfection. (A) Schematic of perfusion bioreactor system. The cell culture fluid is continuously circulated through the tangential flow filtration system, where full and empty capsids are removed via a harvest stream. A cell‐ and capsid‐containing bleed stream is periodically discharged to modulate the cell culture density. A feed flow consisting of fresh cell culture media was controlled to maintain a constant cell culture volume. Plasmids encoding for rAAV were dosed on days 0, 5, 7, and 9. (B) Model predictions of the total extracellular plasmid concentration (combined pAAV‐GFP, pRC5, and pHelper). Plasmids were added to the perfusion cell culture when the predicted total extracellular plasmid concentrations approached zero. (C) Model predictions of the concentration of total plasmids within cellular nuclei (blue, left axis) and experimental measurements of the percentage of cells expressing GFP (orange, right axis). In both plots the vertical dotted lines represent re‐transfection events. Error bars represent measurement SD.
HEK293 cells were transfected with plasmid (pAAV‐GFP, pRC5, and pHelper at a 1:1:1 molar ratio) on days 0, 5, 7, and 9 to produce rAAV2/5 pseudotype (AAV vectors with an AAV5 capsid and a genome containing AAV‐2 inverted terminal repeats) as outlined in Table 1. The initial transfection design at 0 h followed the conventional batch‐mode design in which of total plasmid was added to the cell culture at (Nguyen et al. 2021). Subsequent re‐transfections were performed at higher cell densities. Plasmid dosages and incubation periods—defined as the amount of time the perfusion system was shut off following plasmid addition—were manually set as in Table 1 to explore the experimental design space.
Table 1.
Re‐transfection perfusion cell culture experimental design. All plasmids were dosed in a 1:1:1 molar ratio of pAAV‐GFP:pRC5:pHelper.
| Transfection event | Time | Cell density | Plasmid concentration | Plasmid concentration | Plasmid incubation period |
|---|---|---|---|---|---|
| (#) | (day) | () | () | ( cells) | (h) |
| 1 | 0 | 1.1 | 2 | 2 | 24 |
| 2 | 5 | 4.7 | 2 | 0.43 | 0 |
| 3 | 7 | 5.1 | 5.1 | 1 | 12 |
| 9 | 7.6 | 7.6 | 1 | 24 |
Once these experimental inputs were established, the re‐transfection timing was determined using a previously developed mechanistic model for rAAV production (Srinivasan et al. 2024). We set the dosing timing as the time when the estimated extracellular plasmid concentration profiles reach zero (Figure 1B). The concentration of plasmids added on days 7 and 9 (1 g per cells) is half that added on day 0 (2 g per cells) and represents a split‐dose re‐transfection that we previously demonstrated boosted rAAV production (Srinivasan et al. 2024).
Figure 1C shows the transfection efficiency as measured by the percentage of cells expressing green fluorescent protein (GFP), which reaches a maximum of ~50% on day 12. The model‐predicted total plasmid concentration within the cell nucleus is also plotted in Figure 1C. The model predictions of nuclear plasmids map to the percentage of cells expressing GFP with a time delay of ~ day. This time delay can be attributed to the intracellular steps that need to occur between plasmids entering the cell nucleus and GFP being synthesized and measured above the limit of detection (e.g., transcription, translation, and maturation; Nguyen et al. 2021; Sokabe and Fraser 2019; Cervera et al. 2017). GFP remains in the cells even after its synthesis slows, leading to broad detection peaks that decrease as the proteins are degraded below detectable concentrations (Corish and Tyler‐Smith 1999).
2.2. Perfusion System Maintains High Cell Viability and Adequately Controls Metabolite Levels
Figures 2A,B show the cell density and viability during viral production. The viability was maintained at for much of the culture. The model accurately predicts the dynamics of cell growth and death in the re‐transfection scheme with the adjustment of three model parameters from our previously reported mechanistic model (Srinivasan et al. 2024). This model recalibration is reasonable given the differences in cell culture media and bioreactor conformation between studies, both of which have been shown to impact cell growth and death (Mendes et al. 2022; Walther et al. 2019). Kinetic parameter values are summarized in Table 2.
Figure 2.
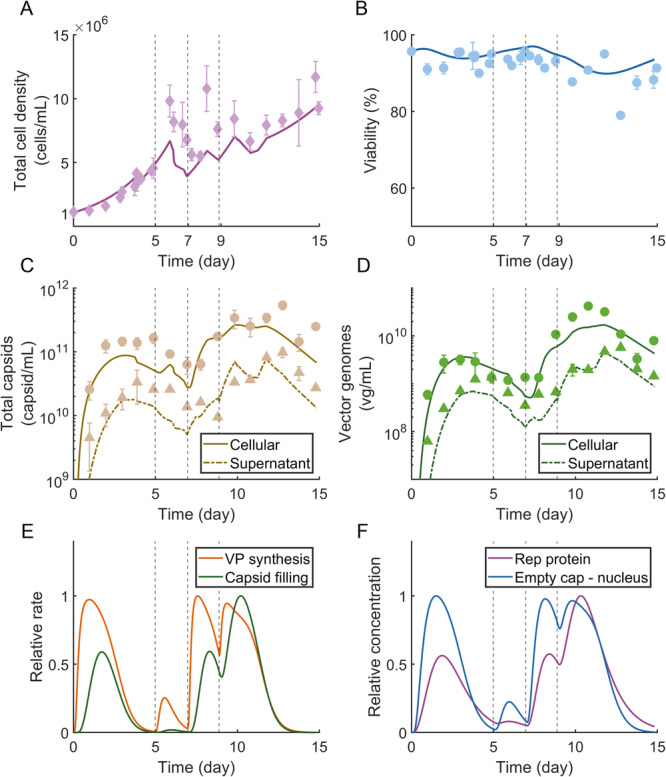
Mechanistic model predicts experimental dynamics. (A) Total cell density and (B) viability experimental measurements (markers) and model predictions (solid lines). Error bars represent measurement SD. (C) Total capsid and (D) vector genome experimental measurements (markers) and model predictions (solid lines). Total capsids were measured using ELISA and vector genomes (vg) were measured using ddPCR. Error bars represent measurement SD. (E) Relative viral protein (VP) synthesis rate per cell (Equation 15) and capsid filling rate per cell (Equation 18) as predicted by the kinetic model. Rates are relative to the relevant maximum rate predictions from the mechanistic model simulation. (F) Relative concentrations of Rep proteins per cell and empty capsids in the nucleus per cell as predicted by the kinetic model. Concentrations are relative to the relevant maximum concentrations predictions from the mechanistic model simulation. In all plots the vertical dotted lines represent re‐transfection events.
Table 2.
Model parameters.
| Parameter no. | Notation | Value | Confidence interval | Unit | Method | ||||
|---|---|---|---|---|---|---|---|---|---|
| 1 |
|
|
— |
|
Fixed to literature value (Srinivasan et al. 2024) | ||||
| 2 |
|
|
— |
|
Fixed to literature value (Srinivasan et al. 2024) | ||||
| 3 |
|
|
|
|
Fitted to cell growth data | ||||
| 4 |
|
|
() |
|
Fitted to cell growth data | ||||
| 5 |
|
|
— |
|
Fixed to literature value (Srinivasan et al. 2024) | ||||
| 6 |
|
|
|
|
Fitted to cell growth data | ||||
| 7 |
|
|
— |
|
Fixed to literature value (Srinivasan et al. 2024) | ||||
| 8 |
|
|
— | N/A | Fixed to literature value (Cervera et al. 2015) | ||||
| 9 |
|
|
— |
|
Fixed to literature value (McLean et al. 2009) | ||||
| 10 |
|
1.80 | — |
|
Fixed to literature value (Bishop et al. 2016) | ||||
| 11 |
|
|
— |
|
Fixed to literature value (Nguyen et al. 2021) | ||||
| 12 |
|
|
— |
|
Fixed to literature value (Srinivasan et al. 2024) | ||||
| 13 |
|
11.0 | — |
|
Fixed to literature value (Wang et al. 2021) | ||||
| 14 |
|
|
— |
|
Fixed to literature value (Srinivasan et al. 2024) | ||||
| 15 |
|
|
() |
|
Fitted to capsid data | ||||
| 16 |
|
|
— |
|
Fixed to literature value (Srinivasan et al. 2024) | ||||
| 17 |
|
|
— |
|
Fixed to literature value (Srinivasan et al. 2024) | ||||
| 18 |
|
|
— |
|
Fixed to literature value (Srinivasan et al. 2024) | ||||
| 19 |
|
5.15 | — |
|
Fixed to literature value (Srinivasan et al. 2024) | ||||
| 20 |
|
|
() |
|
Fitted to capsid data | ||||
| 21 |
|
|
— |
|
Fixed to literature value (Nguyen et al. 2021) | ||||
| 22 |
|
|
— |
|
Fixed to literature value (Nguyen et al. 2021; Dahari et al. 2007; Redemann et al. 1989; Schwake et al. 2010) | ||||
| 23 |
|
|
— |
|
Fixed to literature value (Yuan and Parrish 2001) | ||||
| 24 |
|
|
— |
|
Fixed to literature value (Grosse et al. 2017) | ||||
| 25 |
|
|
— |
|
Fixed to literature value (Srinivasan et al. 2024) | ||||
| 26 |
|
|
— |
|
Fixed to literature value (Srinivasan et al. 2024) | ||||
| 27 |
|
|
— |
|
Fixed to literature value (Srinivasan et al. 2024) |
Culture metabolites including glucose, glutamine, lactate, and ammonia were measured at least every 24 h. All metabolites were maintained at reasonable levels (Supporting Information S1: Figure S3). The glucose level dropped below on days 10 and 12. The day 10 drop occurred after the day 9 transfection when the perfusion flow was turned off for 24 h. Studies on transfection‐free cell culture demonstrate that low but non‐depleted glucose is not detrimental to cell growth (Siegwart et al. 1999). Lactate was maintained between 2 and and ammonia was maintained at approximately 1 mM for much of the culture.
2.3. Mechanistic Modeling Accurately Describes Capsid and Genome Titer Dynamics
The total capsid and vector genome (vg) titer inside and outside of the cells was quantified using ELISA and ddPCR, respectively. Figures 2C,D show the dynamic capsid and vector genome titer experimental data plotted with the mechanistic modeling predictions. The model accurately predicts the dynamics of capsid generation and filling in the re‐transfection scheme with the adjustment of two model parameters from the previously reported mechanistic model (Srinivasan et al. 2024) and a reformulation of the mathematical representation of capsid packing to the original representation (Nguyen et al. 2021). Again, this adjustment is reasonable given the differences in cell culture media and bioreactor conformation between studies, both of which have been shown to impact rAAV productivity and packaging (Grieger et al. 2016). Kinetic parameter values for the mechanistic model are summarized in Table 2.
The model‐predicted rate of viral protein (VP) synthesis per cell spikes between 12 and 24 h after plasmid dosing (Figure 2E, Equation 15). The predicted capsid filling rate per cell peaks later, between one and two days after plasmid dosing (Figure 2E, Equation 18). The rapid spike in VP synthesis rate mimics the reported kinetics of fed batch rAAV production (Nguyen et al. 2021) and can be explained by the decreasing concentration of nuclear plasmids (Figure 1C) and the downregulatory effects of Rep protein (Pereira et al. 1997; Trempe and Carter 1988; King 2001), the predicted intracellular concentration of which is shown in Figure 2F. Rep proteins and empty capsids within the nucleus are needed for capsid filling to occur (King 2001) and their predicted concentrations (Figure 2F) correspond accordingly with the predicted capsid filling rate per cell (Figure 2E).
2.4. Re‐Transfection and High Cell Density Transfection Boost Full Capsid Production
The accumulated capsid and vector genome titers are shown in Figure 3. These values are calculated using experimental measurements as detailed in Section 4.13 and represent the cumulative yield from the harvest and bleed lines as well as the total concentration in the bioreactor. The culture continuously produced full capsids for much of its run time. Throughout the run, there are significant concentrations of both total and full capsids in the bioreactor vessel as well as in the harvest and bleed streams. Most full capsid production occurred in the first two to three days after transfection and then plateaued (Figure 3B), which is consistent with the model‐predicted capsid filling rate, which peaked between one and two days after plasmid dosing before decreasing (Figure 2E).
Figure 3.
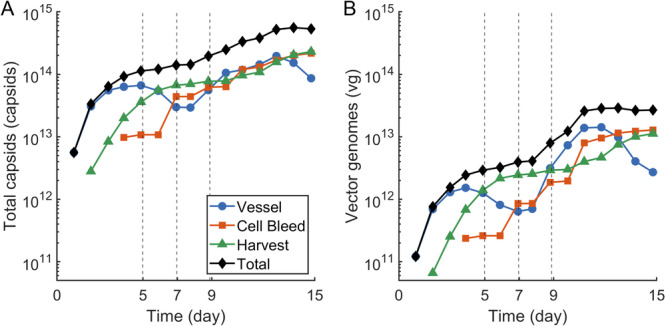
Extended production of total and full capsids. (A) The total capsid titer in the bioreactor vessel is plotted with the cumulative total capsid titer harvested in the cell bleed and harvest streams. (B) The vector genome titer in the bioreactor vessel is plotted with the cumulative vector genome titer harvested in the cell bleed and harvest streams. In both plots the black line represents the sum of all three product sources (vessel, cell bleed, harvest) and the vertical dotted lines represent re‐transfection events.
Next, we calculated the net yield of total capsids and vector genomes from the transfection events to better understand the impact of the various transfection strategies on capsid production and filling. Deconvoluting the production from the days 7 and 9 transfection events is difficult since the intracellular species do not approach zero between the plasmid doses (Figure 2F). For the reason above, and the fact that the days 7 and 9 plasmid doses (1 cells) represent a split dose of the day 0 dose (2 cells), the production from the days 7 and 9 transfections were combined for direct comparison. Transfection events, including the combined days 7 and 9 doses, are summarized in Table 1.
The net yield of total capsids produced by the transfection events are shown in Figure 4A. The first transfection produced roughly capsids, while the second transfection yielded only 20% as many total capsids as the first transfection. This low yield can be attributed to a combination of lower plasmid dosage per cell and minimal plasmid/cell incubation time, which resulted in low plasmid uptake by the cells as demonstrated by the model‐predicted nuclear plasmid concentration in Figure 1C. The third transfection event (representing the combined days 7 and 9 split doses) yielded 3.4‐fold more capsids as the first transfection event. This can be attributed to the larger transfection cell densities on days 7 and 9 since the cell‐specific productivity of total capsid is comparable between both transfection events (Figure 4B). The total capsids produced per g of plasmid added to the culture was larger for the first transfection than the second or third transfection events (Figure 4C).
Figure 4.
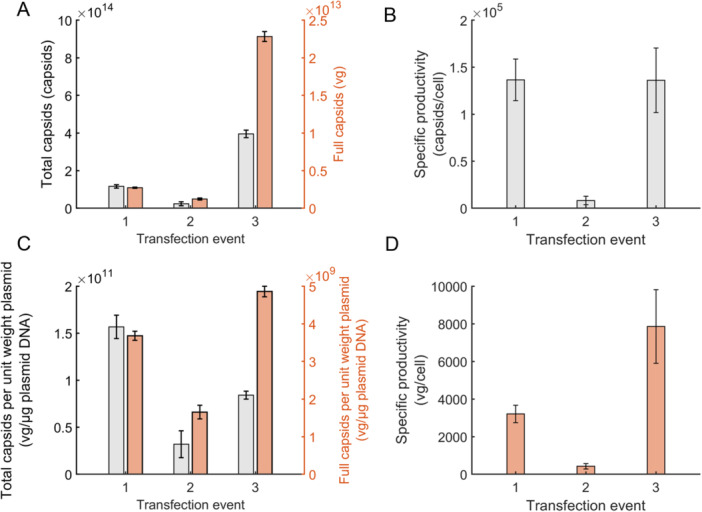
Total and full capsid yields for each transfection event. The yields from each transfection were calculated as described in Materials and Methods section 4.13. A transfection event starts with the addition of the first plasmid bolus (as specified in Table 1) and concludes either when the next transfection event begins or when the culture ends. (A) Net total capsid titer (left axis, black) and full capsid titer (right axis, orange) produced during each transfection event. (B) The total capsids produced per unit weight of plasmid added (left axis, black) and full capsids produced per unit weight of plasmid added (right axis, orange) during the transfection events. Cellular specific productivity of (C) total capsid and (D) full capsid. The specific productivity was calculated using the amount of full capsids produced by the cell culture and the integrated viable cell density (IVCD) as outlined in the Materials and Methods section 4.14. Error bars represent the forward propagation of the measurement SD.
The net yield of vector genomes produced by each transfection event is shown in Figure 4A. The first transfection event yielded roughly vg in total. This is comparable to the expected yield of conventional batch production processes that produce rAAV via a single transient transfection bolus, which range in productivity from – vg/mL (Chahal et al. 2013; Cameau et al. 2019; Nguyen et al. 2021; Srinivasan et al. 2024) or – vg when scaled to a 370 mL batch size. The yield from the second transfection was roughly half that of the first transfection, which can again be attributed to the detrimental effects of lower plasmid dosage per cell and low plasmid/cell incubation time. The third transfection event yielded 8.4‐fold more full capsids than the first transfection. Unlike for the total capsid production, however, this increase in full capsid production is attributed to a combination of higher transfection cell density and a higher cell‐specific productivity (Figure 4D). Notably, the full capsids produced per g of plasmid added to the culture was 30% higher for the third transfection event than the first transfection event (Figure 4C). Supporting Information S1: Table S2 summarizes the results from the intensified perfusion system with those from a previous batch experiment. In summary, the combination of higher viable cell density transfection and two dose re‐transfection boosted both volumetric and cell‐specific productivity of the process and improved plasmid utilization, increasing the number of potential doses produced while decreasing the cost of goods.
3. Discussion
Transient transfection production of rAAV is highly inefficient. To address this, we developed and implemented an intensified transient transfection process that combines perfusion, high cell density transfection, and re‐transfection using a combination of experimental and mechanistic modeling approaches. The mechanistic model—built upon previously published models of batch transfection processes (Srinivasan et al. 2024)—successfully describes both cellular (Figure 2A,B) and molecular (Figure 2C,D) dynamics. Once established, the mechanistic model can be used to compare the relative productivity of re‐transfection events, helping elucidate the impact of operational adjustments such as plasmid/cell incubation time, plasmid dosage per cell, and split dose re‐transfections.
Clinical doses for rAAV therapeutics range from to vg per patient, depending on the indication, route of administration, and vector potency (Sha et al. 2021; Clément 2019; Kuzmin et al. 2021). Assuming a dose of vg per patient and a typical reported productivity for a batch transient transfection process of vg/L (Clément 2019; Grieger et al. 2016), a 1000L manufacturing process would only generate enough material to treat 10 patients. For indications such as Duchene muscular dystrophy, which require such large doses and have patient populations in the tens and hundreds of thousands (National Center for Advancing Translational Sciences 2024), the current productivity is untenable for therapeutic deployment.
One way to improve the productivity of the upstream process is to introduce process intensification strategies. The combination of perfusion and re‐transfection extends the productive window of the cell culture, while transfecting cells at a higher cell density increases the overall volumetric productivity within the bioreactor. In addition, we demonstrate that splitting the plasmid dose into two successive boluses can increase the cell‐specific full capsid productivity and improve plasmid utilization. Considering plasmids account for roughly 40% of raw materials costs in transient transfection suspension processes (Cameau et al. 2019), these process improvements have the potential to significantly reduce the cost of manufacturing. Furthermore, having a perfusion process that can be initiated and set to continuously generate clinical material is operationally advantageous since it limits the amount of start up time, which is typically ~3 weeks for conventional batch processes (Cameau et al. 2019).
In this study, the days 7 and 9 re‐transfections together produced over eightfold more full capsids as the day 0 transfection, which had productivity levels similar to a batch production. Although this increase in volumetric productivity can be partially explained by the increased transfection cell density, a significant productivity boost is achieved by the act of re‐transfection itself; the cell‐specific productivity of full capsid generation is over twice as high for the days 7 and 9 re‐transfections as it is for the day 0 transfection (Figure 4D) while the capsid production is consistent between the transfection events (Figure 4B). This is a similar outcome to our previously published work, in which splitting a plasmid dose into two, time‐separated half‐doses maintained a consistent total capsid concentration to the full dose condition but resulted in a higher production of full capsids (Srinivasan et al. 2024).
To further demonstrate the additive nature of split dose re‐transfection, we deconvoluted the outputs from each transfection condition by using the fit mechanistic model to simulate input conditions specific to each transfection day, including plasmid amounts, inoculation cell density, and pump settings. In each of these simulations the starting concentrations of all intracellular species were set to zero. Additional simulation details are provided in the Materials and Methods section 4.15. The simulations show that the full capsids produced per unit weight plasmid and cell‐specific productivity for the Day 7 and 9 transfections both decreased relative to the day 0 transfection when the transfections are treated as individual events, further highlighting the additive nature of split dose re‐transfections (Figure 5A,B). We confirmed the additive effect of split dosing by comparing the cell‐specific productivity of only actively producing cells, which we define as the viable cells scaled by the transfection efficiency (Materials and Methods 4.14). The split dose transfection demonstrates increased cell‐specific productivity even when controlling for the increase in the proportion of transfected cells following the second dose (Figure 5C). As such, the increase in cell‐specific productivity cannot be explained by the increase in the number of transfected cells alone, again highlighting the benefits of re‐transfecting previously transfected cells.
Figure 5.
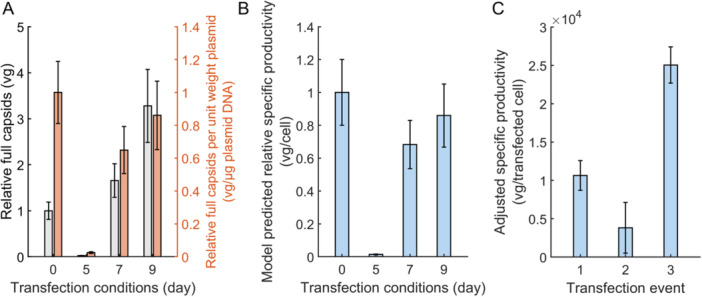
Simulated full capsid yields for the deconvoluted transfection days. The yields of each transfection were calculated using simulations of the fit mechanistic model and the input conditions specific to each transfection event. The length of each simulation was four days. Intracellular concentrations were set to zero at the start of each simulation. (A) Net full capsid titer. The relative full capsids (left axis, grey) and the relative full capsids produced per unit weight of plasmid added during the transfection (right axis, orange). (B) Relative cellular specific productivity. The specific productivity was calculated using simulation predictions for the amount of full capsids and integrated viable cell density (IVCD). Error bars represent the 95% confidence interval from 10,000 Monte Carlo simulations. (C) Cell‐specific productivity accounting for only transfected cells as measured by green fluorescent protein (GFP). Cell‐specific productivity calculation details can be found in Materials and Methods section 4.14.
Performing transient transfections at high cell density is often limited by the cell density effect, in which the cell‐specific productivity decreases with increasing cell density at the time of transfection (Mendes et al. 2022; Moço et al. 2023; Lavado‐García et al. 2022). The molecular basis of the cell density effect remains an open question (Lavado‐García et al. 2022), but it has been shown to be ameliorated by both media supplementation and media replacement, suggesting nutrient limitations or the accumulation of inhibitory compounds in the cell culture (Mendes et al. 2022; Henry et al. 2005, 2004; Nadeau and Kamen 2003; Pérez‐Rubio et al. 2024). Our mechanistic model captures the cell density effect via an inhibition factor () that increases with increasing concentrations of dead cells, which are used as a proxy for all inhibitory compounds in the cell culture. In a batch culture, the inhibition factor increases with increasing viable cell density, as cell death is a first‐order process with regard to viable cell density and dead cells are not removed from the culture. This dampens protein synthesis and DNA replication (Equations (14), (15), (16)) which reduces the cell‐specific productivity at high cell density. In perfusion, however, inhibitory components are continuously removed from the culture, and we observe a mitigation of the cell density effect (Figure 4D).
As for any model of a biological system, the level of detail in our mechanistic model is limited by the quality and specificity of the available data. For example, the model does not directly consider partially full capsids (Wagner et al. 2023), delineate between the various Rep isomers (Sha et al. 2021), or account for differing kinetics between the three plasmid types (Hornstein et al. 2016). In addition, the translation, transcription, and nuclear‐shuttling of the capsid and Rep proteins are described by single kinetic parameters. The model accurately describes the intensified rAAV process and proves to be a critical tool for process development, and any additional data that become available can be readily incorporated into its mathematical structure, improving the model's veracity and potentially unlocking additional mechanistic insights. Analogous mathematical modifications and reparameterizations can be made to adapt the model to different serotypes and production methods (e.g., stable producer cell lines), as many of the underlying biological mechanisms are preserved between systems.
Process development remains largely empirical in the biopharmaceutical industry. While empirical approaches are useful for establishing baseline processes within defined parameter ranges, the use of mechanistic modeling unlocks physical insights that can be used to develop and test hypotheses outside of the typical experimental workflow. In this study, we demonstrate the use of mechanistic modeling to establish an intensified transient transfection process that continuously generates high titers of rAAV through a perfusion process that enables transfection and re‐transfection at high cell density. The coordinated use of mechanistic modeling and process intensification strategies shows vast potential to enhance process development workflows, improving the robustness and greatly facilitating the production capacity of gene therapy manufacturing.
4. Materials and Methods
4.1. Materials
FreeStyle 293‐F cells, culture medium FreeStyle F17 Expression Medium, and Gibco l‐glutamine were purchased from Thermo Fisher Scientific (Waltham, MA). A set of plasmids, including pAAV‐GFP (Part No. AAV‐400), pRC5 (Part No. VPK‐425), and pHelper (Part No. 340202), were purchased from Cell Biolabs (San Diego, CA) for AAV5 production with GFP as the transgene. Plasmid pRC5 is 7.3 kb long with endogenous promoter p5 and p19 for rep2 and p40 and p81 for cap5. Plasmid pHelper is 11.6 kb with endogenous sequences for E2A and E4. Plasmid pAAV‐GFP is 5.4 kb long and constructed with a CMV promoter and GFP between two ITR sequences. These plasmids were amplified using One Shot Stbl3 E. coli from Thermo Fisher Scientific (Waltham, MA) and purified by the plasmid mega kid from Qiagen (Hilden, Germany). The purified plasmids were further sterilized by 0.22 m filtration and stored at C. Polyethylenimine transfection agent PEI Max was purchased from Polysciences (Warrington, PA) and dissolved in MilliQ water to make a solution of , pH adjusted to 7.0 by adding 1 M HCl. The solution was sterilized by 0.22 m filtration and stored at C. The AAV5 ELISA kit was from Progen (Wayne, PA). The Monarch Genomic DNA purification kit, DNase buffer, DNase I, and proteinase K were from New England Biolabs (Ipswitch, MA). The ddPCR (droplet digital PCR) reagents and consumables namely, QX200 EvaGreen supermix, droplet generation oil for EvaGreen, ddPCR droplet reader oil, DG32 automated droplet generator cartridges, and ddPCR 96‐well semi‐skirted plates were all purchased from Bio‐Rad Laboratories (Hercules, CA). Custom‐made single‐stranded DNA oligomers (synthesized using the services of Integrated DNA Technologies, Coralville, IA) dissolved in nuclease‐free water as per manufacturer's instructions were used as ddPCR primers. Dimethyl sulfoxide (DMSO) purchased from MP Biomedicals (Irvine, CA) and 10% sodium dodecyl sulfate (SDS) purchased from Sigma Aldrich (St. Louis, MO) were used to optimize ddPCR reaction conditions.
4.2. Preculture Cell Maintenance
A vial of FreeStyle 293‐F cells was thawed in a C water bath and transferred into pre‐warmed FreeStyle F17 expression medium supplemented with 4 mM glutamine. The cells were cultured at a 30 mL working volume in 125 mL shake flasks (Fisherbrand, Cat. No. PBV125). Cell cultures were maintained at C with 135 rpm agitation in a humidified incubator with 5% . Sub‐cultures were performed between 0.3 and 3 million cells/mL and at all times the seed culture cell viability was maintained above 90%. Samples of 50 mL cell‐culture samples were taken daily from the shake flasks, and the cell count and viability were measured as detailed in Section 4.6.
4.3. Bioreactor System for Cultivation of HEK293 Cells
A 500‐mL Applikon stirred‐tank bioreactor (Getinge, Rochester, NY) equipped with a three‐blade marine impeller and a microsparger was used for viral vector production. The bioreactor was inoculated to a target density of cells/mL using the expanded cellular contents from two preculture flasks. The bioreactor was operated to setpoints of C, dissolved oxygen concentration (DO) 40%, pH 7, and 125 rpm. Cells were grown to cells/mL before the first transfection. A combination of air and pure oxygen flown through the microsparger were used to maintain the DO at the set point. The pH was maintained at the set point via sparging and 0.5 M addition. Antifoam C from MilliporeSigma (Burlington, MA) was used to control foaming when foam was detected by a foam level controller. The temperature of the bioreactor vessel content was heated through a heating jacket and cooled via a condenser. The PID controllers were automated through the myControls console that was purchased along with the Applikon bioreactor. The bioreactor control loops are summarized in Supporting Information S1:Table S1.
4.4. Perfusion System
The perfusion bioreactor system schematic is shown in Figure 1, which includes a tangential flow system, a harvest pump, and a bleed pump. The tangential flow filtration system consists of a 0.2 m hollow membrane filter (Artemis Biosystems, Quincy, MA) driven by a magnetic pump (Levitronix, Framingham, MA). The cell‐free harvest line is connected to the filter and driven by a controllable perilstatic pump (Masterflex, Radnor, PA). The cell‐containing bleed is drawn through a dip tube directly from inside the vessel via a controllable perilstatic pump (Masterflex, Radnor, PA). The volume level inside the bioreactor is controlled via a level sensor to maintain a constant working volume. The working volume, which included the volume inside the vessel and the recirculation tubing, was 370 mL.
The process parameters were the concentration of discrete plasmid input [], harvest flow rate [], and bleeding flow rate []. The harvest flow rate () and bleed flow rate () were manually adjusted periodically to achieve a desired cellular density and maintain steady and non‐limiting nutrients level. A transfection‐free cell cultivation was run before the transfection experiment to determine a reasonable perfusion rate as a function of total cell density (data not shown). For perfusion with transfection, the total perfusion rate was maintained at a slightly higher flow rate than the transfection‐free operation to account for the cytotoxicity introduced by the transfection reagent. The amount of plasmids added to the system was adjusted depending on the cell density at the time of each transfection.
4.5. Triple Transfection of HEK293 Cells
The cells in the bioreactor were grown in batch mode until they reached a density of cells/mL. Each plasmid solution was quantified using a NanoDrop Spectrophotometer (Thermo Fisher Scientific, Waltham, MA, USA). The three plasmids were mixed at a 1:1:1 molar ratio, and the total plasmid dosage was adjusted depending on the cell density at the time of transfection to achieve the target plasmid concentrations summarized in Table 1. The transfection cocktail was prepared by the sequential addition of the plasmid mix, culture medium, and the PEI Max solution. The PEI:DNA mass ratio was 2:1. The transfection cocktail was vortexed for 10 s, incubated at room temperature for 10 min, and transferred to a sterilized bottle containing an outlet tube within a biosafety hood. The bottle containing the transfection cocktail was then connected aseptically using a tube welder to the bioreactor system and pumped into the bioreactor vessel.
A 7 mL sample was drawn daily for analyses. A volume of 50 L from this sample was immediately used to measure the cell count and viability (see Section 4.6). The remainder of the sample was aliquoted into 500 L volumes in Eppendorf tubes and centrifuged at 1000 rpm for 5 min. Supernatant and cells were separated into different tubes and stored at C until the assays below were performed.
4.6. Cell Count and Metabolite Analysis
To measure cell count and viability, we first mixed 50 L cell culture solution with 50 L trypan blue stain. Two technical measurements each were performed by loading 10 L of the mixture into a Countess II Automated cell counter (Thermo Fisher Scientific, Waltham, MA). To analyze the metabolic profiles, the supernatant samples were thawed and screened using BioProfile FLEX2 (Nova Biomedical, Waltham, MA).
4.7. Quantification of AAV5 Capsids in Cells and Supernatant
To quantify the capsids in the cells, one sample tube containing the cells from 500 mL culture was thawed on ice. A volume of 100 mL pre‐chilled lysis buffer composed of 150 mM NaCl, 50 mM Tris‐HCl (pH 8.5), was added to the cells. The cells were suspended, briefly vortexed, and then processed by a total of three cycles of freezing in an ethanol bath (a mixture of dry ice and 70% ethanol) for 10 min and thawing in a C water bath for 10 min. The sample was clarified by centrifuging at 12,100g, C, for 15 min, followed by transferring the supernatant to a new Eppendorf tube and discarding the precipitates. The samples were then analyzed by an AAV5 ELISA kit according to the instruction from the manufacturer (Progen, Wayne, PA, USA). To quantify the capsids in the supernatant, an aliquot of the supernatant saved from cell culture was thawed and further clarified by centrifuging at 12,100g, C, for 15 min. The clarified supernatant was then analyzed by the AAV5 ELISA kit. The final absorbance from the ELISA reactions was read by a microplate reader (BioTek Instruments, Winooski, VT, USA). The concentration of capsids in the cell lysate solution was converted to the capsids' quantity per cell based on the cell number included in the 500‐mL culture sample.
4.8. Quantification of Genome Titer in Cells and Supernatant
ddPCR was used to measure the AAV genome copy number. To measure the genome copy number that was encapsidated in AAV particles remaining in cell pellets, one sample tube containing the cells from 500 L culture was thawed and lysed by three cycles of freeze and thaw, following the same procedures described in Section 4.7. The clarified supernatant was directly used to measure the copy number of AAV genome encapsidated in AAV particles that had been secreted to supernatant. For a 50 L reaction, 2 L of sample, 5 L of 10× DNase buffer, 5 L of DNase I (10 U), and 38 L DNase‐free water were mixed. The samples were incubated at C for 2 h after which a 50 L volume of 10 mM EDTA was added to the reaction to inhibit the activity of DNase I. The samples were diluted serially so that the readouts were less than the saturation level of equipment ( copies/L). All reactions for estimating genome copies were performed using forward and reverse primers targeting gfp. The forward primer was 5′‐GCAAAGACCCCAACGAGAAG‐3′ and the reverse primer was 5′‐TCACGAACTCCAGCAGGACC‐3′. The measurement was repeated twice for each sample point.
4.9. Estimation of Transfection Efficiency
The transfection efficiency of the cell culture was determined by analyzing the cellular GFP expression in raw images obtained during cell counting. The transfection efficiency is defined as the ratio of the number of cells detected in the GFP channel image to those detected in the BF (bright field) channel image, as illustrated in Supporting Information S1: Figure S4A. Since dead or aged cells can also exhibit residual GFP fluorescence, the transfection efficiency of the live cells should be estimated by multiplying the cell viability to the bare GFP fluorescence level. As cell viability remained above 90%, the transfection efficiency of the culture closely approximates that of live cells. We utilized ImageJ2 for image processing and particle analysis (Rueden et al. 2017) because of inaccuracies in the cell counting device's built‐in cell detection algorithm under aggregating conditions. The developed algorithm has been validated with a total of 118 images obtained from 50 different cell culture conditions without aggregation (Supporting Information S1: Figure S4B), demonstrating consistent results comparable to those from the counting device.
4.10. Perfusion Bioreactor Mathematical Modeling
Bioreactors have been traditionally modeled as stirred‐tank chemical reactors. The material balance equation is
| (1) |
where is the concentration in the reactor, is the liquid medium volume, is the media flow rate, the subscripts in and out referring to inlet and outlet streams, is the separation factor at the outlet, and is the volumetric reaction rate, which is calculated using the mechanistic model presented in Section 4.11.
In this perfusion system with bleeding and harvest streams, the equation is expanded to
| (2) |
where is the total perfusion rate and is the separation factor at the harvest line.
4.11. rAAV Production Mathematical Modeling
We previously developed a mechanistic model that describes rAAV production via a triple transfection process run in batch mode (Nguyen et al. 2021). This model was trained and validated using a combination of literature and internally generated data, including time‐coursed measurements of intracellular and nuclear plasmids, vDNA, and full and empty capsids. We then extended this model to include re‐transfection dynamics using data generated from a multiple dosing experiment also run in batch (Srinivasan et al. 2024). Due to the availability of additional data, including cell density and Rep protein measurements, the updated model extended the system from the cellular‐ to the bioreactor‐scale and refined the estimated parameters. In this study, we use the updated model with two minor reversions to the original model structure: the capsid filling rate equation is reverted to its original mathematical form (Equation 18) and capsid degradation terms are removed (Nguyen et al. 2021). In addition, terms are included to account for the inlet and outlet flow rates of the perfusion system. The model's deterministic structure represents an average cell in the culture, which is sufficient to obtain mechanistic insights given the concentrations studied in our system (Canova et al. 2023).
The reaction‐transport network includes the nonviral gene delivery pathway, the synthesis of viral particle components from plasmid DNA, and the filling and egress of viral particles. Cell growth, cell death, and plasmid uptake are modeled by
| (3) |
| (4) |
| (5) |
| (6) |
| (7) |
| (8) |
| (9) |
| (10) |
Toxic byproducts such as ammonia and chemical additives such as PEI are detrimental to cellular growth and cause premature cell death (Ozturk et al. 1992; Hansen and Emborg 1994; Rajendra et al. 2012; Kafil and Omidi 2011). The combined inhibitory effects of these species is captured using an inhibition factor (), which decreases as the concentration of dead cells increases. We use the concentration of dead cells as a surrogate for the multiple harmful species present in the bioreactor because it is a directly measured state. The plasmid uptake rate has been shown to decrease due to plasmid aggregation (Hu et al. 2021) and a decreasing biological ability of cells to take up plasmids at later re‐transfection events (Cervera et al. 2015). The model accounts for these effects using a monotonically decreasing state variable that then modulates the predicted plasmid uptake rate. However, our system does not display a pronounced decrease in plasmid uptake efficiency at later re‐transfection events (Figure 1C). Because of this, we reset to one at the initiation of each plasmid dosing event. The model accounts for the cytotoxic effects of Rep protein in the formulation of the cellular death rate (Schmidt et al. 2000).
Plasmid trafficking from the cell culture broth to the cell nucleus is modeled by
| (11) |
| (12) |
| (13) |
Trafficking kinetics are assumed to be identical for all three plasmids (pRC5, pHelper, pAAV‐GFP). Our previously published research suggested that the uptake rate of plasmids may decrease with increasing plasmid size (4 kbp, 7.3 kbp, and 11.6 kbp for pAAV‐GFP, pRC5, and pHelper respectively) but further experimentation is needed to confirm this result (Srinivasan et al. 2024).
The synthesis of Rep, VP, and viral DNA from nuclear plasmids, the formation of empty capsids from VP, the packaging of vDNA into empty capsids, and the egress of full and empty capsids from inside the cells to the culture media are modeled by
| (14) |
| (15) |
| (16) |
| (17) |
| (18) |
| (19) |
| (20) |
| (21) |
| (22) |
| (23) |
| (24) |
| (25) |
| (26) |
As mentioned, these mathematical representations are based on the previously published re‐transfection mechanistic model but contain two changes. First, the capsid filling rate equation is reverted to a power law formulation between and (Equation 18). Second, the capsids are assumed to have a negligible degradation rate. Notably, the model captures the myriad of up‐ and downregulatory functions of Rep, including Rep's inhibitory effect on VP (Trempe and Carter 1988) and Rep synthesis (Pereira et al. 1997) and its boosting effect on viral DNA replication (Samulski and Muzyczka 2014) and capsid filling (King 2001). Protein synthesis and viral DNA replication rates are negatively affected by the inhibition factor ().
The reaction network described in Equations ((11), (12), (13), (14), (15), (16), (17), (18), (19), (20), (21), (22), (23), (24), (25), (26)) represent a single cell. We converted these cellular rates to be representative of the entire cell population per mL culture to directly fit experimental full and empty capsid concentration measurements. The concentrations of full and empty capsids within cells and in the cell culture media are modeled as
| (27) |
| (28) |
| (29) |
| (30) |
These equations assume that capsid assembly, packaging, and secretion only occur in live cells. In addition, the viral harvesting system is assumed to achieve perfect separation of viral particles from the cell culture media while retaining cells. This assumption is supported by a study that demonstrated that, for a continuous influenza A process, 100% of the viral particles were able to pass through the membrane (Hein et al. 2021). As such, the separation factor at the harvest line () is assumed to be zero for viral particles and one for cells.
4.12. Parameter Estimation
The model has 27 parameters (Table 2) and 22 state variables (Table 3). The values of the majority of these parameters were fixed to either estimated values from the scientific literature or estimated values from our previous model development studies (Nguyen et al. 2021; Srinivasan et al. 2024). Five parameters were fit in this study in two steps. In the first step, three parameters (, and ) were fit to cell growth data (Figure 2A,B) using maximum‐likelihood estimation in the log space of the parameters (Beck and Arnold 1977)
| (31) |
where is a vector of the estimated parameters, is a vector containing the experimental observations, is a vector containing model predictions with parameter set , and is the measurement noise covariance matrix. In the second step, two parameters ( and ) were fit using total and full capsid data (Figure 2C,D), again using using maximum‐likelihood estimation in the log space of the parameters.
Table 3.
Species described in the mechanistic model.
| Species no. | Notation | Description | Unit | |
|---|---|---|---|---|
| 1 |
|
Viable cell density | cells | |
| 2 |
|
Dead cell density | cells | |
| 3 |
|
Plasmid concentration per live cell | plasmid | |
| 4 |
|
Extracellular plasmid concentration | plasmid | |
| 5 |
|
Plasmid uptake factor | N/A | |
| 6 |
|
RepCap plasmid in the nucleus | plasmid | |
| 7 |
|
Helper plasmid in the nucleus | plasmid | |
| 8 |
|
Endosomal plasmid | plasmid | |
| 9 |
|
Cytosolic plasmid | plasmid | |
| 10 |
|
Nuclear plasmid | plasmid | |
| 11 |
|
Rep protein in cells | Rep protein | |
| 12 |
|
Viral protein in cells | Viral protein | |
| 13 |
|
Empty capsid in cell nucleus | capsid | |
| 14 |
|
Empty capsid in cell nucleus | capsid | |
| 15 |
|
Viral DNA in cells | DNA | |
| 16 |
|
Rep bound capsids in cells | complex | |
| 17 |
|
full capsid in cell nucleus | capsid | |
| 18 |
|
full capsid in cell nucleus | capsid | |
| 19 |
|
Total capsids inside cells | capsid | |
| 20 |
|
Total capsids in the media | capsid | |
| 21 |
|
full capsids inside cells | capsid | |
| 22 |
|
full capsids in the media | capsid |
Optimization and simulation were performed using MathWorks (Waltham, MA) MATLAB software. Optimization was performed using a multi‐start approach with an interior point algorithm and 1000 random initialization points. Bootstrap simulations with 1000 runs were used to determine the uncertainty in the estimated parameters (Efron and Tibshirani 1994). The model equations were solved using the ordinary differential equations solver ode15s available in MATLAB.
4.13. Calculation of Accumulated Capsid and Genome Titer
The amount of total () and full capsids () in the vessel at time can be calculated by
| (32) |
| (33) |
assuming that the tangential flow filter allowed 100% of the viral particles to pass through to the harvest stream (Hein et al. 2021). The accumulation of total and full capsid titer obtained from the continuous cultivation of the harvest () and bleed streams () can be calculated by
| (34) |
| (35) |
| (36) |
| (37) |
The trapezoidal rule was applied to calculate the integrals and the accumulated total and full capsid titer amounts. Since the total and full capsid measurements were discrete, sparse, and did not align with changes in pump operations, linear interpolation was used to determine the concentrations in between measurements. Therefore, Equations 34 and 35 become
| (38) |
| (39) |
and Equations 36 and 37 become
| (40) |
| (41) |
where the discretization indices () represent time points when a pump flow rate was modified or a measurement was taken. The total titer, including vessel, harvest stream and bleed stream is then calculated from
| (42) |
| (43) |
4.14. Calculation of the Cell‐Specific Productivity
Cell‐specific productivity was calculated using the integrated viable cell density (IVCD). The IVCD quantifies the effective productive time for a cell culture and is useful for comparing the cell‐specific productivity between transfection events because it controls for differences in cell growth dynamics. We calculate the IVCD using the trapezoidal rule,
| (44) |
| (45) |
where again the discretization indices () represent time points when a pump flow rate was modified or a measurement was taken. The IVCD is then used to calculate the cell‐specific productivity () for a given transfection stage ,
| (46) |
where and represent the full capsids produced and integrated viable cell density for transfection stage and represents the time length of transfection stage .
To calculate the number of actively producing cells, we scaled the IVCD by the linear interpolation of the transfection efficiency measured by gfp (TE) (Figure 1C),
| (47) |
This metric can then be used to calculate the adjusted cell‐specific productivity (),
| (48) |
4.15. Deconvolution of the Transfection Events
The goal of the deconvolution simulations was to directly compare the impact of the transfection conditions on full and total capsid titer production (Table 1). We needed to run these simulations to remove the confounding effects from intracellular species being carried over between plasmid boluses in the experimental run (e.g., Figure 2F). Simulations were performed using the fit mechanistic model and the experimental conditions for each of the plasmid doses (Table 1). The initial concentrations of all intracellular species were set to zero for each simulation. Pump flowrates for each of the simulated conditions were consistent with the pump flowrates from the perfusion bioreactor run (Fig. S2). The length of each simulated bioreactor run was 4 days. A 10,000 run Monte Carlo analysis was performed to quantify the uncertainty of the predicted simulation outputs. For each Monte Carlo simulation, the fit parameters (, and ) were sampled from a normal distribution defined by each parameter's uncertainty (Table 2) and the plasmid dosing conditions were simulated as described above.
Author Contributions
Tam N. T. Nguyen: conceptualization, methodology, software, validation, formal analysis, investigation, data curation, writing (original draft), writing (review and editing), visualization. Damdae Park: conceptualization, methodology, software, validation, formal analysis, investigation, data curation, writing (original draft), writing (review and editing), visualization. Christopher T. Canova: software, validation, formal analysis, writing (original draft), writing (review and editing), visualization. Jose Sangerman: validation, investigation. Prasanna Srinivasan: validation, investigation. Rui Wen Ou: resources, investigation. Caleb Neufeld: resources, writing (review and editing), funding acquisition. Jacqueline M. Wolfrum: resources, writing (review and editing), funding acquisition. Paul W. Barone: resources, writing (review and editing), funding acquisition. Anthony J. Sinskey: resources, writing (review and editing), funding acquisition. Stacy L. Springs: resources, writing (review and editing), funding acquisition. Richard D. Braatz: conceptualization, methodology, resources, writing (review and editing), funding acquisition.
Supporting information
Supplementary Information
Acknowledgments
This work was supported by the U.S. Food and Drug Administration (Grant ID: 1R01FD006584‐02, Continuous Viral Vector Manufacturing based on Mechanistic Modeling and Novel Process Analytics). Tam N. T. Nguyen was partially supported by a MathWorks Engineering Fellowship. Damdae Park was supported by the Korea Institute for Advancement of Technology (KIAT) with a grant funded by the Korean Government (MOTIE) (P0017304, Human Resource Development Program for Industrial Innovation). This research was also supported by a grant from the Massachusetts Life Sciences Center as part of the Building Breakthroughs Program. Open Access funding enabled and organized by MIT Hybrid 2025.
Tam N. T. Nguyen, Damdae Park, and Christopher T. Canova contributed equally to this work.
Data Availability Statement
The data that support the findings of this study are available from the corresponding author, Richard D. Braatz, upon reasonable request.
References
- Beck, J. V. , and Arnold K. J.. 1977. Parameter Estimation in Engineering and Science. Wiley. [Google Scholar]
- Bishop, C. J. , Majewski R. L., Guiriba T.‐R. M., et al. 2016. “Quantification of Cellular and Nuclear Uptake Rates of Polymeric Gene Delivery Nanoparticles and DNA Plasmids Via Flow Cytometry.” Acta Biomater 37: 120–130. [DOI] [PMC free article] [PubMed] [Google Scholar]
- Cameau, E. , Pedregal A., and Glover C.. 2019. “Cost Modelling Comparison of Adherent Multi‐Trays With Suspension and Fixed‐Bed Bioreactors for the Manufacturing of Gene Therapy Products.” Cell and Gene TherapyInsights 5: 1663–1674. [Google Scholar]
- Canova, C. T. , Inguva P. K., and Braatz R. D.. 2023. “Mechanistic Modeling of Viral Particle Production.” Biotechnology and Bioengineering 120: 629–641. [DOI] [PubMed] [Google Scholar]
- Cervera, L. , González‐Domínguez I., Segura M. M., and Gòdia F.. 2017. “Intracellular Characterization of Gag VLP Production by Transient Transfection of HEK 293 Cells.” Biotechnology and Bioengineering 114: 2507–2517. [DOI] [PubMed] [Google Scholar]
- Cervera, L. , Gutiérrez‐Granados S., Berrow N. S., Segura M. M., and Gòdia F.. 2015. “Extended Gene Expression by Medium Exchange and Repeated Transient Transfection for Recombinant Protein Production Enhancement.” Biotechnology and Bioengineering 112: 934–946. [DOI] [PubMed] [Google Scholar]
- Chahal, P. S. , Schulze E., Tran R., Montes J., and Kamen A. A.. 2013. “Production of Adeno‐Associated Virus (AAV) Serotypes by Transient Transfection of HEK293 Cell Suspension Cultures for Gene Delivery.” Journal of Virological Methods 196: 163–173. [DOI] [PMC free article] [PubMed] [Google Scholar]
- Chen, C. , Wong H. E., and Goudar C. T.. 2018. “Upstream Process Intensification and Continuous Manufacturing.” Current Opinion in Chemical Engineering 22: 191–198. [Google Scholar]
- Clément, N. 2019. “ Large‐Scale Clinical Manufacturing of AAV Vectors for Systemic Muscle Gene Therapy.” In Muscle Gene Therapy, 253–273. Springer. [Google Scholar]
- Clément, N. , and Grieger J. C.. 2016. “Manufacturing of Recombinant Adeno‐Associated Viral Vectors for Clinical Trials.” Molecular Therapy—Methods & Clinical Development 3: 16002. [DOI] [PMC free article] [PubMed] [Google Scholar]
- ClinicalTrials.gov . 2022. https://www.clinicaltrials.gov.
- Corish, P. , and Tyler‐Smith C.. 1999. “Attenuation of Green Fluorescent Protein Half‐Life in Mammalian Cells.” Protein Engineering, Design and Selection 12: 1035–1040. [DOI] [PubMed] [Google Scholar]
- Dahari, H. , Ribeiro R. M., Rice C. M., and Perelson A. S.. 2007. “Mathematical Modeling of Subgenomic Hepatitis C Virus Replication in Huh‐7 Cells.” Journal of Virology 81: 750–760. [DOI] [PMC free article] [PubMed] [Google Scholar]
- Efron, B. , and Tibshirani R.. 1994. An Introduction to the Bootstrap. Chapman and Hall/CRC. [Google Scholar]
- Evaluate Pharma 2022 Report . 2022. https://www.evaluate.com/thoughtleadership/pharma/world-preview-2022-report.
- Fu, Q. , Polanco A., Lee Y. S., and Yoon S.. 2023. “Critical Challenges and Advances in Recombinant Adeno‐Associated Virus (rAAV) Biomanufacturing.” Biotechnology and Bioengineering 120: 2601–2621. [DOI] [PubMed] [Google Scholar]
- Gimpel, A. L. , Katsikis G., Sha S., et al. 2021. “Analytical Methods for Process and Product Characterization of Recombinant Adeno‐Associated Virus‐Based Gene Therapies.” Molecular Therapy ‐ Methods & Clinical Development 20: 740–754. [DOI] [PMC free article] [PubMed] [Google Scholar]
- Grieger, J. C. , Soltys S. M., and Samulski R. J.. 2016. “Production of Recombinant Adeno‐Associated Virus Vectors Using Suspension HEK293 Cells and Continuous Harvest of Vector From the Culture Media for GMP FIXand FLT1 Clinical Vector.” Molecular Therapy 24: 287–297. [DOI] [PMC free article] [PubMed] [Google Scholar]
- Grosse, S. , Penaud‐Budloo M., Herrmann A.‐K., et al. 2017. “Relevance of Assembly‐Activating Protein for Adeno‐Associated Virus Vector Production and Capsid Protein Stability in Mammalian and Insect Cells.” Journal of Virology 91: 01198‐17. [DOI] [PMC free article] [PubMed] [Google Scholar]
- Hansen, H. A. , and Emborg C.. 1994. “Influence of Ammonium on Growth, Metabolism, and Productivity of a Continuous Suspension Chinese Hamster Ovary Cell Culture.” Biotechnology Progress 10: 121–124. [DOI] [PubMed] [Google Scholar]
- Hein, M. D. , Chawla A., Cattaneo M., Kupke S. Y., Genzel Y., and Reichl U.. 2021. “Cell Culture‐Based Production of Defective Interfering Influenza A Virus Particles in Perfusion Mode Using an Alternating Tangential Flow Filtration System.” Applied Microbiology and Biotechnology 105: 7251–7264. [DOI] [PMC free article] [PubMed] [Google Scholar]
- Hein, M. D. , Kazenmaier D., van Heuvel Y., et al. 2023. “Production of Retroviral Vectors in Continuous High Cell Density Culture.” Applied Microbiology and Biotechnology 107: 5947–5961. [DOI] [PMC free article] [PubMed] [Google Scholar]
- Henry, O. , Dormond E., Perrier M., and Kamen A.. 2004. “Insights Into Adenoviral Vector Production Kinetics in Acoustic Filter‐Based Perfusion Cultures.” Biotechnology and Bioengineering 86: 765–774. [DOI] [PubMed] [Google Scholar]
- Henry, O. , Perrier M., and Kamen A.. 2005. “Metabolic Flux Analysis of HEK‐293 Cells in Perfusion Cultures for the Production of Adenoviral Vectors.” Metabolic Engineering 7: 467–476. [DOI] [PubMed] [Google Scholar]
- Hornstein, B. D. , Roman D., Arévalo‐Soliz L. M., Engevik M. A., and Zechiedrich L.. 2016. “Effects of Circular DNA Length on Transfection Efficiency by Electroporation Into HeLa Cells.” PLOS ONE 11: e0167537. [DOI] [PMC free article] [PubMed] [Google Scholar]
- Hu, Y. , Zhu Y., Sutherland N. D., et al. 2021. “Size‐Controlled and Shelf‐Stable DNA Particles for Production of Lentiviral Vectors.” Nano Letters 21: 5697–5705. [DOI] [PMC free article] [PubMed] [Google Scholar]
- Kafil, V. , and Omidi Y.. 2011. “Cytotoxic Impacts of Linear and Branched Polyethylenimine Nanostructures in A431 Cells.” BioImpacts 1: 23–30. [DOI] [PMC free article] [PubMed] [Google Scholar]
- King, J. A. 2001. “DNA Helicase‐Mediated Packaging of Adeno‐Associated Virus Type 2 Genomes Into Preformed Capsids.” EMBO Journal 20: 3282–3291. [DOI] [PMC free article] [PubMed] [Google Scholar]
- Konstantinov, K. B. , and Cooney C. L.. 2015. “White Paper on Continuous Bioprocessing May 20‐21 2014 Continuous Manufacturing Symposium.” Journal of Pharmaceutical Sciences 104: 813–820. [DOI] [PubMed] [Google Scholar]
- Kuzmin, D. A. , Shutova M. V., Johnston N. R., et al. 2021. “The Clinical Landscape for AAV Gene Therapies.” Nature Reviews Drug Discovery 20: 173–174. [DOI] [PubMed] [Google Scholar]
- Lavado‐García, J. , Cervera L., and Gòdia F.. 2020. “An Alternative Perfusion Approach for the Intensification of Virus‐Like Particle Production in HEK293 Cultures.” Frontiers in Bioengineering and Biotechnology 8: 617. [DOI] [PMC free article] [PubMed] [Google Scholar]
- Lavado‐García, J. , Pérez‐Rubio P., Cervera L., and Gòdia F.. 2022. “The Cell Density Effect in Animal Cell‐Based Bioprocessing: Questions, Insights and Perspectives.” Biotechnology Advances 60: 108017. [DOI] [PubMed] [Google Scholar]
- Li, C. , and Samulski R. J.. 2020. “Engineering Adeno‐Associated Virus Vectors for Gene Therapy.” Nature Reviews Genetics 21: 255–272. [DOI] [PubMed] [Google Scholar]
- Liu, S. , Li J., Peraramelli S., et al. 2024. “Systematic Comparison of rAAV Vectors Manufactured Using Large‐Scale Suspension Cultures of Sf9 and HEK293 Cells.” Molecular Therapy 32: 74–83. [DOI] [PMC free article] [PubMed] [Google Scholar]
- McLean, J. P. , Sigler J. D., Plastaras C. T., Garvan C. W., and Rittenberg J. D.. 2009. “The Rate of Detection of Intravascular Injection in Cervical Transforaminal Epidural Steroid Injections With and Without Digital Subtraction Angiography.” PM&R 1: 636–642. [DOI] [PubMed] [Google Scholar]
- Mendes, J. P. , Fernandes B., Pineda E., et al. 2022. “AAV Process Intensification by Perfusion Bioreaction and Integrated Clarification.” Frontiers in Bioengineering and Biotechnology 10: 1020174. [DOI] [PMC free article] [PubMed] [Google Scholar]
- Moço, P. D. , Xu X., Silva C. A. T., and Kamen A. A.. 2023. “Production of Adeno‐Associated Viral Vector Serotype 6 by Triple Transfection of Suspension HEK293 Cells at Higher Cell Densities.” Biotechnology Journal 18: e2300051. [DOI] [PubMed] [Google Scholar]
- Moran, N. 2012. “First Gene Therapy Approved.” Nature Biotechnology 30: 1153. [DOI] [PubMed] [Google Scholar]
- Nadeau, I. , and Kamen A.. 2003. “Production of Adenovirus Vector for Gene Therapy.” Biotechnology Advances 20: 475–489. [DOI] [PubMed] [Google Scholar]
- Naso, M. F. , Tomkowicz B., Perry W. L., and Strohl W. R.. 2017. “Adeno‐Associated Virus (AAV) as a Vector for Gene Therapy.” BioDrugs 31: 317–334. [DOI] [PMC free article] [PubMed] [Google Scholar]
- National Center for Advancing Translational Sciences . 2024. Duchenne Muscular Dystrophy. https://rarediseases.info.nih.gov/diseases/6291/duchenne-muscular-dystrophy.
- Nguyen, T. N. , Sha S., Hong M. S., et al. 2021. “Mechanistic Model for Production of Recombinant Adeno‐Associated Virus Via Triple Transfection of HEK293 Cells.” Molecular Therapy—Methods & Clinical Development 21: 642–655. [DOI] [PMC free article] [PubMed] [Google Scholar]
- Ozturk, S. S. , Riley M. R., and Palsson B. O.. 1992. “Effects of Ammonia and Lactate on Hybridoma Growth, Metabolism, and Antibody Production.” Biotechnology and Bioengineering 39: 418–431. [DOI] [PubMed] [Google Scholar]
- Pereira, D. J. , McCarty D. M., and Muzyczka N.. 1997. “The Adeno‐Associated Virus (AAV) Rep Protein Acts as Both a Repressor and an Activator to Regulate AAV Transcription During a Productive Infection.” Journal of Virology 71: 1079–1088. [DOI] [PMC free article] [PubMed] [Google Scholar]
- Pérez‐Rubio, P. , Lavado‐García J., Bosch‐Molist L., Romero E. L., Cervera L., and Gòdia F.. 2024. “Extracellular Vesicle Depletion and UGCG Overexpression Mitigate the Cell Density Effect in HEK293 Cell Culture Transfection.” Molecular Therapy—Methods & Clinical Development 32: 101190. [DOI] [PMC free article] [PubMed] [Google Scholar]
- Rajendra, Y. , Kiseljak D., Baldi L., Hacker D. L., and Wurm F. M.. 2012. “Reduced Glutamine Concentration Improves Protein Production in Growth‐Arrested CHO‐DG44 and HEK‐293E Cells.” Biotechnology Letters 34: 619–626. [DOI] [PubMed] [Google Scholar]
- Redemann, B. E. , Mendelson E., and Carter B. J.. 1989. “Adeno‐Associated Virus Rep Protein Synthesis During Productive Infection.” Journal of Virology 63: 873–882. [DOI] [PMC free article] [PubMed] [Google Scholar]
- Rueden, C. T. , Schindelin J., Hiner M. C., et al. 2017. “ImageJ2: ImageJ for the Next Generation of Scientific Image Data.” BMC Bioinformatics 18: 529. [DOI] [PMC free article] [PubMed] [Google Scholar]
- Samulski, R. J. , and Muzyczka N.. 2014. “AAV‐Mediated Gene Therapy for Research and Therapeutic Purposes.” Annual Review of Virology 1: 427–451. [DOI] [PubMed] [Google Scholar]
- Schmidt, M. , Afione S., and Kotin R. M.. 2000. “Adeno‐Associated Virus Type 2 Rep78 Tnduces Apoptosis Through Caspase Activation Independently of p53.” Journal of Virology 74: 9441–9450. [DOI] [PMC free article] [PubMed] [Google Scholar]
- Schwake, G. , Youssef S., Kuhr J.‐T., et al. 2010. “Predictive Modeling of Non‐Viral Gene Transfer.” Biotechnology and Bioengineering 105: 805–813. [DOI] [PubMed] [Google Scholar]
- Sha, S. , Maloney A. J., Katsikis G., et al. 2021. “Cellular Pathways of Recombinant Adeno‐Associated Virus Production for Gene Therapy.” Biotechnology Advances 49: 107764. [DOI] [PubMed] [Google Scholar]
- Siegwart, P. , Cote J., Male K., Luong J., Perrier M., and Kamen A.. 1999. “Adaptive Control at Low Glucose Concentration of HEK‐293 Cell Serum‐Free Cultures.” Biotechnology Progress 15: 608–616. [DOI] [PubMed] [Google Scholar]
- Smalley, E. 2017. “First AAV Gene Therapy Poised for Landmark Approval.” Nature Biotechnology 35: 998–999. [DOI] [PubMed] [Google Scholar]
- Sokabe, M. , and Fraser C. S.. 2019. “Toward a Kinetic Understanding of Eukaryotic Translation.” Cold Spring Harbor Perspectives in Biology 11: a032706. [DOI] [PMC free article] [PubMed] [Google Scholar]
- Srinivasan, P. , Canova C. T., Sha S., et al. 2024. “Multidose Transient Transfection of Human Embryonic Kidney 293 Cells Modulates Recombinant Adeno‐Associated Virus2/5 Rep Protein Expression and Influences the Enrichment Fraction of Filled Capsids.” Biotechnology and Bioengineering 121: 3694–3714. [DOI] [PubMed] [Google Scholar]
- Trempe, J. P. , and Carter B. J.. 1988. “Regulation of Adeno‐Associated Virus Gene Expression in 293 Cells: Control of mRNA Abundance and Translation.” Journal of Virology 62: 68–74. [DOI] [PMC free article] [PubMed] [Google Scholar]
- Wagner, C. , Fuchsberger F. F., Innthaler B., Lemmerer M., and Birner‐Gruenberger R.. 2023. “Quantification of Empty, Partially Filled and Full Adeno‐Associated Virus Vectors Using Mass Photometry.” International Journal of Molecular Sciences 24: 11033. [DOI] [PMC free article] [PubMed] [Google Scholar]
- Walther, J. , Lu J., Hollenbach M., et al. 2019. “Perfusion Cell Culture Decreases Process and Product Heterogeneity in a Head‐To‐Head Comparison With Fed‐Batch.” Biotechnology Journal 14: e1700733. [DOI] [PubMed] [Google Scholar]
- Wang, D. , Tai P. W. L., and Gao G.. 2019. “Adeno‐Associated Virus Vector as a Platform for Gene Therapy Delivery.” Nature Reviews Drug Discovery 18: 358–378. [DOI] [PMC free article] [PubMed] [Google Scholar]
- Wang, L. , Chang C.‐C., Sylvers J., and Yuan F.. 2021. “A Statistical Framework for Determination of Minimal Plasmid Copy Number Required for Transgene Expression in Mammalian Cells.” Bioelectrochemistry 138: 107731. [DOI] [PMC free article] [PubMed] [Google Scholar]
- Wright, J. 2014. “Product‐Related Impurities in Clinical‐Grade Recombinant AAV Vectors: Characterization and Risk Assessment.” Biomedicines 2: 80–97. [DOI] [PMC free article] [PubMed] [Google Scholar]
- Yuan, W. , and Parrish C. R.. 2001. “Canine Parvovirus Capsid Assembly and Differences in Mammalian and Insect Cells.” Virology 279: 546–557. [DOI] [PubMed] [Google Scholar]
Associated Data
This section collects any data citations, data availability statements, or supplementary materials included in this article.
Supplementary Materials
Supplementary Information
Data Availability Statement
The data that support the findings of this study are available from the corresponding author, Richard D. Braatz, upon reasonable request.