

Abstract
Considering diversity when designing and conducting research is fundamental to the responsible conduct of research and ensures that outputs from scientific research are reproducible, minimize bias and enable everyone within society the opportunity to benefit. Therefore, health and biomedical research should include consideration of diversity and inclusion in the way studies are designed and conducted. An evaluation of health researchers’ approaches to diversity was undertaken to generate evidence to inform research policy development by the UK Medical Research Council (MRC). Seven hundred and seventy-two researchers responded to an anonymized public survey about diversity and inclusion in research design and 590 applications for research funding were evaluated. Fifty per cent of survey respondents undertaking human participant research reported taking diversity, usually age and sex, into account. Although 43% of animal researchers reported using females and males, only 28% of grant applications demonstrated this. Our findings demonstrate that many researchers do not routinely consider diversity when designing research. Furthermore, we identified a gap between what animal researchers reported doing and what was evident in funding applications. Informed by this analysis, MRC implemented a new policy requiring researchers to demonstrate how they embed diversity and inclusion in research design. This survey provides a benchmark for evaluating policy impact.
Keywords: diversity, inclusion, responsible conduct of research, research policy
1. Introduction
There is increasing recognition within health and biomedical research of the need to consider diversity and inclusion in the way in which studies are designed and conducted, for example, in recruiting participants, selecting animal subjects and deciding how analyses are carried out. A key driver for this growing awareness of the importance of ‘inclusive research design’ is the reports of research bias when diversity is ignored. For example, a US Government Accountability Office review in 2001 reported that, despite having regulations requiring proportional representation of sexes in clinical trials in the US since 1993, eight of ten drugs that were withdrawn from the US market by the Federal Drug Administration posed greater health risks to women than men [1]. More recently, the COVID pandemic has had a disproportionate impact on minority ethnic communities, highlighting the importance of a focus on ethnic diversity when undertaking clinical trials into prevention and treatment. Gendered Innovations [2], a Stanford University-based initiative to promote gender and diversity balance in research and innovation, has cited many similar case studies from across different scientific disciplines, including ‘male’ crash test dummies that cannot predict injury in females [3] and facial recognition algorithms that are racially biased [4].
Within preclinical research, concerns have also been raised about sex bias [5,6], failures of translation from animal models into effective clinical applications [7] and a lack of information about donor sex to support the interpretation of cell-based experiments [8,9]. Historically, the reluctance to use female animals was based on concerns about variability caused by the oestrous cycle, however, a meta-analysis has demonstrated that female mice show no more variability than males (and in some cases less) and that there is rarely any need to control for reproductive cycle [10]. Understanding the impact of sex is particularly relevant to clinical therapeutic uses arising from cell-based research, as better outcomes may result from matching the sex of donor and recipient in stem cell transplantation or preferentially using female stem cells over male to treat specific diseases [11–13].
Diversity and inclusion in research design and conduct are attaining greater importance as a dimension of responsible conduct of research, which focuses on the process of how research is carried out, as well as the benefit it brings to wider society [14]. Internationally, research funders have begun developing policies to promote diversity and inclusion in the design and conduct of the studies they fund and to address concerns about the relevance of scientific outputs [15]. The European Commission has encouraged systematic consideration of sex and gender since 2003, and other funders have introduced similar policies on sex, gender and other diversity characteristics [16–19]. These policies cut across scientific disciplines [19]. In the UK, funders have been slower to address this issue, however, the Medical Research Council (MRC) Trials Methodology Hubs and National Institute for Health and Care Research (NIHR) INCLUDE Initiative developed the INCLUDE Ethnicity Framework for randomized trials in 2021 [20]. This led to the NIHR INCLUDE Project, which has produced a range of influential guidance and learning tools to improve the inclusion of underserved groups in clinical trials [21].
The MRC, a major public funder of biomedical and health research and innovation in the UK and part of UK Research and Innovation (UKRI), began developing a research policy on diversity and inclusion in the design of research, involving animal subjects, human participants and cells and tissues in 2021. To ensure that the policy was grounded in evidence, an analysis of funding applications submitted to the MRC was carried out, as well as a survey of the research community about current practice. Information was collected about diversity and inclusion throughout the research lifecycle, from design through participant recruitment or subject selection to the analytical approaches and methods for dissemination of findings. We present here findings from analyses of the survey and grant applications and outline how these have influenced subsequent research policy development and implementation aimed at improving research culture and the responsible conduct of research.
2. Material and methods
2.1. Analysis of grant applications submitted to MRC
Applications for research grants and fellowships submitted to MRC research funding boards and panels for decision meetings held between April and September 2020 (n = 590) were included in the analysis of diversity and inclusion within research proposals, regardless of whether the applications were successful in being awarded funding. Three hundred and seventy-seven grant applications (table 1) involved human participants, or their data were searched for any mention of sex, age, ethnicity and/or socio-economic status of research participants in the description of the research proposal. Socio-economic status was broadly defined to include characteristics such as educational attainment, employment or income. If the research proposal mentioned one of these diversity characteristics, then any statement explaining their relevance to the study design or how the researchers proposed to include diversity in their analysis was sought. Two hundred and thirty-three applications (table 2) used animal subjects and were searched for information about the sex of the animal to be used and for a statement explaining this choice.
Table 1.
Research involving human participants: analysis of grant applications and survey responses.
|
grant applications (n = 377) |
number of applications |
|
|---|---|---|
|
diversity characteristics addressed |
% of 377 |
|
|
diversity characteristic mentioned (at least one) |
284 |
75% |
|
diversity characteristic explained (at least one) |
194 |
51% |
|
analytical approach to diversity explained |
69 |
18% |
|
characteristics considered in design |
% of 284 |
|
|
sex |
256 |
90% |
|
age |
187 |
66% |
|
socio-economic position |
59 |
21% |
|
ethnicity |
26 |
9% |
|
characteristics considered in analysis |
% of 69 |
|
|
sex |
57 |
83% |
|
age |
52 |
75% |
|
socio-economic position |
34 |
49% |
|
ethnicity |
22 |
32% |
|
applicant gender |
number of applications |
N (%) mentioning diversity |
χ2 results |
|---|---|---|---|
|
applications by men |
219 |
159 (73%) |
χ2 = 2.13; p = 0.144 |
|
applications by women |
154 |
122 (79%) |
|
awarded applications only (n = 56) |
number of applications |
% of 56 |
χ2 results |
|---|---|---|---|
|
diversity characteristic mentioned |
44 |
79% |
χ2 = 0.37; p = 0.542 |
|
diversity characteristic explained |
24 |
43% |
|
survey respondents (n = 415; survey questions 2.2 to 2.7) |
||
|---|---|---|
|
diversity considered (at any research stage; survey question 2.2) |
||
|
always |
207 |
50% |
|
sometimes |
148 |
36% |
|
rarely |
37 |
9% |
|
never |
16 |
4% |
|
not answered |
7 |
2% |
|
when diversity was considered by respondents who always considered diversity (n = 207) (survey questions 2.3−2.6) |
always |
sometimes |
rarely |
never |
not answered |
|---|---|---|---|---|---|
|
in recruitment (question 2.3) |
111 (54%) |
77 (37%) |
7 (3%) |
4 (2%) |
8 (4%) |
|
in methods (question 2.4) |
94 (45%) |
86 (42%) |
9 (4%) |
12 (6%) |
6 (3%) |
|
in analysis (question 2.5) |
120 (58%) |
71 (34%) |
3 (1%) |
6 (3%) |
7 (4%) |
|
in reporting (question 2.6) |
108 (52%) |
84 (41%) |
4 (2%) |
4 (2% |
7 (3%) |
|
diversity characteristics considered by respondents who always considered diversity (n = 207) (survey question 2.7)a |
number of respondents |
% of 207* |
|---|---|---|
|
age |
200 |
97% |
|
sex/gender |
196 |
95% |
|
ethnicity/race |
155 |
75% |
|
socio-economic position |
112 |
54% |
|
disability |
49 |
24% |
This table presents an overview of the 377 grant applications that included human participant research and the survey responses provided by 392 respondents who undertook research with human participants. The diversity characteristics listed in relation to the grant applications (sex, age, socio-economic position and ethnicity) are those that were searched for within applications.
This part of the table only presents the survey responses for the 207 survey respondents who said they considered diversity always; we have excluded those who sometimes, rarely or never considered diversity or did not answer.
Table 2.
Research involving animals: analysis of grant applications and survey responses.
|
grant applications (total n = 233) |
number of applications |
|
|---|---|---|
|
sex specified (n = 118) |
% of 233 |
|
|
sex specified (male, female, both) |
103 |
44% |
|
will use all offspring of breeding programme (regardless of sex) |
15 |
6% |
|
of 103 applications not using all offspring: |
% of 103 |
|
|
both sexes |
65 |
63% |
|
female only |
20 |
19% |
|
male only |
18 |
17% |
|
differences by gender (n = 118*) |
number of applications |
N (%) using both sexes |
χ2 results |
|---|---|---|---|
|
applications by men |
74 |
51 (69%) |
χ2=1.09; p = 0.581 |
|
applications by women |
44 |
28 (64%) |
|
differences by application success (n = 118a) |
number of applications |
N (%) using both sexes |
χ2 results |
|---|---|---|---|
|
awarded applications |
15 |
11 (73%) |
χ2=0.41; p = 0.813 |
|
declined applications |
103 |
68 (66%) |
|
survey responses (n = 240) |
number of respondents |
|
|---|---|---|
|
respondents' approach to sex in the experimental design of animal studies (survey question 3.3) |
% of 240 |
|
|
use equal numbers of males and females |
103 |
43% |
|
use both sexes if relevant to the research question |
68 |
28% |
|
use both sexes to compare outcomes in males and females |
60 |
25% |
|
carry out a pilot study to test for sex differences and, if there are none, run the main experiment with one sex |
21 |
9% |
|
use equal numbers of males and females only if there is a literature precedent |
15 |
6% |
|
runs experiments in duplicate, in males then in females |
10 |
4% |
|
use one sex in all (or most) experiments |
75 |
31% |
|
respondents’ approach to analysis and reporting by sex (survey question 3.6) |
% of 240 |
|
|
reports the sex of the animals used in publications |
166 |
69% |
|
includes sex as a factor in the analysis |
80 |
33% |
|
only reports analyses by sex if a sex difference is found |
47 |
20% |
|
reports the results separately for each sex |
39 |
16% |
|
does not analyse or report by sex as only one sex used |
31 |
13% |
|
does not analyse or report by sex although both sexes used |
20 |
8% |
This table presents an overview of the 233 grant applications that included animal research and the survey responses provided by 240 respondents who undertook animal research.
118 applications specified the sex of the animals to be used or indicated all offspring would be used.
2.2. Survey
The cross-sectional online survey was developed by MRC policy staff and comprised six sections, each with 3–17 questions. As there were no existing UK research funder policies on inclusive research design, the survey was primarily designed to establish whether researchers reported considering diversity in any way, with further questions to understand how diversity was taken into account in analyses and to explore researchers’ views of the benefits and drawbacks of inclusive research design. Three of the sections covered awareness of existing diversity guidance, attitudes towards diversity in public involvement, and the role that funders should play in promoting inclusive research design. Three further sections were specifically targeted at research involving (a) animals, (b) human participants and (c) cell and tissue samples (electronic supplementary material, table S1). The online survey included multiple-choice questions, routing, pre-programmed answer fields (e.g. number, text, date) and restrictions on the length of free text to minimize entry errors.
An email invitation to complete the survey was extended to all MRC lead applicants of active or recently completed (within 5 years) funding awards, as well as staff at MRC-funded units, centres, institutes and research organizations receiving MRC funding. To ensure a broad range of responses from throughout the research community, the survey link was not restricted to MRC-funded researchers and was distributed to other UK funders, NHS research contacts, and other relevant organizations. The survey link was also disseminated via MRC newsletters and social media. The survey was open for one month, from 8 July to 8 August 2021, and data were held on a secure server. Respondents completed the survey anonymously, therefore, we could not implement any procedures to detect whether individuals responded more than once.
Of 1056 responses received, 284 were excluded because they were incomplete or the respondent had not consented to the processing of their data, thus 772 responses were included. In the analyses presented below, the denominator used is the number of respondents who completed the relevant section (figure 1).
Figure 1.
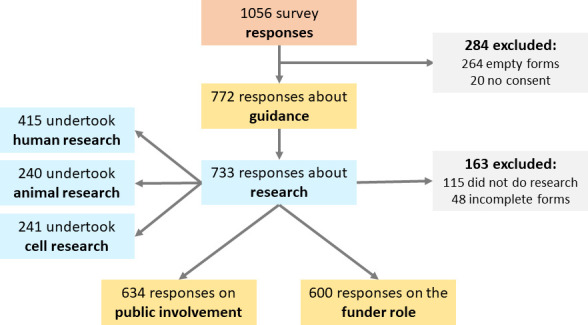
Survey responses and exclusions
2.3. Statistical analyses
Results are presented as counts and percentages. Chi-squared tests were used to explore relationships between respondent characteristics and the use of male and female animals or consideration of diversity in humans. Odds ratios (ORs) and 95% confidence intervals (95% CI) were estimated using logistic regression to determine whether any survey respondent characteristics influenced the use of female and male animals or consideration of diversity in humans. Analyses were undertaken in Stata 18.
3. Results
3.1. Grant applications
3.1.1. Human research applications
Of 377 applications involving human participants, 284 (75%) reported at least one diversity characteristic in the description of their research proposal, and 194 (51%) explained why they had chosen this characteristic or how they planned to use it in the analysis (table 1). Sex was most likely to be mentioned (n = 256), followed by age (n = 187), while socio-economic position (n = 26) and ethnicity (n = 59) were discussed in fewer than one-quarter of applications. Only 69 (18%) applications described how sex or other diversity characteristics would be managed in the analysis.
Of 56 applications that were awarded funding, 44 (79%) mentioned at least one diversity characteristic but only 24 (43%) provided an explanation for this choice (table 1). Grant applications that mentioned diversity did not appear to be more successful than those that did not (χ2 = 0.37; p = 0.542) and the gender of the grant applicant was not associated with the likelihood of mentioning a diversity characteristic (table 1; χ2 = 2.13; p = 0.144).
3.1.2. Animal research applications
Of 233 applications involving animals (table 2), 118 stated the sex to be used. Of these, 15 (6%) planned to use all offspring from their in-house breeding programmes while 103 (44%) specified the sex of the animals: 65 planned to use female and male animals, and 38 planned to use one sex, with similar numbers preferring male and female animals (n = 20 female, n = 18 male).
Grant applications that used both sexes did not appear to be more successful than those that used one sex only (table 2; χ2 = 0.41; p = 0.813), suggesting this was not a critical factor for those making the funding decision. The use of female and male animals in a study did not appear to be associated with the gender of the grant applicant (table 2; χ2 = 1.09; p = 0.581).
3.2. Survey results
3.2.1. Survey responses
Most survey respondents (n = 589) completed the demographic details section (table 3). Of these, 324 (55%) were women, 427 (72%) were of White/White British ethnicity and 40 (7%) had a disability. Most were aged 30−60 years (similar frequency for 30−44 years n = 214 [36%] and 45−60 years n = 218 [37%]). The majority were based in a university (n = 497; 84%). Survey respondents selected a career stage from a pre-specified list (heads of department; principal researchers; early career researchers; postdoctoral researchers; PhD students; other). For comparisons between career stages, we derived three groups of respondents (senior level; mid-/early career level; training level).
Table 3.
Characteristics of survey respondents.
|
characteristic |
number |
% of 589a |
|
|---|---|---|---|
|
gender |
women |
324 |
55% |
|
(survey question 7.5) |
men |
230 |
39% |
|
non-binary/other |
11 |
2% |
|
|
not stated (or missing data) |
24 |
4% |
|
|
age group |
18−29 years |
64 |
11% |
|
(survey question 7.6) |
30−44 years |
214 |
36% |
|
45−60 years |
218 |
37% |
|
|
over 60 years |
75 |
13% |
|
|
not stated (or missing data) |
18 |
3% |
|
|
ethnic group |
Asian/Asian British |
46 |
8% |
|
(survey question 7.7) |
black/black British |
27 |
5% |
|
mixed/multiple ethnic groups |
29 |
5% |
|
|
other ethnic group |
15 |
3% |
|
|
white/white British |
427 |
72% |
|
|
not stated (or missing data) |
45 |
8% |
|
|
disability |
yes |
40 |
7% |
|
(survey question 7.8) |
no |
528 |
90% |
|
not stated (or missing data) |
21 |
4% |
|
|
type of organisation |
university |
497 |
84% |
|
(survey question 7.2) |
NHS/health provider |
37 |
6% |
|
charity/non-governmental organisations |
21 |
4% |
|
|
contract research organisation |
10 |
2% |
|
|
industry |
5 |
1% |
|
|
other |
18 |
3% |
|
|
not stated (or missing data) |
1 |
<1% |
|
|
career level/job titleb |
head of department/senior level |
41 |
7% |
|
(survey question 7.1) |
principal investigator/researcher |
293 |
50% |
|
early career researcher |
64 |
11% |
|
|
postdoctoral researcher |
53 |
9% |
|
|
PhD student |
66 |
11% |
|
|
trial manager/co-ordinator |
33 |
6% |
|
|
other (e.g. technician, project manager) |
35 |
6% |
|
|
not stated (or missing data) |
4 |
<1% |
|
|
full-time or not |
full time |
513 |
87% |
|
(survey question 7.4) |
less than full time |
75 |
13% |
|
not stated |
1 |
<1% |
This table presents respondent characteristics.
Only 589 of 772 survey respondents provided demographic data.
To compare career stages, we created three groups (senior = Head of department/senior researcher; early/mid-career = principal investigator/researcher, early career researcher, postdoctoral researcher, trial managers/co-ordinators; training = PhD students) and then excluded the small ‘Other’ group as they were a heterogeneous and poorly defined category.
3.2.2. Awareness of existing guidance on diversity and inclusion
One-third (n = 244; 32%) of 772 survey respondents reported that they were ‘aware of guidance on diversity and inclusion in research’ (table 4). When asked to name specific examples, these included guidance on diversity in research teams and organizations, on recruiting research participants or public involvement partners and selecting animal subjects, as well as relating to experimental design approaches (electronic supplementary material, table S2). A higher percentage of senior researchers and heads of department were aware of guidance compared with those at earlier stages of their career: 54% at senior level, 36% at mid-/early career level and 15% at training level, respectively (table 5).
Table 4.
Respondents’ knowledge of existing guidance on diversity and inclusion in research design.
|
awareness of guidance (survey question 1.1) |
number |
% of 772 |
|---|---|---|
|
aware of guidance on diversity |
244 |
32% |
|
not aware of guidance on diversity |
523 |
68% |
|
not answered |
5 |
<1% |
|
awareness of guidance by career stage (survey questions 1.1, 7.1) |
number |
% of category |
|---|---|---|
|
senior (n = 41) |
22 |
54% |
|
mid-/early career (n = 443) |
158 |
36% |
|
training (n = 66) |
10 |
15% |
|
other (n = 35) |
10 |
29% |
|
not stated (n = 187) |
44 |
24% |
This table presents respondents’ answers to a survey question asking if they knew of guidance about diversity and inclusion in research design; results are presented for all survey respondents and by respondent career stage.
Career stages were grouped into the following: (i)Heads of department; principal researchers = senior. (ii) Early career researchers; postdoctoral researchers = mid-/early career. (iii) Training = PhD students.(iv) Other = any respondent who did not fit into the above categories.
Table 5.
Perceived role of funders in influencing diversity in research proposals (n = 600 respondents).
|
funders should develop research funding policy to influence: | ||
|---|---|---|
|
diversity in the design of research (survey question 6.1) |
diversity in research teams (survey question 6.2) |
|
|
very important |
347 |
242 |
|
somewhat important |
225 |
260 |
|
not important |
22 |
88 |
|
not answered (blank) |
6 |
10 |
|
funders should influence diversity in the design of research (survey questions 6.1, 7.5−7.7; n = 594a responses) | |||
|---|---|---|---|
|
number who responded |
N (%) stating that influencing diversity in research design is very or somewhat important (compared with not important) |
χ2 results |
|
|
gender |
women (n = 322) |
317 (98%) |
χ2 = 8.549; p = 0.003 |
|
men (n = 226) |
212 (94%) |
||
|
age group |
18−44 years (n = 276) |
268 (97%) |
χ2 =0.358; p = 0.550 |
|
45+years (n = 289) |
278 (96%) |
||
|
ethnic group |
white/white British (n = 422) |
408 (97%) |
χ2 = 2.024; p = 0.155 |
|
other ethnic groups (n = 116) |
115 (99%) |
||
|
funders should influence diversity in the research team (survey questions 6.2, 7.5−7.7; n = 590a responses) | |||
|---|---|---|---|
|
number who responded |
N (%) stating that influencing research team diversity is very or somewhat important (compared with not important) |
χ2 results |
|
|
gender |
women (n = 320) |
289 (90%) |
χ2 = 10.695; p < 0.001 |
|
men (n = 226) |
182 (81%) |
||
|
age group |
18−44 years (n = 277) |
248 (90%) |
χ2 = 5.235; p = 0.022 |
|
45+years (n = 286) |
237 (83%) |
||
|
ethnic group |
white/white British (n = 422) |
360 (85%) |
χ2 = 1.940; p = 0.164 |
|
other ethnic groups (n = 114) |
103 (90%) |
||
For 600 survey respondents who undertook all types of research, this table presents their views on how important it is for funders to enact policies about (i) increasing diversity in research design and conduct, and (ii) ensuring research is carried out by diverse teams. The variation in responses to these questions by respondent gender, age and ethnicity is shown.
Denominator excludes ‘Not answered (blank)’ responses, i.e. 6 of 600 respondents did not answer the question about diversity in the design of research, and 10 did not answer the questions about diverse research teams.
3.2.3. Role of funders in promoting diversity
Of 772 respondents to the survey, 639 (83%) considered that the primary responsibility for developing and disseminating guidance about diversity and inclusion in research design lay with research organizations, while 550 (71%) suggested it was funders and 543 (70%) research regulatory bodies (electronic supplementary material, table S3).
Six hundred survey respondents answered specific questions about the role of funders, of whom 572 (95%) thought it was important for funders to have a role in influencing diversity in research design and 502 (84%) considered it important for funders to influence the diversity of research teams (table 5). Women were significantly more likely to consider funder influence on diversity in research design very or somewhat important compared with men (table 5; 98%, 94%, respectively; χ2 = 8.549, p = 0.003) but there was no significant difference in response by age group or ethnicity (table 5; age group 18−44 years versus 45+ years χ2 = 0.358; p = 0.550; ethnicity White/White British versus all other χ2 = 2.024; p = 0.155). To support applicants and peer reviewers, respondents also favoured written guidance on inclusive research design or a joint approach of guidance and training over training alone (electronic supplementary material, table S4).
Most respondents (84%) also indicated that it was important for funders to consider the diversity of the research team when funding research proposals (table 5). Women were significantly more likely to consider funder influence on research team diversity very or somewhat important compared with men (90% and 80%, respectively; χ2 = 10.695, p < 0.001), as were respondents aged under 45 years compared with those who were 45 years or older (table 5; age group 18−44 years versus 45+ years χ2 = 5.235; p = 0.022) but there were no significant differences by ethnic group (table 5; ethnicity White/White British versus all other χ2 = 1.940; p = 0.164).
3.2.4. Diversity in public involvement and engagement
Of 634 respondents who responded to a question about public involvement and engagement (PIE), 206 (32%) always involved patients or the public, 227 (36%) sometimes, 37 (6%) rarely and 23 (4%) never undertook PIE or stated that it was not applicable to their research. Of those who answered this question, 462 (73%) attempted to include diverse or underserved groups (electronic supplementary material, table S5).
3.2.5. Respondents who undertook research
We excluded 163 respondents who did not undertake human, animal or cell research, thus 570 answered questions about their research.
3.2.6. Research involving human participants and data
There were 415 respondents who undertook research involving human participants and/or their data (figure 1). Half (n = 207; 50%) always considered diversity in their research, while 148 (36%) sometimes, 37 (9%) rarely and 16 (4%) never considered it (table 1).
Of 207 respondents who reported always considering diversity, 200 (97%) respondents considered age, 196 (95%) sex/gender, 155 (75%) ethnicity/race, 112 (54%) socio-economic position and 49 (24%) disability (table 1). These respondents also considered diversity at different stages of the research lifecycle: 111 (54%) always considered diversity when recruiting participants, 94 (45%) always adjusted their methods, and 120 (58%) always adjusted their analyses to account for diversity, and 108 (52%) always reported their results against different diversity characteristics.
The respondent characteristics of gender, age and career stage were not associated with whether respondents always considered diversity (electronic supplementary material, table S8A).
3.2.7. Research involving animals
Of 240 survey respondents who carried out animal research, there were 124 whose research also involved human participants (table 2).
Male and female animals were used in research undertaken by 103 (43%) respondents, and the choice not to use both female and male animals was influenced by factors such as the research question, pilot studies and precedents in the literature (table 2). Most researchers (n = 166; 69%) reported the sex of the animals they used in their papers, but a substantial minority (n = 47; 20%) only did so if they found a sex difference. Only 80 (33%) researchers routinely included sex as a factor in their analysis and 20 (8%) did not analyse or report their findings by sex despite using males and females in their experiments.
The respondent characteristics of gender, age and career stage were not associated with whether respondents used female and male animals or only one sex (electronic supplementary material, table S8B).
Researchers who used only one sex of animal (n = 75) did so (i) ‘to reduce animal numbers’ (n = 18) or (ii) because they were ‘researching a disease or mechanism present in only one sex’ (n = 15; table 6). They were as likely to use females as males (females n = 27; males n = 22; not specified n = 26).
Table 6.
Survey respondents’ reasons for only using one sex of animals (n = 75).
|
reasons givena (survey question 3.4) |
number of respondents |
% of 75 |
|---|---|---|
|
to reduce animal numbers |
18 |
24% |
|
researching a disease/mechanism present in one sex only |
15 |
20% |
|
to reduce costs |
11 |
15% |
|
to keep the analysis simple |
9 |
12% |
|
to avoid variability due to reproductive cycles |
8 |
11% |
|
there is a literature precedent to use only one sex |
7 |
9% |
|
preferred model only suitable in one sex |
7 |
9% |
|
assumption that sex will have negligible effect |
6 |
8% |
For 75 survey respondents who undertook research with animals and used only one sex of animal, this table shows the reasons why they chose to do this and the percentage of respondents who selected each reason.
Respondents selected reasons from a predefined list or chose ‘Other’ (table 4). Respondents could select more than one reason.
Respondents also reported how they manage other aspects of animal diversity, such as the life stage and the female reproductive or oestrus cycle (electronic supplementary material, tables S6 and S7). About half always used adult animals (n = 116; 48%). The most common reason for using animals of a life stage other than adult was because it was ‘relevant to the research question’ (n = 100; 42%) and a third based their choice of life stage on when the phenotype was expressed (n = 79; 33%).
Many respondents using female animals did not consider reproductive cycle in their experimental design (n = 91; 38%). Some respondents stated that it was not important (n = 38; 16%), and others were concerned about adding logistic complexity (n = 59; 25%). A small number of researchers (n = 20; 8%) restricted their experiments to male animals to avoid needing to control for the reproductive cycle (electronic supplementary material, table S7).
3.2.8. In vitro studies using cells and tissues
Of 241 respondents who undertook in vitro studies using cells and tissues, 92 (38%) only used human cells, 19 (8%) only used animal cells, and 130 (54%) used both human and animal cells (table 7). One-quarter of respondents (n = 60; 25%) did not take account of cell donor diversity in their research.
Table 7.
In vitro research using cells and tissues (survey responses).
|
number of respondents |
% of 241 |
|||||
|---|---|---|---|---|---|---|
|
sources of cells and tissues used by respondents (survey question 4.1) |
||||||
|
human only |
92 |
38% |
||||
|
animal only |
19 |
8% |
||||
|
human and animal |
130 |
54% |
||||
|
researchers: (survey questions 4.2−4.5) |
always |
sometimes |
rarely |
never |
not answered |
|
|
consider cell donor sex/diversity in their experimental design |
49 |
65 |
47 |
60 |
20 |
|
|
include donor sex/diversity in the analysis |
39 |
64 |
52 |
65 |
21 |
|
|
report donor sex/diversity characteristics in publications |
54 |
62 |
37 |
67 |
21 |
|
|
report results by sex/diversity characteristics |
43 |
71 |
39 |
66 |
22 |
|
|
diversity characteristics taken into account by 161 respondents who always, sometimes or rarely consider diversity when undertaking in vitro research; survey question 4.7) |
number of respondents |
% of 161 |
||||
|
donor sex |
107 |
66% |
||||
|
donor age (or life stage) |
100 |
62% |
||||
|
donor race/ethnicity (humans) |
56 |
35% |
||||
|
donor strain/genotype (animals) |
78 |
48% |
||||
This table describes survey responses by 241 researchers who undertook in vitro research using cells and tissues, including (i) whether they used human or animal cells and tissues, (ii) their views on the importance of considering diversity (represented by the sex, age and ethnicity/genotype of the cell donor) at different stages of the research lifecycle and (iii) which characteristics they were most likely to consider.
Of 161 respondents who considered diversity ‘always, sometimes or rarely’ when designing in vitro experiments (table 7), 107 (66%) considered donor sex, 100 (62%) donor age, 56 (35%) donor race/ethnicity (in humans) and 78 (48%) donor strain/genotype (in animals).
3.2.9. Benefits and barriers to considering diversity in research design
Respondents undertaking research with human participants highlighted the key benefits of taking account of diversity (table 8) as an increased likelihood of their findings being relevant (85%), avoiding bias (81%), improving reproducibility (41%), and generating novel findings or hypotheses (31%). Researchers who undertook research with animals or cells reported and ranked the benefits in a very similar way (table 8). A minority of respondents claimed there were no benefits to considering diversity in research, however, many noted important barriers, including increased complexity of the study design (mentioned by 47% in research with human participants, 43% for animal research and 54% for cell research), increased research costs (40%, 56%, 37%, respectively) and greater complexity of analyses (30%, 22%, 9%, respectively). Difficulties in recruiting participants were a main concern for over half of researchers working with humans, while the increased cost of animals and their care and difficulty with obtaining diversity information for cell or tissue samples sourced from commercial suppliers were of greater concern for animal and cell researchers, respectively.
Table 8.
Benefits and barriers to taking account of diversity in the design and conduct of research.
|
respondents – human research (n = 415) |
respondents – animal researchb (n = 240) |
respondents – cell research (n = 241) |
|
|---|---|---|---|
|
benefits |
survey question 2.8 |
survey question 3.7 |
survey question 4.8 |
|
more likely to detect sex-specific differences |
— |
139 (58%) |
— |
|
findings are more likely to be relevant |
354 (85%) |
114 (47%) |
— |
|
avoidance of bias |
337 (81%) |
133 (55%) |
— |
|
increases translation to clinical research |
— |
95 (40%) |
134 (56%) |
|
increased reproducibility of results |
172 (41%) |
92 (38%) |
132 (55%) |
|
more likely to generate novel hypotheses/findings |
129 (31%) |
59 (25%) |
113 (47%) |
|
increased interest in my results |
115 (28%) |
36 (15%) |
52 (22%) |
|
easier to recruit participants |
36 (9%) |
— |
— |
|
easier to publish findings |
33 (8%) |
23 (10%) |
13 (5%) |
|
easier to get ethics or Home Office approval |
— |
24 (10%) |
— |
|
representative of the real worlda |
15 (4%) |
— |
— |
|
addresses social justice issuesa |
13 (3%) |
||
|
exploring diversity is relevant to my research topicb |
12 (3%) |
||
|
no benefits |
6 (1%) |
— |
— |
|
explores genetic differences that are importantb |
3 (<1%) |
|
drawbacks and barriers |
survey question 2.9 |
survey question 3.8 |
survey question 4.9 |
|---|---|---|---|
|
harder to recruit participants |
231 (56%) |
— |
— |
|
concerns that using a larger number of animals would conflict with 3Rs principles |
— |
111 (46%) |
— |
|
more complex study design |
193 (47%) |
103 (43%) |
129 (54%) |
|
increased cost of studies |
164 (40%) |
134 (56%) |
89 (37%) |
|
more difficult to analyse |
125 (30%) |
54 (22%) |
21 (9%) |
|
harder to source biological samples or tissues |
109 (26%) |
— |
117 (49%) |
|
harder to compare outputs to previous studies/deviates from published precedents |
105 (25%) |
46 (19%) |
22 (9%) |
|
preferred model only suited to single sex |
— |
34 (14%) |
— |
|
decreased reproducibility of results |
29 (7%) |
23 (10%) |
— |
|
no drawbacks |
41 (10%) |
16 (7%) |
41 (17%) |
This table lists the benefits and barriers to taking account of diversity in research that survey respondents identified. The benefits and barriers associated with human, animal and in vitro research are compared in the three columns and listed in order from most frequently to least frequently mentioned by respondents.
For animal research, separate questions were asked about the benefits and barriers to including sex in the design and analysis of research. Results are shown for the questions about sex but not age.
These benefits were not part of the original list of options in the survey but were suggested by >1 respondent under ‘Other benefits’.
4. Discussion
Around half of those carrying out research with human participants reported always taking diversity into account, and this was supported by an analysis of MRC grant applications, which mentioned diversity characteristics in 75% of proposed research. Age and sex were the diversity characteristics most likely to be included in the study proposal, with ethnicity, socio-economic position and disability less often mentioned. Among those doing animal research, although 43% of researchers reported using males and females in their studies, only 28% discussed this in grant applications. Overall, our analysis suggested that diversity is often not explicitly considered in the design of research proposals. Survey respondents expressed concerns about the potential increased costs of inclusive research design. A high percentage (72%) of survey respondents stated that funders should take responsibility for providing written guidance on including diversity in research design. Taken together, this evidence underlines the need for funders to use policy and guidance effectively to promote inclusive approaches to the design and conduct of health and biomedical research, to enhance reproducibility, avoid bias and ensure research outputs are relevant to social needs.
4.1. Comparison with previous studies
Policies on inclusive research design have been introduced and evaluated by other funders, including in Canada and the US. However, we identified only a limited number of previous studies that have evaluated diversity within grant applications or assessed researcher views of inclusive research practice; these reported results were largely consistent with our findings. One survey, undertaken two years after the implementation of the US National Institutes of Health (NIH) ‘Sex as a Biological Variable’ (SABV) in 2015, collected the views of members of NIH funding panels (study-sections) [22]. The authors noted that 76% of researchers always reported sex in their publications, which was similar to our survey findings for researchers using animals (69%), although the studies are not directly comparable as the US study was undertaken after, and our study before, policy implementation. The key benefits of an inclusive research design identified in the US survey were improved translation and reproducibility, while key concerns were potential increases in research costs and an increase in the number of animals used. In our survey, a potential increase in the number of animals required was also frequently raised as a concern despite good evidence that optimising statistical methods can avoid this [6]. Researchers in our survey were also apprehensive about the potential increase in research costs, suggesting this is an important issue that funders should address in their applicant guidance.
Two years after the implementation of the NIH SABV policy, Freeman and co-authors assessed the impact on study proposals involving human participation within one research organization [23]. Although 69% of NIH applicants mentioned the sex/gender of participants, only 14% explained their choice and 2% proposed to analyse sex differences. This contrasts with our findings that, without a policy in place, 50% of MRC applications explained the choice of at least one diversity characteristic. Our findings may differ due to the types of applications reviewed, the role of the host institution, or reflect a marked increase in awareness of the importance of considering sex and gender over recent years.
Various authors have reported that research teams led by women are significantly more likely to take account of diversity, including analysing data by sex or reporting the sex of animals in their publications [24–26], however, we identified no significant difference by gender of the research team lead. Among our survey respondents, women were significantly more likely to consider it important for funders to promote diversity in research design compared with men.
The Canadian Institutes for Health Research (CIHR) implemented a policy on sex and gender in 2010 and included new questions in application forms that asked applicants to confirm they had addressed these issues. Between 2010 and 2012, the percentage of applicants confirming they had addressed sex/gender increased from 26% to 48%, suggesting a significant positive impact of the new policy [27]. A qualitative study of the NIH SABV policy also reported a small non-significant increase from 2016 to 2017 in the percentage of researchers who considered a sex and gender policy important and thought that it would improve reproducibility [22].
4.2. Strengths and limitations
We received a large number of responses to the survey, and although most respondents were from UK universities, they were diverse in terms of gender, age, ethnic group and career stage. As a group, respondents were representative of the researchers who receive MRC funding and will be influenced by future policy. As we did not know how many people had received the survey link, we could not calculate the response rate. The survey was completed anonymously therefore it was possible for an individual to complete the survey more than once.
The survey had several sections but not all were completed by, or relevant to, every respondent, which resulted in a varying proportion of missing data within each section. Nevertheless, the overall completion rate was good, with several hundred responses to each section. We relied on self-completion of demographic information to enable us to draw comparisons between responses from individuals by gender, age and career stage, thus missing data in this section may have limited our ability to identify significant differences between respondent subgroups.
The survey was short in order to optimize completion rates and focused on capturing whether researchers demonstrated a basic level of awareness of diversity and inclusive research practice. A limitation of this approach was that the survey did not explore the different ways in which diversity was taken into account by researchers, from inclusive recruitment to analytic approaches. This survey, therefore, provides a foundation for understanding researcher perspectives on diversity and inclusive research, although further work is needed to fully understand how inclusive approaches are used within current research practice.
The analysis of MRC grants only included applications considered for funding between April and September 2020 however we included applications to all MRC research boards and panels and thus analysed a varied range of studies from basic discovery, preclinical and translational studies to data science, clinical and population health research. Funding rounds from this period were selected as they were the most recent rounds from each funding opportunity that had complete information about the funding decision at the time of analysis. These included training fellowship applications from junior applicants. Our analysis of grant proposals was limited to the information that was available in application forms, so it primarily reflects explicit mention of diversity. Various applicants explained why specific characteristics were relevant to their study proposal and how they would ensure inclusive recruitment or referred to analysis and reporting, however, the detail provided was limited to what was required for the application process therefore insufficient for us to explore different approaches to analysis. It is possible that more applicants took diversity into account but did not state this in their application as they did not consider it relevant or did not expect to be assessed on this aspect.
5. Conclusion
Embedding diversity and inclusion in the design and conduct of research enhances the quality of scientific research, improving the experimental design, making research more relevant to the needs of society, increasing opportunities for new discoveries and reducing the likelihood of bias [28]. Inclusive research design is part of the wider framework of the responsible conduct of research and crucial to enhancing public trust in scientific aims and outputs.
As Hunt et al. have highlighted, 'funding agencies are one of the three pillars of the science infrastructure that need to coordinate [diversity and inclusion] policies to achieve excellence in science’ [15]. It is therefore an important responsibility of funders to address inequity and bias [29], and to promote scientific rigour and reproducibility, through implementing research funding policy and strategy that nurtures inclusive research practice.
Following recommendations from an expert working group who considered the evaluation reported in this paper alongside other evidence, the MRC produced guidance on the use of both sexes in animal research in 2022 [30] and launched a new policy on Embedding Diversity in Research Design in 2023. The findings reported in this paper have established a benchmark against which changes to research culture and practice in the light of the new MRC research policy will be evaluated.
Acknowledgements
We are grateful to the NC3Rs and to the members of the MRC working groups on animal and human participant research who critically reviewed these analyses and provided essential support for the development of the MRC policy on Embedding diversity in research design and guidance on sex in experimental design of research involving animals. We also thank the individuals within the research community who responded to our survey.
Contributor Information
Stella A. Child, Email: stella.a.child@gmail.com.
Christina Mulligan, Email: MulliganCM@cardiff.ac.uk.
Ivan Pavlov, Email: Ivan.Pavlov@mrc.ukri.org.
Simone Bryan, Email: Simone.Bryan@mrc.ukri.org.
Leah Li, Email: leah.li@ucl.ac.uk.
Rachel Louise Knowles, Email: rachel.knowles@ucl.ac.uk.
Ethics
This paper is based on an anonymous public survey and analysis of grant applications, so research ethics approval was not sought. Survey respondents were asked to consent to their answers being used in our evaluation and report. Answers from any respondents who did not give consent were excluded from our analyses (figure 1).
Data accessibility
Individual-level data from the survey cannot be provided as this could be disclosive of the identity of respondents or their institutions. The article and supplementary files include aggregated tables which contain all of the data to support the findings reported. The original dataset is held in the MRC Science Archive and can be requested by application to the MRC Data Access Committee [31].
Child, Stella; Mulligan, Christina; Pavlov, Ivan; Bryan, Simone; Li, Leah; Knowles, Rachel (2025). CROSS checklist: Developing the evidence base to inform policy on inclusive research design.docx. figshare. Online resource [32].
Supplementary material is available online [33].
Declaration of AI use
We have not used AI-assisted technologies in creating this article.
Authors’ contributions
S.A.C.: conceptualization, data curation, formal analysis, methodology, project administration, visualization, writing—original draft, writing—review and editing; C.M.: conceptualization, data curation, formal analysis, methodology, project administration, visualization, writing—review and editing; I.P.: conceptualization, methodology, supervision, writing—review and editing; S.B.: conceptualization, methodology, supervision, writing—review and editing; L.L.: writing—review and editing, formal analysis; R.L.K.: conceptualization, formal analysis, methodology, supervision, visualization, writing—original draft, writing—review and editing.
All authors gave final approval for publication and agreed to be held accountable for the work performed therein.
Conflict of interest declaration
All authors, except for Leah Li, were employees of the Medical Research Council (MRC) when the research was undertaken. The authors have no other competing interests to declare.
Funding
No funding has been received for this article.
References
- 1. US Government Accountability Office (GAO) . 2024. Drug safety: most drugs withdrawn in recent years had greater health risks for women. Report GAO-01-286R. See https://www.gao.gov/products/gao-01-286r.
- 2. Stanford University . 2024. Gendered innovations. See https://genderedinnovations.stanford.edu/ (accessed 2 March 2024).
- 3. Linder A, Svedberg W. 2019. Review of average sized male and female occupant models in European regulatory safety assessment tests and European laws: gaps and bridging suggestions. Accid. Anal. Prev. 127, 156–162. ( 10.1016/j.aap.2019.02.030) [DOI] [PubMed] [Google Scholar]
- 4. Buolamwini J, Gebru T. 2018. Gender shades: intersectional accuracy disparities in commercial gender classification. Proc. Mach. Learn. Res 81, 77–91. https://proceedings.mlr.press/v81/buolamwini18a [Google Scholar]
- 5. Morris H, Denver N, Gaw R, Labazi H, Mair K, MacLean MR. 2021. Sex differences in pulmonary hypertension. Clin. Chest Med. 42, 217–228. ( 10.1016/j.ccm.2020.10.005) [DOI] [PubMed] [Google Scholar]
- 6. Karp NA, Reavey N. 2019. Sex bias in preclinical research and an exploration of how to change the status quo. Br. J. Pharmacol. 176, 4107–4118. ( 10.1111/bph.14539) [DOI] [PMC free article] [PubMed] [Google Scholar]
- 7. Beery AK, Zucker I. 2011. Sex bias in neuroscience and biomedical research. Neurosci. Biobehav. Rev. 35, 565–572. ( 10.1016/j.neubiorev.2010.07.002) [DOI] [PMC free article] [PubMed] [Google Scholar]
- 8. Taylor KE, Vallejo-Giraldo C, Schaible NS, Zakeri R, Miller VM. 2011. Reporting of sex as a variable in cardiovascular studies using cultured cells. Biol. Sex Differ. 2, 11. ( 10.1186/2042-6410-2-11) [DOI] [PMC free article] [PubMed] [Google Scholar]
- 9. Shah K, McCormack CE, Bradbury NA. 2014. Do you know the sex of your cells? Am. J. Physiol. Cell Physiol. 306, C3–C18. ( 10.1152/ajpcell.00281.2013) [DOI] [PMC free article] [PubMed] [Google Scholar]
- 10. Prendergast BJ, Onishi KG, Zucker I. 2014. Female mice liberated for inclusion in neuroscience and biomedical research. Neurosci. Biobehav. Rev. 40, 1–5. ( 10.1016/j.neubiorev.2014.01.001) [DOI] [PubMed] [Google Scholar]
- 11. Pond GR, Lipton JH, Messner HA. 2006. Long-term survival after blood and marrow transplantation: Comparison with an age- and gender-matched normative population. Biol. Blood Marrow Transplant. 12, 422–429. ( 10.1016/j.bbmt.2005.11.518) [DOI] [PubMed] [Google Scholar]
- 12. Gahrton G, et al. 2005. The impact of donor gender on outcome of allogeneic hematopoietic stem cell transplantation for multiple myeloma: reduced relapse risk in female to male transplants. Bone Marrow Transplant. 35, 609–617. ( 10.1038/sj.bmt.1704861) [DOI] [PubMed] [Google Scholar]
- 13. Lee SJ, et al. 2007. High-resolution donor-recipient HLA matching contributes to the success of unrelated donor marrow transplantation. Blood 110, 4576–4583. ( 10.1182/blood-2007-06-097386) [DOI] [PubMed] [Google Scholar]
- 14. Field SM, Thompson J, de Rijcke S, Penders B, Munafò MR. 2024. Exploring the dimensions of responsible research systems and cultures: a scoping review. R. Soc. Open Sci. 11, 230624. ( 10.1098/rsos.230624) [DOI] [PMC free article] [PubMed] [Google Scholar]
- 15. Hunt L, Nielsen MW, Schiebinger L. 2022. A framework for sex, gender, and diversity analysis in research. Science 377, 1492–1495. ( 10.1126/science.abp9775) [DOI] [PubMed] [Google Scholar]
- 16. National Institutes of Health (NIH) . 2024. Consideration of sex as a biological variable in NIH-funded research. See https://orwh.od.nih.gov/sites/orwh/files/docs/NOT-OD-15-102_Guidance.pdf (accessed 2 March 2024).
- 17. European Commission (EC) . 2024. Gender equality in research and innovation. See https://research-and-innovation.ec.europa.eu/strategy/strategy-2020-2024/democracy-and-rights/gender-equality-research-and-innovation_en (accessed 2 March 2024).
- 18. Health Canada . 2023. Health portfolio sex- and gender-based analysis plus policy: advancing equity, diversity and inclusion. See https://www.canada.ca/en/health-canada/corporate/transparency/heath-portfolio-sex-gender-based-analysis-policy.html (accessed 8 May 2023).
- 19. Deutsche Forschungsgemeinschaft (DFG) . 2023. Relevance of sex, gender and diversity in research. See https://www.dfg.de/en/research_funding/principles_dfg_funding/diversity_dimensions/index.html (accessed 8 May 2023).
- 20. Treweek S, et al. 2021. Developing the INCLUDE Ethnicity Framework—a tool to help trialists design trials that better reflect the communities they serve. Trials 22, 337. ( 10.1186/s13063-021-05276-8) [DOI] [PMC free article] [PubMed] [Google Scholar]
- 21. National Institute for Health Research (NIHR) . 2023. Improving inclusion of under-served groups in clinical research: guidance from INCLUDE project. See https://www.nihr.ac.uk/documents/improving-inclusion-of-under-served-groups-in-clinical-research-guidance-from-include-project/25435 (accessed 8 May 2023).
- 22. Woitowich N, Woodruff T. 2019. Implementation of the NIH sex-inclusion policy: attitudes and opinions of study section members. J. Women’s Health 28, 9–16. ( 10.1089/jwh.2018.7396) [DOI] [PubMed] [Google Scholar]
- 23. Freeman A, Stanko P, Berkowitz LN, Parnell N, Zuppe A, Bale TL, Ziolek T, Epperson CN. 2017. Inclusion of sex and gender in biomedical research: survey of clinical research proposed at the University of Pennsylvania. Biol. Sex Differ. 8, 22. ( 10.1186/s13293-017-0139-5) [DOI] [PMC free article] [PubMed] [Google Scholar]
- 24. Nielsen MW, Andersen JP, Schiebinger L, Schneider JW. 2017. One and a half million medical papers reveal a link between author gender and attention to gender and sex analysis. Nat. Hum. Behav. 1, 791–796. ( 10.1038/s41562-017-0235-x) [DOI] [PubMed] [Google Scholar]
- 25. Arnegard M, Whitten L, Hunter C, Clayton J. 2020. Sex as a biological variable: a 5-year progress report and call to action. J Womens Health 29, 858–864. ( 10.1089/jwh.2019.8247) [DOI] [PMC free article] [PubMed] [Google Scholar]
- 26. Haverfield J, Tannenbaum C. 2021. A 10-year longitudinal evaluation of science policy interventions to promote sex and gender in health research. Health Res. Policy Syst. 19, 94. ( 10.1186/s12961-021-00741-x) [DOI] [PMC free article] [PubMed] [Google Scholar]
- 27. Johnson J, Sharman Z, Vissandjée B, Stewart DE. 2014. Does a change in health research funding policy related to the integration of sex and gender have an impact? PLoS One 9, e99900. ( 10.1371/journal.pone.0099900) [DOI] [PMC free article] [PubMed] [Google Scholar]
- 28. Tannenbaum C, Ellis RP, Eyssel F, Zou J, Schiebinger L. 2019. Sex and gender analysis improves science and engineering. Nature 575, 137–146. ( 10.1038/s41586-019-1657-6) [DOI] [PubMed] [Google Scholar]
- 29. Nature Editorial Team . 2023. Women’s health: end the disparity in funding. Nature New Biol. 617, 8. ( 10.1038/d41586-023-01472-5) [DOI] [PubMed] [Google Scholar]
- 30. UK Research and Innovation (UKRI) . 2023. Use of both sexes to be default in laboratory experimental design. See https://www.ukri.org/news/use-of-both-sexes-to-be-default-in-laboratory-experimental-design/ (accessed 8 May 2023).
- 31. UK Research and Innovation . Medical research council data sharing policy. See https://www.ukri.org/publications/mrc-data-sharing-policy/.
- 32. Child S, Mulligan C, Pavlov I, Bryan S, Li L, Knowles R. 2025. CROSS checklist_Developing the evidence base to inform policy on inclusive research design.docx. Figshare ( 10.6084/m9.figshare.26413237.v4) [DOI]
- 33. Child SA, Mulligan C, Pavlov I, Bryan S, Li L, Knowles RL. 2025. Supplementary material from "Developing the evidence-base to inform policy on inclusive research design. Figshare. ( 10.6084/m9.figshare.c.7684194) [DOI]
Associated Data
This section collects any data citations, data availability statements, or supplementary materials included in this article.
Data Availability Statement
Individual-level data from the survey cannot be provided as this could be disclosive of the identity of respondents or their institutions. The article and supplementary files include aggregated tables which contain all of the data to support the findings reported. The original dataset is held in the MRC Science Archive and can be requested by application to the MRC Data Access Committee [31].
Child, Stella; Mulligan, Christina; Pavlov, Ivan; Bryan, Simone; Li, Leah; Knowles, Rachel (2025). CROSS checklist: Developing the evidence base to inform policy on inclusive research design.docx. figshare. Online resource [32].
Supplementary material is available online [33].