

Abstract
The depletion of conventional oil reserves and rising global energy demand necessitate efficient extraction methods for unconventional resources like heavy oil. This study successfully applies the coupling of chemical reaction kinetics with fluid dynamics in porous media for in-situ heavy oil upgrading, extending existing models to dynamic conditions. Using advanced kinetic modeling and Computational Fluid Dynamics (CFD), catalytic reactions are analyzed employing a Ni–W–Mo catalyst. The primary aim of this study is to investigate the effects of temperature, oil composition, and residence time on the upgrading process and the resulting product distribution. Simulations were first performed in a non-porous batch reactor to identify optimal reaction conditions, followed by modeling reactive flow in porous media to better simulate real-world reservoir conditions. The results show that temperature and residence time significantly influence conversion rates and product yields, with a 30% increase in lighter hydrocarbon production as the reaction temperature is raised from 575 to 700 K. These findings emphasize the importance of dynamic modeling in optimizing in-situ upgrading processes and provide insights into improving unconventional oil recovery techniques. This research provides a comprehensive framework to enhance the understanding of complex chemical and hydrodynamic interactions in porous media, contributing to the development of more effective oil recovery strategies for unconventional resources.
Keywords: In-situ upgrading, Heavy oil, Enhanced oil recovery (EOR), Porous media, Reaction kinetic, Catalysts
Subject terms: Chemical engineering, Crude oil
Introduction
The transition toward renewable energy sources has become a cornerstone of global energy policy, driven by the need to mitigate climate change and reduce reliance on finite fossil fuels. Despite this shift, the reality remains that hydrocarbon-based energy resources, particularly oil and gas, not only continue to play a dominant role in the global energy mix for the foreseeable future, but also help to maintain a sustainable transition towards clean energy1. Projections indicate that even by 2040, fossil fuels will still account for a significant share of global energy consumption, with oil and gas contributing around 77% of the total energy used across various sectors, including transportation, industry, and domestic use2. This enduring reliance on hydrocarbons underscores the importance of developing innovative methods to extract and utilize these resources more efficiently, especially as conventional reserves become increasingly depleted.
In response to the declining productivity of conventional petroleum reservoirs, the energy industry has increasingly turned its focus to unconventional sources such as heavy oil, extra-heavy oil, and bitumen. These resources represent a vast untapped potential, comprising approximately 70% of the world’s total hydrocarbon reserves3. However, their exploitation is fraught with technical and economic challenges, primarily due to the high viscosity and low API gravity of these hydrocarbons, which make their extraction, transportation, and processing both difficult and costly4. As a result, Enhanced Oil Recovery (EOR) techniques, particularly those involving thermal, chemical, and miscible gas injection, have become essential tools in maximizing recovery from these challenging reservoirs5.
Among EOR methods, thermal recovery techniques, such as Steam-Assisted Gravity Drainage (SAGD) and in-situ combustion, have proven particularly effective in enhancing the mobility of heavy oils by reducing their viscosity through heat application. These methods, although capable of achieving recovery factors as high as 70%, are not without their drawbacks. The high costs associated with steam production, along with environmental concerns related to greenhouse gas emissions and water usage, present significant barriers to the widespread adoption of thermal EOR6. Furthermore, the safety risks associated with field implementation, particularly in remote and environmentally sensitive areas, further complicate the deployment of these technologies7 .
Recent advancements in the field of hydrocarbon reservoir engineering have led to the development of a novel approach known as in-situ upgrading of crude oil. This technique represents a paradigm shift in the way heavy and extra-heavy oils are produced and processed. By initiating thermal and chemical processes directly within the reservoir, in-situ upgrading breaks down long hydrocarbon chains into smaller, more manageable molecules before extraction, thereby improving the fluid properties and reducing the need for costly and environmentally harmful steam injection8. This approach not only enhances the efficiency of oil recovery but also transforms the reservoir into a high-pressure, high-temperature catalytic bed, allowing for simultaneous recovery and refining of the crude oil9.
The in-situ upgrading process relies on a series of complex chemical reactions, including hydrogenation, dehydrogenation, aromatization, and hydrotreating, which are catalyzed by materials specifically designed to withstand the harsh reservoir conditions10 . The success of this technique is contingent upon several critical factors, including the synthesis of active and regeneratable catalysts, an in-depth understanding of hydrodynamic flow effects within porous media, and the precise control of operational parameters such as temperature and residence time11 . Achieving an optimal mobility ratio of the original oil in place (OOIP) and producing a final product with desirable properties necessitates a sophisticated integration of chemical engineering principles with advanced modeling and simulation techniques12 .
In-situ catalytic upgrading has emerged as a promising approach for simultaneously enhancing recovery and improving the quality of heavy and extra-heavy oils. Catalysts facilitate the breakdown of large hydrocarbon molecules into lighter components through aqua-thermolysis and catalytic cracking mechanisms, offering a viable solution to overcome the limitations of purely thermal processes. Various categories of catalysts have been investigated extensively, including water-soluble, oil-soluble, amphiphilic, mineral-based, solid super-acids, and nanoparticle-based systems, each with distinct transport behaviors and catalytic efficiencies13–27 . Water-soluble metal salts, such as Ni(II), Co(II), and VO(II) sulfates, were among the earliest explored, enabling reactions with polar functional groups in the oil matrix; however, their limited solubility in oil phases constrained their effectiveness13–18 . In contrast, oil-soluble catalysts like molybdenum oleate and metal naphthenates demonstrate superior dispersion in the oil matrix and often achieve viscosity reductions exceeding 90% under moderate temperatures (~ 450–525 K)19–22.
To address phase interface limitations, amphiphilic catalysts have been developed to combine oil- and water-phase compatibility. These include aromatic sulfonic metal salts and Gemini surfactant-metal complexes, which have shown high catalytic activity and stability at the oil–water interface, even under reservoir-like conditions28–30. Another class of promising candidates includes natural minerals and zeolites, valued for their availability and structural acidity. When properly activated, zeolites such as clinoptilolites and chabazites catalyze asphaltene cracking and heteroatom removal while offering favorable textural properties for mass transport23–25,31. Additionally, solid superacids like SO₄2⁻/ZrO₂ and WO₃/ZrO₂ demonstrate strong protonic activity and are capable of driving bond cleavage reactions without the need for high water content, though temperature sensitivity remains a concern26,27,32–34.
Recent advances focus heavily on metallic nanoparticles (NPs) due to their unique physicochemical properties, including high surface area, enhanced reactivity, and efficient pore-scale transport. Transition metals such as Ni, Mo, Fe, and W, and their bimetallic and trimetallic configurations (e.g., Ni–W–Mo), have shown exceptional catalytic performance in reducing viscosity, removing sulfur and nitrogen, and breaking asphaltene aggregates35–57. Nanocatalysts also offer synergistic effects, combining upgrading, emulsification, and hydrogenation. Their high thermal conductivity further enhances energy efficiency in thermal recovery schemes37–41,43,44,46,51,53–55. However, field-scale application poses challenges such as agglomeration, pore plugging, and retention within the porous medium. Studies by Zamani et al. and Hashemi et al. demonstrated that while NP transport through sand-packed beds is feasible, careful control of particle size, stabilizers, and injection protocols is required to ensure injectivity and avoid formation damage55–60.
Another critical aspect influencing catalyst performance is the presence of hydrogen donors, such as water, methane, tetralin, or formic acid, which help suppress side reactions and coke formation. These donors aid in stabilizing reaction intermediates and significantly boost conversion efficiency and sulfur removal, especially when paired with effective metal centers36,61–66. Despite the technical advances, commercial implementation still faces hurdles in terms of catalyst deactivation, economic cost, and long-term stability under harsh reservoir conditions. Nevertheless, the integration of catalytic nanomaterials with in-situ upgrading processes marks a transformative step toward more efficient, selective, and environmentally friendly heavy oil recovery technologies35,57,67.
The process of upgrading heavy oil to lighter fractions is influenced by various factors, including the catalyst type, reaction temperature, reaction time, and the presence of hydrogen donors in the system68. Among these, catalyst selection is particularly critical for enhancing reaction efficiency. In the context of upgrading reactions, catalysts based on a combination of Nickel (Ni), Tungsten (W), and Molybdenum (Mo) have shown considerable promise due to their unique properties that facilitate the complex reactions involved in oil upgrading69,70.
Numerous studies have highlighted the significant role of Ni–W–Mo catalysts, with particular focus on their high catalytic performance in enhancing oil upgrading reactions. Research has shown that Nickel plays a vital role in increasing the surface area, catalytic activity, and pore size distribution of the catalyst, all of which are key to improving the efficiency of the upgrading reaction71. However, it has also been observed that an excess of Nickel beyond an optimal threshold can lead to undesirable sintering effects, where Ni atoms bond with W and Mo, reducing the availability of active sites and diminishing catalytic performance. Thus, finding the right balance of these three metals is crucial to maximizing the catalyst’s effectiveness72.
Further investigation into the optimal formulation of Ni–W–Mo catalysts has shown that the best performance is achieved when the Ni/Me (atomic) ratio is set to approximately 0.3, where Me represents the sum of all metal components (Ni, W, and Mo). Additionally, the Mo/W (atomic) ratio is ideally maintained at three for optimal catalytic activity. These findings have been corroborated in several studies73,74, and this research builds on these established optimal ratios to ensure the catalyst formulation used in our simulations provides maximum upgrading efficiency.
While significant progress has been made in the development of catalysts and the optimization of in-situ upgrading processes in controlled, non-porous environments, there remains a substantial gap in the literature regarding the application of these processes within the complex, heterogeneous environments typical of hydrocarbon reservoirs. Specifically, the dynamic interactions between chemical reactions and fluid flow within porous media are not fully understood, yet they are crucial to the successful implementation of in-situ upgrading technologies on a commercial scale75 . Addressing this gap requires not only advanced computational models but also experimental validation under realistic reservoir thermobaric conditions, which poses a significant challenge given the high temperatures and pressures involved76 .
Previous studies have provided valuable insights into the static aspects of in-situ upgrading, including the development of kinetic models and the evaluation of catalyst performance69 . For example, Khanghah et al.74 developed a kinetic model for ultra-dispersed catalytic hydro-processing of bitumen utilizing a Ni–Mo–W catalyst. Their findings revealed a strong correlation between residue conversion and viscosity reduction, thereby facilitating the development of computational tools capable of predicting product distribution and optimizing reaction conditions.
In contrast, dynamic simulations that incorporate fluid flow within porous media are essential for understanding the true potential and limitations of in-situ upgrading technologies. These simulations can reveal the impact of reservoir heterogeneity on reaction efficiency, identify optimal operational parameters, and ultimately guide the design of more effective EOR strategies. This study aims to bridge the gap between static kinetic models and dynamic reservoir simulations by developing a comprehensive framework that integrates chemical reaction networks with fluid flow dynamics within porous media. By utilizing advanced computational techniques, this research provides valuable insights into the mechanisms governing in-situ upgrading and explores ways to optimize the process for enhanced recovery from unconventional reservoirs. The kinetic model proposed by Khanghah et al.74 serves as the foundational framework for the present study, which employs this model to simulate the in-situ upgrading of heavy oil under dynamic conditions.
Current gaps in the understanding of in-situ heavy oil upgrading processes stem from the lack of dynamic models that incorporate both chemical kinetics and fluid flow interactions within heterogeneous porous media. This study addresses these gaps by developing a comprehensive framework combining advanced kinetic modeling with CFD simulations. Using Ni–W–Mo catalyst, this research investigates the role of temperature, oil composition, and residence time in optimizing the upgrading process.
Conducting experiments to investigate kinetic parameters of the upgrading reaction or to observe fluid flow within porous media during the upgrading process presents significant challenges. The extreme temperature and pressure conditions required for Enhanced Oil Recovery (EOR) and upgrading reactors make these experiments not only difficult but also prohibitively expensive and time-consuming12. As such, computational simulations and modeling become invaluable tools in understanding these complex processes, as they provide a cost-effective alternative.
This study begins by modeling the upgrading reactions within a batch non-porous bed, which simulates conditions typical of batch upgrading reactors in refineries. The upgrading reaction network was coupled with a material balance equation, and the effects of temperature and residence time on the distribution of products were evaluated.
Next, the simulation was extended to model fluid flow in porous media, incorporating the upgrading reaction network. A Representative Elementary Volume (REV) of a two-dimensional porous medium, derived from SEM images, was utilized for this step. The use of two-dimensional models is common in many studies, as it allows for the application of governing equations to assess various mechanisms. The advantages of 2D geometries over 3D include easier visualization of fluid flow and reaction parameters, as well as lower computational costs, which enable greater flexibility in testing different scenarios. The simulated reactive flow in porous conditions is analogous to continuous reactors used in refineries and in enhanced oil recovery from underground reservoirs77.
Finally, the mechanisms involved in residue upgrading in porous media are discussed, and the optimal operational parameters, such as temperature and residence time, are identified to maximize the upgrading process.
The main innovation of this study lies in its ability to couple reaction networks with hydrodynamic simulations, offering insights into fluid–solid interactions under realistic reservoir conditions. The findings contribute to advancing unconventional oil recovery technologies by reducing environmental impact and improving process efficiency.
In this study, MATLAB R2023a, COMSOL Multiphysics version 5.5, and Design Expert software were utilized in different sections to facilitate the modeling and simulation processes. COMSOL Multiphysics was employed for the creation of the meshing models and for simulating fluid flow and catalytic reactions in porous media, while MATLAB was used for the kinetic modeling and optimization of the reaction network parameters. Additionally, Design Expert software was applied for the statistical analysis and design of experiments (DOE) to assess the impact of various parameters on the upgrading process. These software tools were essential in providing a comprehensive framework for analyzing the in-situ heavy oil upgrading process under varying conditions.
This paper is structured as follows: Sect. “Numerical implementation” provides an overview of the numerical methods and models employed, Sect. “Results and discussions” discusses the results of static and dynamic simulations, and Sect. “Conclusion”: presents the conclusions and implications of the findings.
Numerical implementation
Geometry and grid generation
In this study, the simulation of upgrading reactions was first performed in a constant volume non-porous bed, with the reactor volume set at 100 mm3. The primary purpose of using a non-porous reactor model was to conduct static simulations to identify optimal simulation conditions while minimizing the time and computational cost associated with more extensive simulations. This step provides necessary information to understand the system’s behavior before progressing to more complex simulations involving porous media.
Once the optimal conditions were identified through the non-porous reactor model, the study proceeded to model reactive flow in porous media, which necessitated a more complex geometry. For this, a 600 µm × 600 µm porous media model was extracted from the work of Mohammadmoradi et al.78, which provides a detailed description of the porous medium’s geometry. The geometry generation tool in COMSOL (version 5.4) was then used to incorporate this image into the simulation model.
The model’s dimensions, porosity, and other characteristics, including pore volume and permeability, were also based on the data provided in Mohammadmoradi et al.'s study, ensuring consistency with real-world experimental setups. The 2D geometry was inserted into COMSOL using standard practices for importing and utilizing 2D images as geometries in simulation models. These common methodologies allow for accurate representation of the pore network and facilitate simulations that capture fluid flow and reaction kinetics within the porous structure.
Boundary conditions, including pressure inlet, pressure outlet, and wall conditions, were applied to the physical domain as follows: inlet, outlet, upper and lower domain interfaces, and the interfaces between the grain and throat regions. These boundary conditions, shown in Fig. 1, allow for realistic modeling of reactive flow in the porous media. The porous medium characteristics, such as size, porosity, and permeability, are summarized in Table 1, ensuring that the selected medium closely mirrors the experimental micro-model used in the referenced study78.
Fig. 1.

600 µm × 600 µm porous media model and the boundary conditions used for the modeling creeping reactive flow in porous media.
Table 1.
Physical characteristic of porous medium.
| Lithology | Carbonates |
| Dimensions (µm2) | 600 * 600 |
| Porosity | 0.108 |
| Permeability (mm2) | 1.3 * 10−7 |
| Pore volume (µm3) | 2.3 * 10−3 |
By utilizing the geometric data from Mohammadmoradi et al.78, this study aligns with established experimental models and ensures the representativeness of the simulated porous media, while also following best practices in COMSOL for generating and incorporating 2D geometries.
Mesh independency
To assess the influence of grid density on the accuracy of modeling results, a boundary layer mesh was employed for grid generation. The effect of varying mesh element numbers on the precision of the simulation was systematically evaluated, with mesh independence rigorously documented in Table 2 and illustrated in Fig. 2. In the mesh independence study, the convergence criterion was defined based on the residue conversion as the number of mesh elements increased. The simulation was considered converged when further mesh refinement led to no significant change in the results. Table 2 provides a detailed comparison of the residue conversion at a fluid inlet temperature of 595 K in porous media, considering different mesh densities. The results reveal that increasing mesh density beyond a certain point yields a negligible relative error of only 1.6% between mesh configurations Item 4 and Item 5. This confirms that further refinement does not significantly affect the outcomes, establishing mesh independence. However, it is important to note that increasing the mesh density also leads to higher computational costs and longer simulation times. Therefore, the final chosen mesh configuration comprises 29,979 domain elements and 5,881 boundary elements, balancing both accuracy and computational efficiency. Figure 2 visually demonstrates the residue conversion as a function of mesh density, showing how the results stabilize as the number of mesh elements increases, thereby confirming the mesh independence. Additionally, Fig. 3 presents the grid generated within the porous medium, including a zoomed-in view of a specific region to provide a clearer understanding of the mesh resolution.
Table 2.
Mesh independency results based on the bitumen conversion.
| Item | Number of grids | Conversion of residue % | Relative error with previous item % |
|---|---|---|---|
| 1 | 23,574 | 13.07 | |
| 2 | 26,598 | 16.27 | 24.5 |
| 3 | 27,580 | 17.65 | 8.5 |
| 4 | 29,979 | 18.58 | 5.3 |
| 5 | 34,758 | 18.87 | 1.6 |
| 6 | 42,795 | 18.98 | 0.58 |
| 7 | 46,987 | 19.05 | 0.37 |
Fig. 2.

Mesh independency results based on the bitumen conversion.
Fig. 3.

A triangular mesh was employed to create the grid within the porous medium.
Figure 3 underscores that the cell size proximate to the grain in the porous medium is smaller compared to those farther from the grains. Substantiating this observation, Fig. 4 provides a contour of the mesh size distribution in the porous medium. The contour vividly illustrates that the computable cell area near the center of the throat is greater than that of the generated grid near the grains, providing empirical evidence for the assertion.
Fig. 4.

Contour of the mesh size distribution in the porous media.
Governing equations
In this investigation, two distinct sets of governing equations were employed to model the in-situ (reactive creeping flow in the porous domain) upgrading of residue. Initially, a simulation of a perfectly ideal batch non-porous bed was conducted, utilizing reaction engineering information. This information encompassed the kinetic network of bitumen upgrading, kinetic parameters (activation energy and pre-exponential factors corresponding to the specified reaction network), and the physical properties of the non-porous bed (volume of non-porous bed). It’s worth noting that this non-porous bed closely resembled the experimental non-porous bed previously documented by Galarraga et al.73.
Subsequently, a novel approach was undertaken to model the pore-scale creeping reactive flow of bitumen upgrading reactants and products within porous media. This involved the simultaneous discretization of the Stokes and diffusion-convection mass balance equations, coupled with the upgrading reaction network. These equations represent the conservation laws for momentum, mass, and species transport, respectively. It is important to highlight that the reaction network employed for the creeping reactive flow in bitumen upgrading mirrors that used in in-situ upgrading (batch non-porous bed).
Reaction network and mass balance equation for in-situ upgrading
In the presented kinetic models, pseudo-components are employed to simplify the complex composition of heavy oils and represent the key fractions involved in the upgrading reactions. These pseudo-components are grouped based on their boiling point ranges, allowing for a reduction in the number of components in the model while still capturing the essential reaction pathways. Parameters related to reaction rates, such as activation energy and rate constants, were estimated based on experimental data reported by Gallaraga et al.53 and Sanchez et al.69 .
A significant challenge in applying these kinetic models is the lack of experimental studies specifically addressing kinetics within porous media. Existing kinetic studies, such as those reported by Sanchez et al., were conducted in non-porous environments, where key factors such as mass transport limitations and catalyst deactivation are not considered. While the assumption of using pseudo-components is generally accurate for simplifying complex oil mixtures, the response of reactions in porous media and the impact of factors arising from porous media geometry remain significant questions in reservoir modeling.
The kinetic parameters used in this study, including activation energy and pre-exponential factors, were initially reported by Sanchez et al.69 for hydrocracking reactions in non-porous systems. These parameters were then calibrated using the experimental data for crude oil upgrading reported by Gallaraga et al.53. The reaction network, as proposed by Sanchez et al., includes five lumps: unconverted residue, vacuum gas oil (VGO), distillates, naphtha, and gases. For each reaction, kinetic expressions were formulated as a function of product composition and the corresponding kinetic constants. Figure 5 illustrates the proposed reaction network for in-situ upgrading of crude oil suggested by Sanchez et al.
Fig. 5.

Reaction network for in-situ upgrading of heavy oil using Ni–Mo–W catalyst.
To improve the accuracy of the reaction network, the coefficients of the defined equations were optimized using MATLAB™ optimization tools. This process minimized the percentage error between the simulated and experimental data, reducing the error to less than 2%. This adjustment was crucial for ensuring that the kinetic equations are accurately representing the upgrading reactions under the conditions simulated in this study. Therefore, in this study, in addition to utilizing the reported reaction network based on experimental data, the coefficients of the defined equations were adjusted, enhancing the accuracy of the kinetic equation. The physical properties of reactants and products based on boiling point ranges are reported in Table 3.
Table 3.
Physical properties of the pseudo-components for reaction network of in-situ upgrading.
| pseudo-components | Boiling point range (K) | Average of boiling point (K) | Mean molecular weight (g/mole) |
|---|---|---|---|
| Residue | > 818.1 | 988.1 | 1042 |
| VGO | 616.1–818.1 | 717.1 | 408 |
| Distillate | 486.1–616.1 | 551.1 | 226 |
| Naphtha | 309.3–486.1 | 397.7 | 106 |
| Gases | 111.7–309.3 | 210.5 | 37 |
The activation energy and pre-exponential factors for each reaction step were justified using the experimental results reported by Sanchez et al.69, who developed the kinetic model for hydrocracking of heavy oils under moderate temperature and pressure conditions. These parameters reflect the activation energy required for the transformation of heavier fractions (like resid) into lighter fractions such as naphtha and gases. The rate constants used for each of the five lumps are first-order constants, derived from mass balance data and distillation curves, and they help define the conversion rates of the residue, VGO, and distillates.
The main limitation of applying this non-porous kinetic model to porous media is the simplification of the reaction environment. Porous media introduces complexities that are not accounted for in the non-porous-based model, such as mass transport limitations, catalyst deactivation, and temperature gradients. These factors can significantly influence reaction rates, particularly in real-world reservoir conditions. For instance, diffusion limitations in porous media can reduce the effective concentration of reactants at the catalyst sites, leading to slower reaction rates compared to those predicted in a non-porous environment.
Moreover, the assumption of uniform catalyst distribution and constant temperature is not always applicable in porous media, where temperature variations and uneven catalyst distribution can affect the reaction kinetics. The current model does not account for the spatial variability in catalyst activity, which could lead to a reduced accuracy when simulating in-situ upgrading reactions under reservoir-like conditions.
To better represent in-situ upgrading in porous media, future improvements to the model could include the incorporation of multiphase flow (oil, water, and gas) and temperature distributions across the porous medium. Additionally, a more detailed treatment of catalyst deactivation (e.g., due to coke formation) and diffusion limitations could be included to enhance the model’s realism. These improvements would allow for more accurate predictions of reaction rates and product distributions under real-world conditions, thus making the model more applicable to dynamic reservoir simulations.
It is noteworthy that the molecular weight and other properties presented in this table are based on calculations provided by Kudchadker et al.79. Experimental data and improved kinetic parameters, compared to Sanchez et al.69, calculated based on the reaction network for crude oil upgrading, are reported in Table 4.
Table 4.
Kinetic parameters and experimental data for reaction network of the in-situ upgrading.
| Kinetic coefficient | 1/T (1/K) | Pre-exponential factor and activation energy | Statistical parameters | ||||
|---|---|---|---|---|---|---|---|
| 0.001683 (593 K) | 0.001605 (623 K) | 0.001531 (653 K) | Pre-exponential factor (K0) | Activation energy (E) | Linear equation | Determination coefficient | |
| Ln k1 | − 6.74224 | − 4.98936 | − 3.10555 | 1.64676E+14 | 194,871.8 | Y = − 23439X + 32.735 | 0.9976 |
| Ln k2 | − 8.79823 | − 5.4059 | − 3.61935 | 7.13704E+20 | 279,051.1 | Y = − 33564X + 48.017 | 0.9779 |
| Ln k3 | − 8.62812 | − 5.99547 | − 3.55086 | 1.74944E+20 | 272,383.3 | Y = − 32762X + 46.611 | 1 |
| Ln k4 | − 10.2265 | − 7.58306 | − 4.5469 | 2.02816E+22 | 304,176 | Y = − 36586X + 51.364 | 0.9954 |
| Ln k5 | − 6.93 | − 6.16582 | − 4.02856 | 30,591,866,197 | 154,382.7 | Y = − 18569X + 24.144 | 0.9157 |
| Ln k6 | − 12.4779 | − 8.06931 | − 6.09239 | 1.17395E+25 | 344,482.3 | Y = − 41431X + 57.725 | 0.9648 |
| Ln k8 | − 12.6555 | − 7.44219 | − 5.85693 | 1.30369E+27 | 367,628.5 | Y = − 44218X + 62.435 | 0.9283 |
In order to determine the kinetic reaction network coefficients (K), experimental data is utilized at various temperatures. To achieve this, concentration vs. time plots for reactants and products are initially generated at a specific temperature. Subsequently, considering the targeted reaction network and the Arrhenius equation, the coefficients are measured at the specified temperature. The measurement process is then repeated at different temperatures for each component within the reaction network. Equation 1 represents the Arrhenius equation80.
 |
1 |
In this equation, Af represents the frequency factor, nf denotes the temperature exponent, Ef is the activation energy, T is the reaction temperature, Tref is the reference temperature (equal to one Kelvin), Rg is the universal gas constant, and kf is the reaction rate constant. After obtaining the reaction coefficients at different temperatures, the lnk versus 1/T plot, known as the Arrhenius plot, can be generated from Eq. 1. This plot allows for the adjustment of reaction coefficients at various temperatures. The kinetic parameters are calculated based on the Arrhenius rate equation, and the Arrhenius plot is depicted in Fig. 6.
Fig. 6.

The Arrhenius plot for in-situ upgrading reactions of crude oil in a non-porous discontinuous reactor based on the reaction network.
In the simulation of the in-situ upgrading process under static conditions, the reaction network for heavy oil upgrading is coupled with the material balance equation. The effects of time, temperature, and reactant concentrations on the product distribution are systematically evaluated. The temperature range of 575–700 K was selected for the simulations based on the kinetic parameters and experimental data reported by Gallaraga et al.53,73 and Sanchez et al.69. These studies provided comprehensive laboratory data and a well-established kinetic model for hydrocracking reactions in non-porous environments, with the activation energy and pre-exponential factors derived from their experiments.
The experimental data from Gallaraga et al., along with the reaction network proposed by Sanchez et al., were recalibrated using optimization functions, minimizing the error to less than 2% under first-order reaction conditions. To ensure computational efficiency, the reactions for in-situ upgrading of crude oil were modeled as first-order reactions, and the reaction rates for each component were calculated accordingly81.
The temperature range of 575–700 K was chosen to align with the temperature conditions under which the kinetic parameters were originally validated. These parameters, including the activation energy and pre-exponential factors, are provided in Table 4, which summarizes the kinetic coefficients and experimental data used in the model. This temperature range was crucial for maintaining the accuracy and validity of the simulations, as it is based on the experimental studies conducted by Sanchez et al. and Gallaraga et al. Extending the temperature range beyond 700 K would introduce a significant source of uncertainty due to the absence of experimental data for dynamic simulations of in-situ upgrading at temperatures outside of this range.
 |
2 |
 |
3 |
 |
4 |
 |
5 |
 |
6 |
In the above equations, the coefficients R, VGO, D, N, and g represent the components of a crude oil cut, namely, the residual crude oil, vacuum gas-oil (VGO), distillates, naphtha, and gases, respectively. The reaction rate constants, denoted by k, adhere to the Arrhenius laws. Simultaneous solution of this set of equations provides the concentration and fractional distribution of the reactants and the products of in-situ upgrading of crude oil in the presence of a catalyst, both in a static state and within a discontinuous reactor. The assumptions employed for modeling this non-porous bed are outlined as follows:
Non-porous discontinuous bed with a constant volume
Isothermal conditions
First-order reaction
Reaction in the liquid phase
Irreversible reactions
Bulk and fractional reactions of crude oil cuts
Single phase flow equations in porous media
Reactive creeping flow in the pore scale has been employed to model the upgrading process of crude oil and the resulting products within a porous medium. In this regard, simultaneous discretization of the Stokes and mass diffusion-convection equations, coupled with the upgrading reaction network, has been introduced. These equations represent, respectively, the laws of motion, mass conservation, and species transport. Furthermore, the reaction network for crude oil upgrading used for the reactive porous flow is analogous to the reaction network employed for static upgrading and discontinuous non-porous reactor.
Stokes Flow (also known as creeping flow or creeping motion) refers to a type of fluid flow where the inertial forces are negligible compared to viscous forces. This occurs when the Reynolds number is very low (i.e., Re ≪ 1), which is typical for flows characterized by very low fluid velocities, high viscosities, or small length-scales82. In these conditions, advective inertial effects become insignificant, and the convective term in the Navier–Stokes equations can be neglected. As a result, the Navier–Stokes equations reduce to the Stokes equations, which more accurately describe the flow behavior circumstances of this study83. The complete Stokes equations also encompass a mass conservation equation, typically expressed as:
 |
7 |
where is the fluid density and the fluid velocity.
The mass transfer equation in the conditions of reactive flow in a porous medium is defined as follows. This equation, formulated in the general form of Fick’s law, is considered for mass transfer in the shear flow of crude oil within a porous medium80,84.
 |
8 |
In this equation, c, t, D, and r respectively represent concentration, time, diffusion coefficient, and chemical reaction. The subscript i denotes each component present in the reactions. As evident in this equation, mass transfer in this medium involves several components: diffusivity (Di ∇ci), convection (ci u), and chemical reaction (ri).
Two phase flow equations in porous media
In conditions of fluid injection accompanied by oil saturation in a porous medium, and for simulating two-phase flow with reactions in a porous media, equations related to the single-phase section are used. These include the equations for reactive flow in a porous medium. Additionally, equations related to the level set are utilized. In each time step and in each computational cell (mesh), these equations track the interface between two phases, alongside computations for chemical reactions, mass transfer, and fluid movement. The equation for the level set is as follows80,85:
 |
9 |
In this equation, the coefficients ∅, u, γ, and εls represent the volume fraction, velocity, reinitialization parameter, and parameter controlling interface thickness of the contact surface, respectively.
Boundary and initial conditions
In general, numerical simulation requires the specification of initial conditions as well as boundary conditions for the governing equations of the defined problem. To solve the fluid flow equations, as well as chemical reactions and mass transfer, it is necessary to define fluid input conditions, initial temperature, initial fluid concentrations and saturations, as well as boundary conditions and walls of the porous medium for the simulation.
In this study, non-slip flow conditions were applied for the grain-throat interface in the porous medium. Additionally, in the modeling, the assumption of incompressible flow was utilized. The physical properties of crude oil, such as density and viscosity, are API° 9.5 and 7860 centipoise, respectively, and these physical properties closely resemble those of oil reported by Galarraga et al.53. The fluid input and output conditions are pressure-based, and viscous stresses are neglected.
Results and discussions
The results of this research will be presented in two sections: static simulation of the crude-oil upgrading process and dynamic simulation. Static simulation is conducted to investigate the parameters influencing the reaction kinetics, while dynamic simulation aims to study upgrading in a porous medium and the role of enhanced recovery in this process.
To perform the simulation and analyze the sensitivity of influential parameters on the simulation results, the Design of Experiment (DOE) method has been employed. Design of Experiment (DOE) is a systematic and efficient approach that enables researchers to explore the relationship between multiple input variables and key output variables. The objective of DOE is to examine the sensitivity of various parameters in a process and optimize data collection from different experiments for sensitivity analysis of those parameters. The necessary inputs for DOE include all parameters that will play a role in obtaining the study results. Depending on the nature of these parameters, their range of variations can be specified in the DOE method. Subsequently, using various statistical analyses, a set of experiments encompassing different values of key parameters will be determined. By conducting experiments and examining the results, the sensitivity of each parameter used in the DOE will be identified.
Static conditions simulation of heavy oil in-situ upgrading
Static simulation of in-situ crude oil upgrading has been performed in a discrete non-porous space with a fixed volume of 10 cm3 under constant temperature conditions. In this process, reaction time, oil type (concentration of upgradable heavy components), and temperature are as most influential parameters. To find optimal conditions for simulations and reduce the time and cost associated with extensive simulations, the experimental design method has been utilized. In this regard, minimum and maximum values have been selected for various parameters. The Table 5 indicates the minimum and maximum conditions for the studied parameters. The minimum and maximum values are based on DOE method, where the kinetics of the in-situ crude oil upgrading process have been optimized using these data. For the oil type, two types of oil with different percentage compositions have been used, and the Table 6 indicates the percentage composition of each cut in the available oil types.
Table 5.
Maximum and minimum ranges of key parameters in DOE method.
| Parameter | Maximum range | Minimum range |
|---|---|---|
| Temperature | 575 K | 595 K |
| Time | 500 s | 4000 s |
Table 6.
The molar concentration of 2 different oil cuts for simulation.
| Oil Type 1 | Oil Type 2 | |||
|---|---|---|---|---|
| mol/m3 | Mole fraction% | mol/m3 | Mole fraction% | |
| Distillates | 0.0659 | 0.315 | 0.048 | 0.234 |
| Gases | 0 | 0 | 0 | 0 |
| Naphtha | 0.02421 | 0.116 | 0.018 | 0.088 |
| Residue | 0.0342 | 0.163 | 0.052 | 0.254 |
| VGO | 0.085 | 0.406 | 0.087 | 0.424 |
The design of experiment (DOE) method was performed using Design Expert™ software. The DOE method is a statistically based and sensitive to parameter variations approach. In this study, the central composite design (CCD) method was employed for DOE. The advantage of this method lies in its ability to conduct a higher number of experiments and its rotatability. Additionally, a factorial design with central and axial points is utilized in this method.
In the CCD method, each factor has five different levels (including three points within the specified limits for each factor and two points outside the specified limits for each factor). Initially, the coded values need to be determined based on the minimum and maximum values of influential parameters. Considering that temperature and reaction time parameters are continuous and numerical, they are selected numerically, while the type of oil is chosen categorically. The table below illustrates the coded and actual values of the independent parameters.
Measuring reaction activation energy for reaction 7, 9 and 10 on Fig. 5 is not experimentally feasible and estimations gave scattered value for these parameters69,73. Consequently, in this study the increase in the concentration of Naphtha and Distillates components is considered as the objective function. Increasing the concentration of these components at the end of the process improves the properties of oil and enhances its quality.
In this study, and in the DOE method in the static simulation section of the crude oil upgrading process, the concentration of these two oil cuts has been taken into account. Considering the DOE method table and defining the response surface parameters (Naphtha and Distillates concentrations), the DOE table for the static simulation section of crude oil upgrading process has been prepared. Table 7 represents the experimental design as well as final concentration of the Distillate and Naphtha as the objective functions after static simulation of in-situ upgrading in a batch reactor. As the first four columns indicate, the simulation conditions are set using DOE technique. The obtained concentration for Naphtha and Distillate recorded as evidence for upgrading heavy oil.
Table 7.
The DOE table for static simulation of the crude oil upgrading process.
| Test number | Temperature (K) | Time (s) | Oil Type | Distillates’ Concentration (mol/m3) | Naphtha Concentration (mol/m3) |
|---|---|---|---|---|---|
| 1 | 585 | 2250 | Type 2 | 0.12805 | 0.023102 |
| 2 | 585 | 2250 | Type 1 | 0.135 | 0.0279 |
| 3 | 592.07 | 3487.44 | Type 2 | 0.164603 | 0.026708 |
| 4 | 592.07 | 1012.56 | Type 2 | 0.108305 | 0.023302 |
| 5 | 585 | 4000 | Type 2 | 0.1565 | 0.0243 |
| 6 | 592.07 | 3487.44 | Type 1 | 0.167 | 0.031 |
| 7 | 577.93 | 3487.44 | Type 1 | 0.139 | 0.0271 |
| 8 | 585 | 500 | Type 2 | 0.07082 | 0.0199 |
| 9 | 575 | 2250 | Type 2 | 0.099604 | 0.020509 |
| 10 | 585 | 4000 | Type 1 | 0.16078 | 0.02885 |
| 11 | 577.93 | 3487.44 | Type 2 | 0.129308 | 0.02208 |
| 12 | 585 | 2250 | Type 2 | 0.12804 | 0.023102 |
| 13 | 577.93 | 1012.56 | Type 1 | 0.0936 | 0.02555 |
| 14 | 585 | 2250 | Type 1 | 0.1371 | 0.0278 |
| 15 | 592.07 | 1012.56 | Type 1 | 0.1199 | 0.02805 |
| 16 | 585 | 2250 | Type 2 | 0.12805 | 0.023104 |
| 17 | 585 | 2250 | Type 1 | 0.13708 | 0.02785 |
| 18 | 575 | 2250 | Type 1 | 0.11303 | 0.02602 |
| 19 | 595 | 2250 | Type 2 | 0.1544 | 0.026708 |
| 20 | 595 | 2250 | Type 1 | 0.1578 | 0.03095 |
| 21 | 585 | 2250 | Type 1 | 0.13705 | 0.02778 |
| 22 | 585 | 2250 | Type 2 | 0.12802 | 0.023101 |
| 23 | 577.93 | 1012.56 | Type 2 | 0.077803 | 0.019902 |
| 24 | 585 | 2250 | Type 1 | 0.13706 | 0.02779 |
| 25 | 585 | 500 | Type 1 | 0.087 | 0.02553 |
| 26 | 585 | 2250 | Type 2 | 0.12808 | 0.023102 |
Table 7 indicates that the concentration of Distillates and Naphtha cuts is considered as an indicator for upgrading crude oil and reducing the number of heavy components in crude oil. Furthermore, in concentration–time diagrams related to reactions, other cuts such as Gases or VGO can also be considered. However, due to the very low concentration of Gases in most reactions, this cut is not taken into account. Additionally, the VGO cut is relatively heavy itself and, in the chemical reaction network of this study, it transforms into other components (Distillates and Naphtha), contributing to the enhancement and improvement of the chemical and physical properties of the oil.
Figure 7 illustrates the concentration of each component of Type 1 crude oil after the upgrading reaction versus time. Figure 7a–d correspond to experiments numbered 15, 18, 10, and 13 of Table 7, respectively. Figure 8 also depict the concentration of each component for Type 2 oil after the completion of the upgrading reaction. Figure 8a–d correspond to experiments numbered 4, 9, 5, and 23 of Table 7, respectively. Analyzing the figures and experiment from Table 7 reveals that tests were selected under the same temperature and reaction time conditions to enable a comparison based on the type of oil (Type 1 or 2).
Fig. 7.

The concentration diagrams of oil components after upgrading reactions for oil type 1.
Fig. 8.

The concentration diagrams of oil components after upgrading reactions for oil type 2.
In general, Figs. 7 and 8 show that although the final concentration of Distillates and Naphtha are higher in Type 1 oil, the production of these cuts in oil type 2 are higher in comparison to the oil type 1. This is because Type 1 oil initially has higher amounts of lighter components such as Distillates and Naphtha, leading to a higher concentration of these products in the end. However, considering the difference between the initial and final amounts of each of these two cuts in the conducted experiments (Table 8), it is evident that the production of each of these cuts is higher in Type 2 oil.
Table 8.
Produced Distillates and Naphtha during static tests.
| DOE test number | Temperature (K) | Time (s) | Oil type | Produced distillates (mol/m3) | Produced naphtha (mol/m3) |
|---|---|---|---|---|---|
| 9 | 575 | 2250 | Type 2 | 0.051604 | 0.002509 |
| 18 | 575 | 2250 | Type 1 | 0.04713 | 0.00181 |
| 7 | 577.93 | 3487.44 | Type 1 | 0.0731 | 0.00289 |
| 11 | 577.93 | 3487.44 | Type 2 | 0.081308 | 0.00408 |
| 13 | 577.93 | 1012.56 | Type 1 | 0.0277 | 0.00134 |
| 23 | 577.93 | 1012.56 | Type 2 | 0.029803 | 0.001902 |
| 1 | 585 | 2250 | Type 2 | 0.08005 | 0.005102 |
| 2 | 585 | 2250 | Type 1 | 0.0691 | 0.00369 |
| 5 | 585 | 4000 | Type 2 | 0.1085 | 0.0063 |
| 8 | 585 | 500 | Type 2 | 0.02282 | 0.0019 |
| 10 | 585 | 4000 | Type 1 | 0.09488 | 0.00464 |
| 12 | 585 | 2250 | Type 2 | 0.08004 | 0.005102 |
| 14 | 585 | 2250 | Type 1 | 0.0712 | 0.00359 |
| 16 | 585 | 2250 | Type 2 | 0.08005 | 0.005104 |
| 17 | 585 | 2250 | Type 1 | 0.07118 | 0.00364 |
| 21 | 585 | 2250 | Type 1 | 0.07115 | 0.00357 |
| 22 | 585 | 2250 | Type 2 | 0.08002 | 0.005101 |
| 24 | 585 | 2250 | Type 1 | 0.07116 | 0.00358 |
| 25 | 585 | 500 | Type 1 | 0.0211 | 0.00132 |
| 26 | 585 | 2250 | Type 2 | 0.08008 | 0.005102 |
| 3 | 592.07 | 3487.44 | Type 2 | 0.116603 | 0.008708 |
| 4 | 592.07 | 1012.56 | Type 2 | 0.060305 | 0.005302 |
| 6 | 592.07 | 3487.44 | Type 1 | 0.1011 | 0.00679 |
| 15 | 592.07 | 1012.56 | Type 1 | 0.054 | 0.00384 |
| 19 | 595 | 2250 | Type 2 | 0.1064 | 0.008708 |
| 20 | 595 | 2250 | Type 1 | 0.0919 | 0.00674 |
As Table 8 indicates, the amount of produced Distillates and Naphtha during static tests for oil Type 2 is higher in all experiments. As shown in Table 6, the primary concentration of Residue in oil Type 2 is higher than oil Type 1 and this consequences to producing more products (Naphtha and Distillates).
After performing the static simulation of the in-situ upgrading process in COMSOL™ software and obtaining initial data regarding the final concentration values of the desired cuts in the DOE, further evaluations are conducted on the results. To achieve this, the initial raw data, consisting of the final concentrations of Distillates and Naphtha cuts, is input into the Design Expert software, which is utilized for Design of Experiment (DOE) method, as illustrated previously in Table 7. In order to investigate the impact of parameters such as temperature, reaction time, and oil type on crude oil upgrading and the final concentrations of light oil cuts, a model is constructed based on the achieved data. Considering data compatibility and for the sake of simplifying the presented model, a cubic model is selected in the software. Table 9 and Table 10, respectively, provide a summary of the Analysis of Variance (ANOVA) for the DOE model concerning Distillates and Naphtha.
Table 9.
Analysis of Variance (ANOVA) for Distillate cut of heavy oil.
| Source | Sum of squares | df | Mean Square | F-Value | p value Prob > F | |
|---|---|---|---|---|---|---|
| Model | 0.017 | 8 | 2.112E−003 | 477.35 | < 0.0001 | Significant |
| A: Temperature | 4.254 E−003 | 1 | 4.254E−003 | 961.65 | < 0.0001 | |
| B: Reaction time | 0.011 | 1 | 0.011 | 2561.48 | < 0.0001 | |
| C: Oil type | 5.522E−004 | 1 | 5.522E−004 | 124.81 | < 0.0001 | |
| AB | 5.270E−006 | 1 | 5.270E−006 | 1.19 | 0.2903 | |
| AC | 4.120E−005 | 1 | 4.120E−005 | 9.31 | 0.0072 | |
| BC | 6.453E−005 | 1 | 6.453E−005 | 14.59 | 0.0014 | |
| A2 | 4.765E−006 | 1 | 4.765E−006 | 1.08 | 0.3139 | |
| B2 | 6.437E−004 | 1 | 6.437E−004 | 145.50 | < 0.0001 | |
| Residual | 7.521E−005 | 17 | 4.424E−006 | |||
| Lack of Fit | 7.177E−005 | 9 | 7.975E−006 | 18.55 | 0.0002 | Significant |
| Pure Error | 3.440E−006 | 8 | 4.299E−007 | |||
| Cor Total | 0.017 | 25 |
Table 10.
Analysis of Variance (ANOVA) for Naphtha cut after in-situ upgrading of heavy oil.
| Source | Sum of Squares | df | Mean Square | F-value | p value Prob > F | |
|---|---|---|---|---|---|---|
| Model | 2.443E−004 | 8 | 3.054E−005 | 1518.48 | < 0.0001 | Significant |
| A: Temperature | 5.688E−005 | 1 | 5.688E−005 | 2828.40 | < 0.0001 | |
| B: Reaction time | 2.757E−005 | 1 | 2.757E−005 | 1370.86 | < 0.0001 | |
| C: Oil type | 1.539E−004 | 1 | 1.539E−004 | 7651.57 | < 0.0001 | |
| AB | 8.633E−007 | 1 | 8.633E−007 | 42.93 | < 0.0001 | |
| AC | 7.322E−007 | 1 | 7.322E−007 | 36.41 | < 0.0001 | |
| BC | 4.262E−007 | 1 | 4.262E−007 | 21.19 | 0.0003 | |
| A2 | 1.431E−006 | 1 | 1.431E−006 | 71.17 | < 0.0001 | |
| B2 | 2.011E−006 | 1 | 2.011E−006 | 99.98 | < 0.0001 | |
| Residual | 3.419E−007 | 17 | 2.011E−008 | |||
| Lack of Fit | 3.317E−007 | 9 | 3.686E−008 | 29.12 | < 0.0001 | Significant |
| Pure Error | 1.012E−008 | 8 | 1.266E−009 | |||
| Cor Total | 2.446E−004 | 25 |
It worth mentioning that In the ANOVA table, each row corresponds to a different source of variation in the model. The Block row shows the variation attributed to blocks, which are factors assumed to be non-replicated and not interacting with the other factors. The Model row reflects how much variation in the response is explained by the model as a whole, while the Terms row separates the model into individual terms and tests their significance. The Residual row indicates the unexplained variation, and the Lack of Fit row shows how much the model predictions deviate from observed data. The Pure Error row accounts for variation observed between replicate runs. Finally, the Cor Total row represents the total variation around the mean of the data, which is split between the model and the residual.
For each source of variation, the Sum of Squares column measures the squared differences between the overall average and the variation explained by the source. The Degrees of Freedom (df) column indicates how many independent parameters were used to calculate the source’s sum of squares. The Mean Square is calculated by dividing the sum of squares by the degrees of freedom. The F Value tests the significance of each source by comparing its mean square to the residual mean square. The p value (Prob > F) indicates the probability of seeing the observed F-value if the null hypothesis (no effect) is true. Small p values (typically < 0.05) indicate significant factors, while large p values suggest the factor does not significantly affect the response.
The ANOVA results for the distillate cut, as presented in Table 9, show that temperature, reaction time, and oil type are all statistically significant factors affecting the yield of distillates. Specifically, reaction time has the largest effect, followed by temperature and oil type, with F-values indicating high significance for each factor (p values < 0.0001). The interactions between temperature and oil type (AC) and reaction time and oil type (BC) are also significant (p values 0.0072 and 0.0014, respectively), suggesting that the effect of temperature and reaction time on distillate yield depends on the oil type used. In contrast, the interaction between temperature and reaction time (AB) was not significant (p value 0.2903), indicating that these two factors do not significantly interact. The squared term for reaction time (B2) showed a significant non-linear effect on distillate yield, whereas the squared term for temperature (A2) did not. The residual sum of squares is small (7.521E−005), indicating that the model explains most of the variation in the response. However, the lack of fit (p value 0.0002) suggests that the model does not fully capture all the complexities, such as multiphase interactions or catalyst deactivation, which could be considered in future improvements.
The ANOVA results for the Naphtha cut of heavy oil which are presented in Table 10, indicate that the model as a whole is highly significant, with a p value of < 0.0001 and an F-value of 1518.48, suggesting that the factors included in the model explain a substantial portion of the variability in naphtha yield. Temperature (A), reaction time (B), and oil type (C) are all statistically significant factors, with F-values of 2828.40, 1370.86, and 7651.57, respectively, all having p values of < 0.0001. This indicates that temperature, reaction time, and oil type significantly influence naphtha production. The interaction effects between factors are also significant. The interaction between temperature and reaction time (AB) has an F-value of 42.93 and a p value of < 0.0001, indicating that temperature and reaction time interact significantly in determining naphtha yield. Similarly, the interactions between temperature and oil type (AC), and reaction time and oil type (BC) have F-values of 36.41 and 21.19, and p-values of < 0.0001 and 0.0003, respectively, showing significant effects of these factor interactions on the naphtha yield. The squared terms (A2, B2) are also statistically significant. A2 (temperature squared) and B2 (reaction time squared) have F-values of 71.17 and 99.98, with p values of < 0.0001, indicating that temperature and reaction time have non-linear effects on the naphtha yield. These significant squared terms suggest that the effect of both temperature and reaction time on the response increases as their respective values become larger. The Residual sum of squares is 3.419E−007, with a mean square of 2.011E−008, indicating that most of the variation is explained by the model, but there is still some unexplained variability. The Lack of Fit term is significant (p value < 0.0001), with an F-value of 29.12, suggesting that the model does not perfectly fit the data and some factors are not fully captured. This could be due to model assumptions or the exclusion of other influencing variables, such as multiphase flow dynamics or catalyst deactivation. The Pure Error term is very small (1.012E−008), suggesting that the experimental replicates were consistent and that the data reliability is high.
As presented in Tables 9 and 10, the ANOVA analysis for the Distillate and Naphtha cuts, respectively; temperature, reaction time, and oil type are significant factors influencing the upgrading process, with each factor showing strong statistical significance. Reaction time and temperature consistently demonstrate the most substantial effects on hydrocarbon yield, with oil type also playing a notable role in both cuts. Significant interaction effects between these factors, particularly between temperature and reaction time, highlight the importance of optimizing these parameters simultaneously for improved upgrading performance. The squared terms indicate non-linear effects of reaction time and temperature, suggesting that further increases in these factors lead to higher yields, although diminishing returns may occur at extreme values.
The final models for oil upgrading and the production of Naphtha cuts for oil types 1 and 2 are presented in the following equations, Eqs. 10 and 11, respectively.
 |
10 |
 |
11 |
The final models for oil upgrading and the production of Distillates cuts for oil types 1 and 2 are respectively represented in the following equations, Eqs. 12 and 13.
 |
12 |
 |
13 |
Regarding Eqs. 10 to 13, it is crucial to note that these equations, formulated based on real factors, can be utilized to predict the response at specific levels of each factor. In this context, the levels must be specified in their original units for each factor. These equations should not be used to determine the relative impact of each factor, as the coefficients are scaled to match the units of each factor, and there is no interruption in the center of the design space. To assess the relative impact of each factor, the coded equations in the Central Composite Design (CCD) method are employed.
An equation based on coded factors can be used to predict the response for specific levels of each factor. By default, the high levels of factors are coded as + 1, and the low levels are coded as − 1. Coded equations are valuable for identifying the relative impact of factors by comparing the coefficients of the factors. The coded equations for the Naphtha and Distillate cuts are considered in Eqs. 14 and 15, respectively.
 |
14 |
 |
15 |
Having positive coefficients for the temperature and reaction time factors (denoted as A and B, respectively) in the coded equations indicates a positive influence of these two factors on the crude oil upgrading process. The negative coefficient for the oil type parameter (C) signifies that, considering the lower initial concentrations of Distillates and Naphtha in Type 2 oil, the final concentrations for these two cuts will be lower. Therefore, Type 1 oil is more suitable for producing lighter cuts. Considering that Type 1 oil has lower initial Residue content compared to Type 2 oil and contains higher concentrations of lighter compounds; it is more suitable for in-situ upgrading.
The response surface model used in this study is primarily intended for trend analysis, focusing on the relationships between temperature, reaction time, and oil composition. While the model provides insights into the in-situ upgrading process, it is not designed for precise predictions of real-world conditions. Several simplifications, such as non-porous, single-phase flow and uniform catalyst distribution, were made to ensure computational feasibility. Complex factors like multiphase flow and catalyst deactivation were not included, limiting the model’s applicability to field-scale operations.
Dynamic simulation of heavy oil upgrading in a porous media
The examination of kinetic parameters for the upgrading reaction of crude oil in a porous medium or the observation of fluid flow in a porous medium during the upgrading process using experimental methods has not been feasible so far. Additionally, for practical applications of in-situ upgrading and enhancement in reactors, the presence of high temperature and pressure in this process makes each experiment time-consuming and costly. Therefore, the use of simulation and modeling methods is essential. With the help of simulation tools, it is possible to not only investigate in-situ upgrading of crude oil but also assess the produced products and their distribution in the porous medium.
The simulation of dynamic in-situ crude oil upgrading involves studying this process in a porous medium under flooding conditions. This allows simulating fluid flow, mass transfer, and chemical reactions in the porous medium, evaluating the impact of the in-situ crude oil upgrading process on enhanced oil recovery. The geometry of the porous medium is created in the COMSOL software, and various phenomena such as single-phase and two-phase fluid movement, mass transfer, and chemical reactions in the medium are simulated. The governing equations are solved using the finite element method based on the prevailing conditions such as temperature, fluid injection rate, concentration of reactants, etc.
In this study, dynamic simulation of this process is carried out in both single-phase flooding (injecting a fluid similar to the saturating fluid of the porous medium) and two-phase modes. The reaction products, focusing on upgrading and lighter compounds, are crucial parameters measured and evaluated to assess the upgrading process. Since static simulation has been performed to obtain effective parameters in the in-situ upgrading process, such as temperature, concentration, and reaction time, the results can be used to adjust the dynamic simulation. It is worth mentioning that dynamic simulation, being much more complex than static simulation for in-situ upgrading process, requires a significantly longer computation time, and thus, leveraging the results of static simulation aids in designing more suitable conditions and reducing the number and duration of simulations.
Single phase dynamic simulation of heavy oil for in-situ upgrading process
Reactive creeping flow in a single-phase reservoir was modeled using the Navier–Stokes equations, mass diffusion-convection balance, and reaction network equations. These equations represent the momentum, mass, and species transport balances in the porous medium, respectively.
Considering the very low Reynolds numbers in the simulations in this section, the flow is assumed to be laminar. To illustrate, the Reynolds number distribution map in the porous medium is presented for one of the simulation samples in Fig. 9. As depicted in Fig. 9, the maximum Reynolds number is approximately 1 × 10⁻⁷, which is an acceptable value for considering laminar fluid flow.
Fig. 9.

Distribution map for Reynolds number in porous media.
The pressure contour and velocity magnitude maps for the flow in the porous medium are illustrated in Figs. 10 and 11, respectively. In Fig. 10, points with significantly high pressure drops indicate that the pressure drop in the porous medium is dependent on the size of the pore throats. As shown in Fig. 11, the fluid velocity near the grains of the porous medium is zero, confirming the no-slip conditions for fluid flow through the porous medium. Additionally, this figure suggests that fluid trapping in the porous medium occurs in regions with zero velocity.
Fig. 10.
Pressure contour map in porous media.
Fig. 11.

Velocity magnitude distribution map in porous media.
To estimate the degree of crude oil upgrading and the production of lighter compounds such as VGO, distillates, and naphtha in a porous medium, a reaction network for in-situ crude oil upgrading, coupled with hydrodynamic flow in the porous medium, has been employed for simulation purposes. The Figs. 12, 13, 14, 15, 16 and 17 illustrate the concentration profiles of the produced compounds under different temperature conditions. As demonstrated, with an increase in temperature, the concentration of produced residue, as the heaviest fraction in crude oil, decreases, while the concentration of lighter compounds increases. This indicates that an increase in temperature has a positive effect on the in-situ crude oil upgrading process, leading to a reduction in the percentage of heavy oil components. This aspect was also considered in static simulations.
Fig. 12.

The production profile of products during in-situ upgrading at 575K, a) Oil Type 1, b) Oil Type 2.
Fig. 13.

The production profile of products during in-situ upgrading at 600K, (a) Oil Type 1, (b) Oil Type 2.
Fig. 14.

The production profile of products during in-situ upgrading at 630K, (a) Oil Type 1, (b) Oil Type 2.
Fig. 15.

The production profile of products during in-situ upgrading at 650K, (a) Oil Type 1, (b) Oil Type 2.
Fig. 16.

The production profile of products during in-situ upgrading at 675K, (a) Oil Type 1, (b) Oil Type 2.
Fig. 17.

The production profile of products during in-situ upgrading of at 700K, (a) Oil Type 1, (b) Oil Type 2.
Furthermore, considering that in dynamic simulations, in addition to chemical reactions, fluid flow dynamics are incorporated into the investigation, simulation results indicate the necessity to explore a broader temperature range compared to static conditions. The reason behind this lies in the fact that fluid movement reduces the residence time of crude oil in the porous medium, necessitating an increase in the reaction rate for the in-situ upgrading process to proceed satisfactorily before the crude oil exits the porous medium. Therefore, expanding the temperature range is essential to accelerate the reaction rate and enhance the production of lighter compounds before crude oil exits the porous medium.
For this purpose, crude oil types 1 and 2, underwent in-situ upgrading simulations in the temperature range of 575–700 Kelvin under single-phase conditions. The results indicate that with an increase in temperature, the rate of production of lighter compounds improves. However, beyond 700 Kelvin, there is not a significant impact on the production of lighter compounds, which is why 700 Kelvin is considered the upper limit. Since the production of distillates and naphtha is the primary objective in these simulations, the considerable impact of temperature on the in-situ crude oil upgrading process can be concluded based on the production profiles over time obtained at different temperatures.
Figures 12, 13, 14, 15, 16 and 17 depict the production diagrams of final products during the in-situ crude oil upgrading process for oil types 1 and 2 and compares the upgrading process of oil type 1 and type 2 at the same temperate. The simulation time for these tests kept constant at 100 s for better comparison of the upgrading process. As inferred from static simulations, type 1 crude oil, characterized by a higher percentage of lighter compounds compared to type 2, performed better in the production of final products. Additionally, this oil, having a lower amount of residue compared to type 2, demonstrated superior production under equivalent temperature and duration conditions for the in-situ upgrading process.
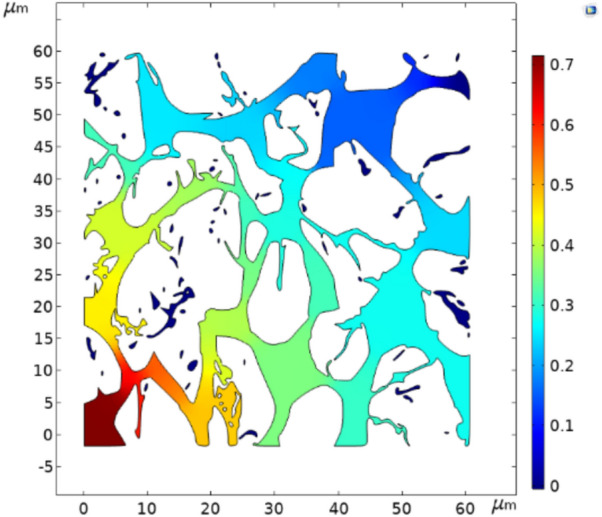
The distribution maps of Residue and Naphtha concentrations at the end of the simulation for type 1 and type 2 crudes are depicted in Figs. 18 and 19, respectively. For comparative purposes, the final concentrations at temperatures of 575 K and 700 K have been selected as the lower and upper temperature limits for these simulations. It is crucial to note that the entry point of the injected fluid is on the bottom left, and the exit point is on the top right of the geometries.
Fig. 18.

The distribution maps of Residue and Naphtha at the end of the simulation at two temperatures, 575 Kelvin (a and b) and 700 Kelvin (c and d), for oil type 1.
Fig. 19.

The distribution maps of Residue and Naphtha at the end of the simulation at two temperatures, 575 Kelvin (a and b) and 700 Kelvin (c and d), for oil type 2.
As illustrated, the concentration of Naphtha, as one of the target components in the in-situ upgrading of crude oil, gradually increases as the fluid progresses towards the outlet point of the geometry. This trend reflects the in-situ upgrading process occurring along the path from the injection point to the exit point. In contrast, there is an inverse trend for the Residue concentration, which decreases as it moves from the inlet towards the outlet of the porous medium geometry, indicating the in-situ upgrading and transformation into lighter components like Naphtha.
By comparing Figures a and b in both series (Figs. 18 and 19) with Figures c and d, it can be concluded that the temperature increase accelerates the in-situ upgrading process of crude oil. The increased concentration of Naphtha and decreased concentration of Residue in Figures c and d in the sets of Figs. 18 and 19 respectively demonstrate this effect. Regarding type 1 crude oil, as shown in Fig. 18, the produced Naphtha concentration is higher, indicating better performance for in-situ upgrading compared to type 2 crude oil, which is heavier.
Another noteworthy observation from the concentration distribution maps is that the in-situ upgrading process covers more than half of the porous medium geometry for both type 1 and type 2 crudes. After the first half, the concentrations undergo minimal changes, implying that although the process has higher speed initially, over time, as the fluids move within the porous medium, the production of final products decreases, reaching a smoother state. Additionally points with zero velocity, where the fluid is essentially trapped, will experience the highest in-situ upgrading with time. However, due to the zero velocity at these points, the chances of producing final products will be significantly low.
Given the results obtained in this section, it can be inferred that the spatial and medium factors are also significant contributors to the in-situ upgrading process of crude oil. In static simulations, where the process takes place in a non-porous reactor, only temperature, time duration, and reactant concentration have been considered as influential factors. In the dynamic mode, fluids, in addition to being in motion, undergo chemical reactions. Due to the nature of the porous medium, in some cavities with a quasi-one-way flow, fluids get trapped. Although they undergo chemical reactions for an extended period, they practically do not contribute to the final yield. Furthermore, fluid movement within the porous medium reduces the residence time for chemical reactions, necessitating an increase in reaction temperature as a key factor to further accelerate the reaction for achieving optimal production (i.e., producing lighter products more efficiently).
Dynamic two-phase flow simulation of in-situ upgrading
Dynamic two-phase simulation of in-situ crude oil upgrading has been conducted by saturating a porous medium with crude oil and injecting water to produce upgraded products from other side of the porous media. In general, this simulation process closely resembles the events that will occur under practical conditions in oil fields. Typically, secondary fluids are used in injection wells for sweeping products through the production wells in oil fields. Due to its easy accessibility, cost-effectiveness, and safety compared to other fluids and solvents, water will be the primary choice as the injection fluid.
In the dynamic two-phase simulation of in-situ crude oil upgrading, the assumption is made that the reaction occurs in all the geometries under study, and water serves the role of the sweeping fluid. Concurrently with the in-situ upgrading process, heavy crude oil components (Residue) transform into lighter components (Naphtha and Distillates), resulting in a reduction in crude oil viscosity. As crude oil upgrading progresses and viscosity decreases, the mobility of the oil will significantly improve.
Dynamic simulation involves the use of various mass transfer equations, momentum transfer equations, two-phase fluid movement, and chemical reactions. Given the utilization of the porous medium geometry in this study, simulation complexity for solving the governing equations is relatively high, leading to a significantly increased simulation duration.
In this study, various two-phase simulations have been performed in a porous medium with a constant flow rate for different scenarios. The fixed flow rate allows for result comparison regarding the level of product production, water breakthrough time, recovery coefficient, and etc. The injection flow rate is set to 1 × 10⁻¹⁰ m3/s, and the conditions of the porous medium walls are considered non-slip. A time step of 0.05 s has been adopted in the simulations.
Considering that the dynamic simulation of in-situ crude oil upgrading in a two-phase scenario result in a shorter time for the upgrading process due to the sweeping of crude oil from the porous medium by the injected water, an increase in temperature plays a crucial role in process improvement and compensation. The results of dynamic two-phase simulations are shown in Figs. 20, 21 and 22.
Fig. 20.

The production profile of upgraded products in the two-phase simulation for Type 1 oil at a temperature of 595 Kelvin.
Fig. 21.

The production profile of upgraded products in the two-phase simulation for Type 2 oil at a temperature of 595 Kelvin.
Fig. 22.

The production profile of upgraded products in the two-phase simulation for Type 2 oil at a temperature of 650 Kelvin.
As demonstrated, an increase in temperature leads to a more rapid reduction in the concentration of heavy crude oil components (Residue), and consequently, lighter components are produced sooner. Moreover, the increase in temperature results in decreased fluid viscosity, enhancing fluid mobility within the porous medium. This, in turn, accelerates the production of lighter components. Therefore, by increasing the temperature of the porous medium, fluids can be swept more effectively with higher flow rates. Although increasing the flow rate reduces the time available for reactions within the porous medium, an increase in temperature compensates for this, completing the reaction in a shorter time.
By examining the concentration distribution maps of fluids in the porous medium and comparing them, the role of temperature in the in-situ upgrading of crude oil using the investigated reaction network is evident. For a fixed time interval, concentration distribution for higher temperature experiments is greater, owing to the increased reaction rates of the crude oil upgrading network and the viscosity reduction resulting from the dual enhancement factors of upgrading and temperature.
The map depicting the concentration distribution of heavy compounds (Residue) in Type 1 crude oil, as shown in Figs. 23 and 24, provides a clearer understanding of the temperature’s role in enhancing the performance of in-situ crude oil upgrading in a dynamic scenario. As evident, upgrading the crude oil at a higher temperature, at the same time point, has significantly accelerated the reduction in Residue concentration.
Fig. 23.

The concentration distribution of heavy compounds (Residue) in Type 1 crude oil at 595K.
Fig. 24.

The concentration distribution of heavy compounds (Residue) in Type 1 crude oil at 650K.
Conclusion
The in-situ upgrading of heavy oil offers a promising alternative to conventional extraction and surface processing methods. This study advances the understanding of this process by integrating kinetic models with CFD simulations, providing valuable insights into dynamic in-situ upgrading in porous media. The results highlight the significant influence of temperature, residence time, and oil composition on the efficiency of upgrading and the production of lighter hydrocarbon fractions.
Specifically, the simulations show that, within the scope of the conditions modeled in this study, increasing the reaction temperature from 575 to 700 K results in a 30% increase in lighter hydrocarbon production (naphtha and distillates) and a 40% reduction in residue content. Additionally, under the simulation conditions used in this work, extending the reaction time from 1000 to 4000 s increases naphtha production by 25%, emphasizing the significant role of residence time in optimizing upgrading performance.
A 50% reduction in viscosity was observed under the optimized conditions, enhancing fluid mobility and recovery potential. The dynamic simulations also suggest that reservoir heterogeneity can affect reaction efficiency, highlighting the importance of tailored operational strategies for field-scale implementation. These findings are specific to the simulation setup used in this study and should be interpreted within this context.
This work provides new insights into the complex interactions between chemical reactions and fluid dynamics within reservoirs. The integration of reaction networks with CFD simulations extends existing models to dynamic conditions and enhances the understanding of the in-situ upgrading process. The findings lay the groundwork for future improvements in unconventional heavy oil recovery techniques and provide a foundation for further research into real-world applications of in-situ upgrading, including the incorporation of multiphase flow, advanced catalysts, and field-scale validation.
While this study offers valuable insights into the in-situ upgrading of heavy oil, several limitations must be acknowledged. The simulations in this study assume a constant temperature field ranging from 575 to 700 K, which is challenging to maintain under actual reservoir conditions where temperature gradients due to geothermal variations or heat loss are common. This simplification could affect the reaction rates and kinetic model accuracy, as real-world conditions are likely to show more variability in temperature distribution. Additionally, the study primarily focuses on single-phase and two-phase flow, while real-world reservoir conditions often involve multiphase flow (oil, gas, and water). The exclusion of gas-phase dynamics in the current model means that phenomena such as gas injection or gas generation during the upgrading process were not considered, which could impact fluid dynamics and reaction efficiency.
Another assumption in the model is the uniform distribution of the catalyst throughout the porous medium. However, in actual reservoirs, catalyst transport is not uniform, and deactivation due to coke formation or fouling could lead to significant variations in the reaction rates over time. This aspect was not captured in the present simulations but is a crucial factor for realistic modeling of in-situ upgrading. Furthermore, the model does not account for the formation of coke or other solid deposits, which could block pore spaces and reduce permeability in the porous medium, ultimately affecting the fluid flow and reaction rates. These limitations should be taken into consideration when interpreting the findings, as they may influence the long-term performance of the upgrading process in practical applications. Future studies should incorporate these factors, including multiphase flow, catalyst deactivation, and pore blockage, to enhance the realism and accuracy of the model for in-situ upgrading under reservoir-like conditions.
Acknowledgements
The authors express their gratitude to Tarbiat Modares University (TMU) and the Nargan Amitis Energy Development Company (NAED) for providing assistance for this research.
Abbreviations
- CFD
Computational fluid dynamic
- DOE
Design of experiment
- ANOVA
Analysis of variance
- Ni–Mo–W
Nickel–molybdenum–tungsten catalyst
- VGO
Vacuum gas-oil
- SAGD
Steam-assisted gravity drainage
- EOR
Enhanced oil recovery
- OOIP
Original oil in place
- R
Residual crude oil
- D
Distillates
- N
Naphtha
- G
Gases
List of symbols
- R
Reaction rates
- yi
Molar concentration of specious
- U
Velocity (m/s)
- K
Reaction rate constant follows the Arrhenius laws
- C
Concentration (kg/m3)
- T
Temperature (k, Kelvin)
- Tref
Reference temperature (equal to one Kelvin)
- t
Time (s)
- ρ
Density (kg/m3)
- k
Reaction rate constant (mol/s)
- K
Kelvin
- Af
Frequency factor
- nf
Temperature exponent
- Ef
Activation energy
- Rg
Universal gas constant
- Kf
Reaction rate constant

Volume fraction
- Γ
Reinitialization parameter in level set equation
- εls
Parameter controlling interface thickness
Author contributions
Mr. Arman Aryanzadeh conceptualized the research and also did the modeling and simulation activities of the in-situ upgrading using CFD techniques. Additionally, he provided the first draft of the manuscript. Dr. Arezou Jafari supervised the project. Also, she read and edited the manuscript. Dr. Mahdi Abdi-Khanghah administered the project and read and edited the manuscript.
Data availability
All data generated or analysed during this study are included in this published article.
Competing interests
The authors declare no competing interests.
Footnotes
Publisher’s note
Springer Nature remains neutral with regard to jurisdictional claims in published maps and institutional affiliations.
References
- 1.Brozynski, M. T. & Leibowicz, B. D. Decarbonizing power and transportation at the urban scale: An analysis of the Austin, Texas Community Climate Plan. Sustain. Cities Soc.43, 41–54 (2018). [Google Scholar]
- 2.Canton, H. International energy agency—IEA. In The Europa Directory of International Organizations 2021 684–686 (Routledge, 2021).
- 3.Al-Marshed, A. et al. Optimization of heavy oil upgrading using dispersed nanoparticulate iron oxide as a catalyst. Energy Fuels29(10), 6306–6316 (2015). [Google Scholar]
- 4.Muraza, O. & Galadima, A. Aquathermolysis of heavy oil: A review and perspective on catalyst development. Fuel157, 219–231 (2015). [Google Scholar]
- 5.Perez-Perez, A. et al. Simulations of in-situ upgrading process: Interpretation of laboratory experiments and study of field-scale test. SPE J.24(06), 2711–2730 (2019). [Google Scholar]
- 6.Bueno, N. & Mejia, J. M. Heavy oil in-situ upgrading evaluation by a laboratory-calibrated EoS-based reservoir simulator. J. Petrol. Sci. Eng.196, 107455 (2021). [Google Scholar]
- 7.Félix, G. et al. Analysis of kinetic models for hydrocracking of heavy oils for In-situ and Ex-situ applications. Fuel323, 124322 (2022). [Google Scholar]
- 8.Namdar, H. et al. Effective parameters on in-situ oil upgrading with nanocatalyst in large scale: Kinetics modeling. J. Anal. Appl. Pyrol.173, 106073 (2023). [Google Scholar]
- 9.Dehkordi, J. A. et al. Kinetic studies on extra heavy crude oil upgrading using nanocatalysts by applying CFD techniques. Chin. J. Chem. Eng.26(2), 343–355 (2018). [Google Scholar]
- 10.Pei, S. et al. Experimental study on thermal cracking reactions of ultra-heavy oils during air injection assisted in-situ upgrading process. J. Petrol. Sci. Eng.195, 107850 (2020). [Google Scholar]
- 11.Tang, X. et al. In-situ heavy oil upgrading by high temperature oxidation through air injection. In E3S Web of Conferences (EDP Sciences, 2023).
- 12.Guan, H. et al. Economic operation of a fluid catalytic cracking process using self-optimizing control and reconfiguration. J. Taiwan Inst. Chem. Eng.96, 104–113 (2019). [Google Scholar]
- 13.Hyne, J., et al. Aquathermolysis of heavy oils. Rev. Tec. INTEVEP (Venezuela)2(2) (1982).
- 14.Rivas, O., Campos, R. & Borges, L. Experimental evaluation of transition metals salt solutions as additives in steam recovery processes. In SPE Annual Technical Conference and Exhibition? (SPE, 1988).
- 15.Clark, P. D. & Hyne, J. B. Chemistry of organosulphur compound types occurring in heavy oil sands: 3. Reaction of thiophene and tetrahydrothiophene with vanadyl and nickel salts. Fuel63(12), 1649–1654 (1984). [Google Scholar]
- 16.Clark, P. D. et al. The chemistry of organosulphur compound types occurring in heavy oils: 4. The high-temperature reaction of thiophene and tetrahydrothiophene with aqueous solutions of aluminium and first-row transition-metal cations. Fuel66(10), 1353–1357 (1987). [Google Scholar]
- 17.Clark, P. D. et al. Chemistry of organosulphur compound types occurring in heavy oil sands: 5. Reaction of thiophene and tetrahydrothiophene with aqueous group VIIIB metal species at high temperature. Fuel66(12), 1699–1702 (1987). [Google Scholar]
- 18.Clark, P. D. & Kirk, M. J. Studies on the upgrading of bituminous oils with water and transition metal catalysts. Energy Fuels8(2), 380–387 (1994). [Google Scholar]
- 19.Wen, S. et al. A study on catalytic aquathermolysis of heavy crude oil during steam stimulation. In SPE International Conference on Oilfield Chemistry? (SPE, 2007).
- 20.Zhao, X.-F., Tan, X.-H. & Liu, Y.-J. Behaviors of oil-soluble catalyst for aquathermolysis of heavy oil. Ind. Catal.11, 31–34 (2008). [Google Scholar]
- 21.Xu, H.-X. & Pu, C.-S. Mechanism of underground heavy oil catalytic aquathermolysis. Chem. Technol. Fuels Oils53, 913–921 (2018). [Google Scholar]
- 22.Yi, Y. et al. Change of asphaltene and resin properties after catalytic aquathermolysis. Pet. Sci.6, 194–200 (2009). [Google Scholar]
- 23.Junaid, A. et al. Integrated extraction and low severity upgrading of oilsands bitumen by activated natural zeolite catalysts. Fuel94, 457–464 (2012). [Google Scholar]
- 24.Junaid, A.S. et al. Viscosity reduction and upgrading of Athabasca oilsands bitumen by natural zeolite cracking. In Proceedings of the International Conference on Chemical Engineering. (Citeseer, 2010).
- 25.Merissa, S. et al. Preliminary study of natural zeolite as catalyst for decreasing the viscosity of heavy oil. In AIP Conference Proceedings (American Institute of Physics, 2013).
- 26.Strausz, O. P. et al. Upgrading of Alberta’s heavy oils by superacid-catalyzed hydrocracking. Energy Fuels13(3), 558–569 (1999). [Google Scholar]
- 27.Wang, H. et al. Supporting tungsten oxide on zirconia by hydrothermal and impregnation methods and its use as a catalyst to reduce the viscosity of heavy crude oil. Energy Fuels26(11), 6518–6527 (2012). [Google Scholar]
- 28.Chen, Y. et al. Laboratory experiments and field tests of an amphiphilic metallic chelate for catalytic aquathermolysis of heavy oil. Energy Fuels22(3), 1502–1508 (2008). [Google Scholar]
- 29.Chen, Y., Yang, C. & Wang, Y. Gemini catalyst for catalytic aquathermolysis of heavy oil. J. Anal. Appl. Pyrol.89(2), 159–165 (2010). [Google Scholar]
- 30.Chao, K. et al. Laboratory experiments and field test of a difunctional catalyst for catalytic aquathermolysis of heavy oil. Energy Fuels26(2), 1152–1159 (2012). [Google Scholar]
- 31.Junaid, A. et al. On the role of water in natural-zeolite-catalyzed cracking of athabasca oilsands bitumen. Energy Fuels28(5), 3367–3376 (2014). [Google Scholar]
- 32.Chen, Y. et al. The viscosity reduction of nano-keggin-K3PMo12O40 in catalytic aquathermolysis of heavy oil. Fuel88(8), 1426–1434 (2009). [Google Scholar]
- 33.Chen, Y. et al. GC-MS used in study on the mechanism of the viscosity reduction of heavy oil through aquathermolysis catalyzed by aromatic sulfonic H3PMo12O40. Energy35(8), 3454–3460 (2010). [Google Scholar]
- 34.Jing, P. et al. Visbreaking of heavy petroleum oil catalyzed by SO42−/ZrO2 solid super-acid doped with Ni2+ or Sn2+. Front. Chem. Eng. China2, 186–190 (2008). [Google Scholar]
- 35.Ovalles, C. et al. Use of a dispersed molybdenum catalyst and mechanistic studies for upgrading extra-heavy crude oil using methane as source of hydrogen. Energy Fuels12(2), 379–385 (1998). [Google Scholar]
- 36.Zhao, F. et al. Study on hydrogen donors catalytic upgrading of heavy oil using ultradispersed catalyst. J. Chem. Pharm. Res7(4), 1370–1377 (2015). [Google Scholar]
- 37.Ovalles, C. et al. Use of a dispersed iron catalyst for upgrading extra-heavy crude oil using methane as source of hydrogen☆. Fuel82(8), 887–892 (2003). [Google Scholar]
- 38.Shokrlu, Y. H. & Babadagli, T. Viscosity reduction of heavy oil/bitumen using micro-and nano-metal particles during aqueous and non-aqueous thermal applications. J. Petrol. Sci. Eng.119, 210–220 (2014). [Google Scholar]
- 39.Yang, Z. et al. Preparation of silica supported nanoscale zero valence iron and its feasibility in viscosity reduction of heavy oil. Micro Nano Lett.9(5), 355–358 (2014). [Google Scholar]
- 40.Wei, L., Zhu, J.-H. & Qi, J.-H. Application of nano-nickel catalyst in the viscosity reduction of Liaohe extra-heavy oil by aqua-thermolysis. J.Fuel Chem. Technol.35(2), 176–180 (2007). [Google Scholar]
- 41.Greff, J. & Babadagli, T. Use of nano-metal particles as catalyst under electromagnetic heating for in-situ heavy oil recovery. J. Petrol. Sci. Eng.112, 258–265 (2013). [Google Scholar]
- 42.Hamedi Shokrlu, Y. & Babadagli, T. In-situ upgrading of heavy oil/bitumen during steam injection by use of metal nanoparticles: A study on in-situ catalysis and catalyst transportation. SPE Reserv. Eval. Eng.16(03), 333–344 (2013). [Google Scholar]
- 43.Wu, C. et al. The use of a nano-nickel catalyst for upgrading extra-heavy oil by an aquathermolysis treatment under steam injection conditions. Pet. Sci. Technol.31(21), 2211–2218 (2013). [Google Scholar]
- 44.Alkhaldi, S. & Husein, M. M. Hydrocracking of heavy oil by means of in situ prepared ultradispersed nickel nanocatalyst. Energy Fuels28(1), 643–649 (2014). [Google Scholar]
- 45.Hamedi-Shokrlu, Y. & Babadagli, T. Kinetics of the in-situ upgrading of heavy oil by nickel nanoparticle catalysts and its effect on cyclic-steam-stimulation recovery factor. SPE Reserv. Eval. Eng.17(03), 355–364 (2014). [Google Scholar]
- 46.Greff, J. & Babadagli, T. Catalytic effects of nano-size metal ions in breaking asphaltene molecules during thermal recovery of heavy-oil. In SPE Annual Technical Conference and Exhibition? (SPE, 2011).
- 47.Nassar, N. N. & Husein, M. M. Ultradispersed particles in heavy oil: Part I, preparation and stabilization of iron oxide/hydroxide. Fuel Process. Technol.91(2), 164–168 (2010). [Google Scholar]
- 48.Hendraningrat, L., Souraki, Y. & Ole, T. Experimental investigation of decalin and metal nanoparticles-assisted bitumen upgrading during catalytic aquathermolysis. In SPE/EAGE European unconventional resources conference and exhibition (European Association of Geoscientists & Engineers, 2014).
- 49.Nassar, N. N., Husein, M. M. & Pereira-Almao, P. Ultradispersed particles in heavy oil: Part II, sorption of H2S (g). Fuel Process. Technol.91(2), 169–174 (2010). [Google Scholar]
- 50.Abdrafikova, I. et al. Conversion of extra-heavy Ashal’chinskoe oil in hydrothermal catalytic system. Pet. Chem.55, 104–111 (2015). [Google Scholar]
- 51.Ovalles, C., Rivero, V. & Salazar, A. Downhole upgrading of orinoco basin extra-heavy crude oil using hydrogen donors under steam injection conditions. Effect of the presence of iron nanocatalysts. Catalysts5(1), 286–297 (2015). [Google Scholar]
- 52.Hamedi Shokrlu, Y. & Babadagli, T. Effects of nano sized metals on viscosity reduction of heavy oil/bitumen during thermal applications. In SPE Canada Unconventional Resources Conference (SPE, 2010).
- 53.Galarraga, C. E. & Pereira-Almao, P. Hydrocracking of athabasca bitumen using submicronic multimetallic catalysts at near in-reservoir conditions. Energy Fuels24(4), 2383–2389 (2010). [Google Scholar]
- 54.Hashemi, R., Nassar, N. N. & Pereira-Almao, P. Transport behavior of multimetallic ultradispersed nanoparticles in an oil-sands-packed bed column at a high temperature and pressure. Energy Fuels26(3), 1645–1655 (2012). [Google Scholar]
- 55.Hashemi, R., Nassar, N. N. & Pereira Almao, P. Enhanced heavy oil recovery by in situ prepared ultradispersed multimetallic nanoparticles: A study of hot fluid flooding for athabasca bitumen recovery. Energy Fuels27(4), 2194–2201 (2013). [Google Scholar]
- 56.Hashemi, R., Nassar, N. N. & Pereira Almao, P. In situ upgrading of athabasca bitumen using multimetallic ultradispersed nanocatalysts in an oil sands packed-bed column: Part 1. Produced liquid quality enhancement. Energy Fuels28(2), 1338–1350 (2014). [Google Scholar]
- 57.Hashemi, R., Nassar, N. N. & Pereira Almao, P. In situ upgrading of athabasca bitumen using multimetallic ultradispersed nanocatalysts in an oil sands packed-bed column: Part 2. Solid analysis and gaseous product distribution. Energy Fuels28(2), 1351–1361 (2014). [Google Scholar]
- 58.Liu, X. et al. Preparation of silica-supported nanoFe/Ni alloy and its application in viscosity reduction of heavy oil. Micro Nano Lett.10(3), 167–171 (2015). [Google Scholar]
- 59.Li, K. et al. Application of carbon nanocatalysts in upgrading heavy crude oil assisted with microwave heating. Nano Lett.14(6), 3002–3008 (2014). [DOI] [PubMed] [Google Scholar]
- 60.Zamani, A., Maini, B. & Pereira-Almao, P. Experimental study on transport of ultra-dispersed catalyst particles in porous media. Energy Fuels24(9), 4980–4988 (2010). [Google Scholar]
- 61.Zhong, L., et al. Liaohe extra-heavy crude oil underground aquathermolytic treatments using catalyst and hydrogen donors under steam injection conditions. In SPE International Improved Oil Recovery Conference in Asia Pacific (PE, 2003).
- 62.Ovalles, C. et al. Upgrading of extra-heavy crude oil by direct use of methane in the presence of water: Deuterium-labelled experiments and mechanistic considerations. Fuel74(8), 1162–1168 (1995). [Google Scholar]
- 63.Liu, Y. & Fan, H. The effect of hydrogen donor additive on the viscosity of heavy oil during steam stimulation. Energy Fuels16(4), 842–846 (2002). [Google Scholar]
- 64.Ovalles, C. et al. Downhole upgrading of extra-heavy crude oil using hydrogen donors and methane under steam injection conditions. Pet. Sci. Technol.21(1–2), 255–274 (2003). [Google Scholar]
- 65.Fan, Z.-X. et al. Upgrading and viscosity reduction of super heavy oil by aqua-thermolysis with hydrogen donor. J. Fuel Chem. Technol.34(3), 315 (2006). [Google Scholar]
- 66.Li, J. et al. Influences on the aquathermolysis of heavy oil catalyzed by two different catalytic ions: Cu2+ and Fe3+. Energy Fuels27(5), 2555–2562 (2013). [Google Scholar]
- 67.Almao, P. P. In situ upgrading of bitumen and heavy oils via nanocatalysis. Can. J. Chem. Eng.90(2), 320–329 (2012). [Google Scholar]
- 68.Li, Y. et al. A review of in situ upgrading technology for heavy crude oil. Petroleum7(2), 117–122 (2021). [Google Scholar]
- 69.Sánchez, S., Rodríguez, M. A. & Ancheyta, J. Kinetic model for moderate hydrocracking of heavy oils. Ind. Eng. Chem. Res.44(25), 9409–9413 (2005). [Google Scholar]
- 70.Melo, J. A. et al. Renewable hydrocarbon production from waste cottonseed oil pyrolysis and catalytic upgrading of vapors with Mo-Co and Mo-Ni catalysts supported on γ-Al2o3. Nanomaterials11(7), 1659 (2021). [DOI] [PMC free article] [PubMed] [Google Scholar]
- 71.Wang, W. et al. Hydrodeoxygenation of p-cresol on unsupported Ni–P catalysts prepared by thermal decomposition method. Catal. Commun.41, 41–46 (2013). [Google Scholar]
- 72.Yi, Y. et al. Unsupported NiMoW sulfide catalysts for hydrodesulfurization of dibenzothiophene by thermal decomposition of thiosalts. J. Mol. Catal. A Chem.351, 120–127 (2011). [Google Scholar]
- 73.Galarraga, C. E. et al. Kinetic models for upgrading athabasca bitumen using unsupported NiWMo catalysts at low severity conditions. Ind. Eng. Chem. Res.51(1), 140–146 (2012). [Google Scholar]
- 74.Khanghah, M. A. & Jafari, A. Kinetic modeling and CFD simulation of catalytic upgrading reactions: From batch to continuous reactors. J. Taiwan Inst. Chem. Eng.134, 104254 (2022). [Google Scholar]
- 75.Ladd, A. J. & Szymczak, P. Reactive flows in porous media: Challenges in theoretical and numerical methods. Annu. Rev. Chem. Biomol. Eng.12(1), 543–571 (2021). [DOI] [PubMed] [Google Scholar]
- 76.Loria, H. et al. Kinetic modeling of bitumen hydroprocessing at in-reservoir conditions employing ultradispersed catalysts. Energy Fuels25(4), 1364–1372 (2011). [Google Scholar]
- 77.Nasr, M. S., Esmaeilnezhad, E. & Choi, H. J. Effect of silicon-based nanoparticles on enhanced oil recovery. J. Taiwan Inst. Chem. Eng.122, 241–259 (2021). [Google Scholar]
- 78.Mohammadmoradi, P. & Kantzas, A. DyMAS: A direct multi-scale pore-level simulation approach. In SPE Western Regional Meeting (OnePetro, 2017).
- 79.Kudchadker, A. & Zwolinski, B. Vapor pressure and boiling points of normal alkanes, C21 to C100. J. Chem. Eng. Data11(2), 253–255 (1966). [Google Scholar]
- 80.Hill, C. G. & Root, T. W. Introduction to Chemical Engineering Kinetics and Reactor Design (John Wiley & Sons, 2014). [Google Scholar]
- 81.Armas, J. D. et al. In-situ upgrading in a dolomite porous medium: A kinetic model comparison and nanocatalyst deposition study. J. Petrol. Sci. Eng.205, 108799 (2021). [Google Scholar]
- 82.Kim, S. & Karrila, S. J. Microhydrodynamics: Principles and Selected Applications (Butterworth-Heinemann, 2013). [Google Scholar]
- 83.Fanchi, J. Integrated Reservoir Asset Management: Principles and Best Practices (Gulf Professional Publishing, 2010). [Google Scholar]
- 84.Bracconi, M. CFD modeling of multiphase flows with detailed microkinetic description of the surface reactivity. Chem. Eng. Res. Des.179, 564–579 (2022). [Google Scholar]
- 85.Yang, X. et al. Recent progress in multi-scale modeling and simulation of flow and solute transport in porous media. Wiley Interdiscip. Rev. Water8(6), e1561 (2021). [Google Scholar]
Associated Data
This section collects any data citations, data availability statements, or supplementary materials included in this article.
Data Availability Statement
All data generated or analysed during this study are included in this published article.