

Abstract
Symptom management is one of the major concerns of cancer survivors, including Asian American breast cancer survivors (ABS) during their survivorship process. The purpose of this randomized intervention study was to determine the efficacy of a technology-based educational intervention in decreasing multiple domains of symptom experience among ABS. This was a part of a randomized clinical trial with repeated measures among 199 ABS recruited through online and offline groups/communities for Asian Americans. The intervention was a technology-based educational (information and coaching/support) program using computers and mobile devices to change health behaviors to improve the women’s survivorship experience. The data were collected using multiple items on background and disease factors, and the Memorial Symptom Assessment Scale-Short Form (MSAS-SF). The data analysis was conducted using an intent-to-treat approach. Although the differences were not statistically significant, all multiple domain symptom scores of the intervention group decreased from pre-test to post 3 months, while only psychological symptom distress scores of the control group decreased from pre-test to post 3 months. Depending on the domain of symptoms, the significant mediators, with total, direct, or indirect effects, were different at different time points. For instance, attitudes, perceived barriers, social influences, social support, and self-efficacy showed significant total mediation effects on the total symptom distress scores only at pre-test (p < 0.05). The efficacy of a technology-based education intervention was supported in decreasing symptoms among ABS. Health educators need to consider that culturally tailored technology-based educational interventions could help improve the symptom experience of ABS.
Keywords: Asian Americans, Breast cancer, Cancer survivors, Symptom, Technology, Intervention, Education
Introduction
Due to advances in early detection and treatment, there have been drastic increases in the number of breast cancer survivors, and breast cancer survivors are now nearly 44% of female cancer survivors in the U.S. [1]. Breast cancer survivors experience various symptoms due to combinations of treatments, including surgery, radiation, or chemotherapy [2]. Racial/ethnic minorities are reported to have inadequate symptom management compared with non-minorities [3]. Racial/ethnic minorities with lower socioeconomic status tend to delay their diagnosis and treatment, and they frequently present with a later-stage disease than non-minority patients [3].
According to a report by the Institute of Medicine (the National Academy of Medicine) [4] racial/ethnic minority cancer survivors frequently lack information, support, and communication with health care providers, and they often have inadequate symptom management. Indeed, Asian American breast cancer survivors reportedly carry a heavy burden of physical and psychological symptoms, tend not to report their symptoms, delay getting medical help, and rarely get necessary support due to their unique situations (e.g., language barriers, cultural values, beliefs) [5]. They reportedly tend to experience a lower quality of life with little information and support compared to Whites [6]. Moreover, the COVID19 pandemic, along with anti-Asian incidents in recent years, has put additional stress on their survivorship experience, which is frequently harmful to this specific population [7].
Despite the clear need for information and support among Asian American breast cancer survivors, few educational interventions have been proposed and used among these women [8]. Interestingly, during the COVID19 pandemic, health care providers’ interest in technology-based interventions through computers and mobile platforms has dramatically increased due to the convenience of non-face-to-face interactions. Technology-based educational interventions provide high flexibility and accessibility in providing information and coaching/support to racial/ethnic minority groups, and they tend to be cheaper than in-person interventions in health care systems [9]. Furthermore, the technology-based approach could work better among this specific population because of the stigma attached to breast cancer, their fear about the pandemic, and recent Anti-Asian racism [10]. More importantly, Asian Americans were reported to prefer technology-based interventions without physical travel to in-person interventions [11]. However, few technology-based educational interventions have been developed and used for racial/ethnic minority breast cancer survivors, including this specific population [11].
The purpose of this study was to examine the efficacy of a technology-based educational (information and coaching/support) intervention in improving symptom experience of Asian American breast cancer survivors during their survivorship process. This was a part of a larger study on breast cancer survivorship of Asian American breast cancer survivors. This study included only three sub-ethnic groups of Asian Americans (Chinese, Korean, and Japanese) as the first group to approach because of similarities in cultural values and attitudes (e.g., Confucian cultural influences, similar East Asian heritages). The specific aims of this study included:
Aim 1. To examine whether the intervention group (who used the intervention and the American Cancer Society [ACS] website on breast cancer) had significantly greater improvements than the control group (who used only the ACS website) in multiple domains of symptoms from baseline (pre-test) to Time Points 1 (post 1-month; primary) and 2 (post 3 months; secondary).
Aim 2. To determine whether theory-based variables (attitudes, self-efficacy, perceived barriers, and social influences related to breast cancer survivorship) mediated the effects of the intervention on the women’s symptom experience.
Theoretical Basis
This study adopted Bandura’s Self-Efficacy Theory of Behavioral Change [12], which is a subset of the Social Cognitive Theory [13] based on the Social Learning Theory [14]. Bandura’s theory [12] has been widely used as the theoretical basis for many interventions to address the needs for information and coaching/support. The theory postulates that improving women’s attitudes, self-efficacy, perceived barriers, and social influences could modify health behaviors and improve health outcomes. In this study, five domains of the symptoms were chosen as primary outcomes (Aim #1) because they were the primary target outcomes of the intervention. The tested mediators came from Bandura’s theory (attitudes, self-efficacy, perceived barriers, and social influences: Aim 2) [12–14].
Methods
A randomized control group design was adopted for this study with repeated measures at three times (pre-test, post 1 month, & post 3 months), respectively. Two groups of participants were included: (a) 95 in the intervention group who used the website on breast cancer by the American Cancer Society (ACS; a control group); (b) 104 Asian American breast cancer survivors who used the intervention and the website by ACS (an intervention group). The website by ACS was inclusive of evidence-based information on multiple aspects of breast cancer (e.g., prevention, causes, genetics, screening, diagnosing, treatment, coping, clinical trials with research findings, and statistics), and the information was available in various languages.
Settings and Samples
The recruitment settings were: (a) Internet support groups with social media groups and (b) traditional communities/groups for Asian Americans. More than 400 K Internet support groups/communities (with up to 3587 members per each) existed in a google search. Considering that racial/ethnic minorities could be difficult to recruit only through Internet groups/communities, traditional communities/groups for Asian Americans, such as churches, professional groups, organizations, and health care centers, were also contacted for study announcements.
A total of 843 Asian American breast cancer survivors agreed to participate in the study (see Fig. 1), but only 268 women who were eligible for the study were contactable when the study team reached out to schedule an information session on the logistics related to study participation. In the process of data analysis, a total of 69 women were eliminated due to missing data (e.g., missing data in outcome variables and mediators; see Fig. 1). The analytic data set included a total of 199 Asian American breast cancer survivors, which were adequate to address the specific aims. Based on a power analysis through G*Power (with a significance level of 5%, an effect size of 0.25, and an 80% power), 86 would be adequate for the specific aims of this study.
Fig. 1.
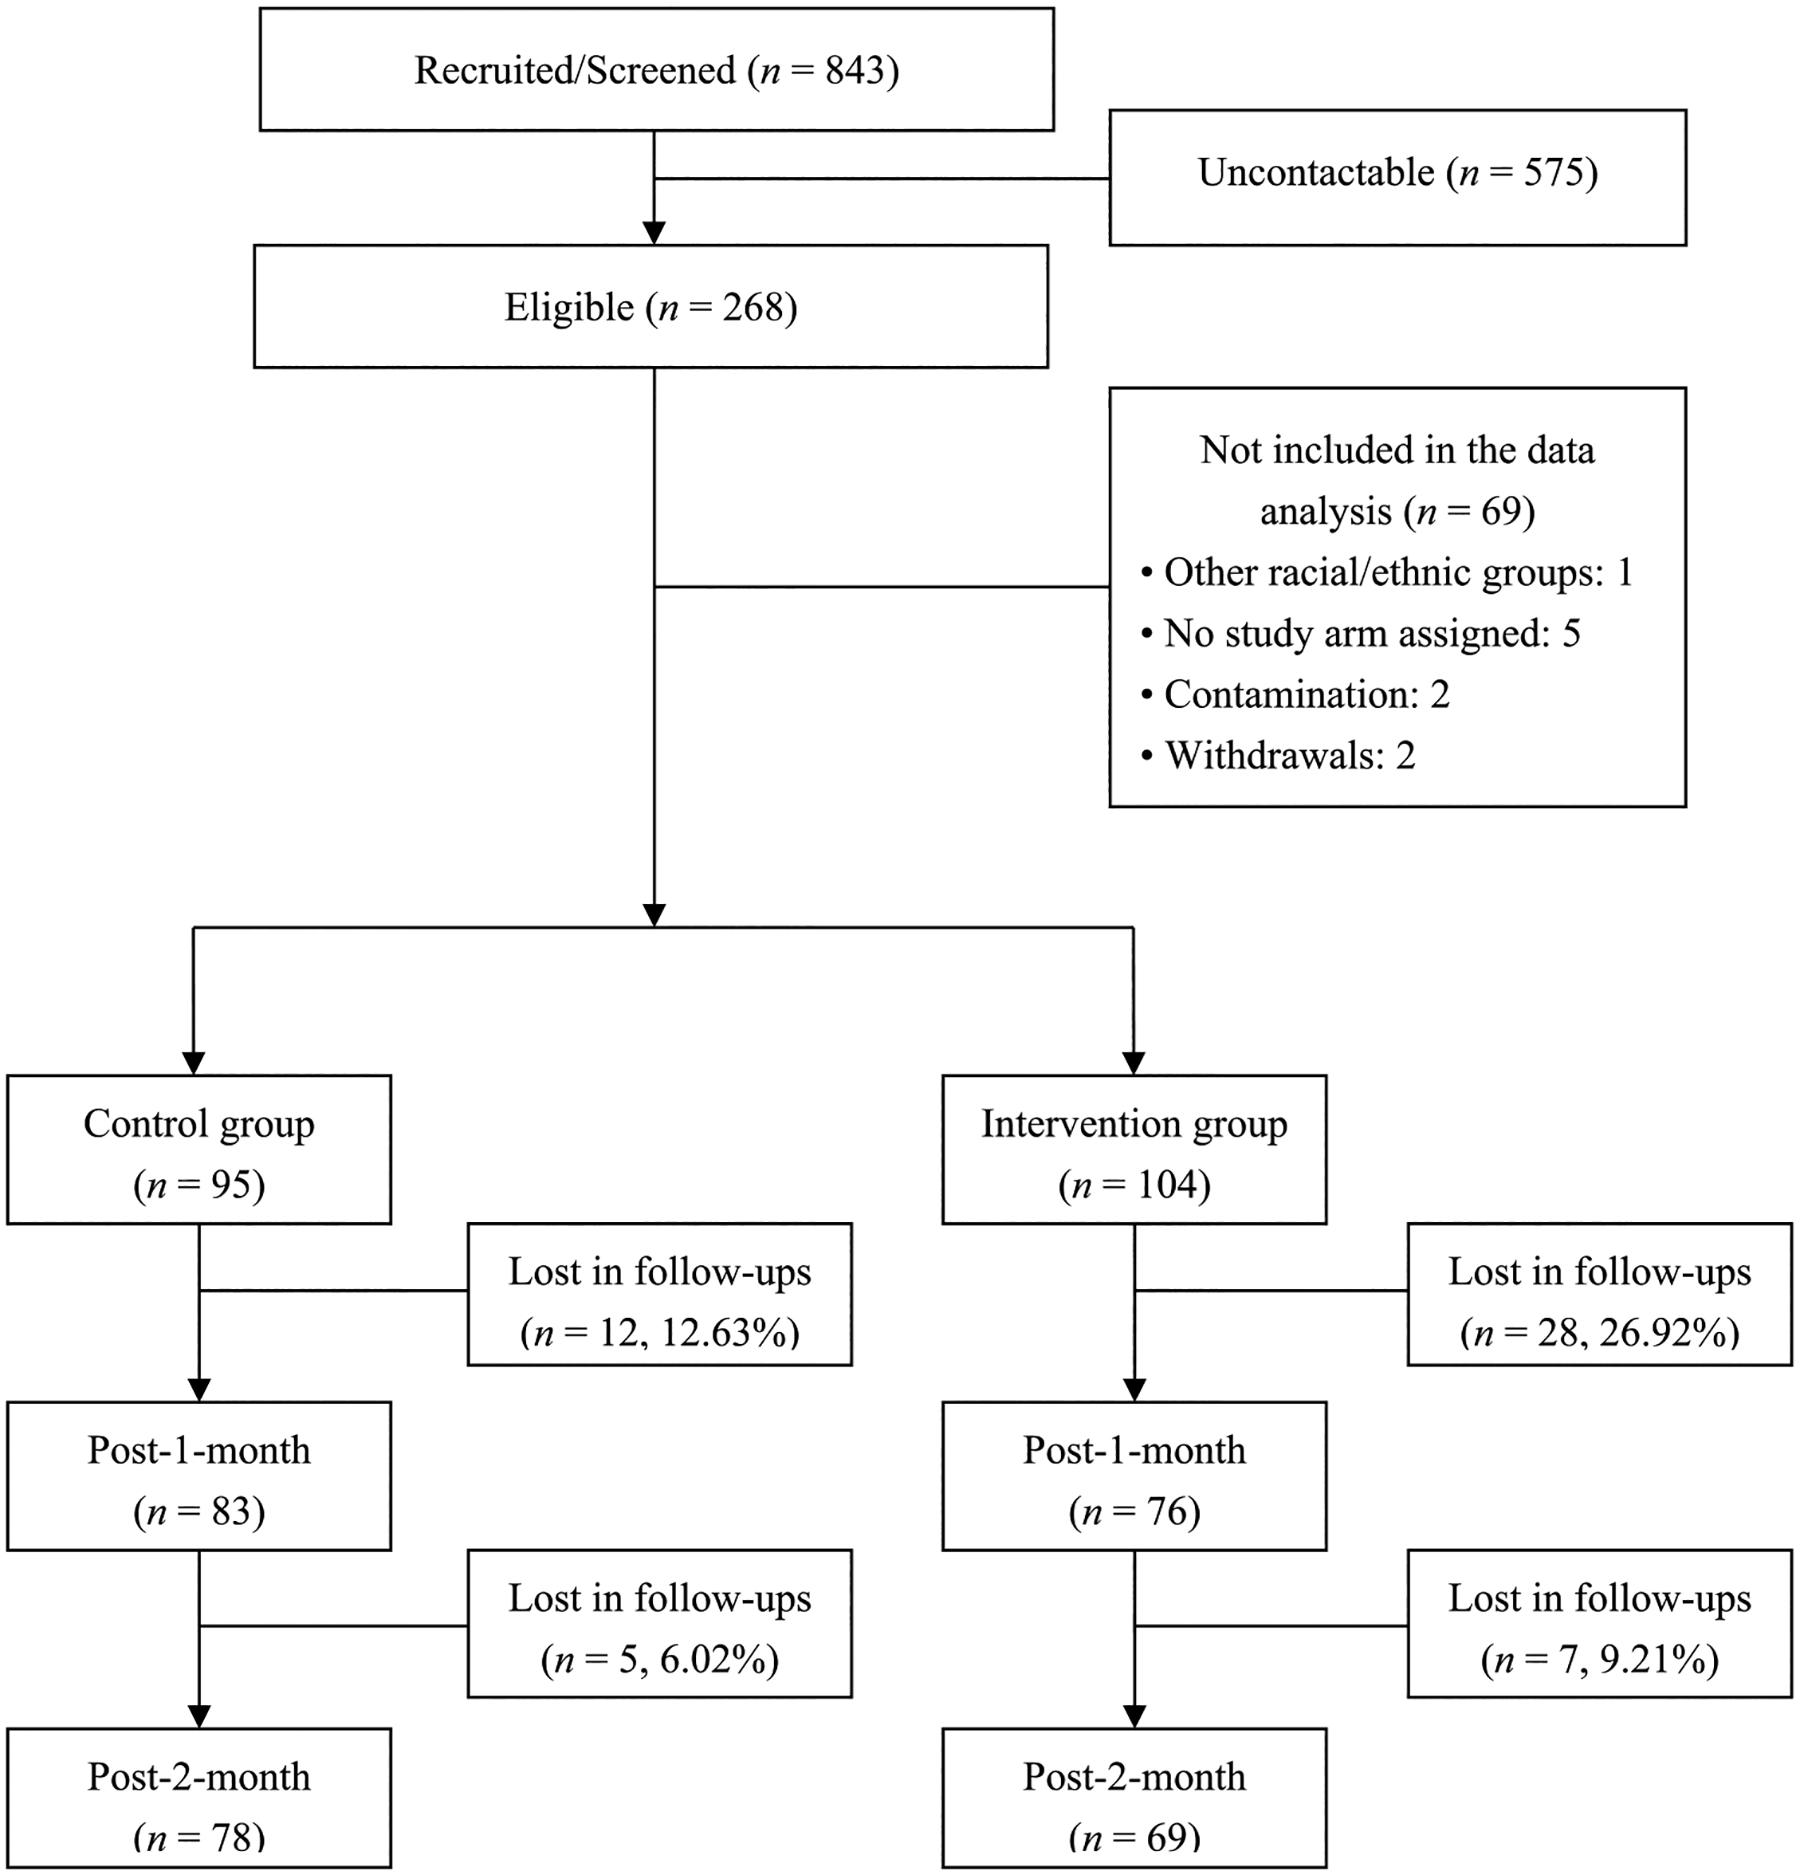
Participant flow diagram
Those included were Asian American women aged 21 years and older who were Chinese, Korean, or Japanese American, diagnosed with a breast cancer, literate in English, Mandarin Chinese, Korean or Japanese, and with Internet access. Those under the age of 21 years were excluded because of possible differences between their cancer experience and adults. Those who were literate in only four languages were included because English, Mandarin Chinese, Korean, and Japanese were primary languages of the target population [15].
Randomization was done using an automated random number generator accessible through the website. When a woman dropped by the project website, she was given the electronic information sheet and required to agree to participate by pushing the button indicating “I agree to participate.” When she gave her consent to participate, she was screened to see if she met the inclusion and exclusion criteria through server-side programs. Then, she was categorized based on her sub-ethnicity, automatically given a subject number, and randomized.
The Intervention
The intervention had three functions in four languages (English, Mandarin Chinese, Korean, and Japanese), which included sub-ethnic specific social media sites, online educational sessions, and online resources. More detailed information on the intervention is available elsewhere [16, 17]. To reflect differences in cultural attitudes among the three sub-ethnic groups, three sub-ethnic specific social media sites were included. Through the sites, the participants interacted with each other, shared their experiences with culturally matched peers and interventionists, and obtained coaching/support from the peers and the interventionists. At individual sites, cultural tailoring was incorporated by including both general and sub-ethnic-specific information and culturally appropriate examples from the literature. For instance, individual sites were based on Asian cultural values respecting family (e.g., family as the center of the women’s daily life) and collectivistic values. Individual sites included a social media function, a chat function with the interventionist, and a symptom log.
Online educational sessions included 15 topics related to breast cancer survivorship (general and sub-ethnic specific). Each sub-ethnic group had different content in the sessions based on cultural findings from the literature. These sessions aimed to correct misinformation on breast cancer and treatment/management strategies in order to reduce stigmatization. Culture-specific content (e.g., red ginseng, herbal medicine, Acupuncture, etc.) was included.
Online resources included 35 Web links to general and sub-ethnic-specific resources related to breast cancer survivorship in the four languages. The resources came from scientific authorities and from general and sub-ethnic-specific health organizations/institutes. General online resources were provided to all sub-ethnic groups, but sub-ethnic-specific online resources were provided only to the applicable group. The intervention was reviewed by six experts for the content.
The Behavior Change Consortium’s model of treatment fidelity [18] was used to monitor the reliability and validity of the intervention. For instance, the participants’ activities and adherence to the program were automatically recorded in the servers and daily monitored by the engineering investigator and by the RN interventionists with the consultation of two physicians. The program was programmed to identify any errors in participant adherence and notify the participants and the interventionist to correct the errors. Once error messages were received, the interventionists followed up with the participants to correct the errors. The research team also met biweekly to monitor the research progress; monitored the daily online records of the program, intervention implementations, online interactions, and data collection progress; monitored participant adherence; addressed any issues that arise; and consulted as necessary with consultants.
Instruments
Questions on Background Characteristics and Disease Characteristics
A total of 14 questions measured background participant characteristics (e.g., age, education, religion, marital status, employment, actual family income). Five additional questions were used to measure the level of acculturation (5-point Likert scale; 1 = exclusively own ethnic group, 5 = exclusively American). These acculturation questions were modified from the Asian Self-Identity Acculturation Scale [19] to measure the level of acculturation in multiple ethnic groups. Six questions on disease characteristics were used to measure general health, length of time since diagnosis, type and stage of cancer, medical treatments, and medication. All questions were used and validated in previous studies by the authors [20].
Questions on Attitudes, Self-Efficacy, Perceived Barriers, and Social Influences (QASPS)
The QASPS was adopted from the questions on attitudes, social influences, perceived behavioral control, and behavioral intention by Armitage [21]. This scale was inclusive of 6 questions about attitudes (bipolar [− 3 to + 3] scales), 16 questions about perceived barriers (4-point Likert scales), 13 questions about self-efficacy (unipolar [+ 1 to + 7] scales), and 3 questions about social influences (7-point Likert scales). Only the questions on attitudes, perceived barriers, and social influences were used in this study. Scores of attitudes, perceived barriers, and social influences scores were calculated by adding the scores of items in individual subscales. In this study, the Cronbach’s α of the attitude, perceived barriers, and social influence subscales were 0.95, 0.92, and 0.77, respectively.
Memorial Symptom Assessment Scale-Short Form (MSAS-SF)
The MSAS-SF was used to measure psychological and physical symptoms of the participants [22]. The MSAS-SF includes 32 items on symptoms experienced during the past 7 days. This scale is rated on a 5-point (0–4) Likert scale; (0 = no symptom to 4 = very much). The MSAS-SF includes the Global Distress Index (4 psychologic and 6 physical symptoms), the physical symptom distress sub-scale (12 items), and the psychologic symptom distress sub-scale (6 items). In this study, the MSAS-SF total distress score was calculated with the average of the ratings for distress of 32 symptoms. In this study, the scale’s Cronbach’s α was 0.92.
The Cancer Behavior Inventory (CBI)
The Cancer Behavior Inventory (CBI) [23] was adopted to assess the self-efficacy of participants for coping with cancer. CBI includes 14 items on the level of confidence that each respondent feels to achieve specific coping behaviors related to cancer (on a 9-point Likert scale; not at all confident = 1 to totally confident = 9). In this study, the CBI score was calculated by summing all the items. In this study, the scale’s Cronbach’s α was 0.92.
The Personal Resource Questionnaire (PRQ-2000) and the Perceived Isolation Scale (PIS)
The Personal Resource Questionnaire (PRQ-2000) [24] and the Perceived Isolation Scale (PIS) [25] were adopted to assess social influences and the level of perceived interactions (social isolation). The PRQ-2000 consists of 15 items (on a 7-point Likert scale) that assess the perceived level of social support. In this study, the PRQ-2000 score was decided by summing all the items. The PIS consists of six items on social support and three items on interactions/loneliness (rated on a 3-point Likert scale). In this study, the PIS score was calculated by averaging all the items. In this study, the scale’s Cronbach’s α was 0.94 and 0.80, respectively, for the PRQ-2000 and the PIS.
Data Collection Procedures
A project website was developed and used for the study; the website followed the Health Insurance Portability and Accountability Act (HIPAA), the SANS/FBI recommendations, and the Ubuntu Linux security updates. The website included the study announcement, electronic informed consent, the intervention, and survey questionnaires, which were provided in the four languages. When a woman visited the website, she was required to go through the electronic informed consent and give her consent to participate by clicking a button for “I agree to participate.” She then completed the screener using the inclusion and exclusion criteria and quota requirements, automatically assigned a subject number, and randomized into two groups using an automated random number generator. Finally, she was required to answer the questionnaire and was provided with IDs and passwords. Both groups were asked to use the Website by ACS; the link to the website was provided. Only the intervention group was required to use the intervention for 3 months. Reminders and thank-you emails were sent biweekly. Participants were asked to fill out the next set of instruments by the end of the first month and the third month.
Data Analysis
The data were analyzed using both descriptive and inferential statistics. First, distributions of variables were examined for outliers and normality after generating descriptive statistics of all variables. Then, transformations were done as needed, and the baseline differences between the two groups in background and disease-related factors were determined by t-tests and chi-square tests. For multi-item scales, the internal consistency reliability was determined; at least 0.7 was considered acceptable. Missing data were evaluated for the mechanism underlying missing data, and multiple imputation was done to generate 10 imputed sets [26].
Using separate intent-to-treat general linear models, differences in symptom scores of the intervention group at each time point were determined while adjusting for baseline outcome variables and other variables with imbalances in preliminary analyses (Aim 1). For each outcome, separate mixed effects regression models were generated. Both random slopes and intercepts were modeled to reflect the subject level deviation from the mean, or fixed effect, slope over time and intercept, respectively. For individual domain variables, a fixed effects model was used first, followed by mixed effects models with a scaled identity and first-order autoregressive covariance structure (AR1). The analysis used restricted maximum likelihood estimation, and it examined the most appropriate covariance structure. The symptom scores were analyzed as repeated observations, with mean-centered baseline scores serving as a covariate. Other predictors were considered: intervention group, time from baseline to follow-up, the interaction of group and time, and the interaction of baseline scores and time. The baseline symptom scores were included as time-independent covariates. Then, the analysis examined main effects and higher order interaction terms. Using the Akaike information criterion (AIC), overall model fit was evaluated, and the best-fitting longitudinal change pattern was chosen [27].
Mediational analyses were conducted in order to determine if there was statistical support that the putative mediators mediated the effects of the intervention on the symptoms (Aim 2). Then, the analysis determined the mediating effects of four theory-based mediators (the QASPS, PRQ-2000, PIS, and CBI scores) on the symptom scores at pretest, post 1 month, and post 3 months. The indirect effects of individual mediators reflected the associations between group variables as independent variables and the symptom scores that were mediated by the mediators. The direct effects reflected the associations between independent variables and the symptom scores while controlling for individual mediators. We used Model 4 of Hayes Process Macro in SPSS (version 4.2 beta) which is based on the bootstrapping technique with 10,000 samples in a 95% confidence interval.
Results
Background Characteristics
The sociodemographic and health/disease characteristics of study participants at the pretest are summarized in Table 1. There were no significant differences in most of the sociodemographic and health/disease characteristics between the intervention and control groups, except access to health care (χ2 = 5.165 p = 0.02), subethnicity (χ2 = 11.471, p = 0.01), age at immigration (t = 2.342, p = 0.02) and having chemotherapy (χ2 = 4.568, p = 0.03). There were no significant differences in the global distress index scores and psychological symptom distress scores between the two groups at the pretest. However, at the pretest, the intervention group showed significantly higher physical symptom distress scores, but lower total symptom distress scores than the control group at the pretest (Table 2).
Table 1.
Sociodemographic and health/disease characteristics of the participants by group at the pre-test (N = 199)
| Factors | Mean ± SD or N (%) | t (p) or χ2(p) | ||
|---|---|---|---|---|
| Control (N = 95) | Intervention (N = 104) | Total (N = 199) | ||
| Age, yeara | 53.14 ± 13.62 | 51.60 ± 11.38 | 52.35 ± 12.51 | 0.848 (0.40) |
| Education, % | ||||
| ≤ High school graduate | 33 (34.7) | 21 (20.2) | 54 (27.1) | 5.335 (0.07) |
| Partial college/college graduate | 47 (49.5) | 62 (59.6) | 109 (54.8) | |
| Graduate − | 15 (15.8) | 21 (20.2) | 36 (18.1) | |
| Religion, %a | ||||
| No religion | 42 (44.7) | 47 (45.2) | 89 (44.9) | 0.888 (0.64) |
| Christian | 36 (38.3) | 44 (42.3) | 80 (40.4) | |
| Others | 16 (17.0) | 13 (12.5) | 29 (14.6) | |
| Marital status, %a | ||||
| Married/partnered/permanent relationship | 70 (73.7) | 73 (70.9) | 143 (72.2) | 0.195 (0.66) |
| Single/divorced/widowed | 25 (26.3) | 30 (29.1) | 55 (27.8) | |
| Employment, %a | ||||
| No | 52 (60.5) | 55 (59.1) | 107 (59.8) | 0.033 (0.86) |
| Yes | 34 (39.5) | 38 (40.9) | 72 (40.2) | |
| Actual family income, per yeara | ||||
| < 20,000 | 23 (24.7) | 21 (20.8) | 44 (22.7) | 0.874 (0.65) |
| 20,000 ~ 99,999 | 44 (47.3) | 46 (45.5) | 90 (46.4) | |
| ≥ 100,000 | 26 (28.0) | 34 (33.7) | 60 (30.9) | |
| Degree of difficulty paying for basics, %a | ||||
| Insufficient | 7 (7.5) | 16 (15.7) | 23 (11.8) | 3.909 (0.27) |
| Somewhat insufficient | 28 (30.1) | 23 (22.5) | 51 (26.2) | |
| Sufficient | 42 (45.2) | 44 (43.1) | 86 (44.1) | |
| Very sufficient | 16 (17.2) | 19 (18.6) | 35 (17.9) | |
| Access to healthcare, % | ||||
| No | 4 (4.2) | 14 (13.5) | 18 (9.0) | 5.165 (0.02)b |
| Yes | 91 (95.8) | 90 (86.5) | 181 (91.0) | |
| Geographical Asian-population region, %a | ||||
| No | 23 (24.2) | 30 (29.1) | 53 (26.8) | 0.609 (0.44) |
| Yes | 72 (75.8) | 73 (70.9) | 145 (73.2) | |
| Urban/rural residence, %a | ||||
| Urban | 73 (76.8) | 75 (72.8) | 148 (74.4) | 0.424 (0.52) |
| Rural/others | 22 (23.2) | 28 (27.2) | 50 (25.3) | |
| Sub-ethnicity, %a | ||||
| Chinese | 52 (55.9) | 36 (35.3) | 88 (45.1) | 9.425 (0.01)c |
| Korean | 12 (12.9) | 26 (25.5) | 38 (19.5) | |
| Japanese | 29 (31.2) | 40 (39.2) | 69 (35.4) | |
| Country of birth, %a | ||||
| The U.S | 14 (15.1) | 10 (9.6) | 24 (12.2) | 1.357 (0.24) |
| Others | 79 (84.9) | 94 (90.4) | 173 (87.8) | |
| Length of stay in the U.S, yeara | 18.73 ± 12.61 | 19.01 ± 11.42 | 18.88 ± 11.95 | −0.156 (0.88) |
| Age at immigration, yearsa | 36.92 ± 12.32 | 32.33 ± 12.53 | 34.46 ± 12.6 | 2.342 (0.02)b |
| Level of acculturation (1–5)a | 3.55 ± 0.87 | 3.50 ± 0.74 | 3.52 ± 0.8 | 0.355 (0.72) |
| General health, %a | ||||
| Excellent | 3 (3.3) | 5 (4.9) | 8 (4.1) | 7.262 (0.20) |
| Very good | 28 (30.4) | 21 (20.4) | 49 (25.1) | |
| Good | 26 (29.3) | 30 (29.1) | 56 (28.7) | |
| Fair | 24 (26.1) | 32 (31.1) | 56 (28.7) | |
| Poor | 11 (12.0) | 10 (9.7) | 21 (10.8) | |
| Unknown | 0 (0.0) | 5 (4.9) | 5 (2.6) | |
| Length of time since diagnosis, yeara | 3.73 ± 4.05 | 3.58 ± 3.74 | 3.65 ± 3.88 | 0.271 (0.19) |
| Type of breast cancer, %a | ||||
| Invasive | 56 (66.7) | 71 (72.4) | 127 (69.8) | 0.717 (0.40) |
| Non-invasive | 28 (33.3) | 27 (27.6) | 55 (30.2) | |
| Stage of breast cancer, %a | ||||
| Stage I | 41 (45.1) | 42 (41.2) | 83 (43.0) | 0.916 (0.85) |
| Stage II/III | 40 (44.0) | 51 (50.0) | 91 (47.2) | |
| Stage IV | 4 (4.4) | 4 (3.9) | 8 (4.1) | |
| Unknown | 6 (6.6) | 5 (4.9) | 11 (5.7) | |
| Medical treatments, % | ||||
| Radiation | 44 (46.3) | 47 (45.2) | 91 (45.7) | 0.025 (0.87) |
| Chemotherapy | 35 (36.8) | 54 (51.9) | 89 (44.7) | 4.568 (0.03)b |
| Surgery | 66 (69.5) | 79 (76.0) | 145 (72.9) | 1.057 (0.30) |
| Hormone | 46 (48.4) | 50 (48.1) | 96 (48.2) | 0.002 (0.96) |
| Others | 4 (4.2) | 8 (7.7) | 12 (6.0) | 1.062 (0.30) |
| Medication, %a | ||||
| No | 28 (30.1) | 35 (33.7) | 63 (32.0) | 0.284 (0.59) |
| Yes | 65 (69.9) | 69 (66.3) | 134 (68.0) | |
Missing < 5%
p < 0.05
p < 0.01
Table 2.
Differences in the symptom scores by group at the pre-test (N = 199)
| Outcome variables | Total (N = 199) | Intervention (N = 104) | Control (N = 95) | t (p) or χ2 (p) | |||
|---|---|---|---|---|---|---|---|
| Mean | SD | Mean | SD | Mean | SD | ||
| Global distress index | 1.94 | 0.59 | 2.00 | 0.61 | 1.86 | 0.55 | −1.70 (0.090) |
| Physical symptom distress | 1.77 | 0.56 | 1.86 | 0.58 | 1.68 | 0.51 | −2.21 (0.027)a |
| Psychological symptom distress | 2.02 | 0.69 | 2.09 | 0.73 | 1.94 | 0.64 | −1.49 (0.136) |
| Total symptom distress level | 1.76 | 0.52 | 1.84 | 0.55 | 1.68 | 0.46 | −7.13 (< 0.001)a |
p < 0.05
Changes in Symptom Scores
The changes in the symptom scores by group and time are summarized in Table 3. Although the differences were not statistically significant, all types of subscale scores of the intervention group decreased over time from T0 to T2, while only psychological symptom distress scores of the control group decreased over time from T0 to T2. There were significant group effects on total symptom distress (p = 0.04) and global distress scores (p = 0.03). However, there were no statistically significant group*time effects of the MSAS scores (see Table 3).
Table 3.
Changes in the symptom scores by group and time (N = 199)
| Outcomes | Time | Control | Intervention | χ2(p) | ||||
|---|---|---|---|---|---|---|---|---|
| Mean | SE | Mean | SE | Group | Time | Group*time | ||
| Global distress index | Pre | 1.04 | 0.07 | 1.31 | 0.07 | 4.50* (0.03) | 2.43 (0.30) | 2.41 (0.30) |
| Post1 | 1.13 | 0.07 | 1.28 | 0.07 | ||||
| Post2 | 1.07 | 0.06 | 1.20 | 0.08 | ||||
| Physical symptom distress | Pre | 0.56 | 0.06 | 0.79 | 0.06 | 3.58 (0.06) | 1.70 (0.43) | 2.12 (0.35) |
| Post1 | 0.70 | 0.08 | 0.75 | 0.07 | ||||
| Post2 | 0.58 | 0.06 | 0.72 | 0.09 | ||||
| Psychological symptom distress | Pre | 1.40 | 0.08 | 1.63 | 0.09 | 2.99 (0.08) | 1.65 (0.44) | .87 (0.65) |
| Post1 | 1.39 | 0.07 | 1.53 | 0.08 | ||||
| Post2 | 1.38 | 0.07 | 1.49 | 0.09 | ||||
| Total symptom distress | Pre | 0.67 | 0.06 | 0.91 | 0.06 | 4.14* (0.04) | 1.10 (0.58) | 2.23 (0.32) |
| Post1 | 0.77 | 0.06 | 0.90 | 0.07 | ||||
| Post2 | 0.76 | 0.07 | 0.84 | 0.08 | ||||
Model: (intercept), group, time, age at immigration, access to healthcare, and group*Time SE standard error, T0 pre-test, T1 post 1-month, T2 post 3-month
p < 0.05,
p < 0.01;
p < 0.001
Mediation Effects (Direct and Indirect)
Table 4 includes the regression coefficients of the symptom scores after adjusting for the mediators. Depending on the domain of symptoms, the significant mediators with total, direct, or indirect effects were different at different time points. For instance, the QSPS attitudes, perceived barriers, and social influences scores, the PRQ-2000 social support scores, and the CBI self-efficacy scores showed significant total mediation effects on the total symptom distress scores only at T0 (p < 0.05). However, there were no significant mediation effects of the theory-based mediators on all the symptom scores that were observed over time from T1 to T2.
Table 4.
Regression standardized coefficients (β) of the symptom scores adjusted for the mediators (N = 199)
| Outcome variables | Mediator | Time points | Total effect: group → outcome | Direct effect: group → outcome | Indirect effect: group → mediator → outcome | |||
|---|---|---|---|---|---|---|---|---|
| β (p) | 95% C.I | β (p) | 95% C.I | β (p) | 95% C.I | |||
| Global distress scores | QASPS: attitude | T0 | 0.185 (0.048)* | 0.001, 0.368 | 0.219 (0.018)* | 0.037, 0.400 | −0.034 | −0.088, 0.003 |
| T1 | 0.001 (0.990) | −0.214, 0.217 | 0.010 (0.924) | −0.206, 0.227 | −0.009 | −0.048, 0.018 | ||
| T2 | −0.008 (0.942) | −0.215, 0.200 | 0.023 (0.825) | −0.184, 0.231 | −0.031 | −0.087, 0.006 | ||
| QASPS: barrier | T0 | 0.167 (0.071) | −0.015, 0.348 | 0.039 (0.626) | −0.119, 0.197 | 0.128 (sig.) | 0.030, 0.242 | |
| T1 | −0.005 (0.966) | −0.221, 0.211 | −0.102 (0.250) | −0.276, 0.072 | 0.097 | −0.036, 0.225 | ||
| T2 | 0.012 (0.910) | −0.198, 0.222 | 0.043 (0.646) | −0.140, 0.225 | −0.031 | −0.132, 0.078 | ||
| QASPS: social influence | T0 | 0.163 (0.079) | −0.019, 0.345 | 0.156 (0.096) | −0.028, 0.340 | 0.007 | −0.019, 0.045 | |
| T1 | −0.017 (0.874) | −0.233, 0.199 | −0.008 (0.942) | −0.226, 0.210 | −0.009 | −0.051, 0.016 | ||
| T2 | −0.010 (0.921) | −0.217, 0.197 | 0.010 (0.924) | −0.195, 0.214 | −0.020 | −0.069, 0.025 | ||
| PRQ-2000: social support | T0 | 0.176 (0.056) | −0.005, 0.356 | 0.118 (0.183) | −0.057, 0.294 | 0.057 (sig.) | 0.007, 0.119 | |
| T1 | −0.002 (0.986) | −0.217, 0.213 | −0.050 (0.638) | −0.258, 0.158 | 0.048 | −0.012, 0.129 | ||
| T2 | 0.015 (0.885) | −0.194, 0.225 | −0.034 (0.732) | −0.229, 0.162 | 0.049 | −0.029, 0.140 | ||
| PIS: perceived isolation | T0 | 0.176 (0.056) | −0.005, 0.356 | 0.110 (0.216) | −0.065, 0.284 | 0.066 (sig.) | 0.010, 0.139 | |
| T1 | −0.004 (0.969) | −0.220, 0.212 | −0.058 (0.576) | −0.261, 0.145 | 0.053 | −0.028, 0.144 | ||
| T2 | 0.012 (0.910) | −0.198, 0.222 | −0.019 (0.854) | −0.221, 0.183 | 0.031 | −0.030, 0.110 | ||
| CBI: self-efficacy | T0 | 0.176 (0.056) | −0.005, 0.356 | 0.156 (0.054) | −0.003, 0.315 | 0.019 | −0.065, 0.106 | |
| T1 | −0.002 (0.986) | −0.217, 0.213 | −0.058 (0.566) | −0.257, 0.141 | 0.056 | −0.028, 0.150 | ||
| T2 | 0.008 (0.941) | −0.201, 0.216 | 0.047 (0.614) | −0.136, 0.230 | −0.039 | −0.139, 0.064 | ||
| Physical symptom distress scores | QASPS: attitude | T0 | 0.177 (0.044)* | 0.005, 0.348 | 0.203 (0.021)* | 0.031, 0.375 | −0.0262 | −0.070, 0.019 |
| T1 | −0.073 (0.528) | −0.300, 0.154 | −0.069 (0.554) | −0.297, 0.160 | −0.004 | −0.035, 0.024 | ||
| T2 | 0.009 (0.929) | −0.197, 0.216 | 0.038 (0.716) | −0.168, 0.244 | −0.029 | −0.084, 0.007 | ||
| QASPS: barrier | T0 | 0.144 (0.092) | −0.024, 0.311 | 0.045 (0.566) | −0.109, 0.199 | 0.099 (sig.) | 0.025, 0.192 | |
| T1 | −0.093 (0.426) | −0.324, 0.138 | −0.187 (0.077) | −0.395, 0.021 | 0.094 | −0.014, 0.200 | ||
| T2 | 0.025 (0.809) | −0.182, 0.232 | 0.048 (0.611) | −0.137, 0.232 | −0.022 | −0.123, 0.077 | ||
| QASPS: social influence | T0 | 0.141 (0.099) | −0.027, 0.309 | 0.134 (0.120) | −0.035, 0.303 | 0.007 | −0.013, 0.045 | |
| T1 | −0.105 (0.371) | −0.337, 0.126 | −0.097 (0.411) | −0.331, 0.136 | −0.008 | −0.045, 0.019 | ||
| T2 | −0.003 (0.980) | −0.204, 0.199 | 0.014 (0.887) | −0.184, 0.213 | −0.017 | −0.064, 0.031 | ||
| PRQ-2000: social support | T0 | 0.175 (0.044)* | 0.005, 0.346 | 0.129 (0.128) | −0.038, 0.296 | 0.046 (sig.) | 0.003, 0.103 | |
| T1 | −0.092 (0.431) | −0.321, 0.138 | −0.126 (0.275) | −0.354, 0.102 | 0.035 | −0.008 0.106 | ||
| T2 | 0.023 (0.828) | −0.184, 0.230 | −0.030 (0.764) | −0.225, 0.165 | 0.052 | −0.022, 0.139 | ||
| PIS: perceived isolation | T0 | 0.175 (0.044)* | 0.005, 0.346 | 0.125 (0.144) | −0.043, 0.293 | 0.051 (sig.) | 0.007, 0.114 | |
| T1 | −0.095 (0.418) | −0.326, 0.136 | −0.142 (0.213) | −0.367, 0.082 | 0.047 | −0.013, 0.127 | ||
| T2 | 0.024 (0.819) | −0.183, 0.231 | −0.002 (0.984) | −0.205, 0.201 | 0.026 | −0.021, 0.093 | ||
| CBI: self-efficacy | T0 | 0.175 (0.044)* | 0.005, 0.346 | 0.162 (0.048)* | 0.001, 0.323 | 0.013 | −0.043, 0.076 | |
| T1 | −0.092 (0.431) | −0.321, 0.138 | −0.149 (0.184) | −0.369, 0.138 | 0.057 | −0.014, 0.149 | ||
| T2 | 0.018 (0.863) | −0.188, 0.224 | 0.035 (0.720) | −0.156, 0.226 | −0.017 | −0.098, 0.066 | ||
| Psychological symptom distress scores | QASPS: attitude | T0 | 0.168 (0.127) | −0.048, 0.385 | 0.211 (0.053) | −0.003, 0.425 | −0.043 | −0.109, 0.004 |
| T1 | 0.097 (0.405) | −0.132, 0.325 | 0.110 (0.344) | −0.119, 0.339 | −0.013 | −0.062, 0.018 | ||
| T2 | 0.029 (0.811) | −0.207, 0.264 | 0.062 (0.605) | −0.174, 0.298 | −0.033 | −0.101, 0.010 | ||
| QASPS: barrier | T0 | 0.174 (0.115) | −0.043, 0.391 | 0.032 (0.743) | −0.162, 0.226 | 0.142 (sig.) | 0.034, 0.274 | |
| T1 | 0.103 (0.377) | −0.126, 0.332 | −0.005 (0.958) | −0.188, 0.178 | 0.108 | −0.034, 0.251 | ||
| T2 | 0.043 (0.722) | −0.196, 0.282 | 0.075 (0.466) | −0.127, 0.276 | −0.032 | −0.160, 0.102 | ||
| QASPS: social influence | T0 | 0.173 (0.119) | −0.045, 0.391 | 0.161 (0.150) | −0.059, 0.380 | 0.013 | −0.015, 0.057 | |
| T1 | 0.094 (0.423) | −0.137, 0.324 | 0.111 (0.346) | −0.120, 0.342 | −0.017 | −0.069, 0.009 | ||
| T2 | 0.154 (0.897) | −0.220, 0.251 | 0.029 (0.808) | −0.207, 0.265 | −0.014 | −0.056, 0.025 | ||
| PRQ-2000: social support | T0 | 0.213 (0.057) | −0.006, 0.433 | 0.145 (0.182) | −0.069, 0.359 | 0.068 (sig.) | 0.006, 0.144 | |
| T1 | 0.102 (0.377) | −0.126, 0.330 | 0.055 (0.625) | −0.168, 0.278 | 0.047 | −0.010, 0.127 | ||
| T2 | 0.056 (0.647) | −0.183, 0.294 | 0.005 (0.968) | −0.221, 0.230 | 0.051 | −0.031, 0.151 | ||
| PIS: Perceived isolation | T0 | 0.213 (0.057) | −0.006, 0.433 | 0.120 (0.259) | −0.089, 0.328 | 0.094 (sig.) | 0.014, 0.191 | |
| T1 | 0.107 (0.356) | −0.122, 0.337 | 0.049 (0.653) | −0.167, 0.266 | 0.058 | −0.025, 0.149 | ||
| T2 | 0.041 (0.738) | −0.198, 0.279 | −0.003 (0.982) | −0.226, 0.221 | 0.043 | −0.041, 0.148 | ||
| CBI: self-efficacy | T0 | 0.213 (0.057) | −0.006, 0.433 | 0.192 (0.058) | −0.007, 0.391 | 0.021 | −0.074 0.118 | |
| T1 | 0.102 (0.377) | −0.126, 0.330 | 0.052 (0.641) | −0.166, 0.269 | 0.051 | −0.022, 0.138 | ||
| T2 | 0.048 (0.691) | −0.189, 0.285 | 0.090 (0.390) | −0.116, 0.295 | −0.042 | −0.160, 0.084 | ||
| Total symptom distress scores (MSAS scores) | QASPS: attitude | T0 | 0.191 (0.021) * | 0.028, 0.353 | 0.217 (<.001) ** | 0.055, 0.379 | −0.026 | −0.069, 0.002 |
| T1 | 0.020 (0.841) | −0.175, 0.215 | 0.024 (0.0807) | −0.172, 0.221 | −0.004 | −0.037, 0.021 | ||
| T2 | −0.017 (0.865) | −0.212, 0.179 | 0.015 (0.876) | −0.180, 0.211 | −0.032 | −0.083, −0.003 | ||
| QASPS: barrier | T0 | 0.173 (0.035) * | 0.013, 0.333 | 0.078 (0.298) | −0.069, 0.225 | 0.095 (sig.) | 0.022, 0.185 | |
| T1 | 0.002 (0.984) | −0.195, 0.199 | −0.067 (0.446) | −0.239, 0.106 | 0.069 | −0.029, 0.162 | ||
| T2 | −0.0003 (0.974) | −0.200, 0.194 | 0.015 (0.869) | −0.166, 0.197 | −0.018 | −0.104, 0.061 | ||
| QASPS: social influence | T0 | 0.174 (0.034) * | 0.013, 0.335 | 0.163 (0.048) * | 0.002, 0.325 | 0.011 | −0.011, 0.050 | |
| T1 | −0.001 (0.990) | −0.200, 0.197 | 0.009 (0.927) | −0.191, 0.209 | −0.011 | −0.050, 0.012 | ||
| T2 | −0.024 (0.805) | −0.219, 0.170 | −0.002 (0.980) | −0.193, 0.188 | −0.022 | −0.071, 0.025 | ||
| PRQ-2000: social support | T0 | 0.201 (0.014) * | 0.041, 0.361 | 0.153 (0.055) | −0.003, 0.310 | 0.047 (sig.) | 0.004, 0.100 | |
| T1 | 0.006 (0.951) | −0.190, 0.202 | −0.027 (0.784) | −0.221, 0.167 | 0.033 | −0.007, 0.097 | ||
| T2 | 0.002 (0.982) | −0.194, 0.199 | −0.046 (0.621) | −0.231, 0.138 | 0.049 | 0.021, 0.129 | ||
| PIS: perceived isolation | T0 | 0.201 (0.014) * | 0.041, 0.361 | 0.148 (0.063) | −0.008, 0.305 | 0.052 (sig.) | 0.007, 0.113 | |
| T1 | 0.007 (0.941) | −0.190, 0.205 | −0.033 (0.733) | −0.224, 0.158 | 0.041 | −0.016, 0.111 | ||
| T2 | −0.003 (0.978) | −0.200, 0.194 | −0.027 (0.786) | −0.220, 0.167 | 0.024 | −0.019, 0.085 | ||
| CBI: self-efficacy | T0 | 0.201 (0.014) * | 0.041, 0.361 | 0.188 (0.014) * | 0.038, 0.338 | 0.013 | −0.045, 0.076 | |
| T1 | 0.006 (0.951) | −0.190, 0.202 | −0.029 (0.765) | −0.218, 0.161 | 0.035 | −0.019, 0.103 | ||
| T2 | −0.006 (0.950) | −0.202, 0.189 | 0.030 (0.739) | −0.147, 0.207 | −0.036 | −0.122, 0.050 | ||
MSAS memorial symptom assessment scale, QASPS questions on attitudes, perceived barriers, and social influences, PRQ-2000 personal resource questionnaire, PIS perceived isolation scale, CBI cancer behaviors inventory, β non-standardized coefficients, 95% C.I. 95% boot confidence interval, T0 baseline, T1 post-1-month test, T2 post-3-month test, (sig.) significant
p < 0.05; 10,000 bootstrap samples
Discussions
The findings of this study supported the impact of a technology-based educational intervention on multiple domains of symptoms experienced among Asian American breast cancer survivors: the intervention group had decreases in all dimensions of symptoms from the pretest to post 3 months, while the control group had increases in all dimensions of symptoms except psychological symptoms. The findings supported the mediation effects of the theory-based mediators, including perceived barriers, social support, and social influences, on the symptom scores only at the pre-test.
The finding on decreases in all dimensions of symptoms among the intervention group (although the decreases were not statistically significant) is consistent with the literature [28]. Indeed, technology-based interventions have been reported to be effective in improving health outcomes (e.g., symptoms) [28]. One beneficial aspect of technology-based interventions has been postulated as the convenience of the interventions, such as easy access without time or geographical limitations, and as its wide reach out to marginalized populations, including racial/ethnic minorities [29].
The non-statistical significance of the decreases, yet, could mean that symptoms could not be effectively managed through a 3-month technology-based educational intervention. In other words, symptom management of Asian American breast cancer survivors may need a different approach than a short-term technology-based intervention. Also, the instrument (the MSAS-SF) might not have enough sensitivity for symptom measurements among this specific population; the items of the MSAS-SF mostly assess acute symptoms (e.g., nausea/vomiting) that are experienced during the active cancer treatment process. In addition, the average scores of all dimensions of symptoms among both groups at the pre-test tended to be low, which might result in a floor effect and subsequently cause a difficulty in finding the intervention effects.
The findings of this study also indicated that even the control group had decreases in psychological symptom scores. This finding may be due to the natural trajectory of symptoms over time, even without any intervention; symptoms could get better as time passes. Also, this finding may support the effectiveness of the simple ACS website in improving the psychological symptom experience of Asian American breast cancer survivors, which may need further consideration in future use of technology-based interventions. Although the decreases in the symptom scores in the intervention group were larger than those in the control group, it was obvious that the ACS website could also decrease the psychological symptom scores of Asian American breast cancer survivors. Considering the current necessity of any support for Asian American breast cancer survivors and the reported low quality of life among this specific population due to fewer sources of information and coaching/support [30], the use of the ACS website that could be easily adopted may provide an easy option to support this specific population in their psychological symptom management.
The literature is clear that attitudes, self-efficacy, perceived barriers, and social influences are significant factors that could change health behaviors and subsequent health outcomes [31]. The survivorship experience of breast cancer patients is greatly influenced by their attitudes toward breast cancer [32], self-efficacy to cope with breast cancer [33], and perceived barriers [34]. Also, the survivorship experience is known to be affected by social influences, including perceived social isolation [35]. Yet, the findings reported in this paper showed that the mediation effects existed only at the pre-test, which would need a careful interpretation. Maybe, changing the theory-based mediators would need a longer period of the intervention. Alternatively, changing symptoms through a technology-based approach might need a different approach through different mediators from those included in this intervention.
This study had several limitations. First, there existed a few sources for selection bias. The high number of participants who were not reachable after going through the screening process might be a source of selection bias. Also, the participants needed to have access to the Internet. The data collection period included the COVID pandemic period. In addition, the data were collected based on self-reports. Only three sub-ethnic groups of Asian American breast cancer survivors were included. Second, all types of symptoms were measured through the MSAS-SF using a Likert scale, which limited the list of symptoms that were assessed in this study. Finally, the control condition was an active control condition (in addition to routine care), which could limit the capability to detect an important impact of the intervention.
Conclusions
The findings supported the efficacy of a technology-based educational intervention in improving multiple domains of symptoms among Asian American breast cancer survivors, although the impact was not statistically significant. The findings also supported the mediation effects of the theory-based mediators at the pre-test. Based on the findings, several suggestions are made for future research. First, further studies are needed to confirm the efficacy of a technology-based educational intervention on multiple domains of symptoms among Asian American breast cancer survivors, with a comprehensive list and objective measurements of symptoms that could be experienced by the women during their survivorship process. At the same time, health educators need to consider that culturally tailored technology-based interventions could help improve the symptom experience of Asian American breast cancer survivors. Second, further investigations are warranted in determining the right intervention period of a technology-based educational intervention to improve multiple domains of symptom experience among breast cancer survivors. Third, to avoid selection bias, further studies are needed with a careful examination of the intention of participation and the actual participation of Asian American breast cancer survivors in clinical trials. Finally, further research is needed regarding the underlying mechanisms through which potential mediators could influence the impact of a technology-based educational intervention on multiple dimensions of symptom experience among this specific population. More studies are also needed on other possible mediators of technology-based educational interventions that influence Asian American breast cancer survivors’ symptom experience.
Funding
The study was funded by the National Cancer Institute (NIH/NCI; R01 CA203719). Drs. Mao and Bao are supported in part by a grant from the National Institutes of Health/National Cancer Institute Cancer Center (P30 CA008748). We appreciate the efforts made by dozens of research assistants and community consultants during the research process. More importantly, we appreciate the contributions made by our research participants.
Footnotes
Conflict of interest The authors declare no competing interests.
References
- 1.American Cancer Society. 2025. Breast cancer facts & figures. https://www.cancer.org/research/cancer-facts-statistics/breast-cancer-facts-figures.html. Accessed 23 April 2025
- 2.Whisenant MS, Williams LA, Mendoza T, Cleeland C, Chen TH, Fisch MJ, and Shi Q. 2021. Identification of breast cancer survivors with high symptom burden. Cancer Nurs 45(4):253–261. 10.1097/NCC.0000000000001019 [DOI] [PMC free article] [PubMed] [Google Scholar]
- 3.Castel LD, Saville BR, Depuy V et al. (2008) Racial differences in pain during 1 year among women with metastatic breast cancer: a hazards analysis of interval-censored data. Cancer 112:162–170. 10.1002/cncr.23133 [DOI] [PubMed] [Google Scholar]
- 4.Institute of Medicine. 2008. Challenges and successes in reducing health disparities: workshop summary. http://www.nap.edu/catalog.php?record_id=12154. Accessed 15 December 2013 [PubMed]
- 5.Lu Q, Chen L, Shin LJ, Wang C, Dawkins-Moultin L, Chu Q, Loh A, Young L, and Wang C. 2021. Improvement in quality of life and psychological well-being associated with a culturally based psychosocial intervention for Chinese American breast cancer survivors. Support Care Cancer 29(8):4565–4573. 10.1007/s00520-020-05942-8 [DOI] [PMC free article] [PubMed] [Google Scholar]
- 6.Yi JK, Swartz MD, Reyes-Gibby CC (2011) English proficiency, symptoms, and quality of life in Vietnamese-and Chinese-American breast cancer survivors. J Pain Symptom Manage 42(1):83–92. 10.1016/j.jpainsymman.2010.09.014 [DOI] [PubMed] [Google Scholar]
- 7.Jones JM, Saeed H, Katz MS et al. (2021) Readdressing the needs of cancer survivors during COVID-19: a path forward. JNCI J Natl Cancer Inst 113:955–961. 10.1093/jnci/djaa200 [DOI] [PMC free article] [PubMed] [Google Scholar]
- 8.Im EO, Yi JS, and Chee W. 2023. The characteristics of Asian American breast cancer survivors with low quality of life: a decision tree analysis. J Cancer Educ 38(4):1277–1285. 10.1007/s13187-022-02260-x [DOI] [PMC free article] [PubMed] [Google Scholar]
- 9.Koehle H, Kronk C, Lee YJ (2022) Digital health equity: addressing power, usability, and trust to strengthen health systems. Yearb Med Inform 31(1):20–32. 10.1055/s-0042-1742512 [DOI] [PMC free article] [PubMed] [Google Scholar]
- 10.Misra S, Le PD, Goldmann E, Yang LH (2020) Psychological impact of anti-Asian stigma due to the COVID-19 pandemic: a call for research, practice and policy responses. Psychol Trauma 12(5):461–464. 10.1037/tra0000821 [DOI] [PMC free article] [PubMed] [Google Scholar]
- 11.Im EO, Chang SJ, Chee W, Chee E (2012) Attitudes of women in midlife to web-based interventions for promoting physical activity. J Telemed Telecare 18(7):419–422. 10.1258/jtt.2012.120514 [DOI] [PubMed] [Google Scholar]
- 12.Bandura A (1977) Self-efficacy: toward a unifying theory of behavioral change. Psychol Rev 84(2):191–215. 10.1037/0033-295x.84.2.191 [DOI] [PubMed] [Google Scholar]
- 13.Bandura A (1986) Social foundations of thought and action: a social cognitive theory. Prentice-Hall, Englewood Cliffs, N.J. [Google Scholar]
- 14.Bandura A (1963) Social learning and personality development. Holt, Rinehart, and Winston, New York [Google Scholar]
- 15.Spector RE (2017) Cultural diversity in health and illness, 9th edn. Pearson, New York, NY: [DOI] [PubMed] [Google Scholar]
- 16.Im EO, Chee W, Paul S, Choi MY, Kim SY, Deatrick JA, Inouye J, Ma G, Meghani S, Nguyen GT, Schapira MM, Ulrich CM, Yeo S, Bao T, Shin D, Mao JJ (2023) A randomized controlled trial testing a virtual program for Asian American women breast cancer survivors. Nat Commun 14(1):6475. 10.1038/s41467-023-42132-6 [DOI] [PMC free article] [PubMed] [Google Scholar]
- 17.Im EO, Chee W, Paul S, Choi MY, Kim SY, Yeo S, Ulrich CM, Schapira MM, Nguyen GT, Meghani S, Mao JJ, Ma G, Inouye J, Deatrick JA, Shin D, and Bao T. 2024. Five dimensions of needs for help: the efficacy of a technology-based intervention among Asian American breast cancer survivors. J Cancer Educ 39(3):335–348. 10.1007/s13187-024-02415-y [DOI] [PMC free article] [PubMed] [Google Scholar]
- 18.Resnick B, Inguito P, Orwig D, Yahiro JY, Hawkes W, Werner M, Zimmerman S, Magaziner J (2005) Treatment fidelity in behavior change research: a case example. Nurs Res 54(2):139–143. 10.1097/00006199-200503000-00010 [DOI] [PubMed] [Google Scholar]
- 19.Suinn RM, Ahuna C, Khoo G (1992) The Suinn-Lew Asian self-identity acculturation scale: concurrent and factorial validation. Educ Psychol Meas 52:1041–1046 [Google Scholar]
- 20.Im EO, Chee W, Guevara E et al. (2007) Gender and ethnic differences in cancer pain experience: a multiethnic survey in the United States. Nurs Res 56:296–306. 10.1097/01.NNR.0000289502.45284.b5 [DOI] [PMC free article] [PubMed] [Google Scholar]
- 21.Armitage CJ (2005) Can the theory of planned behavior predict the maintenance of physical activity? Health Psychol 24:235–245. 10.1037/0278-6133.24.3.235 [DOI] [PubMed] [Google Scholar]
- 22.Portenoy RK, Thaler HT, Kornblith AB et al. (1994) The memorial symptom assessment scale: an instrument for the evaluation of symptom prevalence, characteristics and distress. Eur J Cancer 30A:1326–1336. 10.1016/0959-8049(94)90182-1 [DOI] [PubMed] [Google Scholar]
- 23.Merluzzi TV, Philip EJ, HeitzmannRuhf CA et al. (2018) Self-efficacy for coping with cancer: revision of the Cancer Behavior Inventory (Version 3.0). Psychol Assess 30:486–499. 10.1037/pas0000483 [DOI] [PMC free article] [PubMed] [Google Scholar]
- 24.Weinert C (2003) Measuring social support: PRQ2000. Meas Nurs Outcomes 3:161–172 [Google Scholar]
- 25.Cornwell EY, Waite LJ (2009) Measuring social isolation among older adults using multiple indicators from the NSHAP study. J Gerontol B Psychol Sci Soc Sci 64(Suppl 1):i38–46. 10.1093/geronb/gbp037 [DOI] [PMC free article] [PubMed] [Google Scholar]
- 26.Wang C, Butts CT, Hipp JR et al. (2016) Multiple imputation for missing edge data: a predictive evaluation method with application to add health. Soc Netw 45:89–98. 10.1016/j.socnet.2015.12.003 [DOI] [PMC free article] [PubMed] [Google Scholar]
- 27.Cavanaugh JE, Neath AA (2019) The Akaike information criterion: background, derivation, properties, application, interpretation and refinements. Wiley Interdiscip Rev Comput Stat 11:e1460 [Google Scholar]
- 28.Lee K, Kim S, Kim SH, Yoo SH, Sung JH, Oh EG, Kim N, Lee J (2023) Digital health interventions for adult patients with cancer evaluated in randomized controlled trials: scoping review. J Med Internet Res 25:e38333. 10.2196/38333 [DOI] [PMC free article] [PubMed] [Google Scholar]
- 29.Brewer LC, Fortuna KL, Jones C, Walker R, Hayes SN, Patten CA, Cooper LA (2020) Back to the Future: Achieving Health Equity Through Health Informatics and Digital Health. JMIR Mhealth Uhealth 8(1):e14512. 10.2196/14512 [DOI] [PMC free article] [PubMed] [Google Scholar]
- 30.Wang K, Ma C, Li FM, Truong A, Shariff-Marco S, Chu JN, Oh DL, Allen L, Kuo MC, Wong C, Bui H, Chen J, Gomez SL, Nguyen TT, Tsoh JY (2022) Patient-reported supportive care needs among Asian American cancer patients. Support Care Cancer 30(11):9163–9170. 10.1007/s00520-022-07338-2 [DOI] [PMC free article] [PubMed] [Google Scholar]
- 31.Tshuma N, Muloongo K, Nkwei ES, Alaba OA, Meera MS, Mokgobi MG, Nyasulu PS (2017) The mediating role of self-efficacy in the relationship between premotivational cognitions and engagement in multiple health behaviors: a theory-based cross-sectional study among township residents in South Africa. J Multidiscip Healthc 10:29–39. 10.2147/JMDH.S112841 [DOI] [PMC free article] [PubMed] [Google Scholar]
- 32.Melhem SJ, Nabhani-Gebara S, Kayyali R (2023) Latency of breast cancer stigma during survivorship and its influencing factors: A qualitative study. Front Oncol 13:1075298. 10.3389/fonc.2023.1075298 [DOI] [PMC free article] [PubMed] [Google Scholar]
- 33.Choi YY, Rha SY, Park JS, Song SK, Lee J (2023) Cancer coping self-efficacy, symptoms and their relationship with quality of life among cancer survivors. Eur J Oncol Nurs 66:102373. 10.1016/j.ejon.2023.102373 [DOI] [PubMed] [Google Scholar]
- 34.Wurz A, St-Aubin A, Brunet J (2015) Breast cancer survivors’ barriers and motives for participating in a group-based physical activity program offered in the community. Support Care Cancer 23(8):2407–16. 10.1007/s00520-014-2596-2 [DOI] [PMC free article] [PubMed] [Google Scholar]
- 35.Wang C, Qiu X, Yang X, Mao J, Li Q (2024) Factors influencing social isolation among cancer patients: a systematic review. Healthcare (Basel) 12(10):1042. 10.3390/healthcare12101042 [DOI] [PMC free article] [PubMed] [Google Scholar]