

Abstract
Skeletal muscle dysfunction causes functional decline and disability in patients with chronic kidney disease (CKD). Identification of muscle pathology prior to significant loss of physical function would be a major advance. Multiparametric, quantitative magnetic resonance imaging (qMRI) of 7 leg muscle groups (3 thigh, 4 calf) was conducted in patients with CKD stages 4-5 (n=6), end-stage kidney disease (ESKD, n=3), and healthy controls (n=10) using a 3 Tesla MRI scanner. Measurements included T1 relaxation time in the rotating frame (T1ρ) and transverse relaxation time (T2) mapping, Dixon imaging of intramuscular fat content, diffusion tensor imaging (DTI) for muscle structure, and 1H-MR spectroscopy for intra- and extra-myocellular lipid (IMCL and EMCL, respectively) and physiologically relevant muscle metabolites. T1ρ and T2 times were prolonged and fat fraction (FF) was higher in CKD patients compared with controls (differences of 4.99 ms (95% CI 1.71-8.27), 6.72 ms (95% CI 3.78-9.66), and 6.67% (95% CI 0.65-12.68), respectively). T1ρ and FF were similarly elevated across muscle groups, whereas T2 differences may have been greater in calf muscles. T1ρ and T2 were lower in ESKD patients compared with CKD and similar to controls, consistent with prior histologic assessment of muscle fibrosis. No significant differences by CKD status were observed for DTI parameters. Compared with controls, IMCL was higher in CKD patients and trimethylamine and creatine concentrations were lower. In sum, multiparametric qMRI of skeletal muscle in CKD patients non-invasively identified differences in metrics associated with fibrosis, fat infiltration, and metabolic dysregulation.
Graphical Abstract

New & Noteworthy
In this study, we demonstrate that multiparametric, quantitative magnetic resonance imaging (qMRI) can quantify multiple distinct anatomic and pathologic features of skeletal muscle pathology in patients with CKD prior to significant functional decline. qMRI metrics of fibrosis and fat infiltration were elevated, and muscle metabolite concentrations were reduced, in patients with CKD compared with controls. This non-invasive approach offers a valuable alternative to traditional muscle biopsies for evaluating muscle health in CKD patients.
INTRODUCTION
Disability is an important contributor to poor quality of life, excess hospitalizations, and early death among adults with CKD (1). Prevention of disability in the CKD population is a major unmet need. Disability in patients with CKD is often preceded by skeletal muscle dysfunction, which causes weakness, fatigue, and functional impairment (1). Therefore, a critical gap in our knowledge is the ability to identify muscle pathology before significant functional decline occurs. Early detection of these abnormalities may allow for early interventions to prevent or slow muscle deterioration, ultimately reducing disability and improving quality of life for CKD patients.
Magnetic resonance imaging (MRI) shows promise as a non-invasive biomarker of muscle pathology in CKD (2). Recent technological advances enable quantitative mapping of skeletal muscle structure, composition, and metabolic health (3). Quantitative MRI (qMRI) protocols have been employed in genetic muscle diseases, which are characterized by changes in muscle structure including fiber atrophy, fibrosis, and fatty replacement (3). Similar changes are observed in patients with CKD: pathologic descriptions include disorganized sarcomeres, myofibril degeneration, glycogen and lipid accumulation, and fibrosis with expanded, densely packed collagen altering the extracellular matrix (4-8). A key strength of the qMRI approach is the ability to assess distinct anatomic and pathologic features of muscle pathology within a single imaging session. This non-invasive approach offers a valuable alternative to traditional muscle biopsies for evaluating muscle health in CKD patients.
Prior work suggests that qMRI mapping is sensitive to early pathology in skeletal muscle disorders. Several methods within qMRI could be informative in CKD. A novel method for non-invasive detection of fibrosis is the T1 relaxation time in the rotating frame (T1ρ). T1ρ has been shown to correlate with collagen, glycosaminoglycan, and hyaluronan content in fibrotic muscle disorders (9, 10). Another hallmark of fibrotic transformation of skeletal muscle is fatty replacement. In genetic muscle diseases, quantification of intramuscular fat using chemical shift-based imaging correlates with histological assessment and changes over time with disease progression (11-14). Intramuscular fat accumulation may be preceded by muscle water changes that are detectable by transverse relaxation time (T2) mapping (15). Furthermore, muscle lipid content quantified by 1H magnetic resonance spectroscopy (MRS) correlates with strength and meaningful functional outcomes (16-18). 1H MRS also quantifies muscle metabolites and has been used in genetic dystrophies, demonstrating altered metabolite concentrations that associate with poor outcomes (19, 20). These pathologic changes are common to a variety of dystrophic and fibrotic muscle diseases, and are useful biomarkers independent of the underlying etiology (15). Thus, qMRI mapping has the potential to provide a wealth of information relevant to muscle health in patients with CKD.
Here, we report the results of a proof-of-concept multiparametric qMRI protocol evaluating skeletal muscle in patients with CKD. The protocol included T1ρ and T2 relaxation time mapping, chemical shift-based Dixon imaging, and 1H MRS. In addition, we investigated diffusion tensor imaging (DTI), which uses the directionality of water diffusion to probe muscle structure.
MATERIALS AND METHODS
Study Population
This study was nested within a previously reported prospective cohort study (21, 22). Patients were eligible for participation if they had an eGFR <30 ml/min/1.73 m2 or had ESKD and were receiving dialysis therapy, were ≥21 years of age, able to provide informed consent, and were ambulatory. Exclusion criteria included bilateral lower extremity amputations, use of immunosuppressive medications in the prior 3 months, and an active cancer diagnosis or receiving treatment for cancer. Generally healthy, sedentary individuals without evidence of kidney disease (eGFR>60 mL/min/1.73m2 and urine albumin:creatinine ratio <30 mg/g) were recruited as control participants. Sedentary was defined as not being engaged in strenuous work, regular brisk leisure physical activity, or a formal exercise session more than once per week for at least the previous 3 months (23, 24). Individuals of both sexes were eligible for participation. No formal power analysis was conducted to determine sample size.
Study Design
Health-related quality-of-life was assessed with the 36-Item Short Form Health Survey (SF-36) and the Patient-Reported Outcomes Measurement Information System (PROMIS) Physical Function 4a and Fatigue 7a short forms (25-27). Unilateral knee extensor strength was measured using isometric dynamometry with a handheld dynamometer (Manual Muscle Test System, Lafayette Instrument, Lafayette, IN). Two trials were conducted and subjects were instructed to perform a maximal exertion, with the highest result for the dominant leg used for analysis. Endurance capacity was measured by the 2-minute walk test conducted using a 50-foot course (28); the distance covered is highly correlated with 6-minute walk distance (29). The Short Physical Performance Battery (SPPB) is an established measure of mobility in older adults, including a 4-meter walk test, standing balance test, and 5-repetition sit-to-stand test (range 0-12, higher better) (30). Handgrip strength was measured twice in each hand using a handheld dynamometer (North Coast Medical, Morgan Hill, CA). The maximum value attained using the dominant hand was used for analysis. All laboratory tests were conducted in the clinical laboratory of Montefiore Medical Center. eGFR was calculated by the Chronic Kidney Disease Epidemiology Collaboration (CKD-EPI) equation (31). Study data were collected and managed using REDCap (Research Electronic Data Capture; RRID:SCR_003445) electronic data capture tools hosted at the Albert Einstein College of Medicine (32). The study was approved by the Institutional Review Board of the Albert Einstein College of Medicine and conducted in adherence to the Declaration of Helsinki and all participants provided written informed consent.
Quantitative MRI Protocol
All imaging was performed on a 3T MR scanner (Ingenia Elition X, Philips Healthcare, Best, the Netherlands) with a 16-channel transmit-receive knee coil. Each patient was first centered at the thigh and then at the calf, and the same image sequences were performed within the same study. In addition to standard anatomical imaging, such as T1-weighted imaging, all subjects underwent scanning using the following quantitative MRI sequences. T1ρ and T2 mapping were not performed in one control participant, and DTI of the calf muscles was not performed in one dialysis patient due to technical limitations.
mDixon.
A multi-echo Dixon-based MRI protocol (mDixon-Quant) was used to assess the degree and distribution of fat infiltration in muscle compartments of the thigh and calf. Imaging parameters included: repetition time (TR) = 8.5 ms, six echoes with first echo time (TE) = 1.31 ms, and ΔTE = 1.2 ms, field of view (FOV) = 200 × 200 × 201 mm3, flip angle = 3°; matrix size = 168 × 121, acquisition resolution = 1.19 × 1.65 × 6 mm3, number of slices = 67, and scan duration ~ 35 sec. Water-only and fat-only images, along with quantitative fat-fraction and T2* maps, were generated using the vendor’s default reconstruction algorithm. This algorithm, while approved for liver fat fraction measurements, does not separate intramuscular from extramuscular fat. However, prior studies have validated this sequence in skeletal muscle (33, 34).
T1ρ and T2 mapping.
Quantitative T1ρ and T2 mapping sequences were performed to study muscle fibrosis and different water compartments and their fractions. The 3D T1ρ magnetization-prepared angle-modulated partitioned k-space spoiled gradient echo snapshots (MAPSS) sequence parameters included FOV = 200 × 200 × 201 mm3, matrix size = 200 × 154 × 64, TR = 4.4 ms, TE = 2.3 ms, resolution = 1 × 1.3 × 6 mm2, number of slices = 67, and compressed SENSE factor = 3, spin-lock frequency = 500 Hz, 4 spin-lock time (TSL) durations = 0, 20, 40, 60 ms. acquisition duration ~ 3 min 28 sec (35-39). The 3D T2 mapping sequence had the same imaging parameters and scan duration except TE preparation time = 0, 20, 40, 60 ms. T1ρ and T2 maps were computed on a pixel-by-pixel basis using a mono-exponential decay model using the following equations: M(TSL) = M0 exp(−TSL/T1ρ) for T1ρ, and M(TE) = M0 exp(−TE/T2) for T2 mapping, where M0 and M(TSL) denote the equilibrium magnetization and T1ρ-prepared magnetization with the spin-lock time of TSL, respectively. M(TE) denotes the magnetization acquired with the echo time TE. These two mono-exponential equations were linearized by logarithm. Data were not obtained for one control participant due to technical difficulties.
DTI:
The DTI sequences had the following parameters: FOV = 200 × 200 mm, acquisition matrix size = 80 × 78, slice thickness = 3mm, gap = 0 mm, TR/TE = 2259/66 ms, resolution = 2.50 × 2.56 mm2, number of slices = 50, SENSE factor = 2, b values = 0, 800 s/mm2 with 15 diffusion directions, half scan (partial Fourier factor) = 0.8, number of averages = 2, and acquisition duration = ~4 min 45 sec. Both spectral presaturation with inversion recovery (SPIR) and slice-selection gradient reversal (SSGR) were employed in the DTI sequences to minimize the impact of fat contamination on diffusion quantification. Apparent diffusion coefficient (ADC) and fractional anisotropy (FA) maps were generated automatically on the MR scanner console after image co-registration. To assess the potential impact of SNR-related bias on our diffusion metrics (40, 41), we estimated the mean SNR in two representative patient subjects. The measured values (ranging from 70 to 121) suggest that SNR-related bias had a limited impact on the quantitative diffusion MRI obtained with this DTI technique.
Muscle segmentation.
Three thigh muscles (vastus lateralis, vastus medialis, biceps femoris longus) and 4 calf muscles (tibialis anterior, soleus, gastrocnemius medialis, gastrocnemius lateralis) were manually segmented to define regions of interest (ROIs) by a blinded examiner. For all metrics except fat fraction, ROIs were drawn excluding fat, fascia, and large blood vessels using vendor-provided software on the MRI console. For fat fraction, ROIs did not exclude fat within the border of the muscle belly as doing so would have underestimated fatty replacement of skeletal muscle. Measurements for each qMRI metric were extracted from 5 consecutive slices and averaged.
Cross-sectional area.
Muscle contractile cross-sectional area (CSA) size was evaluated on the water-only images from the mDixon Quant sequence using open-source software ImageJ (National Institutes of Health, Bethesda, MD; RRID: SCR_003070). The center slice from the 5 consecutive slices was selected for CSA analysis. Images were first automatically thresholded using the isodata algorithm to generate binary images, with all muscle pixel values assigned to a value of one and background/fat pixels a value of zero. Manual ROIs were then drawn to encompass each muscle group, and the total number of muscle pixels within the ROI was quantified to calculate contractile CSA. Quadriceps CSA was calculated from an ROI encompassing the vastus lateralis, vastus medialis, and vastus intermedius. In addition, total thigh muscle CSA was measured on all 5 slices and the mean used for analysis.
1H MRS.
A water-suppressed point-resolved spectroscopy (PRESS) sequence was used to localize a single voxel with size of 15 × 10 × 20 mm3 in the vastus lateralis muscle of the thigh, as well as the soleus and gastrocnemius medialis muscles in the lower leg, respectively. Care was taken to avoid muscle boundaries, large vessels, and visible intermuscular adipose tissue and intramuscular fat. Water suppression involved an excitation pulse followed by a frequency-modulated pulse with a 140 Hz bandwidth and a 300° flip angle to minimize the water signal at RF excitation. Imaging parameters included: TR = 2000 ms, TE = 30 ms, readout duration = 1024 ms, number of signal averages (NSA) = 32, spectral bandwidth = 2000 Hz, number of samples = 2048, and scan duration = 1 min 40 sec. Water-unsuppressed reference scans were acquired using the same parameters, except with NSA = 4. High-order “pencil beam” shimming was used to optimize the B0 field homogeneity. The MRS data were exported offline for spectral peak fitting and the calculation of the nominal concentration of each metabolite component. The nominal concentration is defined as the area under the fitted peak. A custom software tool in MATLAB (The MathWorks, Natick, MA; RRID:SCR_001622) was developed using the open-source MRS library (MRS_MRI_libs, https://github.com/chenkonturek/MRS_MRI_libs) to fit the MRS data with a linear combination of symmetric Gaussian functions for the following six peaks: water, Cr (creatine)-CH2, trimethylamine (TMA), Cr-CH3, extramyocellular lipid (EMCL), and intramyocellular lipid (IMCL). TMA was quantified by the area of the peak at 3.2 ppm. Total creatine included the peak areas at 3.0 and 3.9 ppm. All measures were normalized by the water peak area from the water-unsuppressed reference spectrum. More details about the processing tool are provided in the Supplemental File.
Statistical Analysis
Comparisons of participant characteristics among the 3 participants groups were performed using analysis-of-variance (ANOVA) or Kruskal-Wallis tests for continuous variables and χ2 tests or Fisher’s exact test for categorical variables. Differences between control participants and CKD patients were tested using 2-tailed t-tests or Wilcoxon rank-sum tests. Spearman correlation coefficients were used to test pairwise correlations of qMRI metrics. To test associations of CKD or ESKD status with qMRI metrics across muscle groups, which include multiple measures per person, mixed effects models including random intercepts were fit to account for clustering within an individual. Pairwise comparisons of CKD and control participants within muscle groups were performed using tests of contrast. Due to their skewed distributions, all 1H MRS measures were log-transformed prior to analysis. All analyses were performed using Stata 17.0 (StataCorp, College Station, TX; RRID:SCR_012763). A p-value <0.05 was considered statistically significant.
RESULTS
Participant Characteristics
Of the 19 participants, 6 had non-dialysis dependent CKD, 3 had ESKD and were receiving hemodialysis, and 10 were controls (Figure 1). The mean age among the CKD, ESKD, and control participants was 62±16, 51±13, and 55±6 years, respectively (Table 1). Mean eGFR was 21.3 ± 5.0 and 87.9 ± 9.7 mL/min/1.73m2 in CKD and control participants, respectively. All participants were free from disability and fully independent in activities of daily living. Self-reported physical function and fatigue and objective measures of performance including the SPPB, sit-to-stand time, and handgrip strength were poorer among CKD and ESKD patients than controls.
Figure 1. Flow diagram of study participation.
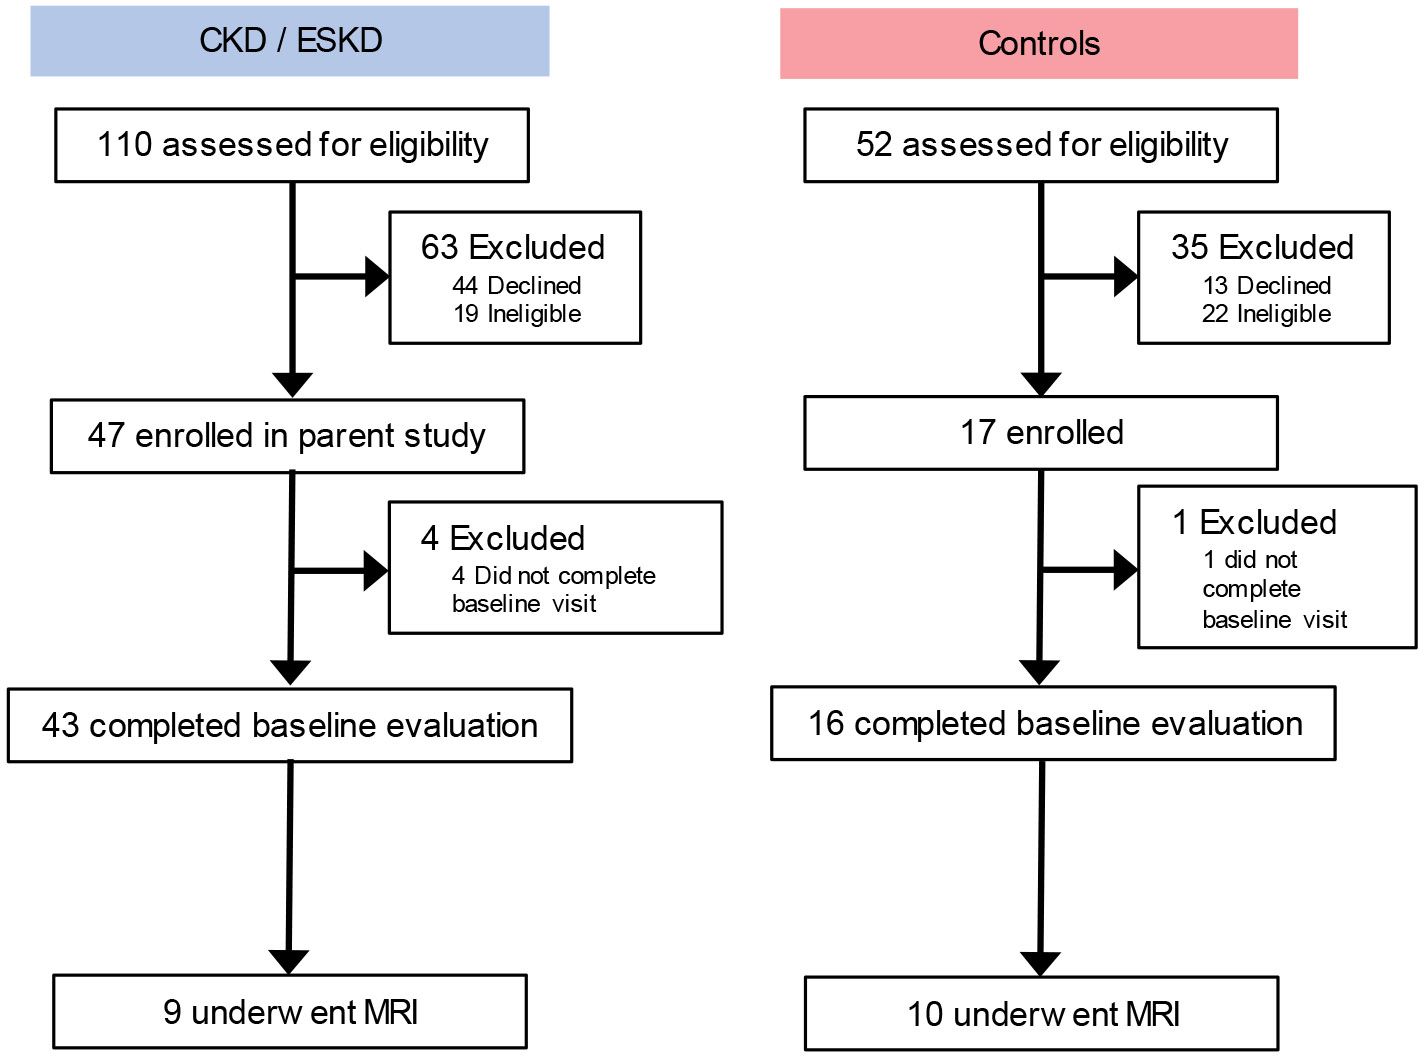
Table 1. Participant Characteristics.
| Control | CKD | ESKD | p | |
|---|---|---|---|---|
| Number | 10 | 6 | 3 | |
| Age (years) | 55 ± 6 | 62 ± 16 | 51 ±13 | 0.36 |
| Sex – n (%) | 0.22 | |||
| Female | 4 (40%) | 4 (67%) | 3 (100%) | |
| Male | 6 (60%) | 2 (33%) | 0 (0%) | |
| Race/ethnicity – n (%) | 0.57 | |||
| Non-Hispanic White | 4 (40%) | 2 (33%) | 0 (0%) | |
| Non-Hispanic Black | 5 (50%) | 2 (33%) | 2 (67%) | |
| Hispanic | 1 (10%) | 2 (33%) | 1 (33%) | |
| Hypertension – n (%) | 1 (10%) | 6 (100%) | 3 (100%) | <0.001 |
| Diabetes – n (%) | 1 (10%) | 4 (67%) | 1 (33%) | 0.05 |
| eGFR (mL/min/1.73 m2) | 87.9 ± 10.1 | 21.3 ± 5.4 | …. | <0.001 |
| SF-36 Physical Component Score | 50.6 ± 7.0 | 41.7 ± 7.4 | 42.0 ± 15.5 | 0.04 |
| SF-36 Physical Functioning Domain | 54.7 ± 5.9 | 47.2 ± 7.6 | 43.0 ± 20.7 | 0.02 |
| PROMIS Physical Function | 54.7 ± 6.3 | 47.5 ± 5.0 | 51.4 ± 9.5 | 0.14 |
| PROMIS Fatigue | 39.9 ± 4.9 | 49.4 ± 7.6 | 47.9 ± 8.7 | 0.02 |
| SPPB | 11.4± 0.7 | 10.2 ± 1.6 | 10.7 ± 2.3 | 0.40 |
| 5-repetition sit-to-stand time (s) | 10.4 ± 2.5 | 12.4 ± 2.9 | 12.8 ± 6.6 | 0.60 |
| Gait speed (m/s) | 1.2 ± 0.2 | 1.1 ± 0.3 | 1.0 ± 0.2 | 0.56 |
| 2-minute walk distance (feet) | 559 ± 167 | 546 ± 124 | …. | 0.88 |
| Handgrip strength (kg) | 39.8 ± 8.3 | 29.3 ± 6.4 | 30.3 ± 7.8 | 0.09 |
| Hip flexion strength (kg) | 17.9 ± 4.5 | 15.1 ± 6.9 | 15.7 ± 4.5 | 0.35 |
| Quadriceps strength (kg) | 23.4 ± 8.9 | 22.7 ± 5.7 | 26.5 ± 11.0 | 0.91 |
Abbreviations: CKD, chronic kidney disease; ESKD, end stage kidney disease; eGFR, estimated glomerular filtration rate; SF-36, 36-Item Short Form Health Survey; PROMIS, Patient-Reported Outcomes Measurement Information System; SPPB, Short Physical Performance Battery.
SF-36, PROMIS, SPPB and its components, 2-minute walk, and strength testing were not available for 2 control participants.
Data are presented as mean ± standard deviation or median (interquartile range) for continuous variables. Comparisons of participant characteristics among the 3 participants groups were performed using analysis-of-variance or Kruskal-Wallis tests for continuous variables and χ2 tests or Fisher’s exact test for categorical variables. Differences between control participants and CKD patients were tested using 2-tailed t-tests or Wilcoxon rank-sum tests.
Quantitative MRI
Representative T1-weighted images and quantitative MRI maps for control, CKD, and ESKD are presented in Figure 2 (T1ρ, fat fraction, T2) and Supplemental Figure S2 (T2*, FA, ADC). To determine the extent to which qMRI metrics clustered within an individual across muscle groups, we compared measures within each muscle with those of the vastus lateralis (VL). VL was selected as the comparator because it has been extensively characterized in humans, is the muscle within which we previously demonstrated biopsy-proven fibrosis accompanying loss of kidney function (8, 21), and prior genetic dystrophy studies demonstrated strong correlations of VL qMRI measures with functional endpoints (16, 18). Visual inspection indicated that values for T1ρ, fat fraction, T2, T2*, and ADC tended to cluster within an individual across muscle groups (Figure 3). In contrast, FA showed large within-person variability across muscles. Generally strong correlations were present with the VL for T1ρ and fat fraction, and within thigh muscles in particular for T2 and T2* (Table 2).
Figure 2. Representative quantitative magnetic resonance imaging maps.
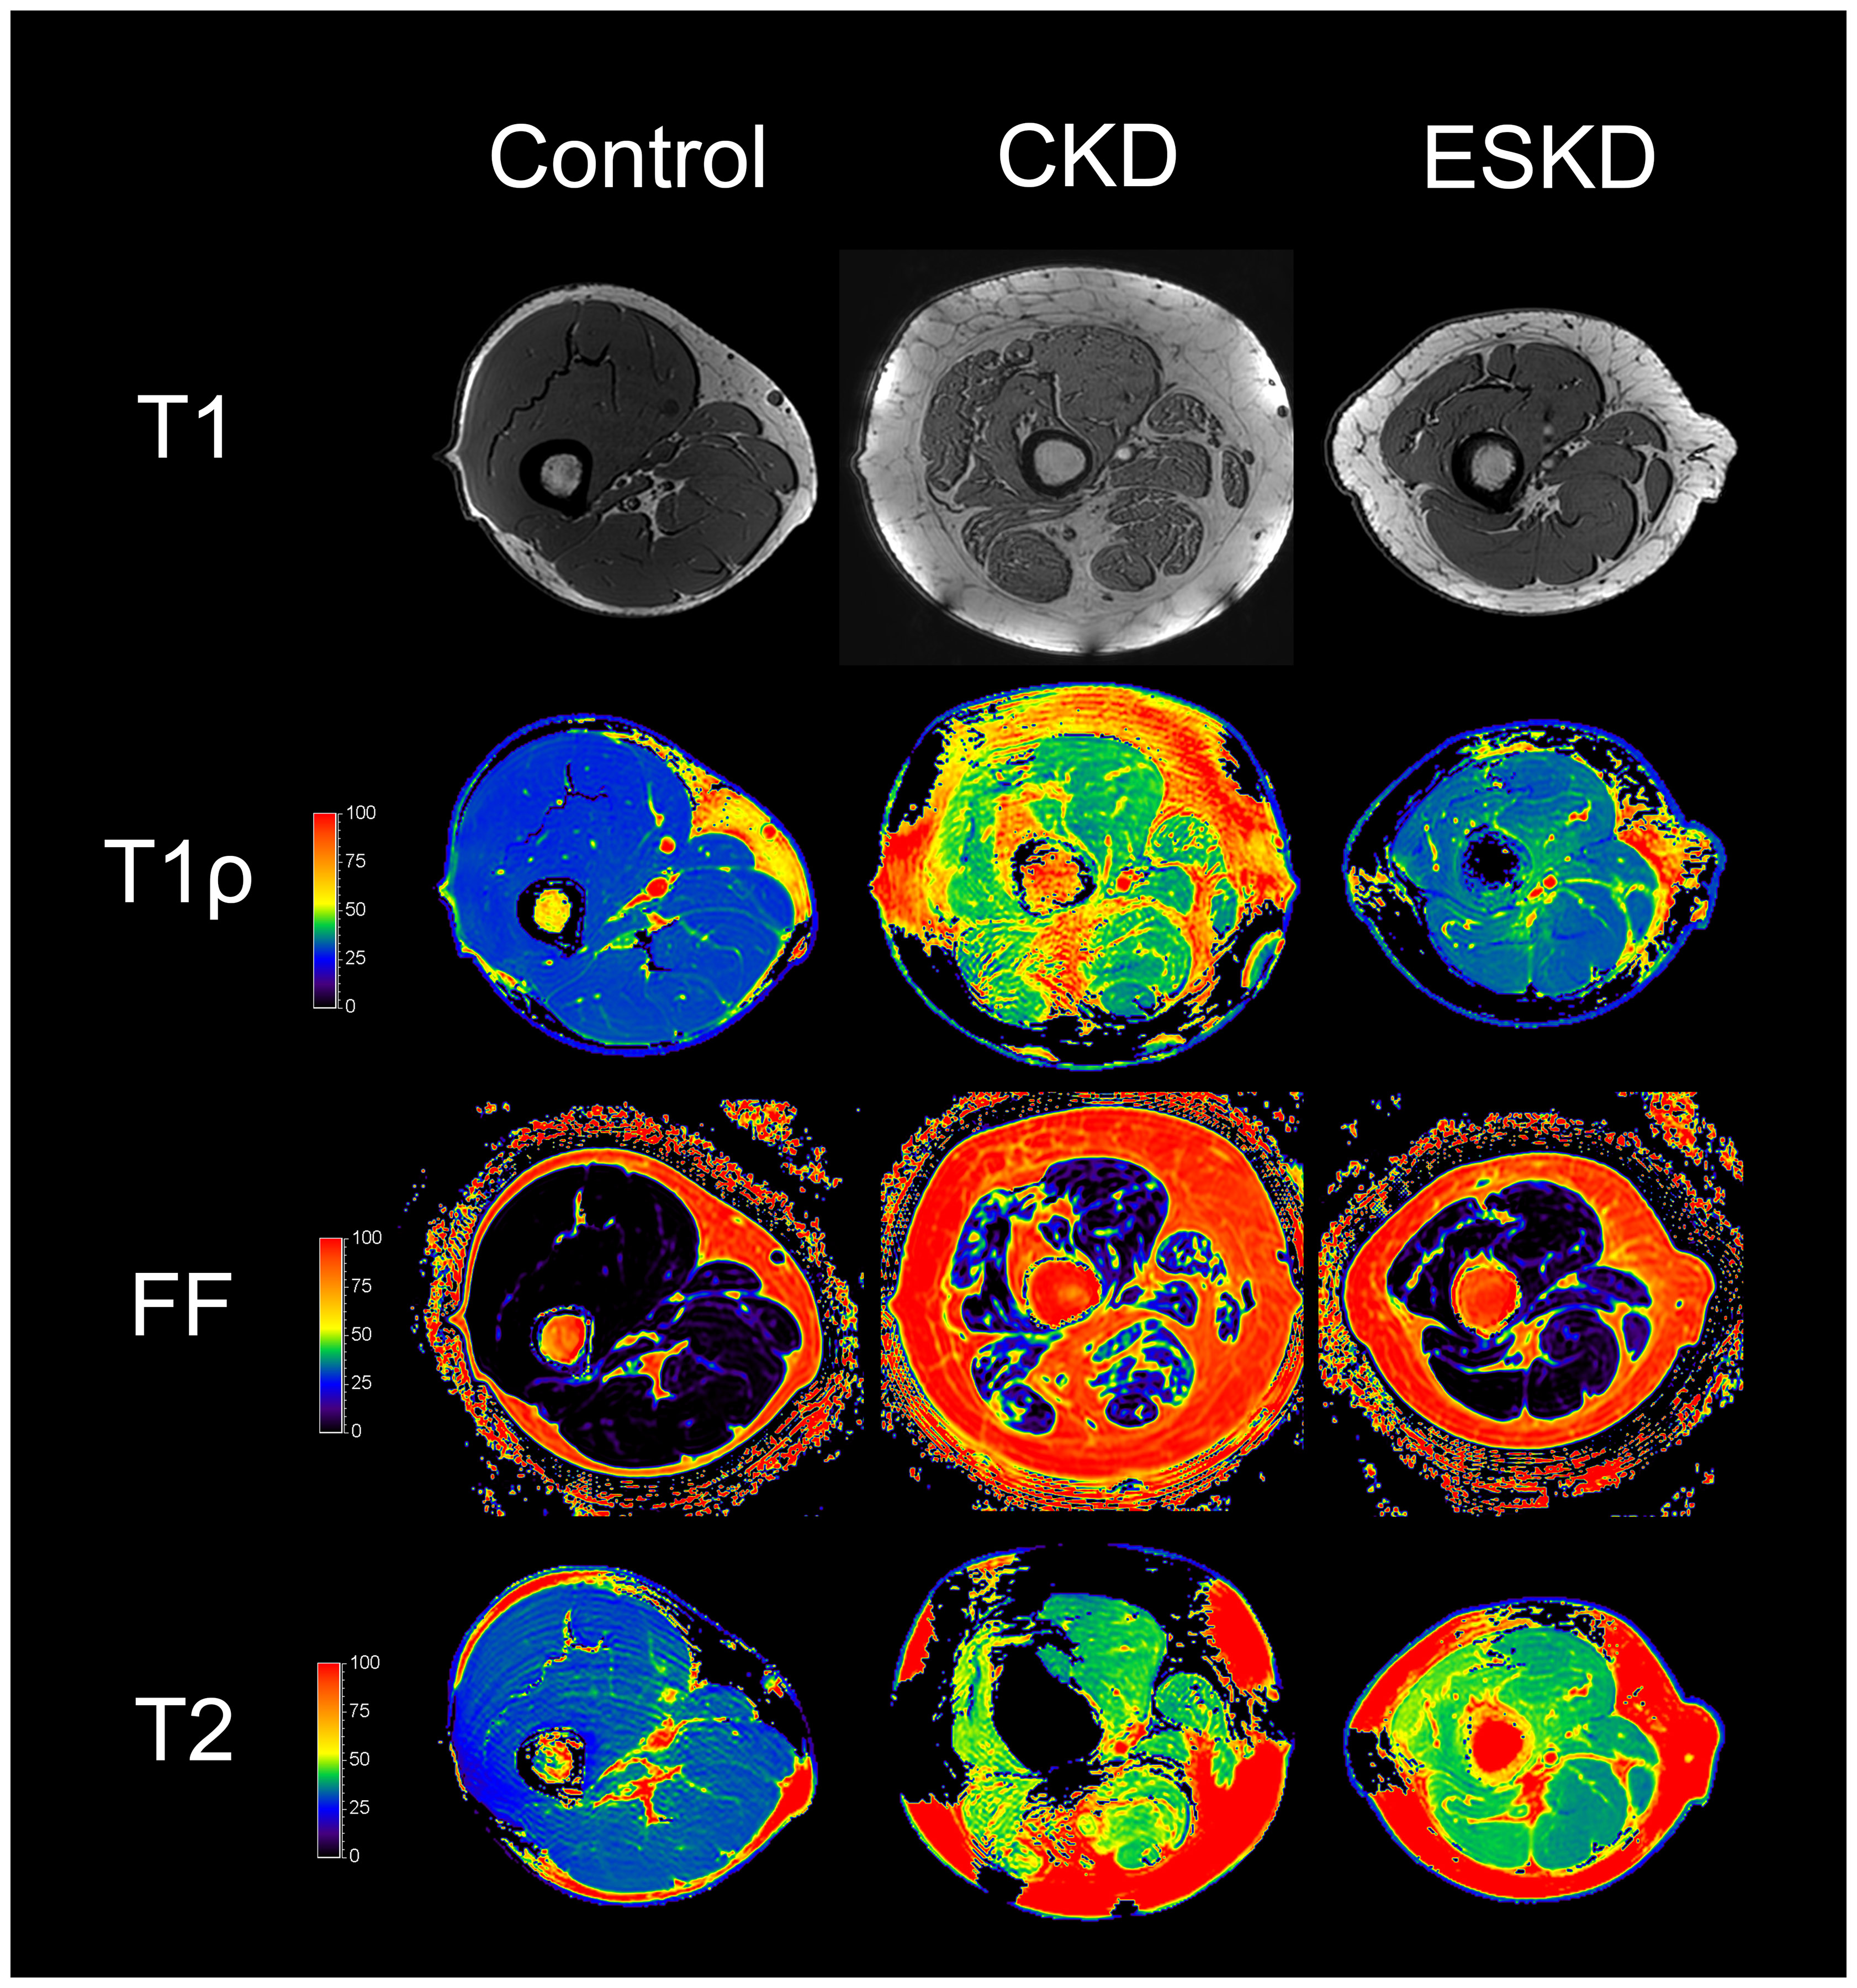
T1-weighted images and T1ρ, fat fraction, and T2 maps of thigh muscles for control, CKD, and ESKD participants. Abbreviations: FF, fat fraction.
Figure 3. Quantitative magnetic resonance imaging metrics by person and muscle group.
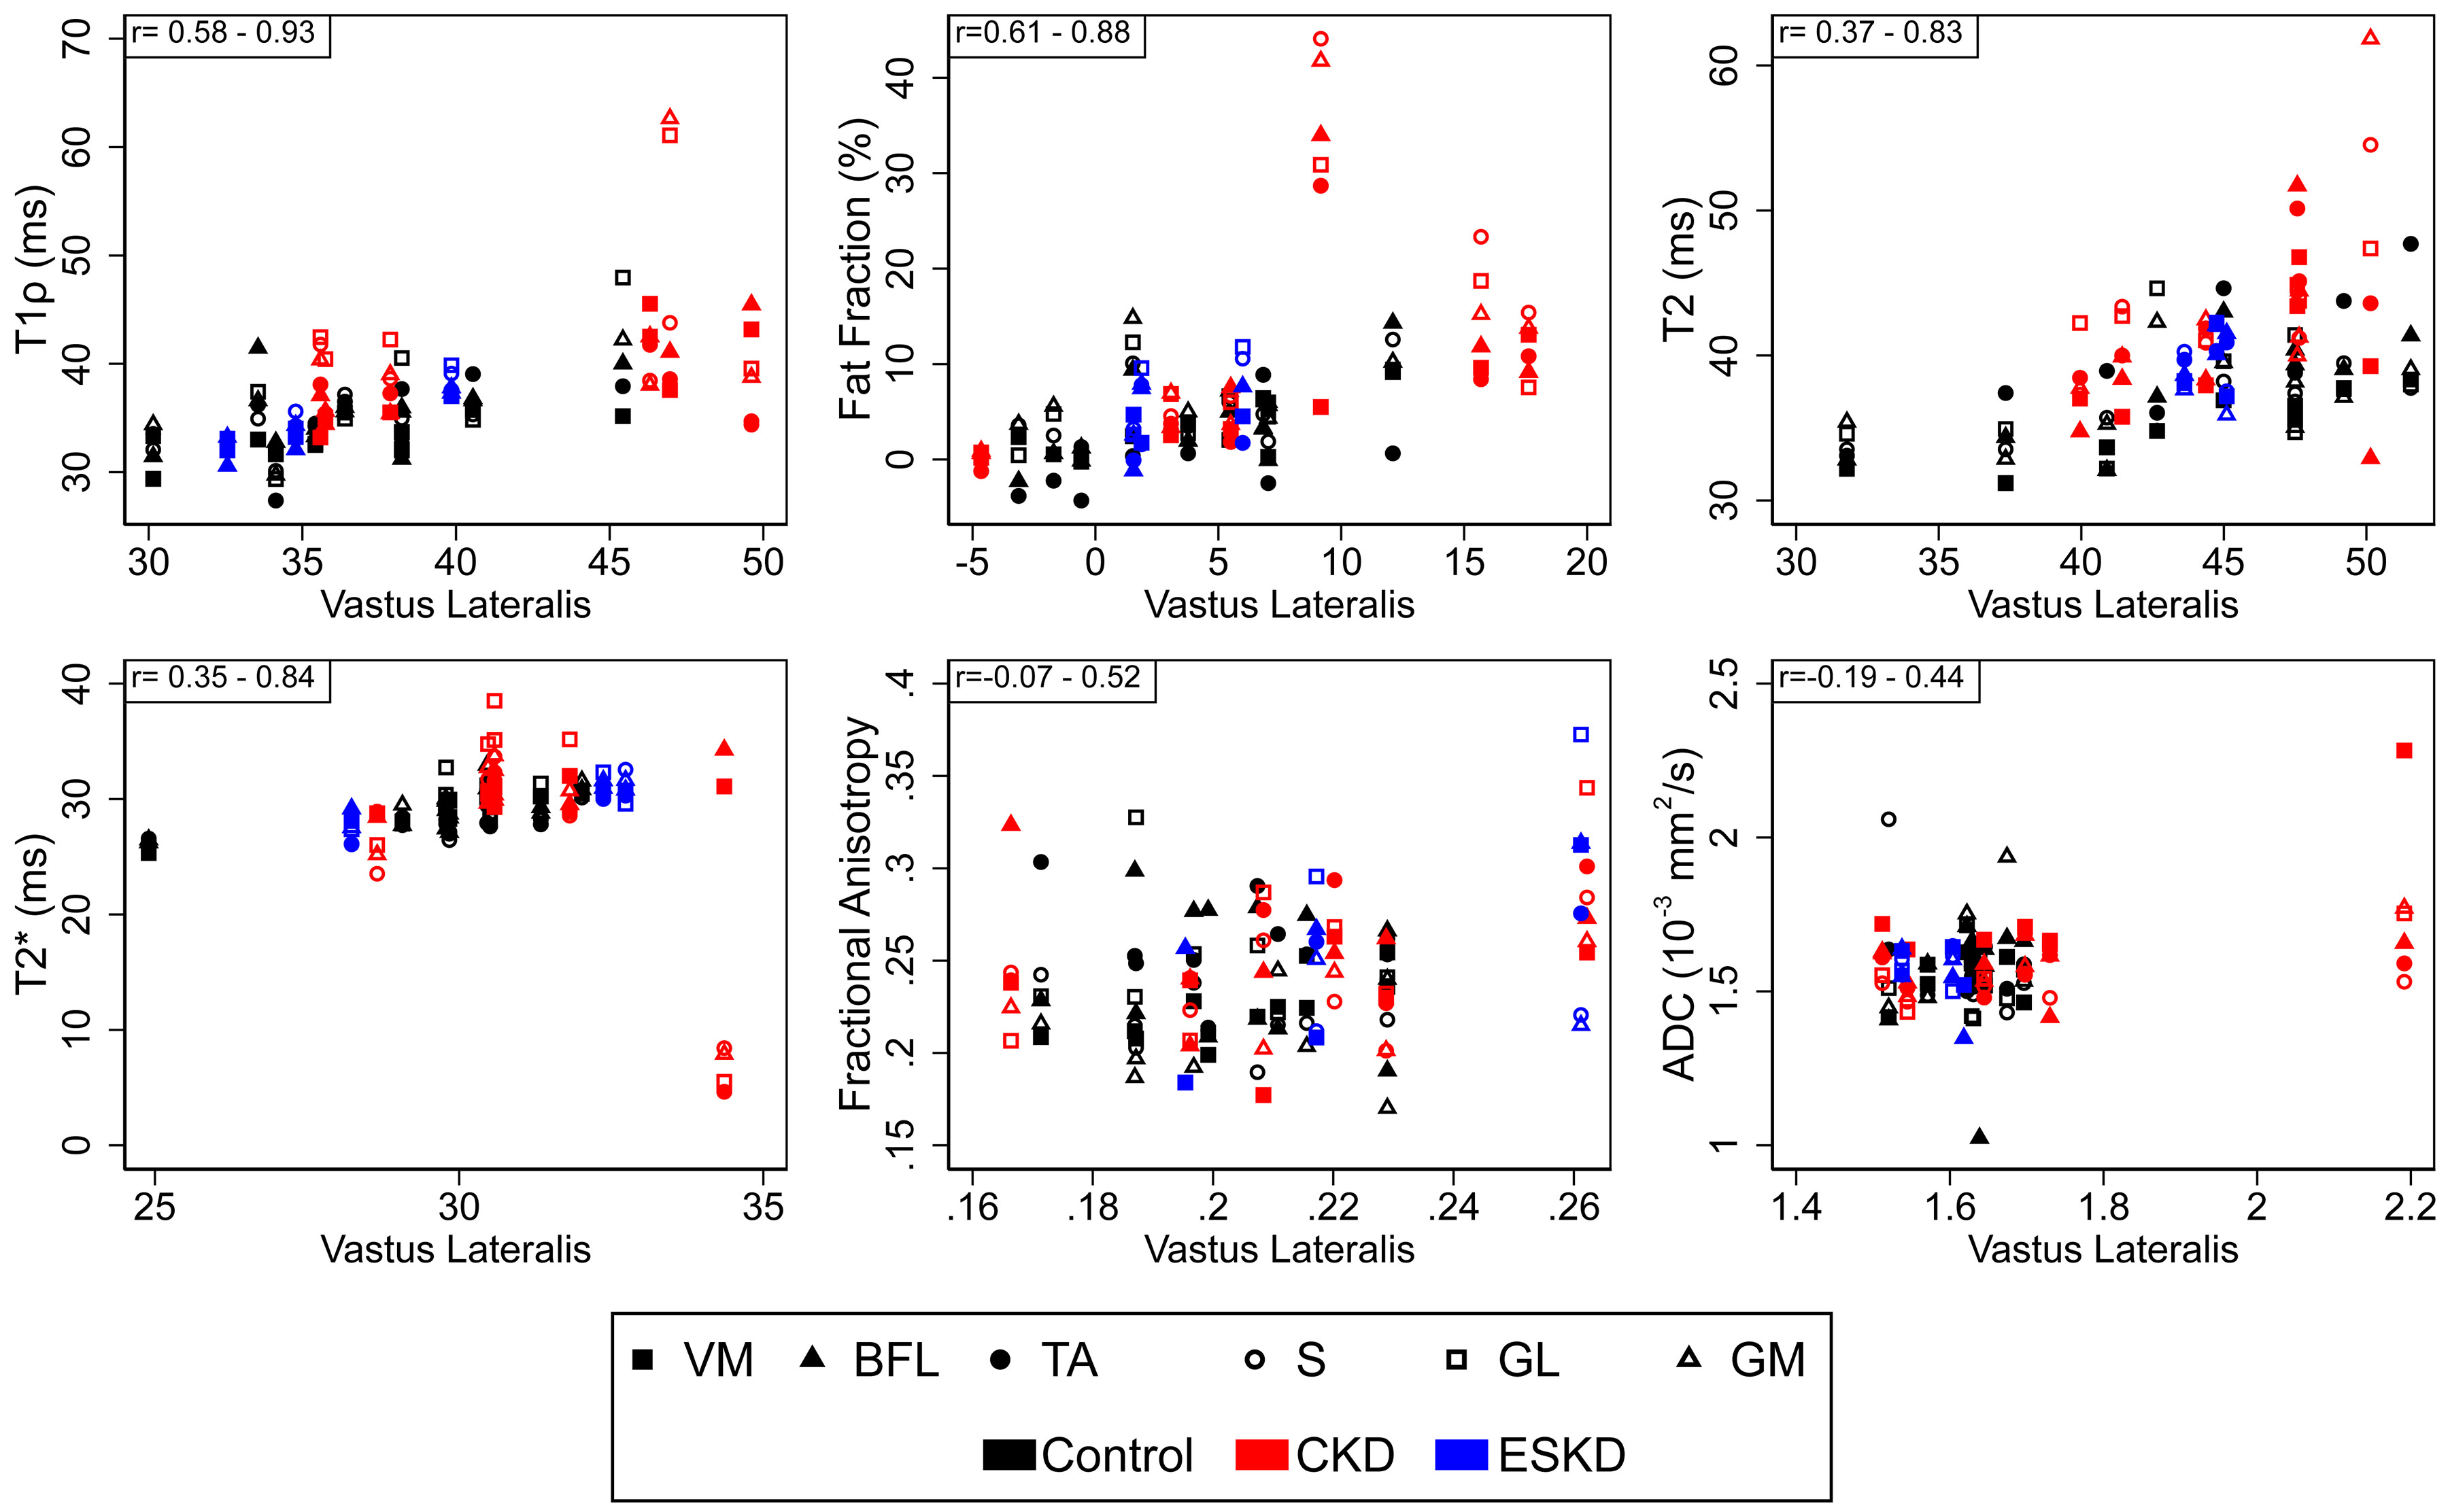
Values for each muscle group for an individual participant are plotted relative to that individual’s values for the vastus lateralis muscle. For each metric, the range of Spearman correlation coefficients across muscle groups is displayed in the upper left corner. n=19 for all metrics except T1ρ and T2 (n=18). Abbreviations: VM, vastus medialis; BFL, biceps femoris longus; TA, tibialis anterior; S, soleus; GM, gastrocnemius medialis; GL, gastrocnemius lateralis; ADC, apparent diffusion coefficient.
Table 2. Muscle-Specific Correlations of Muscle Quantitative Magnetic Resonance Imaging Metrics with Vastus Lateralis Values.
| Metric | VM | BFL | GM | GL | S | TA |
|---|---|---|---|---|---|---|
| T1ρ | 0.93 p<0.001 |
0.78 p<0.001 |
0.76 p<0.001 |
0.72 p<0.001 |
0.58 p=0.01 |
0.75 p<0.001 |
| Fat Fraction | 0.88 p<0.001 |
0.76 p<0.001 |
0.61 p=0.006 |
0.63 p=0.005 |
0.81 p<0.001 |
0.84 p<0.001 |
| T2 | 0.73 p<0.001 |
0.60 p=0.008 |
0.45 p=0.06 |
0.37 p=0.13 |
0.60 p=0.008 |
0. 83 p<0.001 |
| T2* | 0.84 p<0.001 |
0.74 p<0.001 |
0.43 p=0.07 |
0.35 p=0.14 |
0.51 p=0.03 |
0.42 p=0.07 |
| FA | 0.41 p=0.09 |
−0.07 p=0.76 |
0.17 p=0.50 |
0.52 p=0.03 |
−0.07 p=0.78 |
0.29 p=0.24 |
| ADC | 0.15 p=0.54 |
0.26 p=0.27 |
0.37 p=0.13 |
0.44 p=0.07 |
−0.19 p=0.44 |
0.02 p=0.94 |
Abbreviations: VM, vastus medialis; BFL, biceps femoris longus; TA, tibialis anterior; S, soleus; GM, gastrocnemius medialis; GL, gastrocnemius lateralis; ADC, apparent diffusion coefficient; FA, fractional anisotropy.
Pairwise correlations are presented as Spearman correlation coefficients and associated p-values. n=19 for Fat Fraction and T2*, n=19 for FA and ADC for VM and BFL, n=18 for other comparisons.
Given the clustering we observed, rather than focusing on differences within an individual muscle group, we tested global differences across muscles by CKD status for each qMRI parameter. These analyses revealed marked elevations in T1ρ and T2 relaxation times and in muscle fat fraction among patients with CKD compared with controls which were independent of differences in age (Table 3). In contrast, no differences were observed between CKD patients and controls for T2*, ADC, and FA. Age-adjusted estimates showed that T1ρ and fat fraction were similarly elevated across muscle groups, whereas differences in T2 may have been driven largely by changes in calf muscles (Figure 4). FA was numerically higher in CKD patients in all muscle groups but these differences were not statistically significant. Fat fraction correlated with T1ρ, T2, and ADC across muscles and participant groups (r=0.46, p<0.001; r=0.28, p=0.002; r=−0.18, p=0.04, respectively); associations with T1ρ and T2 may have been of greater magnitude among participants with CKD (Figure 5). T1ρ strongly correlated with T2 (r=0.69, p<0.001) without meaningful differences observed across groups (Figure 5).
Table 3. Associations of CKD Status with Muscle Quantitative Magnetic Resonance Imaging Metrics.
| Control vs. CKD | ESKD vs. CKD | |||
|---|---|---|---|---|
| Parameter | Estimate (95%CI) | P-value | Estimate (95%CI) | P-value |
| Unadjusted | ||||
| T1ρ | −5.46 (−8.71 to −2.21) | 0.001 | −5.48 (−9.84 to −1.12) | 0.01 |
| Fat Fraction | −6.77(−12.55 to −0.99) | 0.02 | −5.82 (−13.73 to 2.09) | 0.15 |
| T2 | −4.63 (−7.52 to −1.73) | 0.002 | −2.55 (−6.43 to 1.33) | 0.20 |
| T2* | 0.40 (−2.73 to 3.52) | 0.81 | 1.38 (−2.91 to 5.66) | 0.53 |
| ADC (10−3 mm2/s) | −0.05 (−0.12 to 0.01) | 0.12 | −0.06 (−0.15 to 0.04) | 0.24 |
| FA | −0.01 (−0.03 to 0.004) | 0.14 | 0.005 (−0.02 to 0.03) | 0.67 |
| Age Adjusted | ||||
| T1ρ | −4.99 (−8.27 to −1.71) | 0.003 | −4.68 (−9.17 to −0.17) | 0.04 |
| Fat Fraction | −6.67(−12.68 to −0.65) | 0.03 | −5.64 (−14.04 to 2.77) | 0.19 |
| T2 | 4.25 (−7.19 to −1.31) | 0.005 | −1.90 (−5.93 to 2.13) | 0.36 |
| T2* | 1.07 (−2.00 to 4.14) | 0.49 | 2.52 (−1.77 to 6.81) | 0.25 |
| ADC (10−3 mm2/s) | −0.04 (−0.10 to 0.02) | 0.23 | −0.04 (−0.13 to 0.06) | 0.20 |
| FA | −0.01 (−0.03 to 0.003) | 0.11 | 0.01 (−0.01 to 0.03) | 0.37 |
Abbreviations: CKD, chronic kidney disease; ESKD, end stage kidney disease; ADC, apparent diffusion coefficient; FA, fractional anisotropy.
Estimates and associated p-values determined using mixed effects models including random intercepts to account for clustering within an individual across muscle groups. n=19 for all analyses except T1ρ and T2 (n=18).
Figure 4. Quantitative magnetic resonance imaging metrics by muscle group and CKD status.
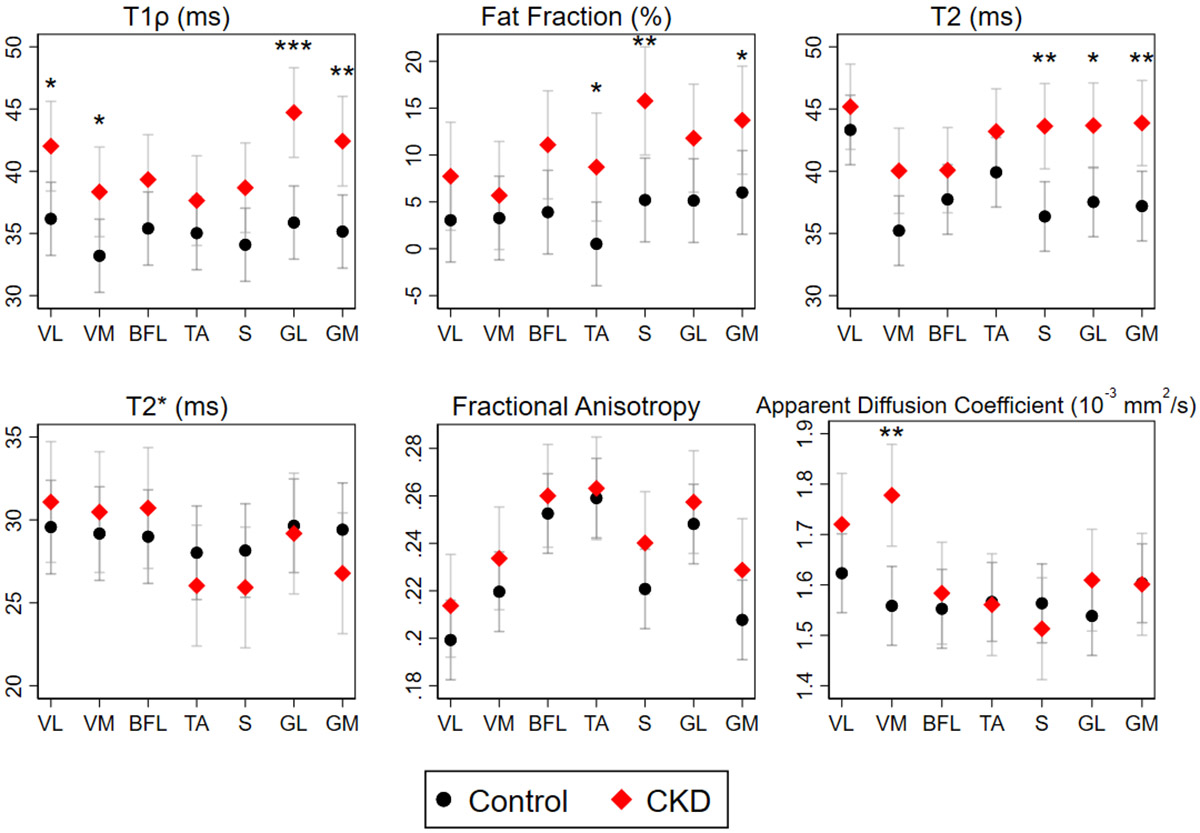
Data are presented as mean ± SE. Mixed effects models including random intercepts were fit to account for clustering within an individual. Pairwise comparisons of CKD and control participants within muscle groups were performed using tests of contrast. n=19 for all metrics except T1ρ and T2 (n=18). Abbreviations: VL, vastus lateralis; VM, vastus medialis; BFL, biceps femoris longus; TA, tibialis anterior; S, soleus; GM, gastrocnemius medialis; GL, gastrocnemius lateralis. *p<0.05, **p<0.01, ***p<0.001.
Figure 5. Correlations of quantitative magnetic resonance imaging metrics.
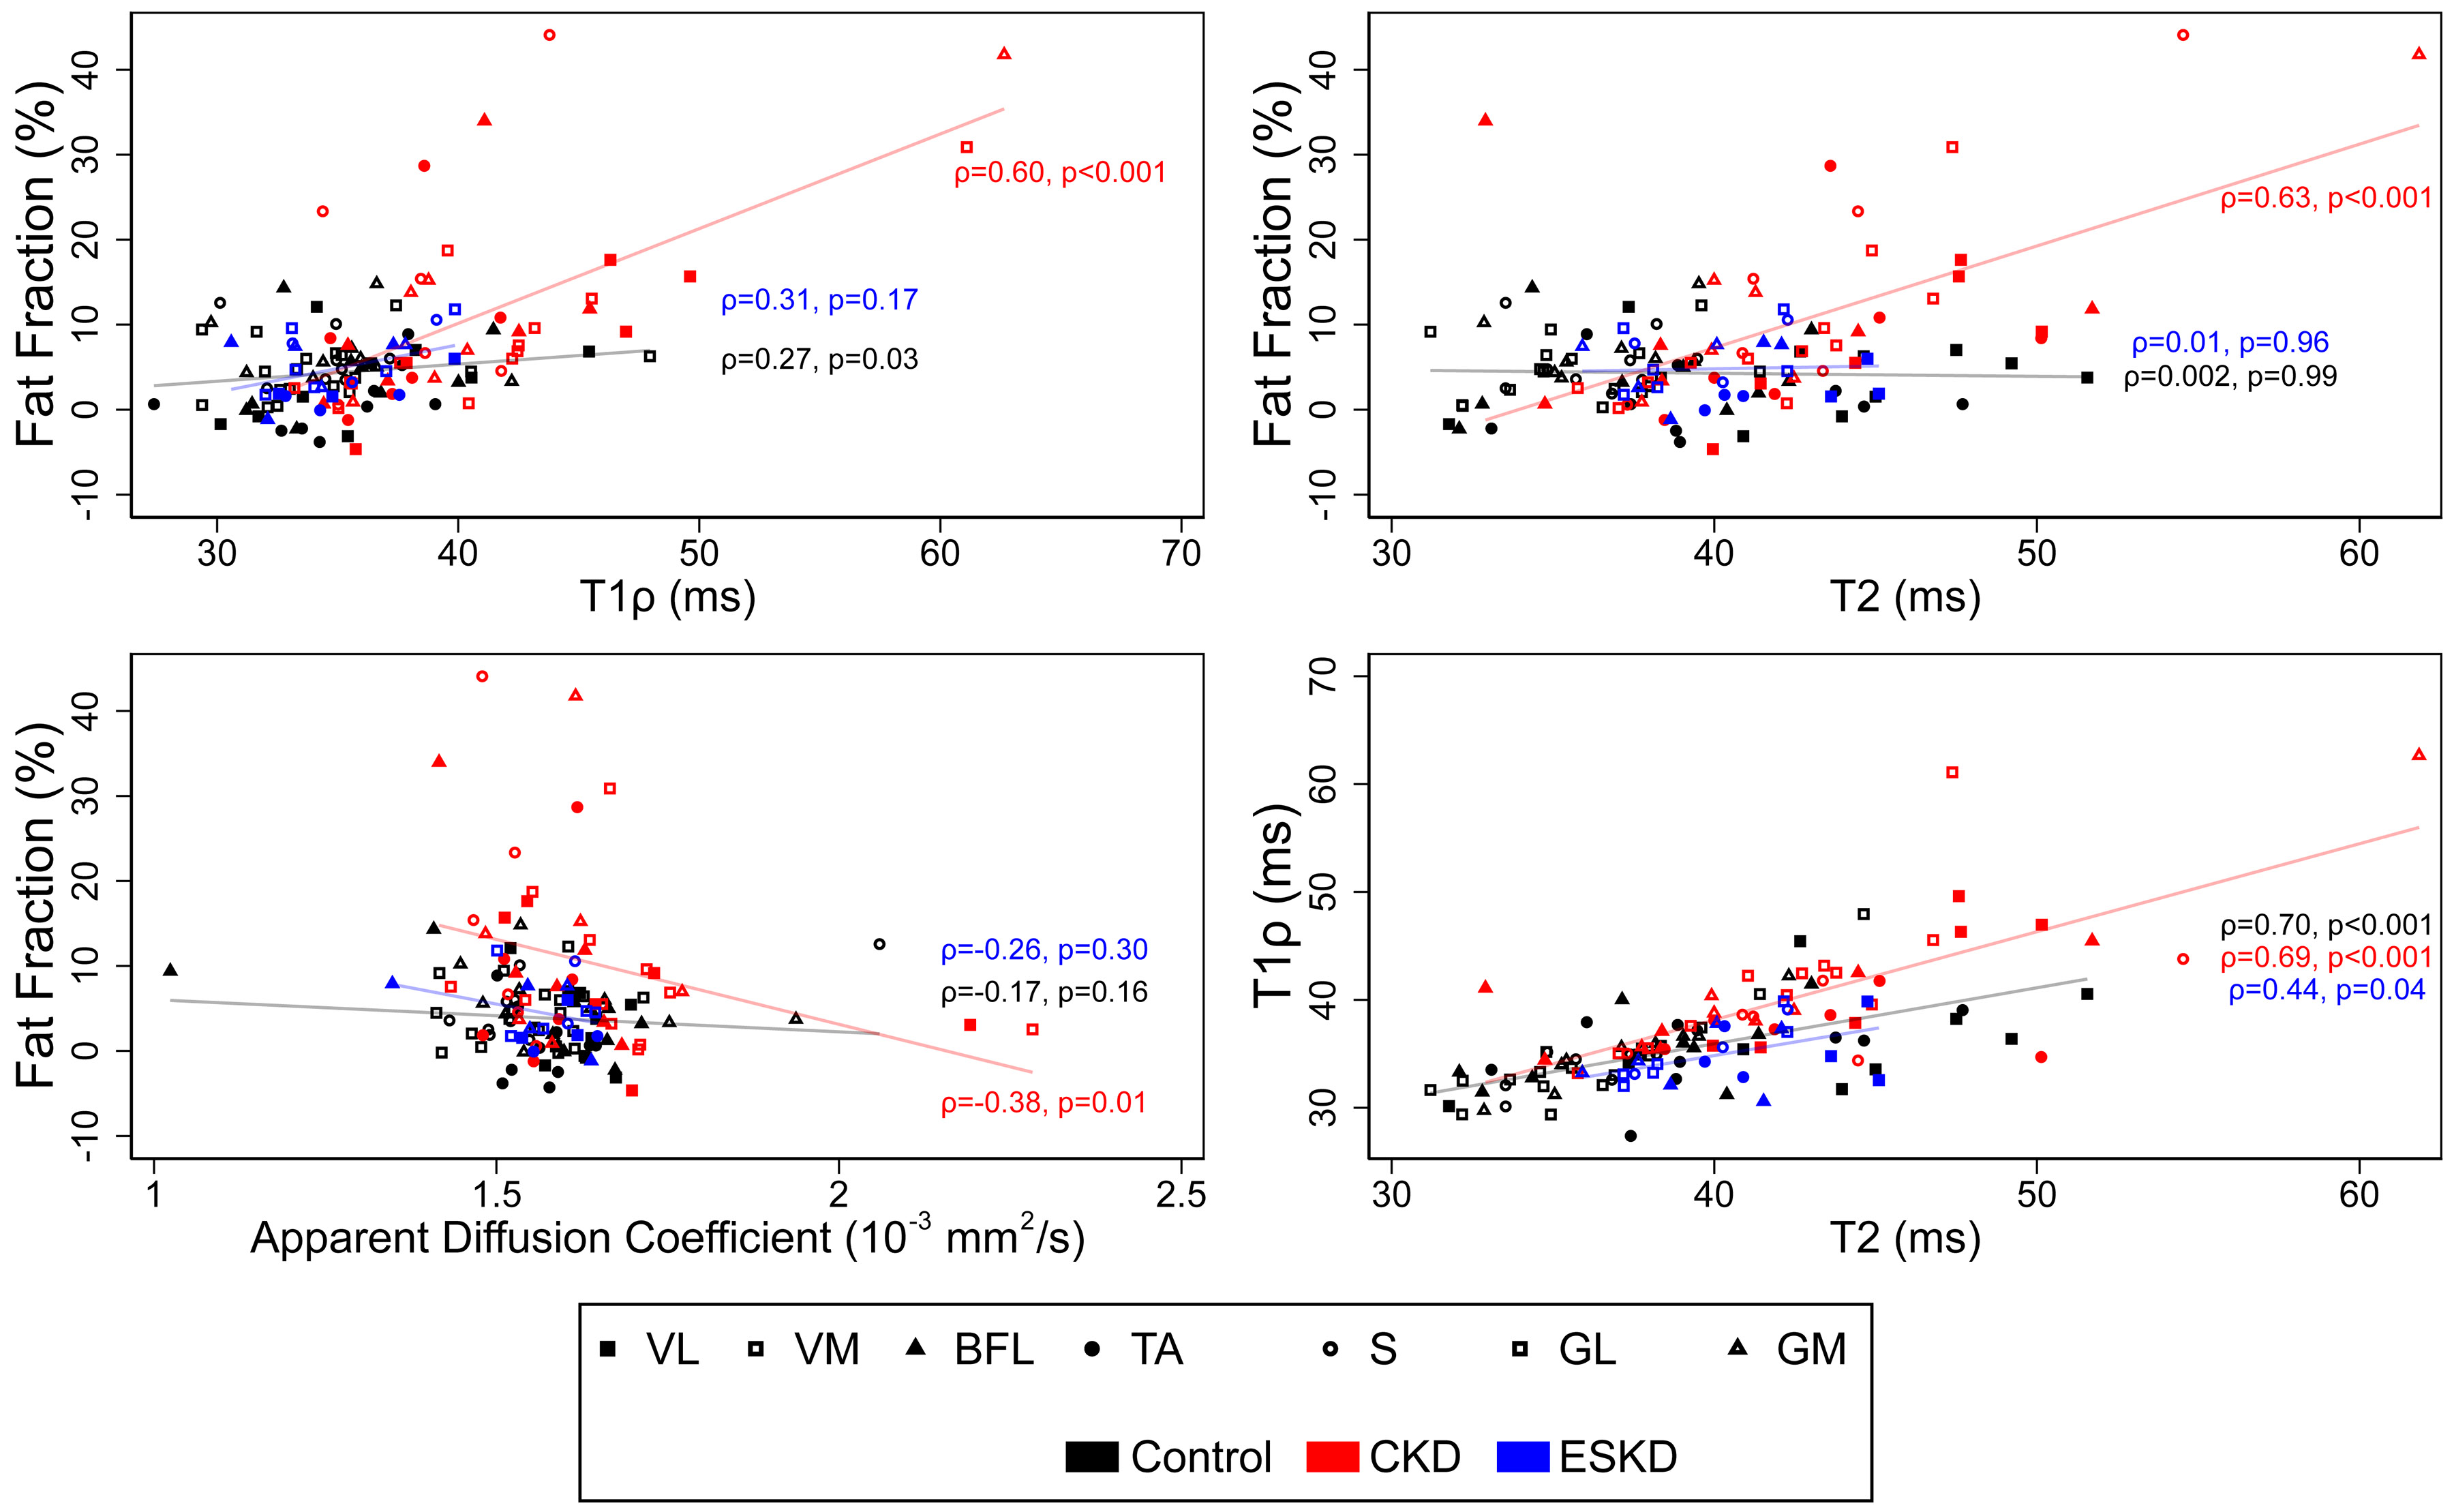
Scatterplots denoting values for selected metrics within each muscle group. Spearman correlation coefficients and associated p-values are presented separately for CKD, ESKD, and control participants. n=19 for all metrics except T1ρ and T2 (n=18).
We previously reported regression of muscle fibrosis in CKD patients following dialysis initiation (21). Therefore, we explored differences in qMRI parameters between patients with non-dialysis dependent CKD and 3 patients with ESKD receiving hemodialysis (Table 3). Of note, these 3 ESKD patients were included in our prior muscle biopsy study and had levels of muscle collagen that were similar to healthy control participants (21). Consistent with our biopsy findings, T1ρ relaxation times – which were elevated in CKD patients compared with controls –were significantly lower among dialysis patients and similar to control levels. In addition, although not statistically significant in this small sample, fat fraction was numerically lower in the ESKD patients compared with CKD.
Muscle contractile CSA of the 7 muscle groups examined was lower in CKD patients and Dialysis patients than Controls (Controls: 81.3 ± 13.3 cm2, CKD: 64.9 ± 20.4 cm2, Dialysis: 56.3 ± 9.1 cm2; p=0.05 across groups). Total thigh muscle CSA measured across all 5 slices showed a similar pattern (Controls: 88.9 ± 12.5 cm2, CKD: 77.0 ± 23.5 cm2, Dialysis: 63.0 ± 6.4 cm2; p=0.05 across groups). Quadriceps CSA on the center slice was highly correlated with total thigh muscle CSA measured across all 5 slices (r=0.93, p<0.001). Associations of CKD status with qMRI metrics in age-adjusted models were unchanged after adjustment for CSA (T1ρ: −5.51 ms (95% CI −8.55 to −2.48, p<0.001); FF: −8.21% (95% CI −12.89 to −3.53, p=0.001); T2: −4.57 ms (95% CI −7.43 to −1.70, p=0.002)). In contrast, associations with Dialysis status were attenuated (T1ρ: −3.02 ms (95% CI −7.45 to 1.40, p=0.18); FF: −0.71% (95% CI −7.67 to 6.25, p=0.84); T2: −0.89 ms (95% CI −5.07 to 3.29, p=0.68)).
1H MRS was used to further investigate differences in intramuscular fat and to quantify muscle metabolites (Figure 6). IMCL was numerically higher in the VL, soleus, and gastrocnemius and was overall significantly higher in CKD patients compared with controls (0.71% (95% CI 0.03 to 1.39, p=0.04). EMCL was numerically higher in CKD patients, but this difference was not statistically significant (0.47 (95% CI −0.04 to 0.99, p=0.07). Both TMA and creatinine concentrations were lower in skeletal muscle of CKD patients (2.68% (95% CI 0.18 to 5.18, p=0.04) and 1.54% (95% CI 0.37 to 2.71, p=0.01), respectively).
Figure 6. Skeletal muscle lipid content and metabolite concentrations measured by 1H-magnetic resonance spectroscopy.
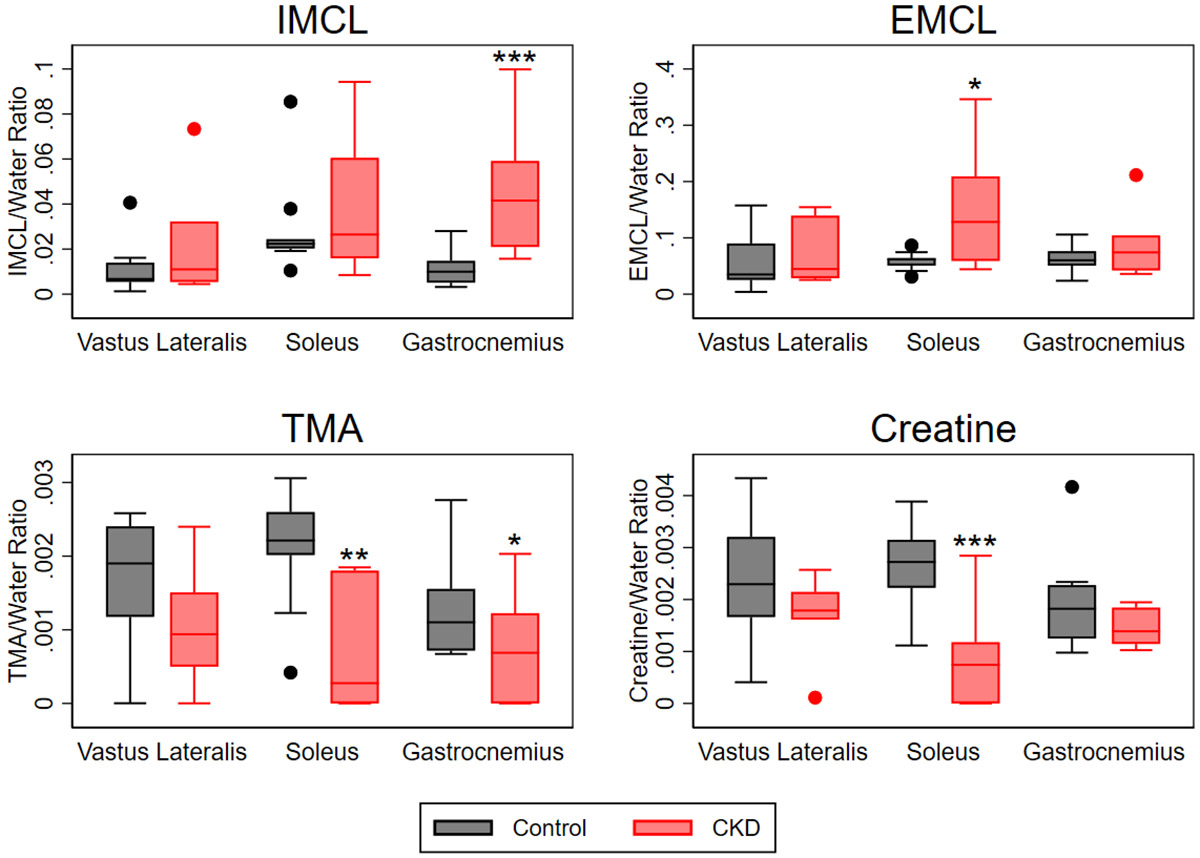
Mixed effects models including random intercepts were fit to account for clustering within an individual. Pairwise comparisons of CKD and control participants within muscle groups were performed using tests of contrast. Concentrations are presented referenced to the water peak. n=9 control, n=6 CKD. Abbreviations: IMCL, intramyocellular lipid content; EMCL, extramyocellular lipid content; TMA, trimethylamine. *p<0.05, **p<0.01, ***p<0.001.
DISCUSSION
In this pilot study of multiparametric qMRI, we identified elevations in T1ρ and T2 relaxation times and higher fat fraction in the skeletal muscle of patients with advanced non-dialysis dependent CKD. These changes were largely absent in a small group of patients receiving hemodialysis, in whom imaging parameters were similar to controls. Differences in T1ρ, T2, and fat fraction were highly correlated across the muscles we studied, suggesting that structural muscle pathology in CKD affects appendicular muscle broadly rather than being limited to specific muscle groups. 1H-MRS yielded deeper insight into the finding of elevated fat fraction in CKD patients by demonstrating significantly higher IMCL in skeletal muscle. Furthermore, 1H-MRS showed that concentrations of metabolites important to muscle function were reduced in CKD patients. Importantly, although physical function was poorer in the patients with CKD than in healthy volunteers, functional status was largely preserved. In summary, a multiparametric qMRI protocol shows promise for characterizing skeletal muscle pathology in patients with CKD prior to significant functional decline. Early identification of compromised skeletal muscle health could facilitate targeted exercise or pharmacologic interventions to mitigate muscle pathology prior to loss of muscle strength or performance. This approach may also yield new insights into changes in muscle function over time and following medical transitions, such as the initiation of dialysis.
Prior studies using MRI and 31P MRS found reduced muscle cross-sectional area and impaired bioenergetics in patients with CKD and ESKD (42-45). Our quantitative, multiparametric approach builds on this work. We found differences in a number of clinically relevant metrics that correlate with histological findings and physical function outcomes in other muscle disorders. For example, compared with control subjects, T1ρ relaxation times were prolonged in CKD patients. T1ρ employs an endogenous contrast method that is sensitive to interactions between extracellular matrix macromolecules, such as collagen and glycosaminoglycans, and protons of mobile water molecules (46, 47). Expansion of the extracellular matrix during fibrosis causes T1ρ times to lengthen: investigations of fibrosis in the heart, lung, and kidney reported elevated T1ρ times in each of these organs (48-56). Furthermore, in a swine model of myocardial infarction, assessment of the severity of fibrosis by T1ρ demonstrated excellent correlation with the gold standard late gadolinium enhancement MRI (52). In skeletal muscle, elevated T1ρ relaxation times correlate with expansion of the extracellular matrix and increased collagen content (9, 10, 57, 58); thus, T1ρ has been proposed as a non-invasive marker of fibrosis in skeletal muscle as well. Our prior work documented skeletal muscle fibrosis characterized by fibrillar collagen accumulation in patients with CKD, the severity of which correlated with eGFR reduction (8, 21). We also noted that fibrosis was dialysis-responsive, in that collagen content and other parameters improved after dialysis initiation (21). The T1ρ data presented here corroborate those findings and further support the distinction between muscle fibrosis and muscle atrophy suggested by our biopsy study: that in CKD, fibrosis occurs independently of atrophy, and that regulation of these processes is uncoupled following dialysis initiation, with regression of fibrosis despite worsening atrophy. Our results yield a further important insight: this fibrotic transformation appears to involve appendicular skeletal muscle diffusely. Thus, in addition to the benefit of being non-invasive, another advantage of qMRI over biopsy is the ability to assay a large volume of muscle and minimize sampling bias.
Another important finding was the elevation of fat fraction in CKD: IMCL in particular was higher based on 1H-MRS data. This aligns with the myosteatosis that has been observed in patients with CKD stage 3 through 5 using ultrasound (59, 60). In that cohort, as in studies of muscular dystrophy and human aging, higher intramuscular fat content was associated with poorer physical performance (3, 60, 61). In the setting of CKD, intramuscular fat infiltration has multiple potential etiologies: fatty replacement accompanying fibrosis, possibly mediated by an expanded pool of fibro-adipogenic progenitor cells (8, 62); insulin resistance due to uremia, obesity, and type 2 diabetes (63); and downstream effects of neuropathy and denervation (64). Fat fraction correlated with both T1ρ and T2 among participants with CKD, consistent with the hypothesis that intramuscular fat deposition in CKD is linked to extracellular matrix expansion and fibrosis. Similarly, prior studies in genetic and acquired muscle disorders have reported correlations of fat fraction with T2 values (15, 16, 65), with the strength of the correlation possibly being greatest among patients with the most severe disease burden (15). This intramuscular fat deposition may be a component of the sarcopenic obese phenotype that becomes increasingly prevalent with progressive CKD and is associated with an increased risk of mortality (66-68).
1H-MRS demonstrated lower concentrations of TMA and creatine in CKD muscle. Prior work suggests these findings could be clinically relevant. In patients with Duchenne muscular dystrophy, levels of these metabolites were lower in skeletal muscle compared with unaffected controls and correlated inversely with muscle function (19, 20). Molecules measured by the TMA and creatine peaks play key roles in muscle metabolism: the TMA peak captures carnitine and acetylcarnitine, which contain TMA moieties and can be distinguished at 7T but not 3T (69); the creatine peak captures both creatine and phosphocreatine (19). Thus, lower levels of TMA and creatine could indicate reduced muscle quality or impaired bioenergetics, which have been well documented in this patient population (44, 45). Future work is needed to investigate this hypothesis definitively; however, these findings suggest 1H-MRS holds promise as a non-invasive tool for assessing muscle health and function in patients with CKD.
While strong evidence suggests microstructural alterations in CKD muscle (5), we did not observe significant differences in DTI markers between CKD patients and controls. This unexpected finding may be explained by the numerous factors that can alter water diffusion in skeletal muscle. Beyond changes in the macromolecular structure of the extracellular matrix, restriction of water diffusion can be impacted by muscle fiber diameter and density and by sarcolemma permeability (70). In addition, muscle fibers are composed of a mesh-like myofibrillar network, and sarcomere branching rates vary by fiber type (71). This suggests that water diffusion might be less restricted along the longitudinal axis of the fiber than previously thought, with the impact on fractional anisotropy dependent on the specific fiber type distribution within a given measurement area (voxel).
In this study, we applied unilateral multiparametric qMRI to the thigh and calf muscles on a clinical 3T MRI scanner. We selected a 16-channel transmit-receive (T/R) knee coil instead of the commonly used multi-channel body coil. The knee coil offers not only superior SNR but also lower heat deposition and improved B1 uniformity with local transmission using circular polarization excitation. These advantages are particularly important for quantitative T1ρ and T2 mapping. Although a multi-channel body coil could have enabled more efficient bilateral muscle acquisition, the reduced B0 and B1 homogeneities would likely have compromised quantitative accuracy. To minimize the influence of muscle fat differences between study groups, active spectral selective fat suppression was applied during T2 mapping, T1ρ mapping, and diffusion-tensor imaging (ADC and FA). Fat fraction and T2* values were derived from a six-echo 3D gradient echo Dixon sequence (mDixon Quant) using iterative fitting of a multi-peak fat model to separate water and fat signals. This approach minimizes the impact of fat on the T2, T1ρ, ADC, FA, and T2* measurements. High-order B0 shimming was performed for all scans to minimize B0 inhomogeneity on quantitative measurements. Furthermore, a self-compensated T1ρ preparation module was implemented to reduce the influence of B0 and B1 inhomogeneity on T1ρ measurements (72, 73). Future work will focus on correcting the residual B0 and B1 inhomogeneities in T1ρ and T2 measurements to further improve quantification accuracy. Additionally, the vendor MRS sequence was used for metabolite quantification, but corrections for T1 and T2 relaxation times of metabolites and water were not performed, as these were not integrated into the sequence. Such corrections typically require separate scans to measure T1 and T2 values (74). While previous studies have applied T1 and T2 corrections using literature values (75, 76), reference values for metabolites in the thigh and calf muscles of CKD patients remain unavailable. Incorporating T1 and T2 corrections for each metabolite, as well as water T2, in the 1H MRS measurements in future studies will further enhance their accuracy and address this important limitation (77).
Our multiparametric qMRI approach yielded a comprehensive assessment of muscle structure and metabolic health within a clinically acceptable timeframe. However, several limitations warrant consideration. First, our T1ρ and T2 mapping sequence was limited by the finite number of TSL and TE samples (four for each). Additionally, a mono-exponential decay model was employed in the fitting algorithm, which may not be ideal for the multi-component nature of muscle tissue. Furthermore, the observed muscle T2 values appear elevated. More advanced imaging techniques or post-processing methods, such as applying an extended phase graph fitting approach, could potentially enhance quantitative accuracy by mitigating the effects of B0 and B1 field inhomogeneities (78). Second, the protocol included only static qMRI measurements, precluding assessment of exercise-induced changes in blood flow and muscle bioenergetics. Such dynamic data could potentially enhance the identification of CKD patients at risk for functional decline. We chose not to incorporate these measures in this pilot study due to time constraints, the need for specific operator expertise, and limitations in hardware availability. Third, assessment of muscle CSA was limited by lack of anatomic matching of the slice selected for analysis and recognition that the maximal CSA for a particular muscle group was not necessarily captured. Fourth, the small sample size limited our ability to investigate the independent contributions of comorbidities. While this limits inferences regarding CKD-specific effects, it does not diminish the potential utility of qMRI metrics as biomarkers for physical function impairment. Future studies should incorporate additional metrics, including exercise response measurements, to develop a multiparametric protocol that maximizes prognostic ability while maintaining feasibility for clinical and research settings. Furthermore, larger studies are needed to delineate changes in qMRI metrics that are specific to CKD versus the contributions of related comorbidities such as diabetes, and to explore the influence of sex on the association of CKD with qMRI parameters. Fifth, the fat suppression technique employed did not suppress the olefinic lipid resonance, although this would have only a very minor effect on the results.
In conclusion, multiparametric qMRI imaging of skeletal muscle identified differences among CKD patients in metrics associated with fibrosis, fat infiltration, and metabolic dysregulation. Future work is needed to determine the extent to which these measures predict impairment of physical performance in this patient population.
Supplementary Material
Supplemental File. doi: 10.6084/m9.figshare.28856993
Supplemental Figure S2. doi: 10.6084/m9.figshare.28856993
ACKNOWLEDGMENTS
We thank the Einstein MRRC Shared Instrument Core for their support in acquiring the MRI data.
FUNDING
This research was supported by K23DK099438, R03DK116023, and R01AR077042 from the National Institutes of Health (NIH) and by the National Center for Advancing Translational Sciences (NCATS), NIH, through CTSA award numbers UL1TR002556 and UM1TR004400. The content is solely the responsibility of the authors and does not necessarily represent the official views of the NIH.
Preserving Physical Function in CKD (PPF-CKD) Investigators
Albert Einstein College of Medicine/Montefiore Medical Center
Matthew K. Abramowitz, MD, MS
Maureen E. Brogan, MD
Mary J. Dominguez, MD
Sally Duran, BA
Molly C. Fisher, DO, MS
Ladan Golestaneh, MD, MS
Rimon Golovey, MD
Sonali Gupta, MBBS
Tanya S. Johns, MD, MHS
Michele H. Mokrzycki, MD, MS
Tina M. Neade, MD
Joel J. Neugarten, MD
William Paredes, BS
Qi Peng, PhD
Amanda C. Raff, MD
Stuart O. Rosenberg, MD
Gracy Sebastian, NP
Deep Sharma, MBBS
Milagros D. Yunes, MD
University of Kentucky
Christopher S. Fry, PhD
Alexander R. Keeble
Allison M. Owen, PhD
Lehman College, City University of New York
Brad J. Schoenfeld, PhD
University of Maryland School of Medicine
Christopher W. Ward, PhD
University of California, Berkeley
Moriel Vandsburger, PhD
Footnotes
DISCLOSURES
MKA has consulted for Renibus Therapeutics. None of the other authors has any financial conflicts to disclose.
DATA AVAILABILITY
Source data for this study are not publicly available due to privacy restrictions related to concerns over maintenance of participant confidentiality given the limited sample size. The source data are available to verified researchers upon request by contacting the corresponding author.
REFERENCES
- 1.Avin KG, and Moorthi RN. Bone is Not Alone: the Effects of Skeletal Muscle Dysfunction in Chronic Kidney Disease. Current osteoporosis reports 13: 173–179, 2015. [DOI] [PMC free article] [PubMed] [Google Scholar]
- 2.Sabatino A, Sola KH, Brismar TB, Lindholm B, Stenvinkel P, and Avesani CM. Making the invisible visible: imaging techniques for assessing muscle mass and muscle quality in chronic kidney disease. Clin Kidney J 17: sfae028, 2024. [DOI] [PMC free article] [PubMed] [Google Scholar]
- 3.Leung DG. Advancements in magnetic resonance imaging-based biomarkers for muscular dystrophy. Muscle & nerve 60: 347–360, 2019. [DOI] [PMC free article] [PubMed] [Google Scholar]
- 4.Diesel W, Emms M, Knight BK, Noakes TD, Swanepoel CR, van Zyl Smit R, Kaschula RO, and Sinclair-Smith CC. Morphologic features of the myopathy associated with chronic renal failure. Am J Kidney Dis 22: 677–684, 1993. [DOI] [PubMed] [Google Scholar]
- 5.Sawant A, Garland SJ, House AA, and Overend TJ. Morphological, electrophysiological, and metabolic characteristics of skeletal muscle in people with end-stage renal disease: a critical review. Physiother Can 63: 355–376, 2011. [DOI] [PMC free article] [PubMed] [Google Scholar]
- 6.Shah AJ, Sahgal V, Quintanilla AP, Subramani V, Singh H, and Hughes R. Muscle in chronic uremia--a histochemical and morphometric study of human quadriceps muscle biopsies. Clinical neuropathology 2: 83–89, 1983. [PubMed] [Google Scholar]
- 7.Savazzi G, Govoni E, Bragaglia M, Cambi V, and Migone L. Ultrastructural findings of uraemic muscular damage: functional implications. Proceedings of the European Dialysis and Transplant Association European Dialysis and Transplant Association 19: 258–264, 1983. [PubMed] [Google Scholar]
- 8.Abramowitz MK, Paredes W, Zhang K, Brightwell CR, Newsom JN, Kwon H-J, Custodio M, Buttar RS, Farooq H, Zaidi B, Pai R, Pessin JE, Hawkins M, and Fry CS. Skeletal muscle fibrosis is associated with decreased muscle inflammation and weakness in patients with chronic kidney disease. American Journal of Physiology-Renal Physiology 315: F1658–F1669, 2018. [DOI] [PMC free article] [PubMed] [Google Scholar]
- 9.Menon RG, Raghavan P, and Regatte RR. Quantifying muscle glycosaminoglycan levels in patients with post-stroke muscle stiffness using T1rho MRI. Sci Rep 9: 14513, 2019. [DOI] [PMC free article] [PubMed] [Google Scholar]
- 10.Noehren B, Hardy PA, Andersen A, Brightwell CR, Fry JL, Vandsburger MH, Thompson KL, and Fry CS. T1ρ imaging as a non-invasive assessment of collagen remodelling and organization in human skeletal muscle after ligamentous injury. The Journal of physiology n/a: 2021. [DOI] [PMC free article] [PubMed] [Google Scholar]
- 11.Bonati U, Hafner P, Schädelin S, Schmid M, Naduvilekoot Devasia A, Schroeder J, Zuesli S, Pohlman U, Neuhaus C, Klein A, Sinnreich M, Haas T, Gloor M, Bieri O, Fischmann A, and Fischer D. Quantitative muscle MRI: A powerful surrogate outcome measure in Duchenne muscular dystrophy. Neuromuscul Disord 25: 679–685, 2015. [DOI] [PubMed] [Google Scholar]
- 12.Kinali M, Arechavala-Gomeza V, Cirak S, Glover A, Guglieri M, Feng L, Hollingsworth KG, Hunt D, Jungbluth H, Roper HP, Quinlivan RM, Gosalakkal JA, Jayawant S, Nadeau A, Hughes-Carre L, Manzur AY, Mercuri E, Morgan JE, Straub V, Bushby K, Sewry C, Rutherford M, and Muntoni F. Muscle histology vs MRI in Duchenne muscular dystrophy. Neurology 76: 346–353, 2011. [DOI] [PMC free article] [PubMed] [Google Scholar]
- 13.Ricotti V, Evans MR, Sinclair CD, Butler JW, Ridout DA, Hogrel JY, Emira A, Morrow JM, Reilly MM, Hanna MG, Janiczek RL, Matthews PM, Yousry TA, Muntoni F, and Thornton JS. Upper Limb Evaluation in Duchenne Muscular Dystrophy: Fat-Water Quantification by MRI, Muscle Force and Function Define Endpoints for Clinical Trials. PLoS One 11: e0162542, 2016. [DOI] [PMC free article] [PubMed] [Google Scholar]
- 14.Andersen G, Dahlqvist JR, Vissing CR, Heje K, Thomsen C, and Vissing J. MRI as outcome measure in facioscapulohumeral muscular dystrophy: 1-year follow-up of 45 patients. Journal of neurology 264: 438–447, 2017. [DOI] [PubMed] [Google Scholar]
- 15.Morrow JM, Sinclair CD, Fischmann A, Machado PM, Reilly MM, Yousry TA, Thornton JS, and Hanna MG. MRI biomarker assessment of neuromuscular disease progression: a prospective observational cohort study. The Lancet Neurology 15: 65–77, 2016. [DOI] [PMC free article] [PubMed] [Google Scholar]
- 16.Barnard AM, Willcocks RJ, Finanger EL, Daniels MJ, Triplett WT, Rooney WD, Lott DJ, Forbes SC, Wang DJ, Senesac CR, Harrington AT, Finkel RS, Russman BS, Byrne BJ, Tennekoon GI, Walter GA, Sweeney HL, and Vandenborne K. Skeletal muscle magnetic resonance biomarkers correlate with function and sentinel events in Duchenne muscular dystrophy. PLoS One 13: e0194283, 2018. [DOI] [PMC free article] [PubMed] [Google Scholar]
- 17.Torriani M, Townsend E, Thomas BJ, Bredella MA, Ghomi RH, and Tseng BS. Lower leg muscle involvement in Duchenne muscular dystrophy: an MR imaging and spectroscopy study. Skeletal Radiol 41: 437–445, 2012. [DOI] [PMC free article] [PubMed] [Google Scholar]
- 18.Willcocks RJ, Rooney WD, Triplett WT, Forbes SC, Lott DJ, Senesac CR, Daniels MJ, Wang DJ, Harrington AT, Tennekoon GI, Russman BS, Finanger EL, Byrne BJ, Finkel RS, Walter GA, Sweeney HL, and Vandenborne K. Multicenter prospective longitudinal study of magnetic resonance biomarkers in a large duchenne muscular dystrophy cohort. Ann Neurol 79: 535–547, 2016. [DOI] [PMC free article] [PubMed] [Google Scholar]
- 19.Hsieh T-J, Jaw T-S, Chuang H-Y, Jong Y-J, Liu G-C, and Li C-W. Muscle Metabolism in Duchenne Muscular Dystrophy Assessed by In Vivo Proton Magnetic Resonance Spectroscopy. Journal of computer assisted tomography 33: 150–154, 2009. [DOI] [PubMed] [Google Scholar]
- 20.Leung DG, Wang X, Barker PB, Carrino JA, and Wagner KR. Multivoxel proton magnetic resonance spectroscopy in facioscapulohumeral muscular dystrophy. Muscle & nerve 57: 958–963, 2018. [DOI] [PMC free article] [PubMed] [Google Scholar]
- 21.Brightwell CR, Kulkarni AS, Paredes W, Zhang K, Perkins JB, Gatlin KJ, Custodio M, Farooq H, Zaidi B, Pai R, Buttar RS, Tang Y, Melamed ML, Hostetter TH, Pessin JE, Hawkins M, Fry CS, and Abramowitz MK. Muscle fibrosis and maladaptation occur progressively in CKD and are rescued by dialysis. JCI insight 6: 2021. [DOI] [PMC free article] [PubMed] [Google Scholar]
- 22.Kimura A, Paredes W, Pai R, Farooq H, Buttar RS, Custodio M, Munugoti S, Kotwani S, Randhawa LS, Dalezman S, Elters AC, Nam K, Ibarra JS, Venkataraman S, and Abramowitz MK. Step length and fall risk in adults with chronic kidney disease: a pilot study. BMC nephrology 23: 74, 2022. [DOI] [PMC free article] [PubMed] [Google Scholar]
- 23.Johansen KL, Chertow GM, Ng AV, Mulligan K, Carey S, Schoenfeld PY, and Kent-Braun JA. Physical activity levels in patients on hemodialysis and healthy sedentary controls. Kidney Int 57: 2564–2570, 2000. [DOI] [PubMed] [Google Scholar]
- 24.Martins C, Truby H, and Morgan LM. Short-term appetite control in response to a 6-week exercise programme in sedentary volunteers. The British journal of nutrition 98: 834–842, 2007. [DOI] [PubMed] [Google Scholar]
- 25.Rose M, Bjorner JB, Gandek B, Bruce B, Fries JF, and Ware JE Jr. The PROMIS Physical Function item bank was calibrated to a standardized metric and shown to improve measurement efficiency. Journal of clinical epidemiology 67: 516–526, 2014. [DOI] [PMC free article] [PubMed] [Google Scholar]
- 26.Schalet BD, Kaat A, Vrahas M, Buckenmaier CT III, Barnhill R, and Gershon RC. Extending the ceiling of an item bank: development of above-average physical function items for PROMIS. In: Quality of Life Research SPRINGER; VAN GODEWIJCKSTRAAT 30, 3311 GZ DORDRECHT, NETHERLANDS, 2016, p. 109–109. [Google Scholar]
- 27.Lai J-S, Cella D, Choi S, Junghaenel DU, Christodoulou C, Gershon R, and Stone A. How item banks and their application can influence measurement practice in rehabilitation medicine: a PROMIS fatigue item bank example. Archives of physical medicine and rehabilitation 92: S20–S27, 2011. [DOI] [PMC free article] [PubMed] [Google Scholar]
- 28.Reuben DB, Magasi S, McCreath HE, Bohannon RW, Wang YC, Bubela DJ, Rymer WZ, Beaumont J, Rine RM, Lai JS, and Gershon RC. Motor assessment using the NIH Toolbox. Neurology 80: S65–75, 2013. [DOI] [PMC free article] [PubMed] [Google Scholar]
- 29.Bohannon RW, Bubela D, Magasi S, McCreath H, Wang YC, Reuben D, Rymer WZ, and Gershon R. Comparison of walking performance over the first 2 minutes and the full 6 minutes of the Six-Minute Walk Test. BMC research notes 7: 269, 2014. [DOI] [PMC free article] [PubMed] [Google Scholar]
- 30.Guralnik JM, Simonsick EM, Ferrucci L, Glynn RJ, Berkman LF, Blazer DG, Scherr PA, and Wallace RB. A short physical performance battery assessing lower extremity function: association with self-reported disability and prediction of mortality and nursing home admission. Journal of gerontology 49: M85–94, 1994. [DOI] [PubMed] [Google Scholar]
- 31.Levey AS, Stevens LA, Schmid CH, Zhang YL, Castro AF 3rd, Feldman HI, Kusek JW, Eggers P, Van Lente F, Greene T, and Coresh J. A new equation to estimate glomerular filtration rate. Ann Intern Med 150: 604–612, 2009. [DOI] [PMC free article] [PubMed] [Google Scholar]
- 32.Harris PA, Taylor R, Thielke R, Payne J, Gonzalez N, and Conde JG. Research electronic data capture (REDCap)--a metadata-driven methodology and workflow process for providing translational research informatics support. J Biomed Inform 42: 377–381, 2009. [DOI] [PMC free article] [PubMed] [Google Scholar]
- 33.Sun H, Xu MT, Wang XQ, Wang MH, Wang BH, Wang FZ, and Pan SN. Comparison Thigh Skeletal Muscles between Snowboarding Halfpipe Athletes and Healthy Volunteers Using Quantitative Multi-Parameter Magnetic Resonance Imaging at Rest. Chin Med J (Engl) 131: 1045–1050, 2018. [DOI] [PMC free article] [PubMed] [Google Scholar]
- 34.Zhang Y, Zhou Z, Wang C, Cheng X, Wang L, Duanmu Y, Zhang C, Veronese N, and Guglielmi G. Reliability of measuring the fat content of the lumbar vertebral marrow and paraspinal muscles using MRI mDIXON-Quant sequence. Diagnostic and interventional radiology (Ankara, Turkey) 24: 302–307, 2018. [DOI] [PMC free article] [PubMed] [Google Scholar]
- 35.Li X, Han ET, Busse RF, and Majumdar S. In vivo T(1rho) mapping in cartilage using 3D magnetization-prepared angle-modulated partitioned k-space spoiled gradient echo snapshots (3D MAPSS). Magn Reson Med 59: 298–307, 2008. [DOI] [PMC free article] [PubMed] [Google Scholar]
- 36.Johnson CP, Thedens DR, Kruger SJ, and Magnotta VA. Three-dimensional GRE T1ρ mapping of the brain using tailored variable flip-angle scheduling. Magnetic resonance in medicine 84: 1235–1249, 2020. [DOI] [PMC free article] [PubMed] [Google Scholar]
- 37.Kim J, Mamoto K, Lartey R, Xu K, Nakamura K, Shin W, Winalski CS, Obuchowski N, Tanaka M, and Bahroos E. Multi-vendor multi-site T1ρ and T2 quantification of knee cartilage. Osteoarthritis and cartilage 28: 1539–1550, 2020. [DOI] [PMC free article] [PubMed] [Google Scholar]
- 38.Lartey R, Nanavati A, Kim J, Li M, Xu K, Nakamura K, Shin W, Winalski CS, Obuchowski N, and Bahroos E. Reproducibility of T1ρ and T2 quantification in a multi-vendor multi-site study. Osteoarthritis and cartilage 31: 249–257, 2023. [DOI] [PMC free article] [PubMed] [Google Scholar]
- 39.Zibetti MV, Menon R, De Moura HL, Keerthivasan MB, and Regatte RR. Optimized MR pulse sequence for high-resolution brain 3D-T1ρ mapping with weighted spin-lock acquisitions. Magnetic Resonance in Medicine 93: 1458–1470, 2025. [DOI] [PMC free article] [PubMed] [Google Scholar]
- 40.Damon BM. Effects of image noise in muscle diffusion tensor (DT)-MRI assessed using numerical simulations. Magnetic Resonance in Medicine: An Official Journal of the International Society for Magnetic Resonance in Medicine 60: 934–944, 2008. [DOI] [PMC free article] [PubMed] [Google Scholar]
- 41.Froeling M, Nederveen AJ, Nicolay K, and Strijkers GJ. DTI of human skeletal muscle: the effects of diffusion encoding parameters, signal-to-noise ratio and T2 on tensor indices and fiber tracts. NMR in biomedicine 26: 1339–1352, 2013. [DOI] [PubMed] [Google Scholar]
- 42.Johansen KL, Shubert T, Doyle J, Soher B, Sakkas GK, and Kent-Braun JA. Muscle atrophy in patients receiving hemodialysis: effects on muscle strength, muscle quality, and physical function. Kidney Int 63: 291–297, 2003. [DOI] [PubMed] [Google Scholar]
- 43.John SG, Sigrist MK, Taal MW, and McIntyre CW. Natural history of skeletal muscle mass changes in chronic kidney disease stage 4 and 5 patients: an observational study. PLoS One 8: e65372, 2013. [DOI] [PMC free article] [PubMed] [Google Scholar]
- 44.Gamboa JL, Roshanravan B, Towse T, Keller CA, Falck AM, Yu C, Frontera WR, Brown NJ, and Ikizler TA. Skeletal Muscle Mitochondrial Dysfunction Is Present in Patients with CKD before Initiation of Maintenance Hemodialysis. Clin J Am Soc Nephrol 15: 926–936, 2020. [DOI] [PMC free article] [PubMed] [Google Scholar]
- 45.Kestenbaum B, Gamboa J, Liu S, Ali AS, Shankland E, Jue T, Giulivi C, Smith LR, Himmelfarb J, de Boer IH, Conley K, and Roshanravan B. Impaired skeletal muscle mitochondrial bioenergetics and physical performance in chronic kidney disease. JCI insight 5: 2020. [DOI] [PMC free article] [PubMed] [Google Scholar]
- 46.Brown RD 3rd, and Koenig SH. 1/T1 rho and low-field 1/T1 of tissue water protons arise from magnetization transfer to macromolecular solid-state broadened lines. Magn Reson Med 28: 145–152, 1992. [DOI] [PubMed] [Google Scholar]
- 47.Sepponen RE, Pohjonen JA, Sipponen JT, and Tanttu JI. A method for T1 rho imaging. Journal of computer assisted tomography 9: 1007–1011, 1985. [DOI] [PubMed] [Google Scholar]
- 48.Hectors SJ, Bane O, Kennedy P, El Salem F, Menon M, Segall M, Khaim R, Delaney V, Lewis S, and Taouli B. T1rho mapping for assessment of renal allograft fibrosis. Journal of magnetic resonance imaging : JMRI 50: 1085–1091, 2019. [DOI] [PubMed] [Google Scholar]
- 49.Hu G, Liang W, Wu M, Lai C, Mei Y, Li Y, Xu J, Luo L, and Quan X. Comparison of T1 Mapping and T1rho Values with Conventional Diffusion-weighted Imaging to Assess Fibrosis in a Rat Model of Unilateral Ureteral Obstruction. Acad Radiol 26: 22–29, 2019. [DOI] [PubMed] [Google Scholar]
- 50.Li RK, Ren XP, Yan FH, Qiang JW, Lin HM, Tao W, Zhao HF, and Chen WB. Liver fibrosis detection and staging: a comparative study of T1rho MR imaging and 2D real-time shear-wave elastography. Abdominal radiology (New York) 43: 1713–1722, 2018. [DOI] [PMC free article] [PubMed] [Google Scholar]
- 51.Stief JD, Haase M, Ludemann L, Theilig D, Schmelzle M, Hamm B, Denecke T, and Geisel D. Combined morphological and functional liver MRI using spin-lattice relaxation in the rotating frame (T1rho) in conjunction with Gadoxetic Acid-enhanced MRI. Sci Rep 9: 2083, 2019. [DOI] [PMC free article] [PubMed] [Google Scholar]
- 52.Stoffers RH, Madden M, Shahid M, Contijoch F, Solomon J, Pilla JJ, Gorman JH 3rd, Gorman RC, and Witschey WRT. Assessment of myocardial injury after reperfused infarction by T1rho cardiovascular magnetic resonance. Journal of cardiovascular magnetic resonance : official journal of the Society for Cardiovascular Magnetic Resonance 19: 17, 2017. [DOI] [PMC free article] [PubMed] [Google Scholar]
- 53.van Oorschot JW, Guclu F, de Jong S, Chamuleau SA, Luijten PR, Leiner T, and Zwanenburg JJ. Endogenous assessment of diffuse myocardial fibrosis in patients with T1rho -mapping. Journal of magnetic resonance imaging : JMRI 45: 132–138, 2017. [DOI] [PubMed] [Google Scholar]
- 54.Xie S, Li Q, Cheng Y, Zhang Y, Zhuo Z, Zhao G, and Shen W. Impact of Liver Fibrosis and Fatty Liver on T1rho Measurements: A Prospective Study. Korean journal of radiology 18: 898–905, 2017. [DOI] [PMC free article] [PubMed] [Google Scholar]
- 55.Zhang H, Yang Q, Yu T, Chen X, Huang J, Tan C, Liang B, and Guo H. Comparison of T2, T1rho, and diffusion metrics in assessment of liver fibrosis in rats. Journal of magnetic resonance imaging : JMRI 45: 741–750, 2017. [DOI] [PubMed] [Google Scholar]
- 56.Zhang Y, Zeng W, Chen W, Chen Y, Zhu T, Sun J, Liang Z, Cheng W, Wang L, Wu B, Gong L, Ferrari VA, Zheng J, and Gao F. MR extracellular volume mapping and non-contrast T1rho mapping allow early detection of myocardial fibrosis in diabetic monkeys. European radiology 29: 3006–3016, 2019. [DOI] [PMC free article] [PubMed] [Google Scholar]
- 57.Peng XG, Wang Y, Zhang S, Bai Y, Mao H, Teng GJ, and Ju S. Noninvasive assessment of age, gender, and exercise effects on skeletal muscle: Initial experience with T1 rho MRI of calf muscle. Journal of magnetic resonance imaging : JMRI 2016. [DOI] [PubMed] [Google Scholar]
- 58.Sharafi A, Chang G, and Regatte RR. Bi-component T1rho and T2 Relaxation Mapping of Skeletal Muscle In-Vivo. Sci Rep 7: 14115, 2017. [DOI] [PMC free article] [PubMed] [Google Scholar]
- 59.Wilkinson TJ, Ashman J, Baker LA, Watson EL, and Smith AC. Quantitative Muscle Ultrasonography Using 2D Textural Analysis: A Novel Approach to Assess Skeletal Muscle Structure and Quality in Chronic Kidney Disease. Ultrason Imaging 1617346211009788, 2021. [DOI] [PMC free article] [PubMed] [Google Scholar]
- 60.Wilkinson TJ, Gould DW, Nixon DGD, Watson EL, and Smith AC. Quality over quantity? Association of skeletal muscle myosteatosis and myofibrosis on physical function in chronic kidney disease. Nephrol Dial Transplant 34: 1344–1353, 2018. [DOI] [PubMed] [Google Scholar]
- 61.Goodpaster BH, Bergman BC, Brennan AM, and Sparks LM. Intermuscular adipose tissue in metabolic disease. Nature Reviews Endocrinology 19: 285–298, 2023. [DOI] [PubMed] [Google Scholar]
- 62.Dong J, Dong Y, Chen Z, Mitch WE, and Zhang L. The pathway to muscle fibrosis depends on myostatin stimulating the differentiation of fibro/adipogenic progenitor cells in chronic kidney disease. Kidney Int 91: 119–128, 2017. [DOI] [PMC free article] [PubMed] [Google Scholar]
- 63.DeFronzo RA, Alvestrand A, Smith D, Hendler R, Hendler E, and Wahren J. Insulin resistance in uremia. J Clin Invest 67: 563–568, 1981. [DOI] [PMC free article] [PubMed] [Google Scholar]
- 64.Moorthi RN, Doshi S, Fried LF, Moe SM, Sarnak MJ, Satterfield S, Schwartz AV, Shlipak M, Lange-Maia BS, Harris TB, Newman AB, and Strotmeyer ES. Chronic kidney disease and peripheral nerve function in the Health, Aging and Body Composition Study. Nephrol Dial Transplant 2018. [DOI] [PMC free article] [PubMed] [Google Scholar]
- 65.Forsting J, Rohm M, Froeling M, Güttsches AK, Südkamp N, Roos A, Vorgerd M, Schlaffke L, and Rehmann R. Quantitative muscle MRI captures early muscle degeneration in calpainopathy. Sci Rep 12: 19676, 2022. [DOI] [PMC free article] [PubMed] [Google Scholar]
- 66.Sharma D, Hawkins M, and Abramowitz MK. Association of sarcopenia with eGFR and misclassification of obesity in adults with CKD in the United States. Clin J Am Soc Nephrol 9: 2079–2088, 2014. [DOI] [PMC free article] [PubMed] [Google Scholar]
- 67.Avesani CM, de Abreu AM, Ribeiro HS, Brismar TB, Stenvinkel P, Sabatino A, and Lindholm B. Muscle fat infiltration in chronic kidney disease: a marker related to muscle quality, muscle strength and sarcopenia. J Nephrol 36: 895–910, 2023. [DOI] [PMC free article] [PubMed] [Google Scholar]
- 68.Honda H, Qureshi AR, Axelsson J, Heimburger O, Suliman ME, Barany P, Stenvinkel P, and Lindholm B. Obese sarcopenia in patients with end-stage renal disease is associated with inflammation and increased mortality. Am J Clin Nutr 86: 633–638, 2007. [DOI] [PubMed] [Google Scholar]
- 69.Ren J, Lakoski S, Haller RG, Sherry AD, and Malloy CR. Dynamic monitoring of carnitine and acetylcarnitine in the trimethylamine signal after exercise in human skeletal muscle by 7T 1H-MRS. Magnetic Resonance in Medicine 69: 7–17, 2013. [DOI] [PMC free article] [PubMed] [Google Scholar]
- 70.Figley CR, Uddin MN, Wong K, Kornelsen J, Puig J, and Figley TD. Potential Pitfalls of Using Fractional Anisotropy, Axial Diffusivity, and Radial Diffusivity as Biomarkers of Cerebral White Matter Microstructure. Frontiers in Neuroscience 15: 2022. [DOI] [PMC free article] [PubMed] [Google Scholar]
- 71.Willingham TB, Kim Y, Lindberg E, Bleck CKE, and Glancy B. The unified myofibrillar matrix for force generation in muscle. Nature communications 11: 3722, 2020. [DOI] [PMC free article] [PubMed] [Google Scholar]
- 72.Peng Q, Wu C, Kim J, and Li X. Efficient phase-cycling strategy for high-resolution 3D gradient-echo quantitative parameter mapping. NMR in biomedicine 35: e4700, 2022. [DOI] [PMC free article] [PubMed] [Google Scholar]
- 73.Jogi SP, Peng Q, Jafari R, Otazo R, and Wu C. Novel spin-lock time sampling strategies for improved reproducibility in quantitative T1ρ mapping. NMR in biomedicine 37: e5244, 2024. [DOI] [PMC free article] [PubMed] [Google Scholar]
- 74.Fayad LM, Salibi N, Wang X, Machado AJ, Jacobs MA, Bluemke DA, and Barker PB. Quantification of muscle choline concentrations by proton MR spectroscopy at 3 T: technical feasibility. AJR Am J Roentgenol 194: W73–79, 2010. [DOI] [PMC free article] [PubMed] [Google Scholar]
- 75.Klepochová R, Valkovič L, Hochwartner T, Triska C, Bachl N, Tschan H, Trattnig S, Krebs M, and Krššák M. Differences in Muscle Metabolism Between Triathletes and Normally Active Volunteers Investigated Using Multinuclear Magnetic Resonance Spectroscopy at 7T. Front Physiol 9: 300, 2018. [DOI] [PMC free article] [PubMed] [Google Scholar]
- 76.Sourdon J, Roussel T, Costes C, Viout P, Guye M, Ranjeva JP, Bernard M, Kober F, and Rapacchi S. Comparison of single-voxel (1)H-cardiovascular magnetic resonance spectroscopy techniques for in vivo measurement of myocardial creatine and triglycerides at 3T. Journal of cardiovascular magnetic resonance : official journal of the Society for Cardiovascular Magnetic Resonance 23: 53, 2021. [DOI] [PMC free article] [PubMed] [Google Scholar]
- 77.Krššák M, Lindeboom L, Schrauwen-Hinderling V, Szczepaniak LS, Derave W, Lundbom J, Befroy D, Schick F, Machann J, Kreis R, and Boesch C. Proton magnetic resonance spectroscopy in skeletal muscle: Experts' consensus recommendations. NMR in biomedicine 34: e4266, 2021. [DOI] [PMC free article] [PubMed] [Google Scholar]
- 78.Marty B, Baudin PY, Reyngoudt H, Azzabou N, Araujo EC, Carlier PG, and de Sousa PL. Simultaneous muscle water T2 and fat fraction mapping using transverse relaxometry with stimulated echo compensation. NMR in biomedicine 29: 431–443, 2016. [DOI] [PubMed] [Google Scholar]
Associated Data
This section collects any data citations, data availability statements, or supplementary materials included in this article.
Data Availability Statement
Source data for this study are not publicly available due to privacy restrictions related to concerns over maintenance of participant confidentiality given the limited sample size. The source data are available to verified researchers upon request by contacting the corresponding author.