

Abstract
Background
The choice of nuclear interaction models in Monte Carlo simulations affects the dose calculation accuracy for light ion beam therapy.
Purpose
This study aimed to evaluate the dose calculation accuracy and simulation time of three GATE‐RTiON/geant4 physics lists for therapeutic carbon ion beams, assessing their suitability for independent dose calculation in patient‐specific quality assurance (PSQA).
Methods
The normalized beam models for physics lists QGSP_BIC_HP_EMZ, QGSP_INCLXX_HP_EMZ, and Shielding_EMZ were validated against measurements regarding the accuracy of range, spot size and reference dose. Normalized transversal dose profiles () and field size factor (FSF) were compared with measurements. The accuracy of simulated target dose in 103 fields (various energies, field sizes, depths, and dose gradient complexity) of energy‐modulated scanned beams was evaluated at 3181 positions. The median of global dose difference was calculated at different depth ranges.
Results
The three physics lists with validated beam models showed similar accuracy in and FSF in the Bragg peak region and proximal depths, while QGSP_INCLXX_HP agreed most closely for in the fragmentation tail. Accounting for ‐related uncertainty, remained within ±1.1% for QGSP_INCLXX_HP, while exhibiting an overall increasing trend with depth for QGSP_BIC_HP (up to 2.3%) and a decreasing trend for Shielding (down to −4.1%), respectively. By tuning the number‐of‐primaries/monitor unit conversion () as a function of energy, of QGSP_BIC_HP was reduced to within ±1.3%, at the cost of reduced accuracy in the simulated reference dose. The simulation time of Shielding was 1.8 times that of QGSP_BIC_HP and 1.5 times that of QGSP_INCLXX_HP.
Conclusions
QGSP_INCLXX_HP demonstrated high dosimetric accuracy in the target region of energy‐modulated fields. QGSP_BIC_HP and Shielding showed physics model‐related inaccuracies in simulated target dose. Additional tuning improved their target dose calculation accuracy with a trade‐off of reference dose accuracy. The computationally efficient QGSP_INCLXX_HP and QGSP_BIC_HP are viable candidates for dose calculation applications of carbon ion beam therapy, such as in silico PSQA.
Keywords: carbon ion radiotherapy, dosimetric accuracy, GATE‐RTiON, Geant4
1. INTRODUCTION
Carbon ion beams with energies of about 100–430 MeV/u are in use worldwide for light ion beam therapy (LIBT). For scanning beam delivery, a pencil beam consists of primary carbon ions with narrow momentum and angular spreads. As they transverse matter, they deposit energy and generate secondary particles through electromagnetic (EM) and hadronic/nuclear interactions. The probability per unit path length of primary and secondary particles interacting with matter is quantified by the macroscopic cross section (XS), which varies depending on the energy of the particle and the material it traverses. Pencil beams are magnetically deflected to scan the tumor volume laterally, while the axial coverage is achieved by selecting energy layers. A tumor with diameter of 12 cm typically requires the superposition of approximately pencil beams to cover. Therefore, accurately modeling the dose deposition of each beam is essential for predicting the dose distribution in both the tumor and the surrounding healthy tissues, and for ensuring precise patient treatment.
A pencil beam can be divided into core, halo, aura, and spray regions, as characterized by Gottschalk et al.
1
in their study of proton pencil beams. The core represents the central, high‐dose region, dominated by primary ions which only underwent small‐angle EM scattering. Surrounding the core is the halo, a low‐dose region caused by large‐angle single scatters of primaries and light secondaries. The aura consists of neutral secondaries (, neutron) which contribute negligibly to the high‐dose region. The spray is the unwanted low‐dose region caused by secondaries produced upstream the target. Currently, analytical pencil beam algorithm (PBA) and Monte Carlo (MC) particle transport simulation are common dose calculation algorithms for scanned pencil beams, while the former is used by all‡ commercial treatment planning systems (TPSs) for carbon ions. MC method offers highly accurate predictions by simulating a set of particle histories based on known micro‐ and macroscopic interaction XSs.
2
PBA provides a rapid estimate with mathematical parameterization of the dose profiles, but was reported to be less accurate for pencil beam therapy at the presence of density heterogeneity. In case of 30 oblique beam crossing range shifter and bone‐soft tissue interface, the dose of proton scanned beams predicted with PBA was lower than measurement by up to 19.2%, while the maximum dose underestimation was 9% using MC method, for measurement positions outside of the target.
3
A similar limitation is expected for carbon ions. Additionally, PBA is superseded by MC method in modeling the halo dose of carbon ion beam,
4
,
5
which affects the dosimetric accuracy for large field sizes or air gaps.
oblique beam crossing range shifter and bone‐soft tissue interface, the dose of proton scanned beams predicted with PBA was lower than measurement by up to 19.2%, while the maximum dose underestimation was 9% using MC method, for measurement positions outside of the target.
3
A similar limitation is expected for carbon ions. Additionally, PBA is superseded by MC method in modeling the halo dose of carbon ion beam,
4
,
5
which affects the dosimetric accuracy for large field sizes or air gaps.
Beside the calculation algorithm, another factor determining the accuracy of dose calculation is the beamline‐specific beam model. The beam can be modeled upstream the nozzle, which contains complex geometries of active monitoring chambers and passive beam modulation elements, such as ripple filters and range shifters. The range of the primary particles is modeled with energy modulation and momentum spread in order to match the shape of the depth dose profiles. The beam optics is modeled to account for the beam divergence. When using MC algorithm, the conversion of monitor unit (MU) of the beam delivery system/TPS to the number of primary particles simulated () needs to be calibrated. 6 Given the challenge of distinguishing the influence of inaccuracies in the dose calculation algorithm and inaccuracies in the beam model on the simulated dose, 7 , 8 , 9 ICRU Report 93 10 recommends verifying the beam model prior to the dose verification of patient‐specific treatment plans.
The modeling of EM processes and hadronic/nuclear interactions is available in various general MC codes, such as geant4, 11 , 12 , 13 FLUKA, 14 PHITS, 15 MCNPX, 16 SHIELD/SHIELD‐HIT. 17 In geant4, the EM physics constructors EMY and EMZ are recommended for medical physics applications according to their superior benchmarking results in water 18 and polyethylene. 19 However, the benchmarking results for the nuclear interaction models were not conclusive. In the context of particle therapy (energy below a few hundred MeV/u), intranuclear cascade and quantum molecular dynamics (QMD) models, coupled with proper pre‐equilibrium models and nuclear de‐excitation models, are used to describe nuclear interactions: 20 , 21 The Binary intranuclear cascade (BIC) model propagates particles via binary collisions with nucleons, ending when secondary energies drop below a threshold. The Bertini intranuclear cascade model follows a similar approach but determines collisions based on projectile trajectories intersecting nucleon interaction regions. The Liége intranuclear cascade (INCL++) model 22 treats nucleons in a static potential well with realistic Fermi motion and Pauli blocking, terminating when particles escape or no longer interact. The QMD model, unlike cascade models, tracks all particles simultaneously with quantum mechanical effects like the uncertainty principle and Pauli exclusion, at a higher computational cost. 23
The accuracy of nuclear interaction models in dose calculation depends on the geant4 version and its built‐in parameterized XSs, which vary across versions. The model implementations may also evolve, affecting simulated total and differential XSs, including inelastic scattering, 18 the double differential energy‐angle fragmentation, 18 , 24 , 25 the charge changing, 18 , 26 the fragment yield, 18 , 23 , 27 and the fluence energy spectrum of fragments. 18 , 23 , 26 For example, QMD model in version 9.3 26 reproduced the depth‐differential fragment yield (except for helium) better than experimental uncertainty, while in version 10.5 18 the yields of lithium, beryllium, and boron were underestimated by up to 40%. Comparing nuclear interaction models implemented in the same code version minimizes the discrepancies in XS classes or implementation details. However, these studies provide limited insight into the accuracy of absolute dosimetry, since XS evaluations predominantly use relative fluence profiles. 18 , 28
There is growing interest within the LIBT community to adopt MC‐based independent dose calculation (IDC) to verify the dose predicted by TPS. 29 , 30 Proton IDC has advanced the most, with the commercial software myQA iON, which uses MCsquare as its dose engine, applied clinically for the patient‐specific quality assurance (PSQA). 29 GATE 31 —a medical physics application of geant4—has been employed to commission the dose engines in clinical TPS 32 and to recalculate dose in patient plans of proton beam therapy. 33 , 34 A LIBT IDC application based on GATE‐RTiON 1.0 35 —a validated release of GATE for LIBT—benchmarked the physics lists QGSP_BIC_HP_EMZ and Shielding_EMZ on the proton and carbon ion beamlines at MedAustron Ion Therapy Center, respectively. 36 A carbon ion IDC utilizing PTSim/geant4 benchmarked the BIC model and EM constructor EMY on the carbon ion beamline at HIMAK, Osaka. 5 Another LIBT IDC employing Fast Dose Calculator, a fast MC programme using particle trajectory database simulated by geant4, was verified against measurements at the proton and carbon ion beamlines of SPHIC, Shanghai. 37 However, few studies compared the dose calculation accuracy of different nuclear interaction models based on the experimentally validated beam model of the same carbon ion beamline. The scarcity of comparison studies limits the understanding of nuclear interaction models in the context of LIBT. A previous study reported the need of applying an additional = 1.03 to a validated beam model to achieve acceptable dose calculation accuracy in fields (4 fields, 565 measurement points in total). 36
This study aimed to evaluate the impact of nuclear interaction modeling on dose calculation accuracy of therapeutic carbon ions, using extensive measurements of monoenergetic and energy‐modulated scanned beams at the synchrotron‐based LIBT facility at MedAustron Ion Therapy Center. Beam models with normalized for each physics list were used to minimize bias in the evaluation due to beam modeling. The goal was to identify the optimal nuclear interaction physics configurations for IDC in LIBT applications such as PSQA, balancing dosimetric accuracy and simulation speed.
2. MATERIALS AND METHODS
Firstly, the types of dosimetric measurements for the beam model validation and further evaluation are introduced. Then the MC simulation settings for dose calculation are described. Finally, the methods for beam model validation, dose calculation accuracy evaluation, and simulation time evaluation are explained.
2.1. Dosimetric measurements
Basic beam data acquired for the horizontal (HBL) and vertical (VBL) carbon ion beamlines at MedAustron were categorized into one‐dimensional (1D), two‐dimensional (2D), and three‐dimensional (3D) tests, adapted from previous classifications used to validate the delivery capacities of proton beamlines. 38 While the depth‐dose profiles (1D), absolute dose in reference condition (1D), spot size in air (2D), absolute dose (3D) were acquired for both beamlines, some advanced measurements, for example, transverse dose profile of the core and halo (1D), field size factor (FSF) (2D) were only acquired at HBL. Unless specified, irradiation was assumed without a range shifter. The effective point of measurement of the dosimeters was aligned to the measurement position.
2.1.1. 1D tests
The depth‐dose profiles, also referred to as integrated radial profiles as a function of depth (IRPD), 39 were measured in water with the PeakFinder water column (PTW, Freiburg, Germany). The range at 80% of Bragg peak dose (), linearly interpolated from the depth‐dose profile, was determined for 16 beam energies from 120.0 to 402.8 MeV/u at isocenter. Similarly, was acquired for four intermediate energies using reduced air gap (50 cm from the isocenter) and a range shifter with 35 mm water equivalent thickness.
The dose at reference condition (), institutionally defined for carbon ions as 14 mm depth in water irradiated by an 88 monoenergetic field with 2 mm spot spacing, was measured with the PTW Roos Electron chamber (T34001) at isocenter for the 16 energies.
The transversal dose profiles of core and halo were measured with a linear array holder of 24 PinPoint ionization chambers (ICs) in water at various depths from plateau to fragmentation tail (25 mm, , , ‐5 mm, , ). The profiles were acquired for 284.7 and 402.8 MeV/u, and for 200 MeV/u with range shifter. Each profile was normalized to its maximum value (), and fitted to a normal distribution to acquire the core width .
2.1.2. 2D tests
The fluence of monoenergetic spot maps covering the maximum field size was measured with Lynx 2D scintillation detector (IBA Dosimetry, Schwarzenbruck, Germany) in air at various distance (0, 20, 30, 40, 50 cm) to the isocenter. The spot size, characterized by the full width at half maximum intensity (FWHM), was acquired for the mentioned 16 energies.
Various square fields of nine different sizes ( 2.0, 3.2, 4.4, 5.6, 6.8, 8.0, 10.0, 15.6, and 20.0 cm) were irradiated to water with the PTW Semiflex IC (T31010) placed at the center of the field and its effective point of measurement positioned at the intended depth. The FSF was acquired for the same energies and depths as the transversal profile measurements, following the methodology published earlier. 7 , 38 The FSFs were labelled sequentially by the field size as , and normalized to the 7th field ( 10.0 cm).
2.1.3. 3D tests
In 103 fields of energy‐modulated scanned beams (Table 1), the dose was measured at 3181 positions in water with the 3D detector block holder of 24 PinPoint ICs. The fields were optimized with the clinical TPS, RayStation 8B, with the relative biological effectiveness (RBE) calculated by the Local Effect model I. 40 , 41 Type I (6 HBL, 4 VBL) and type II (24 HBL, 24 VBL) referred to fields optimized for uniform physical dose and RBE‐weighted dose in regular shaped cubic targets 42 in water, respectively. Consequently, measured points in the target region of type I and type II fields had negligible and axial dose gradient ( (Gy/mm)), respectively. Type III (28 HBL, 17 VBL) referred to patient fields planned in patient geometry with multi‐field optimization, and delivered in water for experimental PSQA. A low dose threshold of 0.05 Gy was used to select points in type III fields, where measured points could be inside or outside the target, regardless of the magnitude or direction of .
TABLE 1.
The overview of 10 type I fields, 48 type II fields, and 45 type III fields, including the number of measured positions per field, field size, modulation length, field center depth, range shifter usage, and isocenter‐water‐phantom‐surface‐distance (ISD).
| Type | Field index | Number of positions | Field size (cm) | Modulation length (cm) | Field center depth (cm) | Range shifter | ISD (cm) |
|---|---|---|---|---|---|---|---|
| I | 1, 2 | 36, 36 | 6 | 6 | 6 | no | 0 |
| 3, 4 | 24, 24 | 8 | 8 | 13 | no | 0 | |
| 5, 6 | 24, 24 | 10 | 10 | 19, 21.8 | no | 0 | |
| 7 | 24 | 16 | 16 | 15 | no | 0 | |
| 8 | 20 | 16 | 5 | 19 | no | 0 | |
| 9, 10 | 5, 3 | 2 | 2 | 5, 24 | no | 50 | |
| II | 11, 12, 13, 14 | 5, 3, 3, 3 | 2 | 2 | 5, 5, 24, 25.5 | no | 0 |
| 15, 16, 17, 18 | 30, 24, 20, 32 | 4 | 4 | 5, 5, 24, 24.5 | no | 0 | |
| 19, 20 | 40, 32 | 5 | 5 | 6, 10 | no | 0 | |
| 21, 22, 23, 24, 25 | 69, 64, 25, 106, 25 | 6 | 6 | 6, 6, 10, 10, 15 | no | 0 | |
| 26, 27 | 62, 62 | 8 | 8 | 13 | no | 0 | |
| 28, 29 | 64, 82 | 10 | 10 | 21.8 | no | 0 | |
| 30 | 44 | 16 | 5 | 6 | no | 0 | |
| 31, 32 | 54, 38 | 17 | 6 | 6, 23.5 | no | 0 | |
| 33, 34, 35, 36 | 24, 24, 18, 20 | 4 | 4 | 5, 5, 19, 24 | no | 40, 50, 40, 50 | |
| 37, 38, 39 | 64, 69, 25 | 6 | 6 | 6, 6, 15 | no | 40, 50, 50 | |
| 40, 41 | 68, 62 | 8 | 8 | 13 | no | 40, 50 | |
| 42, 43 | 68, 64 | 10 | 10 | 21.8 | no | 40, 50 | |
| 44 | 28 | 16 | 5 | 5.5 | no | 40 | |
| 45, 46 | 54, 38 | 17 | 6 | 6, 23.5 | no | 50 | |
| 47, 48 | 3, 5 | 2 | 2 | 3 | yes | 40, 50 | |
| 49, 50 | 12, 8 | 3 | 3 | 4 | yes | 40, 50 | |
| 51, 52 | 42, 73 | 6 | 6 | 5 | yes | 40, 50 | |
| 53, 54 | 54, 50 | 6 | 10 | 7 | yes | 40, 50 | |
| 55, 56 | 110, 47 | 8 | 8 | 15 | yes | 40, 50 | |
| 57 | 58 | 15 | 10 | 7 | yes | 40 | |
| 58 | 32 | 16 | 5 | 4 | yes | 40 | |
| III | 59, 60, 61, 62, 63 | 22, 21, 9, 21, 24 | 6.7, 6.7, 7.6, 7.7, 8.1 | 6.3, 6.3, 9.5, 6.8, 23 | no | 40 | |
| 64, 65, 66, 67, 68 | 24, 23, 24, 23, 19 | 8.3, 9.1, 9.3, 9.5, 10.0 | 7.1, 7.5, 7.6, 22.3, 7.9 | no | 40 | ||
| 69, 70, 71, 72, 73 | 19, 15, 22, 24, 24 | 10.2, 10.4, 10.6, 11.4, 11.8 | 14.7, 14.1, 14.5, 9.1, 12.7 | no | 40 | ||
| 74, 75, 76, 77, 78 | 21, 24, 19, 24, 21 | 11.9, 12.1, 12.5, 13.1, 14.7 | 8.9, 9.0, 9.2, 16.7, 10.3 | no | 40 | ||
| 79, 80, 81, 82, 83 | 24, 24, 24, 24, 24 | 16.4, 16.5, 16.7, 16.7, 17.5 | 11.1, 11.2, 11.3, 18.7, 18.3 | no | 40 | ||
| 84, 85, 86, 87, 88 | 24, 24, 19, 24, 24 | 18.0, 20.8, 20.9, 22.3, 24.1 | 14.1, 13.3, 16.6, 15.9, 15.0 | no | 40 | ||
| 89, 90, 91, 92, 93 | 7, 12, 24, 15, 23 | 2.0, 3.4, 5.6, 6.6, 9.4 | 6.2, 5.5, 8.4, 7.0, 8.7 | yes | 40 | ||
| 94, 95, 96, 97, 98 | 24, 24, 14, 15, 24 | 9.4, 9.4, 9.8, 10.2, 10.4 | 8.7, 8.4, 8.7, 8.8, 9.1 | yes | 40 | ||
| 99, 100, 101, 102, 103 | 22, 24, 20, 24, 24 | 11.0, 12.2, 14.8, 16.6, 17.2 | 9.2, 10.2, 11.1, 12.8, 12.3 | yes | 40 |
Note: The field indices from VBL are underlined.
2.2. Dose calculation
Simulations were performed with ideal v1.1, an IDC system for ion beam therapy wrapped around GATE‐RTion 1.0 35 /geant4 10.03p03. 43 ideal v1.1 includes code improvements, bug fixes, and new API features, building on the previously published v1.0. 36
Table 2 summarizes the nuclear interaction models for the relevant particle types and energy ranges of the following physics lists: QGSP_BIC_HP_EMZ, QGSP_INCLXX_HP_EMZ, Shielding_EMZ, QBBC_EMZ, and QGSP_BERT_HP_EMZ. This manuscript uses the geant4 nomenclatures 21 which defines physics list as a high‐level configuration which specifies all physics constructors in a reproducible manner; physics constructor handles a comprehensive group of EM or other physics processes for a group of particles. For example, EMZ represents the EM physics constructor G4EmStandardPhysics_option4. Physics models are called by physics builders (usually handles a particular set of physics processes for specific hadrons) or physics constructors. BIC model is used in all but QGSP_INCLXX_HP for partial or all particle types and relevant energies, with exceptions: Shielding and other physics lists containing HP use ParticleHP model and data library G4NDL4.5 for low energy (E< 20 MeV) neutron interactions with higher precision. Shielding and QGSP_BERT_HP use Bertini intranuclear model for proton and intermediate energy neutrons. Shielding also uses QMD model for higher energy (E> 100 MeV) ions. QGSP_INCLXX_HP uses INCL++ model for the nuclear interaction of all but intermediate energy neutrons.
TABLE 2.
The nuclear interaction physics models of the used physics lists, accompanied by relevant particle types and energy ranges.
| QGSP_BIC_HP | QGSP_INCLXX_HP | Shielding | QBBC | QGSP_BERT_HP | |
|---|---|---|---|---|---|
| Proton | G4BinaryCascade (0<E<6 GeV) | G4INCLXXInterface (1 MeV<E<20 GeV) | G4CascadeInterface (0<E<6 GeV) | G4BinaryCascade (0<E<1.5 GeV) | G4CascadeInterface (0<E<9.9 GeV) |
| Neutron | ParticleHP † (0<E<20 MeV) G4BinaryCascade (19.9 MeV<E<6 GeV) | ParticleHP † (0<E<20 MeV) G4INCLXXInterface (19.9 MeV<E<20 GeV) | ParticleHP † (0<E<20 MeV) G4CascadeInterface (19.9 MeV<E<6.0 GeV) | G4BinaryCascade (0<E<1.5 GeV) | ParticleHP † (0<E<19.9 MeV) G4CascadeInterface (19.9 MeV<E<9.9 GeV) |
| Deuteron, Triton, He3, Alpha, Generic Ion | G4BinaryLightlonReaction (0<E<6.0 GeV) | G4INCLXXInterface (0<E<3.0 GeV) | G4BinaryLightlonReaction (0<E<100 MeV+10 MeV), G4QMDReaction (100 MeV<E<10 GeV) | G4BinaryLightlonReaction (0<E<6.0 GeV) | G4BinaryLightlonReaction (0<E<6.0 GeV) |
ParticleHP model is based on tabulated data, and realized via physics builder G4NeutronPHPBuilder directly.
All elements of the MedAustron nozzle were modeled explicitly and particles were tracked through it from a virtual source point shortly before the vacuum exit window. 6 The reference beam model was tuned using QGSP_BIC_HP_EMZ, according to the AUTO‐BEAM approach: 44 the energy distribution was characterized by a Gaussian function with mean energy and energy spread; the initial beam optics was characterized by the beam emittance, width, and divergence; the beam model parameters were fitted to an n‐th order polynomial function of beam energy. These beam parameters were identical in the beam models of other physics lists.
To compensate for the seasonal and temporal effect of dose output drifts, 45 an empirical beamline‐specific factor of 1.00 (HBL) and 0.98 (VBL) was applied on the N/MU conversion.
The MU of the dose delivery system was calibrated with the simulated number of primaries using QBBC_EMZ physics list in GATE/geant4. 46 Considering that BIC model is used in both QBBC and QGSP_BIC_HP, this study assumed and verified = 1 for the beam model of QGSP_BIC_HP_EMZ, which is referred to as . The beam models of QGSP_INCLXX_HP_EMZ and Shielding_EMZ were normalized to the simulated using , and are referred to as and . Beam models of QBBC_EMZ and QGSP_BERT_HP_EMZ with = 1 are referred to as and , which are identical to except for the physics list.
This study applied = 1.03 on the beam model to reproduce the reported additional N/MU conversion tuning on the validated beam model with Shielding_EMZ. 36 An ad hoc was derived empirically and applied on , in order to improve the dose calculation accuracy in 3D fields: , where E (MeV/u) denotes the nominal energy. The two beam models with additional N/MU tuning are referred to as and .
Production cut of 100 m was used for e‐/e+/. The simulated IRPD showed negligible difference to IRPD simulated with 0.5 mm e‐ production cut, possibly due to the dose grid size. The IRPD, , transversal profiles, and FSF were simulated in G4_WATER with dose grid resolution of 1.0 1.0 1.0 . The point dose in 3D fields were simulated in G4_WATER with dose grid resolution of 2.0 2.0 2.0 . The fluence of spot maps was simulated in G4_AIR with dose grid resolution of 2.5 1.0 1.0 . The dose was averaged over the sensitive volume of the corresponding dosimeter across the dose grid for all simulations except for the point dose in 3D fields, which was merely interpolated in the dose grid considering the large dose grid relative to the active volume of PinPoint IC (0.03 for TM31015). The statistical uncertainty goals were set in terms of minimum number of primary particles ( for IRPD, for the fluence of spot map, and for , transversal profiles, and FSF) and the maximum allowable statistical uncertainty (1.0% for 3D fields).
2.3. Beam model validation and physics list evaluation
In comparison with measurements (2.1), the normalized beam models with various physics lists were validated considering in water, spot size in air, and dose at reference condition in water. For only the absolute dosimetry test, and beam models were also involved, in order to verify the assumed unitary N/MU conversion. The uncertainty in was estimated by propagating the uncertainty in measured ( = 2.7%. For measured , FSF, and , detailed uncertainty estimations are provided in the Supplementary Material) and the statistical uncertainty in simulated (, using the minimum number of primaries ).
The dose calculation accuracy in fields was studied in two steps. Firstly, the absolute difference of simulated and measured FSF () for three beam energies (200.0 MeV/u with range shifter, 284.7 MeV/u, and 402.8 MeV/u) was evaluated to quantify the dosimetric accuracy of monoenergetic scanned beams. The absolute difference of the simulated and measured normalized transversal dose profiles was quantified for pencil beams of the same configurations. The uncertainty in was derived from the estimated uncertainty in measured FSF and simulated FSF (For simulated FSF and , detailed uncertainty estimations are provided in the Supplemntary Material). The uncertainty in was derived similarly.
Secondly, the accuracy of dose calculation in fields of energy‐modulated scanned beams was investigated over 103 fields of various field sizes, modulation lengths, and complexity (2.1.3). The global dose difference (), defined as the difference of simulated and measured point dose normalized by the maximum simulated dose of the field, was calculated. Despite the nominal value of 0.5 mm, 47 larger position inaccuracy of millimeters could be present in case of inexperienced medical physicist. 48 Assuming a hypothetical positioning uncertainty of 1 mm, the best case scenario global dose difference () was calculated as the minimum for simulated doses within the uncertainty box around the measured position (±1 mm in each direction), for type II fields with axial intra‐target and type III patient fields. The depths of measured positions were divided to 9 bins of 30 mm, and the medians of and were calculated for each bin. The and of each depth bin were characterized using box plots with Tukey‐style whiskers. 49 For type I fields, the uncertainties of the median value ( were represented by the 95% confidence interval , where and denote the 25% and 75% quartile, respectively, and denotes the number of positions in the depth bin. For type II and type III fields, the uncertainties of both median values were represented by . or beyond the bound of [, ] were marked as outliers.
2.4. Simulation time evaluation
The simulation tasks were distributed across an in‐house computer cluster with 168 CPU cores, which span several Intel processor generations. To evaluate the simulation time of the physics lists, we repeated a subset of simulations on an isolated cluster comprising two machines, each running Ubuntu 18.04.6 LTS and equipped with two Intel Xeon Gold 6146 12‐core CPUs (2 threads per core via hyper‐threading, 3.20 GHz base clock).
The simulation time was quantified by the CPU time excluding the initialization time. Firstly, the simulation times (normalized to hours per primaries) of monoenergetic pencil beams (with and without the range shifter) were fitted linearly as a function of the nominal energy. Secondly, the simulation time of modulated 3D plans () were predicted using the number of primaries per energy layer. The quality of fitting was evaluated using the coefficient of determination () and the normalized root mean squared error (NRMSE). NRMSE was derived with Equation 1, where represents the number of plans for the derivation of the fitted function ( for the beam without range shifter, for the beam with range shifter), represents the actual time of the plan, represents the predicted time, equals the actual time of the 402.8 MeV/u pencil beam, equals the actual time of the 120.0 MeV/u pencil beam.
| (1) |
The quality of prediction was evaluated using NRMSE, while replacing and with the actual time of the 402.8 and 120.0 MeV/u pencil beams, respectively. The slopes of the fitted functions for QGSP_BIC_HP, QGSP_INCLXX_HP, and Shielding served as indicators for comparing the simulation time of each physics list.
3. RESULTS
3.1. Beam model validation
Figure 1 shows the measured and simulated IRPD of 16 beam energies in HBL. The QBBC curve is omitted because it exhibits strong agreement with QGSP_BIC_HP and QGSP_BERT_HP, while including it would overly crowd the figure. The simulated using QGSP_BIC_HP, QGSP_INCLXX_HP, and Shielding agreed with experimental reference within [0.0, 0.1] mm (HBL) or [−0.2, 0.1] mm (VBL). FWHM agreed within [−5, 2]% (HBL) or [−1, 4]% (VBL).
FIGURE 1.

The measured and simulated IRPD of HBL in water, normalized to the measured dose at 14 mm depth. Each curve is plotted till , with the nominal energy (MeV/u) marked above the Bragg peak. The uncertainty of simulated dose is represented by the error band. BIC: QGSP_BIC_HP, INCLXX: QGSP_INCLXX_HP, BERT: QGSP_BERT_HP. HBL; horizontal beamline, IRPD; integrated radial profiles as a function of depth.
The normalized N/MU conversions in and are = and = 1.0075, respectively. denotes the nominal energy (MeV/u) of the energy layer. Figure 2 shows the for different physics lists along with reference and ‐tuned beam models. Simulated with reference beam models agreed with measured within uncertainty of ±2.7% for both beamlines and all physics lists.
FIGURE 2.

The relative difference of simulated and measured dose at reference condition as a function of nominal energy for HBL (left) and VBL (right). BIC: QGSP_BIC_HP, INCLXX: QGSP_INCLXX_HP, BERT: QGSP_BERT_HP. The subscript ref indicates the normalized beam models, and N/MU indicates additional N/MU conversion tuning. The gray error band represents the relative standard uncertainty of measured , 2.7%. The gray lines represent ±3%. HBL; horizontal beamline, VBL; vertical beamline.
The of Shielding with deviated from reference by more than 5% for 120.0 MeV/u beam at HBL, while the of QGSP_BIC_HP with deviated from reference by −5% for 384.5 MeV/u beam at VBL. The reason for additional N/MU tuning at the cost of deviating from beam model validation guideline 10 will be clarified in the Discussion.
3.2. Dosimetric accuracy in field of scanned beams
3.2.1. Monoenergetic field
The three physics lists (QGSP_BIC_HP, QGSP_INCLXX_HP, and Shielding) exhibited good FSF accuracy at depths prior to the Bragg peak, with within ±1% (284.7 and 402.8 MeV/u) and ±2% (200.0 MeV/u with range shifter) for most field sizes, except for 2.0 and 3.2 cm, where its uncertainty range overlapped with the specified intervals. In the fragmentation tail, generally exceeded ±1% and varied across field sizes, with no single physics list consistently outperforming the others across all energies and depths (analysis and figures are available in Supplementary Material).
Figures 3 and 4 show the normalized transversal dose profiles at the same depths for the 402.8 MeV/u beam and the 200.0 MeV/u beam with range shifter. Additional figure for 284.7 MeV/u (Figure S2) is provided in the Supporting Information. was better than ±0.1 at depths prior to the Bragg peak for all the three physics lists. In the fragmentation tail, QGSP_INCLXX_HP demonstrated better accuracy than the other two physics lists, with remaining within ±0.1, while of the other physics lists exceeded ±0.2 at partial or both depths. At lateral distances where was lower than 1%, was sufficiently small to be considered negligible. Full width at x = 10%, 1%, and 0.1% of maximum for the are available in the Supporting Information.
FIGURE 3.

The normalized transversal dose profile () of 402.8 MeV/u carbon ion beam plotted over the lateral distance off the central axis (mm). (a) to (f) represent profiles at various depths in water. represents core width. The uncertainty of measured (black) is shown in the upper axes with shaded region. The uncertainties of for QGSP_BIC_HP (cyan), QGSP_INCLXX_HP (yellow), and Shielding (red) are shown in the bottom axes with shaded region of the line color. The uncertainty representations are smaller than the symbols in many cases.
FIGURE 4.
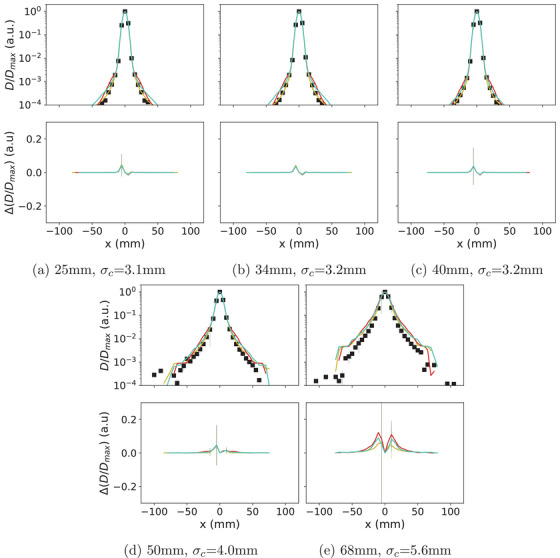
The normalized transversal dose profile () of 200.0 MeV/u carbon ion beam plotted over the lateral distance off the central axis (mm). (a) to (e) represent profiles at various depths in water. represents core width. The uncertainty of measured (black) is shown in the upper axes with shaded region. The uncertainties of for QGSP_BIC_HP (cyan), QGSP_INCLXX_HP (yellow), and Shielding (red) are shown in the bottom axes with shaded region of the corresponding color. The uncertainty representations are smaller than the symbols in many cases.
3.2.2. Energy‐modulated field
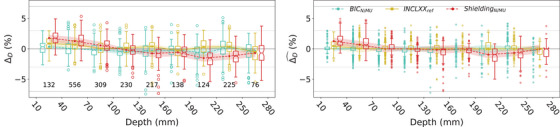
Figure 5 shows the distribution of for different physics lists, using reference and tuned beam models, for 10 type I fields from HBL and VBL. The for QGSP_BIC_HP with remained within [−0.4%, 0.1%] until depth of 160 mm, and increased along depth to 2.3% between 220 and 250 mm. The for QGSP_INCLXX_HP remained within [−0.2, 1.0]%. The for Shielding with decreased along depth from −0.3% to −4.1%. The for QGSP_BIC_HP and Shielding with tuned beam models were overall lower than with reference beam models. The energy‐dependent in reduced to within [−1.3%, 0.2%]. The constant in reduced the to within [−1.5%, 2.5%].
FIGURE 5.

The distribution of for type I fields comparing the three configurations with normalized beam models (left) and the two with tuned N/MU conversion (right). The planned measurement positions ranged from 34.0 to 248.9 mm. The number of points in each depth group is marked beneath the boxes. The light gray and gray horizontal lines indicate ±3% and ±7%, respectively. The lines with markers indicate the of the depth group. Both the notches and the error band indicate the , that is, uncertainty of . The statistics of is reported in Table S5 in the Supporting Information.
For the 48 type II (Figure 6) and the 45 type III fields (Figure 7), the of QGSP_BIC_HP with beam model remained within [−0.7%, 0.3%] and [−0.1%, 1.8%], respectively. The magnitude of this configuration was similar to that of QGSP_INCLXX_HP with reference beam model, which remained within [−0.5%, 0.9%] and [−0.9%, 1.1%] for type II and type III fields, respectively. Meanwhile, the of both QGSP_BIC_HP () and QGSP_INCLXX_HP () rounded to 0.0%, except for between 10 and 40 mm depth for the latter (0.5%). On the contrary, the of Shielding with showed noticeable magnitude of [−1.5%, 1.8%] and [−0.2%, 1.5%] for type II and type III fields, respectively. The of this configuration also showed larger magnitude than the other two configurations, being [−0.7%, 1.3%] for type II fields and approximately 0.0% for type III fields.
FIGURE 6.
The distribution of (left) and (right) for type II fields. The planned measurement positions ranged from 21.9 to 265.9 mm. The number of points in each depth group is marked beneath the boxes. The light gray and gray horizontal lines indicate ±3% and ±7%, respectively. The lines with markers indicate the and of the depth group. The notches indicate the of and . The error bands with half width of indicated the uncertainty of of the corresponding bin. The statistics of and are reported in Tables S6 and S7.
FIGURE 7.

The distribution of (left) and (right) for type III fields. The planned measurement positions ranged from 11.9 to 274.7 mm. The number of points in each depth group is marked beneath the boxes. The light gray and gray horizontal lines indicate ±3% and ±7%, respectively. The lines with markers indicate the and of the depth group. The notches indicate the of and . The error bands with half width of indicated the uncertainty of of the corresponding bin. The statistics of and are reported in Tables S8 and S9.
For all 103 fields, the of QGSP_BIC_HP (), QGSP_INCLXX_HP (), and Shielding () remained within ±7%, except for outliers.
3.3. Simulation time
Table 3 reports the fitted linear functions of the normalized simulation time () as a function of the nominal energy (MeV/u). The of all fitted functions exceeded 0.982 and all NRMSE values were within 0.05 , suggesting a strong fit. The NRMSE between the predicted times and the actual times of the 11 verification plans equaled 0.05, 0.07, and 0.04 for QGSP_BIC_HP, QGSP_INCLXX_HP, and Shielding, respectively. Figure 8 shows the predicted and actual normalized simulation time of the training and verification plans for QGSP_BIC_HP as an example. The slope of Shielding was 1.8 times and 1.5 times the slopes of QGSP_BIC_HP and QGSP_INCLXX_HP, respectively. This suggests that Shielding is slower than QGSP_BIC_HP and QGSP_INCLXX_HP, while the simulation times of the latter two are similar.
TABLE 3.
The fitted function for simulation time () of the plan of a monoenergetic pencil beam, as a function of the nominal energy () of the pencil beam.
| QGSP_BIC_HP | QGSP_INCLXX_HP | Shielding | |||
|---|---|---|---|---|---|
| Without |
|
0.0500 ± 0.0013 | 0.059 ± 0.002 | 0.091 ± 0.002 | |
|
|
0.4 | −6.8 ± 0.6 | −10.3 ± 0.6 | ||
|
|
0.990 | 0.982 | 0.992 | ||
| NRMSE | 0.03 | 0.05 | 0.03 | ||
| With |
|
0.055 ± 0.003 | 0.063 ± 0.004 | 0.098 ± 0.007 | |
|
|
−7.2 ± 0.7 | −8.8 ± 1.0 | −13.1 ± 2.0 | ||
|
|
0.995 | 0.994 | 0.990 | ||
| NRMSE | 0.03 | 0.03 | 0.04 |
Note: The fitted and together with their standard errors, , and NRMSE are shown for plans with and without the range shifter.
FIGURE 8.

The predicted () and actual () normalized simulation time of the monoenergetic pencil beam training plans with and without range shifter, and the verification plans. Simulations were performed for QGSP_BIC_HP_EMZ with beam model. The gray line represents .
4. DISCUSSION
This study found that QGSP_BIC_HP, QGSP_INCLXX_HP, and Shielding with normalized beam models showed comparable dosimetric accuracy for the FSF and transversal dose profiles prior to the Bragg peak, with differences within uncertainties, but distinct dosimetric accuracies for the dose in the target region of energy‐modulated fields.
The of QGSP_BIC_HP and Shielding with reference beam models were consistent with zero within uncertainty range at depths between 10 and 40 mm, but deviated by +2.3% and −4.1%, respectively, at depths between 220 and 250 mm (Figure 5). The of QGSP_INCLXX_HP with reference beam model remained within 1.0% at all depth bins, while reaching the extreme at a shallower depth between 40 and 70 mm. The distinct pattern of for the four reference beam models over the measured depths of type I fields exceeded the uncertainties (indicated by error bands and boxplot notches).
The depth dependency of for QGSP_BIC_HP, QGSP_BERT_HP, and Shielding (with reference beam models) related to the nuclear interaction models in the physics lists. The comparable magnitude and trend of for the first two physics lists likely stemmed from their shared use of BIC model for ion nuclear interactions, despite different models for hadrons (BIC model in QGSP_BIC_HP and Bertini model in QGSP_BERT_HP for hadrons except for neutrons of 20 MeV). Conversely, QGSP_BERT_HP and Shielding used identical models for nuclear interaction processes with the exception of 100 MeV ions: the former uses BIC model and the latter uses QMD model. Their differed substantially in both tendency and magnitude. The opposition emphasized the critical role of the ion nuclear interaction model in target dose calculation, especially for ions with 100 MeV.
The dose calculation deviations of BIC and QMD models in carbon ion beam therapy have been reported, but comparisons with INCL++ model remain scarce. Compared with QMD model which yielded closer agreement with the measured IRPD of scattered beams, BIC model overestimated the fluence of secondary carbon isotopes (e.g.,  ) in the proximal region of the Bragg peak, which increased the local dose by around 4% of the Bragg peak dose for a 400.0 MeV/u beam.
50
This carbon bump was also observed in the simulated IRPD of high energy pencil beams with BIC model in geant4 10.2.3
5
and with Bertini intranulcear cascade model (FTFP_BERT) using geant4 10.3.3,
51
and in our simulated IRPD with QGSP_BIC_HP, QBBC, and QGSP_BERT_HP (Figure 1).
) in the proximal region of the Bragg peak, which increased the local dose by around 4% of the Bragg peak dose for a 400.0 MeV/u beam.
50
This carbon bump was also observed in the simulated IRPD of high energy pencil beams with BIC model in geant4 10.2.3
5
and with Bertini intranulcear cascade model (FTFP_BERT) using geant4 10.3.3,
51
and in our simulated IRPD with QGSP_BIC_HP, QBBC, and QGSP_BERT_HP (Figure 1).
The increased number of outliers and wider error band () in type III fields compared to in type II fields suggested larger uncertainty of in case of higher and more complex , combining the volume averaging effect of the PinPoint IC (radius of active volume 1.45 mm, nominal height 5 mm) and its position uncertainty. For type II and type III fields, the uncertainty of was better reflected by the expression than by (shown as notches of the box plots), considering the similar interquartile range () of in type II and type III fields. Instead, provided a conservative estimation of the uncertainty of , especially for fields with high .
At depths prior to the Bragg peak, the asymmetric form of relative to the central axis (x = 0 mm) implied possible alignment inaccuracies between the planned and measured positions. Additionally, the active area of the PinPoint IC (2.9 5 mm in beam's eye view) is large compared to the size of the beam (). For the 200.0 MeV/u beam with range shifter ( = 45 mm), though 50 mm corresponded to and located in the fragmentation tail, the profile at 50 mm depth showed similarity to profiles proximal to the Bragg peak, regarding the converging of different physics lists and . The different pattern at for this pencil beam suggested the extension of core region into deeper depth, which possibly resulted from the increased range straggling of the primary carbon ions due to the range shifter.
The beam models and applied additional tuning on the validated beam models and , which resulted in >±3%. Yet the purpose of additional N/MU tuning, which was to reduce in the target region of 3D fields, was achieved. Regarding the trade‐off of dose calculation accuracy in the plateau region () and the target region, the latter is more critical for clinical IDC, since the plateau dose contributes only 20%–40% of Bragg peak dose for the therapeutic carbon ion pencil beams. Additional tuning offers a practical solution to mitigate the target dose calculation inaccuracy despite using validated beam model. The method applies to dose calculation systems where adjusting the nuclear interaction physics model is not feasible.
The calculation of was different from the gamma index () 52 calculation: though both use a distance‐to‐agreement (e.g., 1 mm) and a low dose threshold (e.g., 0.05 Gy), quantified the minimum dose difference (DD) achievable while quantified the minimum Euclidean distance in the dose‐space coordinate. While allowed for a direct comparison of the dosimetric accuracy of different simulation settings, the estimated best case scenario accuracy might be overly optimistic because the uncertainty boxes of positions in the same measurement were assumed to be independent from each other.
This study proposed a prediction model for the normalized simulation time of a treatment plan. The model revealed the near‐linear relationship between simulation time and nominal energy for monoenergetic pencil beam plans, and showed good accuracy for plans with multiple energy layers. The obviously higher slope of Shielding compared to the other two physics lists confirmed the slower simulation of Shielding, which likely comes from the computationally demanding QMD model used for nuclear interactions of ions (E> 100 MeV). The NRMSE of verification plans was slightly higher than the NRMSE of single pencil beam training plans, possibly due to the different CT grid size in the verification plans ( ) and the training plans ( ). The model was trained and validated using irradiation plans with a homogeneous phantom (G4_WATER). Further adjustments are required to adapt it for plans involving phantoms of other materials and inhomogeneous patient geometries. The prediction ability of the model declines for energy layers beyond the therapeutic range (120–402.8 MeV/u) and at low energies when the range shifter is used.
Using production cut of 100 m for e‐/e+/ reduced the simulation time by up to 80% compared to using production cut of 0.5 mm. 53 To assess the feasibility of QGSP_BIC_HP or QGSP_INCLXX_HP for clinical IDC regarding simulation time, an exemplary patient (patient C2 36 ) was re‐simulated with the former along with beam model and production cuts from this study, considering 1% statistical uncertainty per beam. The simulation time including initialization was 5.3 hours for primaries on our clinical cluster with 96 CPU cores, adequate for the time frame of PSQA. Note that ad hoc simulation time depends on factors like CPU count, model, topology, and disk performance, so the result should be considered as illustrative example rather than precise benchmark.
5. CONCLUSION
Among the evaluated GATE‐RTiON/geant4 physics lists, QGSP_INCLXX_HP demonstrated high dosimetric accuracy in the target region of energy modulated fields. QGSP_BIC_HP and Shielding showed physics model‐related inaccuracies in simulated target dose. Additional tuning improved their target dose calculation accuracy with a trade‐off of reference dose accuracy. The computationally efficient QGSP_INCLXX_HP and QGSP_BIC_HP are viable candidates for dose calculation applications of carbon ion beam therapy such as in silico PSQA.
CONFLICT OF INTEREST STATEMENT
The authors declare no conflicts of interest.
Supporting information
Supporting Information
ACKNOWLEDGMENTS
The authors acknowledge the MedAustron Medical Physics team for providing the dosimetric commissioning measurements used in this work. Further they thank S. Guatelli (UOW) for discussions on physics lists of geant4 and H. Palmans (MedAustron) for discussions on uncertainty estimation and advice on data for stopping power ratios. This work was funded by the “Niederösterreichischen Wirtschafts‐ und Tourismusfonds” and European union in form of the EFRE funds (WST3‐F‐5033232/002‐2020) and FW774A0101 (PAIR project) of the Austrian Science Fund (FWF).
Jia Y, Favaretto M, Hartl L, et al. Experimental validation of geant4 nuclear interaction models in dose calculations of therapeutic carbon ion beams. Med Phys. 2025;52:e17906. 10.1002/mp.17906
Footnotes
As of May 15, 2025, the commercial TPSs, including both currently and historically available systems, for carbon ion beam therapy are: RayStation, RaySearch Laboratories, Stockholm, Sweden; Monaco‐I, Elekta AB, Stockholm, Sweden; Syngo PT planning, Siemens Healthineers, Erlangen, Germany; VQA Plan, Hitachi, Ltd., Tokyo, Japan.
REFERENCES
- 1. Gottschalk B, Cascio EW, Daartz J, Wagner MS. On the nuclear halo of a proton pencil beam stopping in water. Phys Med Biol. 2015;60(14):5627‐5654. 10.1088/0031-9155/60/14/5627 [DOI] [PubMed] [Google Scholar]
- 2. CERN . Introduction to the Monte Carlo simulation of radiation transport. Accessed January 17, 2025. https://indi.to/fyzNy2021
- 3. Ruangchan S, Knäusl B, Fuchs H, Georg D, Clausen M. Experimental benchmarking of RayStation proton dose calculation algorithms inside and outside the target region in heterogeneous phantom geometries. Physica Med. 2020;76:182‐193. 10.1016/j.ejmp.2020.07.010 [DOI] [PubMed] [Google Scholar]
- 4. Zhang H, Li Q, Liu X, et al. Validation and testing of a novel pencil‐beam model derived from Monte Carlo simulations in carbon‐ion treatment planning for different scenarios. Physica Med. 2022;99:1‐9. 10.1016/j.ejmp.2022.04.018 [DOI] [PubMed] [Google Scholar]
- 5. Nakaji T, Kanai T, Takashina M, et al. Clinical dose assessment for scanned carbon‐ion radiotherapy using linear energy transfer measurements and Monte Carlo simulations. Phys Med Biol. 2022;67(24):245021. 10.1088/1361-6560/aca003 [DOI] [PubMed] [Google Scholar]
- 6. Elia A, Resch AF, Carlino A, et al. A GATE/Geant4 beam model for the MedAustron non‐isocentric proton treatment plans quality assurance. Physica Med. 2020;71:115‐123. 10.1016/j.ejmp.2020.02.006 [DOI] [PubMed] [Google Scholar]
- 7. Resch AF, Elia A, Fuchs H, et al. Evaluation of electromagnetic and nuclear scattering models in GATE/Geant4 for proton therapy. Med Phys. 2019;46(5):2444‐2456. 10.1002/mp.13472 [DOI] [PMC free article] [PubMed] [Google Scholar]
- 8. Kurosu K, Takashina M, Koizumi M, Das IJ, Moskvin VP. Optimization of GATE and PHITS Monte Carlo code parameters for uniform scanning proton beam based on simulation with FLUKA general‐purpose code. Nuclear Instruments and Methods in Physics Research Section B: Beam Interactions with Materials and Atoms. 2014;336:45‐54. 10.1016/j.nimb.2014.06.009 [DOI] [Google Scholar]
- 9. Winterhalter C, Aitkenhead A, Oxley D, et al. Pitfalls in the beam modelling process of Monte Carlo calculations for proton pencil beam scanning. Br J Radiol. 2020;93(1107):20190919. 10.1259/bjr.20190919 [DOI] [PMC free article] [PubMed] [Google Scholar]
- 10. International Commission on Radiation Units and Measurements. ICRU Report 93: Prescribing, Recording, and Reporting Light Ion Beam Therapy. J ICRU. 2018;18(1‐2). 10.1093/jicru/ndy002 [DOI] [Google Scholar]
- 11. Agostinelli S, Allison J, Amako K, et al. Geant4–a simulation toolkit. Nuclear Instruments and Methods in Physics Research Section A: Accelerators, Spectrometers, Detectors and Associated Equipment. 2003;506(3):250‐303. 10.1016/S0168-9002(03)01368-8 [DOI] [Google Scholar]
- 12. Allison J, Amako K, Apostolakis J, et al. Geant4 developments and applications. IEEE Trans Nucl Sci. 2006;53(1):270‐278. 10.1109/TNS.2006.869826 [DOI] [Google Scholar]
- 13. Allison J, Amako K, Apostolakis J, et al. Recent developments in Geant4. Nuclear Instruments and Methods in Physics Research Section A: Accelerators, Spectrometers, Detectors and Associated Equipment. 2016;835:186‐225. 10.1016/j.nima.2016.06.125 [DOI] [Google Scholar]
- 14. Ballarini F, Batkov K, Battistoni G, et al. The FLUKA code: overview and new developments. EPJ Nucl. Sci. Technol. 2024;10:16. 10.1051/epjn/2024015 [DOI] [Google Scholar]
- 15. Sato T, Iwamoto Y, Hashimoto S, et al. Recent improvements of the particle and heavy ion transport code system – PHITS version 3.33. J Nucl Sci Technol. 2024;61(1):127–135. 10.1080/00223131.2023.2275736 [DOI] [Google Scholar]
- 16. Kulesza JA, Adams TR, Armstrong JC, et al. MCNP®Code Version 6.3.0 Theory & User Manual. Tech. Rep. LA‐UR‐22‐30006. Los Alamos National Laboratory (LANL); 2022. [Google Scholar]
- 17. Bassler N, Hansen DC, Lühr A, Thomsen B, Petersen JB, Sobolevsky N. SHIELD‐HIT12A ‐ a Monte Carlo particle transport program for ion therapy research. J Phys Conf Ser. 2014;489(1):012004. 10.1088/1742-6596/489/1/012004 [DOI] [Google Scholar]
- 18. Arce P, Bolst D, Brown JMC, et al. Report on G4‐Med, a Geant4 benchmarking system for Med Phys applications developed by the Geant4 Medical Simulation Benchmarking Group. Med Phys. 2021;48(1):19‐56. 10.1002/mp.14226 [DOI] [PMC free article] [PubMed] [Google Scholar]
- 19. Lechner A, Ivanchenko V, Knobloch J. Validation of recent Geant4 physics models for application in carbon ion therapy. Nucl Instrum Methods Phys Res, Sect B. 2010;268(14):2343–2354. 10.1016/j.nimb.2010.04.008 [DOI] [Google Scholar]
- 20. Dedes G, Parodi K. Monte Carlo simulations of particle interactions with tissue in carbon ion therapy. Int J Part Ther. 2016;2(3):447‐458. 10.14338/IJPT-15-00021 [DOI] [PMC free article] [PubMed] [Google Scholar]
- 21. Collaboration G. Physics List Guide for Geant4. CERN; 2023. [Google Scholar]
- 22. Mancusi D, Boudard A, Cugnon J, David JC, Kaitaniemi P, Leray S. Extension of the Liège intranuclear‐cascade model to reactions induced by light nuclei. Phys Rev C. 2014;90(5):054602. 10.1103/PhysRevC.90.054602 [DOI] [Google Scholar]
- 23. Bolst D, Cirrone GA, Cuttone G, et al. Validation of Geant4 fragmentation for heavy ion therapy. Nuclear Instruments and Methods in Physics Research Section A: Accelerators, Spectrometers, Detectors and Associated Equipment. 2017;869:68‐75. 10.1016/j.nima.2017.06.046 [DOI] [Google Scholar]
- 24. Mancini‐Terracciano C, Caccia B, Colonna M, et al. Validation of Geant4 nuclear reaction models for hadron therapy and preliminary results with BLOB. In: World Congress on Medical Physics & Biomedical Engineering 2018; June 3–8, 2018; Prague, Czech Republic . 68/1:675–685. 10.1007/978-981-10-9035-6_126 [DOI] [Google Scholar]
- 25. Guatelli S, Bolst D, Francis Z, Incerti S, Ivanchenko V, Rosenfeld A. Physics models for Monte Carlo simulations in carbon ion therapy. State‐of‐the‐Art Reviews on Energetic Ion‐Atom and Ion‐Molecule Collisions. World Scientific; 2019:255–283. [Google Scholar]
- 26. Böhlen TT, Cerutti F, Dosanjh M, et al. Benchmarking nuclear models of FLUKA and GEANT4 for carbon ion therapy. Phys Med Biol. 2010;55(19):5833‐5847. 10.1088/0031-9155/55/19/014 [DOI] [PubMed] [Google Scholar]
- 27. Pak S, Cucinotta FA. Comparison between PHITS and GEANT4 Simulations of the heavy ion beams at the BEVALAC at LBNL and the Booster Accelerator at BNL. Life Sciences in Space Research. 2021;29:38‐45. 10.1016/j.lssr.2021.03.002 [DOI] [PMC free article] [PubMed] [Google Scholar]
- 28. Resch AF, Fuchs H, Georg D. Benchmarking GATE/Geant4 for 16O ion beam therapy. Phys Med Biol. 2017;62(18):N474. 10.1088/1361-6560/aa807e [DOI] [PubMed] [Google Scholar]
- 29. Dreindl R, Bolsa‐Ferruz M, Fayos‐Sola R, et al. Commissioning and clinical implementation of an independent dose calculation system for scanned proton beams. J Appl Clin Med Phys. 2024;25(5):e14328. 10.1002/acm2.14328 [DOI] [PMC free article] [PubMed] [Google Scholar]
- 30. Kozłowska WS, Böhlen TT, Cuccagna C, et al. FLUKA particle therapy tool for Monte Carlo independent calculation of scanned proton and carbon ion beam therapy. Phys Med Biol. 2019;64(7):075012. 10.1088/1361-6560/ab02cb [DOI] [PubMed] [Google Scholar]
- 31. Sarrut D, Arbor N, Baudier T, et al. The OpenGATE ecosystem for Monte Carlo simulation in Med Phys. Phys Med Biol. 2022;67(18):184001. 10.1088/1361-6560/ac8c83 [DOI] [PMC free article] [PubMed] [Google Scholar]
- 32. Grevillot L, Bertrand D, Dessy F, Freud N, Sarrut D. GATE as a GEANT4‐based Monte Carlo platform for the evaluation of proton pencil beam scanning treatment plans. Phys Med Biol. 2012;57(13):4223‐4244. 10.1088/0031-9155/57/13/4223 [DOI] [PubMed] [Google Scholar]
- 33. Aitkenhead AH, Sitch P, Richardson JC, Winterhalter C, Patel I, Mackay RI. Automated Monte‐Carlo re‐calculation of proton therapy plans using Geant4/Gate: implementation and comparison to plan‐specific quality assurance measurements. Br J Radiol. 2020;93(1114):20200228. 10.1259/bjr.20200228 [DOI] [PMC free article] [PubMed] [Google Scholar]
- 34. Winterhalter C, Taylor MB, Boersma D, et al. Evaluation of GATE‐RTion (GATE/Geant4) Monte Carlo simulation settings for proton pencil beam scanning quality assurance. Med Phys. 2020;47(11):5817‐5828. 10.1002/mp.14481 [DOI] [PubMed] [Google Scholar]
- 35. Grevillot L, Boersma DJ, Fuchs H, et al. Technical Note: GATE‐RTion: a GATE/Geant4 release for clinical applications in scanned ion beam therapy. Med Phys. 2020;47(8):3675‐3681. [DOI] [PubMed] [Google Scholar]
- 36. Grevillot L, Boersma DJ, Fuchs H, et al. The GATE‐RTion/IDEAL independent dose calculation system for light ion beam therapy. Front Phys. 2021;9:704760. 10.3389/fphy.2021.704760 [DOI] [Google Scholar]
- 37. Moyers MF, Wang Q, Deng Y, et al. Verification of an independent dose calculation method for portal‐specific QA of proton and carbon ion beams. Radiation Medicine and Protection. 2022;03(03):152‐157. 10.1016/j.radmp.2022.05.004 [DOI] [Google Scholar]
- 38. Grevillot L, Osorio Moreno J, Letellier V, et al. Clinical implementation and commissioning of the MedAustron Particle Therapy Accelerator for non‐isocentric scanned proton beam treatments. Med Phys. 2020;47(2):380‐392. 10.1002/mp.13928 [DOI] [PubMed] [Google Scholar]
- 39. Palmans H, Medin J, Trnková P, Vatnitsky S. Gradient corrections for reference dosimetry using Farmer‐type ionization chambers in single‐layer scanned proton fields. Med Phys. 2020;47(12):6531‐6539. 10.1002/mp.14554 [DOI] [PubMed] [Google Scholar]
- 40. Krämer M, Scholz M. Treatment planning for heavy‐ion radiotherapy: calculation and optimization of biologically effective dose. Phys Med Biol. 2000;45(11):3319‐3330. 10.1088/0031-9155/45/11/314 [DOI] [PubMed] [Google Scholar]
- 41. Scholz M, Kellerer AM, Kraft‐Weyrather W, Kraft G. Computation of cell survival in heavy ion beams for therapy. Radiat Environ Biophys. 1997;36(1):59‐66. 10.1007/s004110050055 [DOI] [PubMed] [Google Scholar]
- 42. Carlino A, Böhlen T, Vatnitsky S, et al. Commissioning of pencil beam and Monte Carlo dose engines for non‐isocentric treatments in scanned proton beam therapy. Phys Med Biol. 2019;64(17):17NT01. 10.1088/1361-6560/ab3557 [DOI] [PubMed] [Google Scholar]
- 43. Collaboration G . Geant4 source code (branch: geant4‐10.3‐release) Accessed January 17, 2025. https://github.com/Geant4/geant4/tree/geant4‐10.3‐release2017
- 44. Fuchs H, Elia A, Resch AF, et al. Computer‐assisted beam modeling for particle therapy. Med Phys. 2021;48(2):841‐851. 10.1002/mp.14647 [DOI] [PMC free article] [PubMed] [Google Scholar]
- 45. Grevillot L, Moreno JO, Fuchs H, et al. Implementation of Sphinx/Lynx as daily QA equipment for scanned proton and carbon ion beams. J Appl Clin Med Phys. 2023;24(4):e13896. 10.1002/acm2.13896 [DOI] [PMC free article] [PubMed] [Google Scholar]
- 46. Osorio J, Dreindl R, Grevillot L, et al. Beam monitor calibration of a synchrotron‐based scanned light‐ion beam delivery system. Z Med Phys. 2021;31(2):154‐165. 10.1016/j.zemedi.2020.06.005 [DOI] [PubMed] [Google Scholar]
- 47. Karger CP, Jäkel O, Hartmann GH, Heeg P. A system for three‐dimensional dosimetric verification of treatment plans in intensity‐modulated radiotherapy with heavy ions. Med Phys. 1999;26(0):2125‐2132. 10.1118/1.598728 [DOI] [PubMed] [Google Scholar]
- 48. Li Y, Hsi WC. Analysis of measurement deviations for the patient‐specific quality assurance using intensity‐modulated spot‐scanning particle beams. Phys Med Biol. 2017;62(7):2675‐2693. 10.1088/1361-6560/aa5dff [DOI] [PubMed] [Google Scholar]
- 49. Krzywinski M, Altman N. Visualizing samples with box plots. Nature Methods. 2014;11(2):119‐120. 10.1038/nmeth.2813 [DOI] [PubMed] [Google Scholar]
- 50. Kameoka S, Amako K, Iwai G, et al. Dosimetric evaluation of nuclear interaction models in the Geant4 Monte Carlo simulation toolkit for carbon‐ion radiotherapy. Radiol Phys Technol. 2008;1(2):183‐187. 10.1007/s12194-008-0026-1 [DOI] [PubMed] [Google Scholar]
- 51. Geng C, Gates D, Bronk L, Ma D, Guan F. Physical parameter optimization scheme for radiobiological studies of charged particle therapy. Physica Med. 2018;51:13‐21. 10.1016/j.ejmp.2018.06.001 [DOI] [PMC free article] [PubMed] [Google Scholar]
- 52. Low DA, Harms WB, Mutic S, Purdy JA. A technique for the quantitative evaluation of dose distributions. Med Phys. 1998;25(5):656‐661. 10.1118/1.598248 [DOI] [PubMed] [Google Scholar]
- 53. Hartl L. Optimization of physics settings in GATE‐RTion/Geant4 for independent dose calculation in carbon ion beam therapy. Master's thesis. Technische Universität Wien; 2024. 10.34726/hss.2024.112244 [DOI] [Google Scholar]
Associated Data
This section collects any data citations, data availability statements, or supplementary materials included in this article.
Supplementary Materials
Supporting Information