

Abstract
Objective:
Adverse drug event (ADE) is a significant challenge to public health. Since data mining methods have been developed to identify signals of drug-drug interaction-induced (DDI-induced) or drug-host interaction-induced (DHI-induced) ADE from real-world data, we aim to develop a new method to detect adverse drug-drug interaction with a special awareness on patient characteristics.
Methods:
We developed a trajectory-informed model (TIM) to identify signals of adverse DDI with a special awareness on patient characteristics (i.e., drug-drug-host interaction [DDHI]). We also proposed a study design based on an optimal selection of within-subject and between-subjects controls for detecting ADEs from real-world data. We analyzed a large-scale US administrative claims data and conducted a simulation study.
Results:
In administrative claims data analysis, we developed optimally matched case-control datasets for potential ADEs including acute kidney injury and gastrointestinal bleeding. We identified that an optimal selection of controls had a higher AUC compared to traditional designs for ADE detection (AUCs: 0.79–0.80 vs. 0.56–0.76). We observed that TIM detected more signals than reference methods (odds ratios: 1.13–3.18, P < 0.01), and found that 36 % of all signals generated by TIM were DDHI signals. In a simulation study, we demonstrated that TIM had an empirical false discovery rate (FDR) less than the desired value of 0.05, as well as > 1.4-fold higher probabilities of detection of DDHI signals than reference methods.
Conclusions:
TIM had a high probability to identify signals of adverse DDI and DDHI in a high-throughput ADE mining while controlling false positive rate. A significant portion of drug-drug combinations were associated with an increased risk of ADEs only in specific patient subpopulations. Optimal selection of within-subject and between-subjects controls could improve the performance of ADE data mining.
Keywords: Adverse drug event, Drug-drug interaction, Drug-host interaction, Drug-drug-host interaction, Patient characteristics
1. Introduction
Adverse drug events (ADEs) are accountable for more than 2 million emergency department visits and hospitalizations each year in the United States [1]. Adverse drug-drug interaction (DDI) is an important cause of ADE [2,3]. Additionally, patients with certain characteristics are at a higher risk of ADEs due to drug-host interaction (DHI) [4]. Adverse drug-drug-host interaction (DDHI) may also have a high prevalence. For instance, adverse DDI can be as high as 6-fold more frequent in the older adults compared to the general population [2], and 1.5-fold more prevalent in females compared with males [5].
The development of large-scale real-world data (RWD) facilitates the detection of signals of adverse DDI and DHI, as RWD includes adequate sample sizes on drug-drug and drug-characteristic combinations. Pharmacoepidemiologic designs are often used to derive analytical data and control confounding effect for RWD-based ADE mining [6]. Traditional pharmacoepidemiologic designs utilize either within-subject comparison (e.g., case-crossover design and self-controlled case series design) or between-subjects comparison (e.g., case-control design and cohort design) [6–10]. For instance, the case-crossover design is based on an ADE case, a case period (i.e., the period immediately prior to the case), and a within-subject control period (i.e., the period prior to the corresponding case and washout period). Under the within-subject comparison framework, the case-crossover design can control for short-term time-invariant confounding effects and is powerful for detecting acute ADE, but it is less sensitive to chronic ADEs induced by prolonged drug exposure [6,7]. Alternatively, the between-subjects comparison framework has equal power to identify both acute and chronic ADEs but is less efficient at controlling unobserved confounding [6].
Statistical models and data mining algorithms have been developed to detect signals of adverse DDI or DHI. Frequentist approaches include logistic regression model [11], conditional logistic regression model [12], and likelihood ratio test (LRT) for detecting DDI [13], as well as LRT for detecting DHI [4]. These methods can be integrated with false positive control methods (e.g., Benjamini and Hochberg’s approach) to control false discovery rate (FDR) in high-throughput mining. Bayesian models for detecting DDI include Bayesian confidence propagation neural network (BCPNN) and shrinkage observed-to-expected ratio [14,15], both of which can penalize drug-drug-ADE associations with a lower sample size. Empirical Bayes models include propensity score-adjusted three-component mixture model for detecting DDI and precision mixture risk model for detecting DHI [16,17]. These models have a higher probability of detection while controlling FDR. For data mining algorithms, apriori algorithm can prioritize DDI signals with a higher frequency [18], and graphic model can reveal the sequential risks of ADE from single drugs to two-drug combinations [19].
In this work, we aimed to identify signals of adverse DDI from RWD with a special awareness on patient characteristics (i.e., adverse DDHI). First, we developed a control selection approach that used optimally selected within-subject and between-subjects controls to improve performance of real-world data-based ADE mining. Second, we developed a trajectory-informed model (TIM) to detect drug-drug combinations with a higher risk of ADEs in all individuals (i.e., adverse DDI) or only in certain subpopulations (i.e., adverse DDHI). The rest of the manuscript is organized as follows. Section 2 presents the data source and the proposed approaches. Section 3 illustrates the utilization of the proposed approaches by mining an US nationwide administrative claims data and simulation study. Section 4 includes our discussion and conclusion.
2. Methods
2.1. Data preparation
We used Optum’s de-identified Clinformatics® Data Mart Database (Clinformatics), which is derived from a database of administrative health claims for members of large commercial and Medicare Advantage health plans. The dataset included de-identified information on insurance coverage, health encounters, diagnoses, and pharmacy claims. Fig. 1A&B illustrate the methods used to derive the analytical dataset. In short words, we employed specific International Classification of Diseases (ICD) codes to identify potential ADEs, including acute kidney injury (AKI) and gastrointestinal (GI) bleeding [20,21]. We constructed case-control datasets for potential ADEs, with optimal controls selected from within-subject and between-subjects comparisons. Outcomes and expectations for drug-drug-ADE combinations were computed with a special awareness of patient characteristics. Without loss of generality, we describe the methodology for one ADE in the following sections and Supplemental Material S1.
Fig. 1.
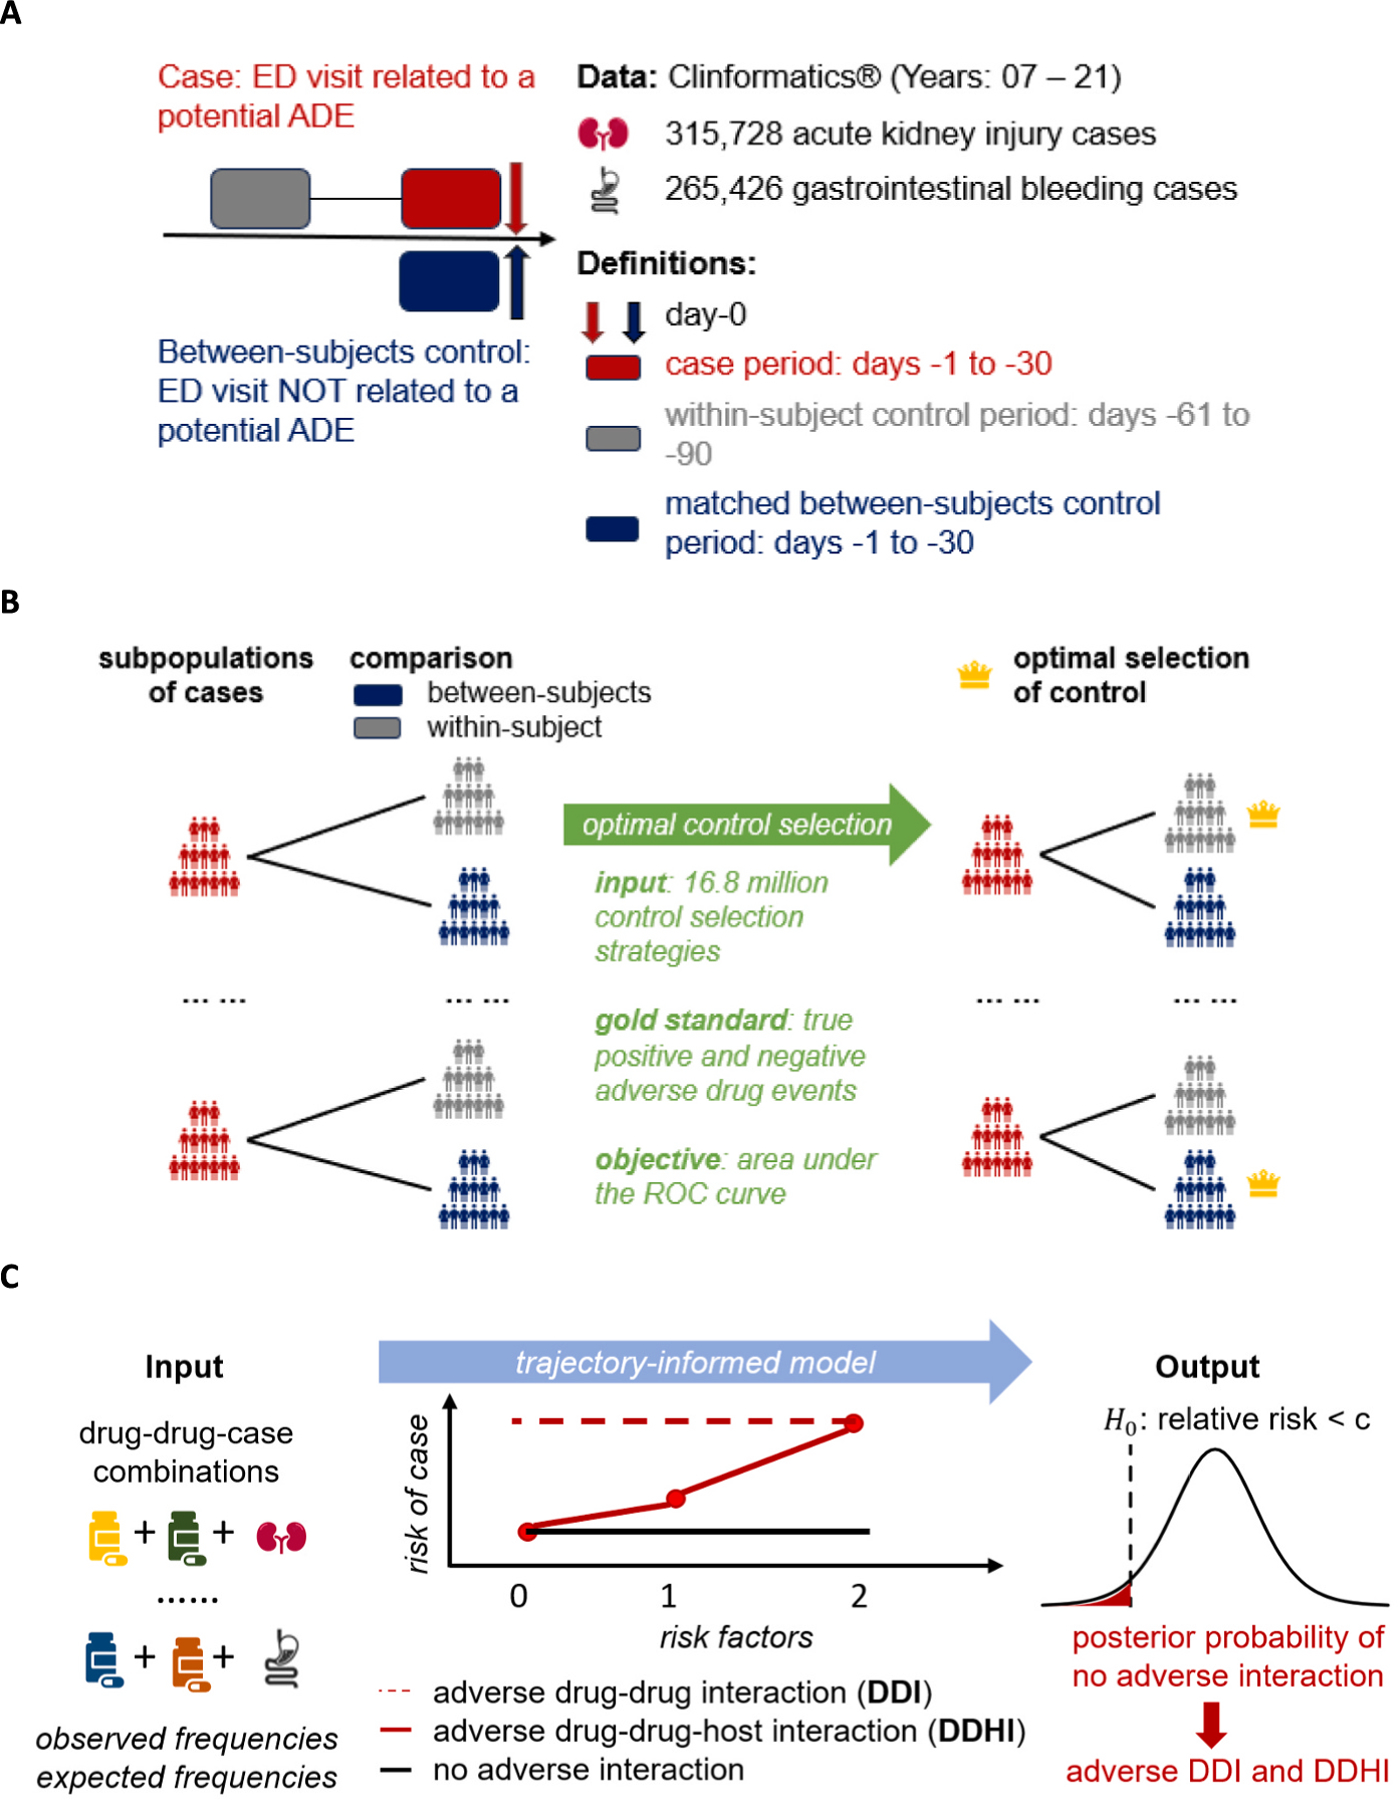
Overview of the methods. A. Study design and definitions. B. Optimal control selection from within-subject and between-subjects controls. C. Trajectory-informed model (TIM) and adverse drug-drug interaction detection. Abbreviations: ED = Emergency Department, ADE = Adverse Drug Event.
2.1.1. Study design
Fig. 1A illustrates the study design, as well as definitions of cases, within-subject controls, and between-subjects controls. We included “new” emergency department (ED) visits from 2007 to 2021 that had > 365 days of enrollment and no ED visits within 180 days prior to the corresponding ED visit dates. A case was defined as an individual’s earliest known ED visit with an ADE-related diagnosis in the first or second diagnosis position. The case index date was defined as the corresponding ED visit date. The case period was defined as 30 to 1 day prior to the case index date. We excluded cases with prior ADE-related diagnoses before the corresponding case index date.
For within-subject comparison, we defined the control period as 90 to 61 days prior to the case index date (Fig. 1A). For between-subjects comparison, ED visits without the ADE were matched to the cases based on gender, race, matching variables (Table S1), age (±2 years), and year-month of the ED visit (±2 months). Additionally, the between-subjects controls had no prior ADE-related diagnoses, and their corresponding ED visit dates were defined as the between-subjects control index dates. The matched between-subjects control period was defined as 30 to 1 days prior to the between-subjects control index date. We assessed drug exposure data (yes/no) for all case periods, within-subject control periods, and matched between-subjects control periods.
2.1.2. Optimal control selection
Fig. 1B illustrates the optimal control selection approach. We stratified all cases into 24 subpopulations based on patient characteristics (Table S1). For instance, the 24 subpopulations for AKI were derived from 3 two-level characteristics and 1 three-level characteristic (i.e., 2 × 2 × 2 × 3 = 24 subpopulations) including: (i) gender (female and male), (ii) age (≥65 and < 65), (iii) race (Black and non-Black), and (iv) risk factor (0 = no risk factor, 1 = with renal disease or other risk factors [Table S1], and 2 = with renal disease plus other risk factors) [22,23]. For each subpopulation, both within-subject and between-subjects controls could be selected, resulting in 224 ≈16.8 million potential control selection strategies. We enumerated all control selection strategies. For each strategy, we computed the z-score for gold-standard drug-ADE pairs [24] (Supplemental Material S2) and calculated the area under the curve (AUC) based on the z-scores. The optimal control selection strategy was the one with the highest AUC.
2.1.3. Analytical data
We assessed the final drug exposure data for all cases and their optimal controls during the corresponding periods (Fig. 1A). Drug-specific risk factors for the ADE were identified for each drug (Supplemental Material S3). Subsequently, individuals were classified into three cohorts for each drug-drug combination: (i) individuals without any risk factor; (ii) individuals with risk factor(s) for only one drug; and (iii) individuals with risk factors for both drugs.
Outcomes were defined as the frequencies of individuals in each cohort who had the drug-drug combination in case periods but not the corresponding control periods (Supplemental Material S4). For all outcomes, we computed their corresponding expectations assuming no drug-drug interaction (DDI) (Supplemental Material S4). Please note that each drug-drug-ADE combination had three outcome-and-expectation pairs for the three cohorts defined previously. The final analytical dataset included outcomes and expectations for all drug-drug-ADE combinations.
2.2. Trajectory-informed model (TIM)
Fig. 1C illustrates the proposed method for detecting signals of adverse DDI and drug-drug-host interaction (DDHI). Please note that we defined three cohorts for each drug-drug-ADE combination (section 2.1.3), including individuals without risk factor, individuals with risk factor(s) for only one drug, and individuals with risk factors for both drugs. We hypothesize that the relative risk (RR) of a drug-drug-ADE combination exhibits one of three trajectories based on the expected values of RR across the three cohorts. Drug-drug combinations in the first trajectory have a neutral expected RR in all three cohorts representing most drug-drug combinations without an adverse interaction. Drug-drug combinations in the second trajectory have a neutral expected RR in the cohort without risk factor but have a higher expected RR in cohorts with risk factors. The second trajectory represents potential adverse DDHI. Drug-drug combinations in the third trajectory have a higher expected RR in all three cohorts representing potential adverse DDI.
Let subscript indicate the -th drug-drug-ADE combination and subscript indicate the -th cohort. Let and denote the observed outcome and the corresponding expectation, respectively (section 2.1.3). Let and denote the unobserved trajectory and the value of the RR, respectively. Additionally, let denote the Poisson distribution function, let denote the gamma distribution function, and let denote the quasi-negative binomial distribution function.
2.2.1. Model specification and fitting
We assumed:
| (1) |
| (2) |
For associated with in equation 2, we set for the cohort without risk factor, for the cohort with risk factor(s) for only one drug, and for the cohort with risk factors for both drugs. Please note that equations 1&2 represent our assumptions on the three trajectories. For a drug-drug-ADE combination, implies that the expected in all cohorts (i.e., no adverse interaction); implies that the expected in the cohort without risk factor and the trajectory-adjusted expected in cohorts with risk factors (i.e., adverse DDHI), and implies that the expected in all cohorts (i.e., adverse DDI).
The model parameters in equations 1&2 could be obtained by maximizing the observed likelihood function. Let denote all parameters. The observed distribution for a drug-drug-ADE combination (i.e., for a fixed ) could be expressed as
| (3) |
The posterior probabilities of a drug-drug-ADE combination belonging to each trajectory (i.e., ), and the posterior distribution of the RR could be expressed as:
| (4) |
| (5) |
Let denote the digamma function. The trajectory-adjusted expectation of log-RR for each cohort could be expressed as:
| (6) |
The trajectory-adjusted empirical Bayes geometric mean (EBGM) [25] of RR for each cohort could be defined as:
| (7) |
The model parameters could be estimated by
| (8) |
2.2.2. Adverse interaction detection
Let be a threshold for RR (i.e., for , 1.25 or 1.5). For a drug combination in the first or the third trajectory (i.e., or 2 in equation 1), the null hypothesis of no adverse interaction could be defined as . For a drug combination in the second trajectory (i.e., in equation 1), the null hypothesis of no adverse interaction could be defined as under equation 2 (i.e., no excessive risk in the cohort with risk factors). The overall posterior probability of the null hypothesis could be expressed as:
| (9) |
The decision rule for using the posterior probability of null hypothesis to generate a signal could be:
| (10) |
In equation (10), represents the threshold for the posterior probability of the null hypothesis as defined in equation (9). Additionally, since quantify the false discovery rate (FDR) of the signals, the decision rule in equation (10) could be applied to control the FDR in high-throughput DDI mining. As described in Ahmed et al. [26], the estimated FDR for mining all drug-drug-ADE combinations is:
| (11) |
Further, signals of DDHI can be detected by (equation (9), (equation (7) and (equation (4) as
| (12) |
2.3. Performance evaluation
2.3.1. Comparative methods
First, we computed posterior probability of no adverse DDI without leveraging patient characteristics. Assuming no DDHI, equation 2 degenerates to a two-component mixture model (2CMM):
| (13) |
The posterior probability of the null hypothesis under 2CMM can be expressed as:
| (14) |
We selected additional reference approaches including conditional logistic regression model (CLRM) and the Benjamini and Hochberg’s approach; the World Health Organization-used (WHO-used) shrinkage method [15,27]; and the subgroup ratio test (SRT) based on largest effect size and the SRT based on inverse variance weighting [4,12,28]. Please see Supplemental Material S5 for details.
2.3.2. Additional performance evaluations
First, we conducted simulation studies. Please see Supplemental Material S6 for details. In short words, we simulated datasets using the expectations (section 2.1.3) and estimated parameters (i.e., in equation (3) in Clinformatics data analysis. The simulation process included: (A) to generate true risk trajectories (i.e., ) under equation 1, and (B) to generate true RRs (i.e., ) and outcomes (i.e., ) under equation 2. In each simulation, we defined true positive for adverse DDI as , true positive for DDHI as and for ; and true negative as and for all . We determined the predicted positive as FDR < 0.05 and the predictive negative as FDR ≥ 0.05 for FDR under TIM (equation (9), as well as predicted positives and negatives under reference methods (Supplemental Material S5). We simulated 1,000 datasets and measured the empirical FDR, probability of detection (PD, i.e., sensitivity), false omission rate (FOR), and c-statistics based on all simulations.
Second, we conducted a cross-data-source validation. Please see Supplemental Material S7 for details. In short words, we used a US statewide electronic health record (EHR) data (Indiana Network of Patient Care [INPC] data; years: 2016–2021). We used the same definitions as described in Clinformatics data analysis to derive data on drug combinations from matched case-control pairs for AKI and GI bleeding. We defined true positive and true negative as Clinformatics-based FDR < 0.05 and Clinformatics-based FDR ≥ 0.05, respectively. We used Clinformatics data analysis-derived model parameters to estimate FDR for drug combinations in INPC and computed the AUC value.
3. Results
3.1. Analytical dataset
The final analytical dataset from Clinformatics® included 315,728 matched case-control periods pairs for AKI and 265,426 matched case-control periods pairs for GI bleeding, and approximately one hundred thousand drug-drug-ADE combinations. The demographics of the cases (Table S4) and the optimal control selection strategy (Table S5) were presented in Supplemental Material S8. Fig. 2 shows the AUC values for gold standard-defined drug-ADE pairs using only within-subject comparison-based controls, only between-subjects comparison-based controls, and optimally selected controls. We observed that optimally selected controls had a higher AUC for both AKI and GI bleeding (0.79–0.80 vs. 0.56–0.76) (Fig. 2).
Fig. 2.
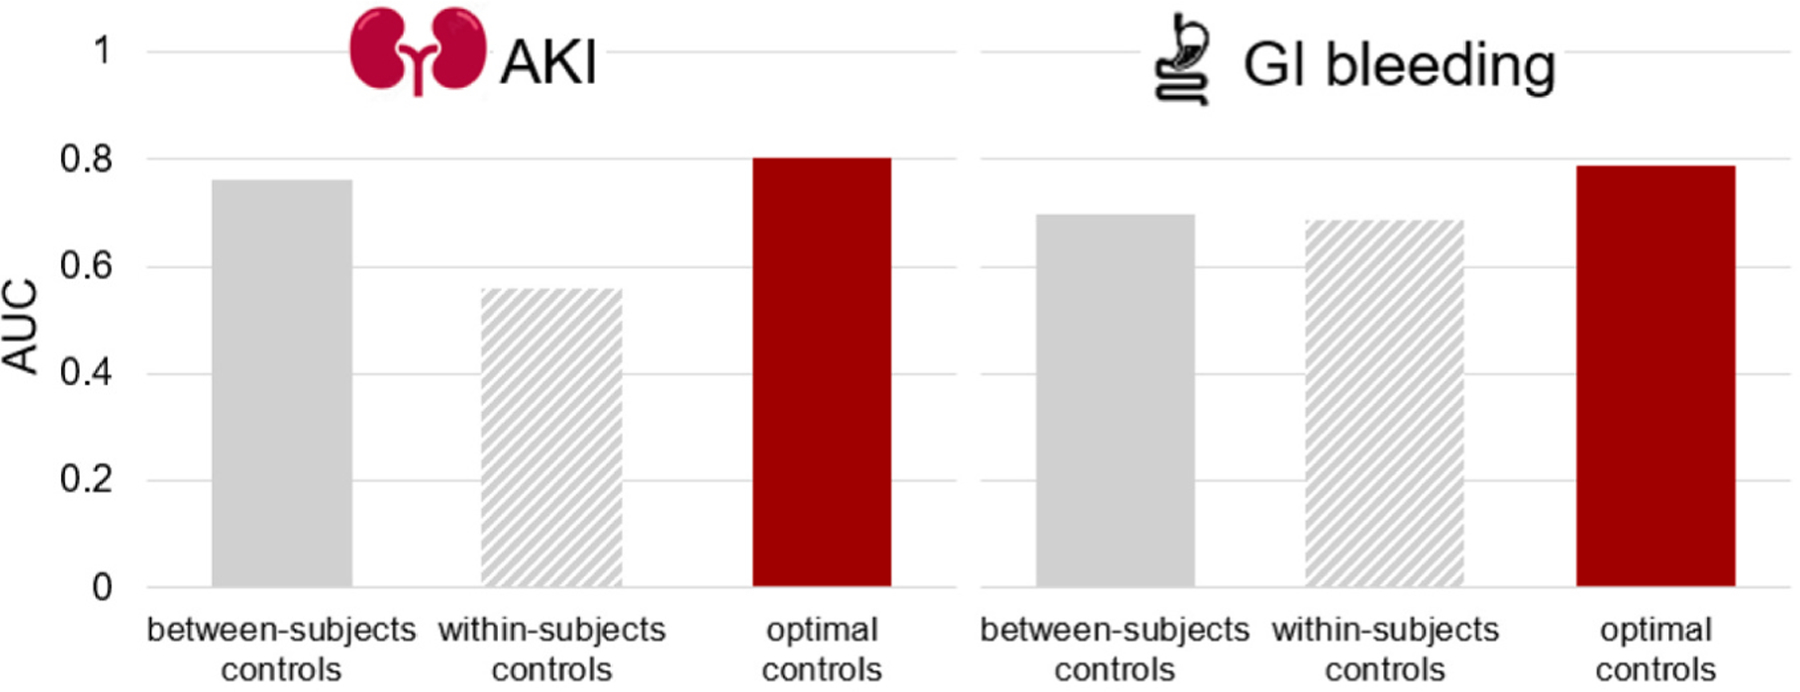
Area under the curve based on gold standard-defined drug-adverse-drug-event pairs for different control selection strategies.
3.2. Signals of adverse drug-drug interaction (DDI)
We used the following methods to detect signals: trajectory informed model (TIM), shrinkage method, two-component mixture model (2CMM), conditional logistic regression model (CLRM) with Benjamini and Hochberg’s approach, subgroup ratio test (SRT) based on largest effect size (SRT-LES), and SRT based on inverse variance weighting (SRT-IVW). For all drug combinations, under TIM, 59 % were estimated to have a neutral expected relative risk (RR) in all individuals; 37 % were estimated to have a neutral expected RR in individuals without risk factors and a higher trajectory-adjusted expected RR in individuals with risk factors; and 4 % of drug combinations were estimated to have a higher expected RR in all individuals. Alternatively, under 2CMM, 92 % of all drug combinations were estimated to have a neutral expected RR in all individuals, and 8 % of drug combinations were estimated to have a higher expected RR in all individuals. Full results on fitted parameters for TIM and 2CMM were presented in Table S6 (Supplemental material S8).
For testing adverse DDI, TIM identified 11,791 signals, shrinkage method identified 11,408 signals, 2CMM identified 5,526 signals, and CLRM, SRT-LES and SRT-IVW together identified 36 signals (Fig. 3A). TIM compared with reference methods identified more signals among all drug combinations (odds ratio [OR] = 1.13, P < 0.001; Fig. 3B), and had a 3.18-fold higher OR of detection among drug combinations with frequencies ≥ 10 in cases (Fig. 3B). We found that TIM-only compared to non-TIM-only signals had increased posterior probabilities of drug-drug-host interaction (DDHI; Fig. 3C). Additionally, TIM identified 2,595 signals for testing expected RR > 1.25, and 833 signals of DDI for testing expected > 1.5 (Fig. 3D), which were shown in Table S7.
Fig. 3.
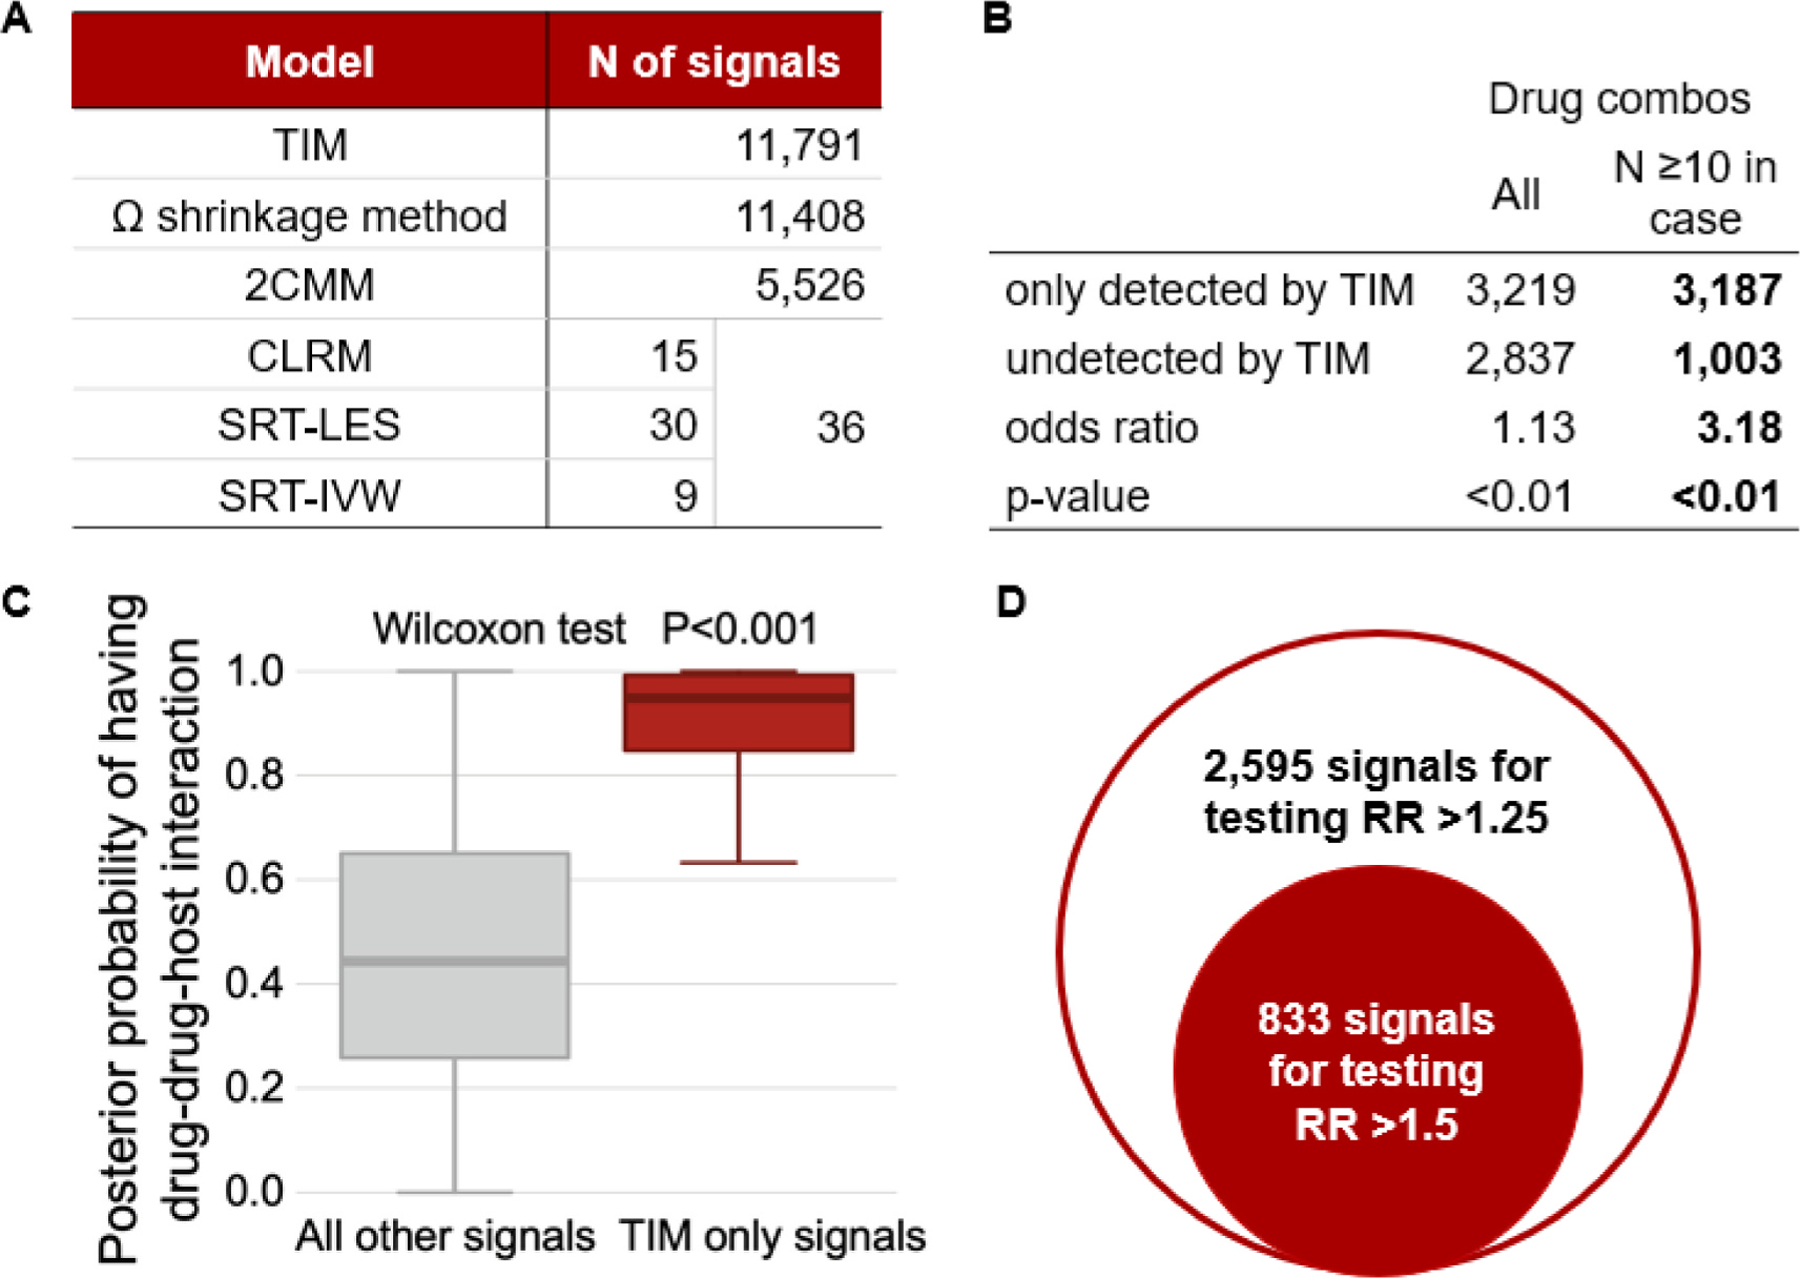
Signals of adverse interactions. A. Frequency of signals. B. Signals detected by trajectory-informed model (TIM) and other reference methods. C. Box plot of posterior probabilities of having adverse drug-drug-host interaction. D. Signals with higher relative risk (RR) under trajectory-informed model (TIM). Abbreviations: TIM = trajectory-informed model; 2CMM = 2-component mixture model; CLRM = conditional logistic regression model; SRT-LES = subgroup ratios test (SRT) based on largest effect size; SRT-IVW = subgroup ratio test based on inverse variance weighting.
3.3. Signals of adverse drug-drug-host interaction (DDHI) under TIM and risk factors
We defined signals of DDHI under TIM as: (A) FDR < 0.05 for testing the expected RR, (B) the maximum trajectory-adjusted empirical Bayes geometric mean (EBGM) of RR for three cohorts > 1, and (C) posterior probability to have a neutral expected RR in individuals without risk factor and a higher expected RR in individuals with risk factors (PDDHI, i.e., in equation (4) > 0.8. Fig. 4A shows the numbers of signals of adverse DDHI detected by TIM. Among all signals of DDHI detected by TIM, approximately 62 % were only detected by TIM, but not by other methods. The percentages of signals of adverse DDHI were 36 %, 49 % and 29 % for signals with expected RR > 1, RR > 1.25 and RR > 1.5, respectively (Fig. 4A).
Fig. 4.
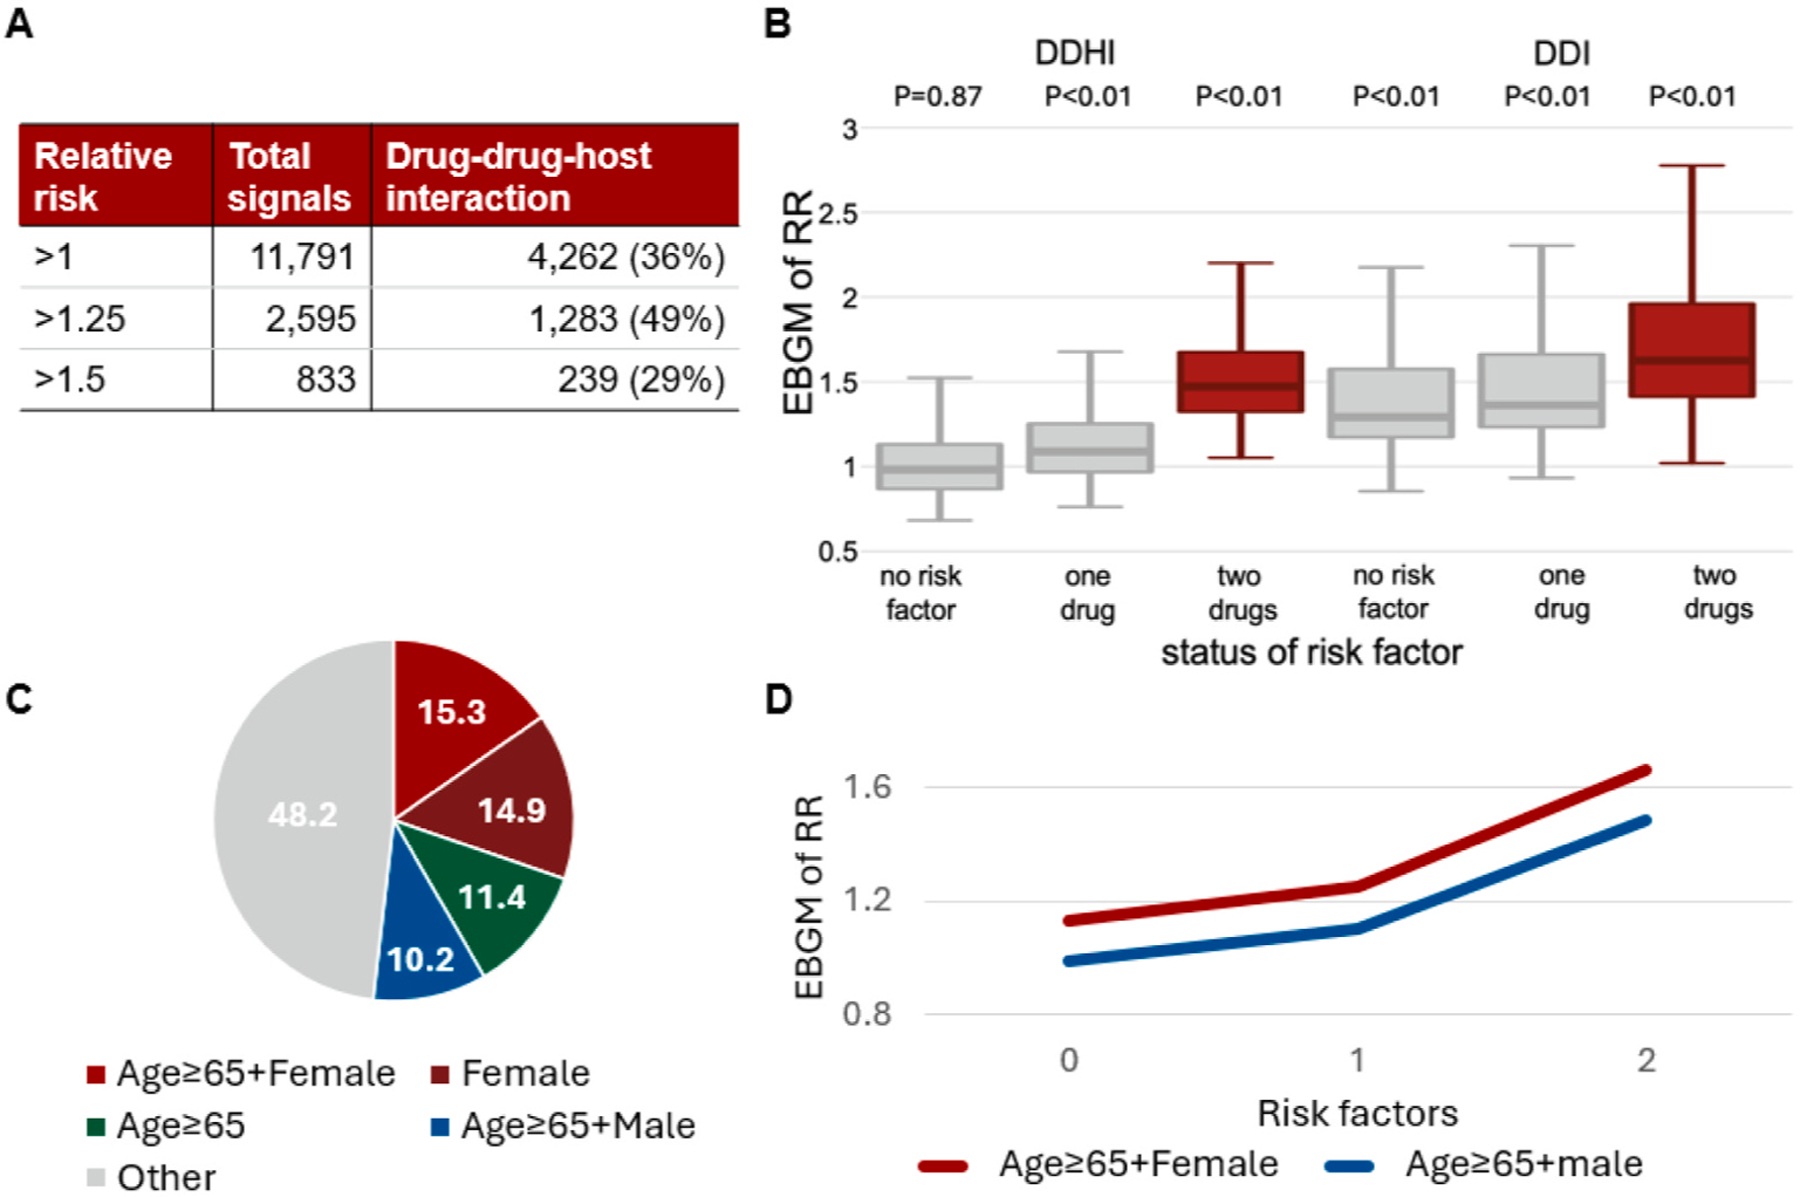
Signals of adverse drug-drug-host interaction. A. Frequencies of signals. B. The empirical Bayes geometric means (EBGM) of relative risks (RR) for all drug-drug-ADE combinations stratified by status of risk factor. C. Distribution of risk factors for drug combinations. D. The risk trajectories for signals of drug-drug-host interactions with two risk factors.
Fig. 4B shows the trajectory-adjusted EBGM of RR for all drug-drug-ADE combinations stratified by status of risk factor (i.e., without risk factor, with risk factor for only one drug, and with risk factors for both drugs) and type of signal (DDHI and non-DDHI). Please note that: (A) both DDHI and non-DDHI signals had FDR < 0.05 for testing the expected RR > 1, and (B) DDHI signals and non-DDHI signals had PDDHI > 0.8 and ≤ 0.8, respectively. We observed DDHI signals only had P < 0.01 (Wilcoxon signed rank test) for testing EBGM of RRs = 1 in individuals with risk factors, while non-DDHI signals had P < 0.01 (one-sample Wilcoxon signed rank test) for testing EBGM of RRs = 1 regardless of status of risk factor.
We observed 70 % of drug combinations had different risk factors between the two drugs (e.g., female gender as the risk factor for one drug, and age ≥ 65 as the risk factor for the other drug), while 30 % of drug combinations had a common risk factor for both drugs (e.g., female gender as the risk factor for both drugs). The top 4 frequent risk factors for drug combinations (i.e., female gender + age ≥ 65, female gender [for both drugs], age ≥ 65 [for both drugs], and male gender + age ≥ 65) were jointly involved in 52 % signals of DDHI (Fig. 4C). Fig. 4D illustrated the risk trajectories for signals of DDHI (i.e., medians of trajectory-adjusted EBGM of RRs) with “female gender + age ≥ 65” and “male gender + age ≥ 65” as risk factors, in which the risk trajectory was higher for older females than older males.
Fig. 5A–D shows exemplified signals with potential adverse DDHI uniquely detected by TIM. For AKI, acetaminophen-indomethacin combination had a higher EBGM of RR in female individuals with heart disease (Fig. 5A), and omeprazole-rosuvastatin combination had a higher EBGM of RR in female individuals with renal disease (Fig. 5B). For GI bleeding, both cephalexin-warfarin and rivaroxaban-rosuvastatin combination all had higher EBGMs of RR in female individuals with age ≥ 65 (Fig. 5C&D).
Fig. 5.
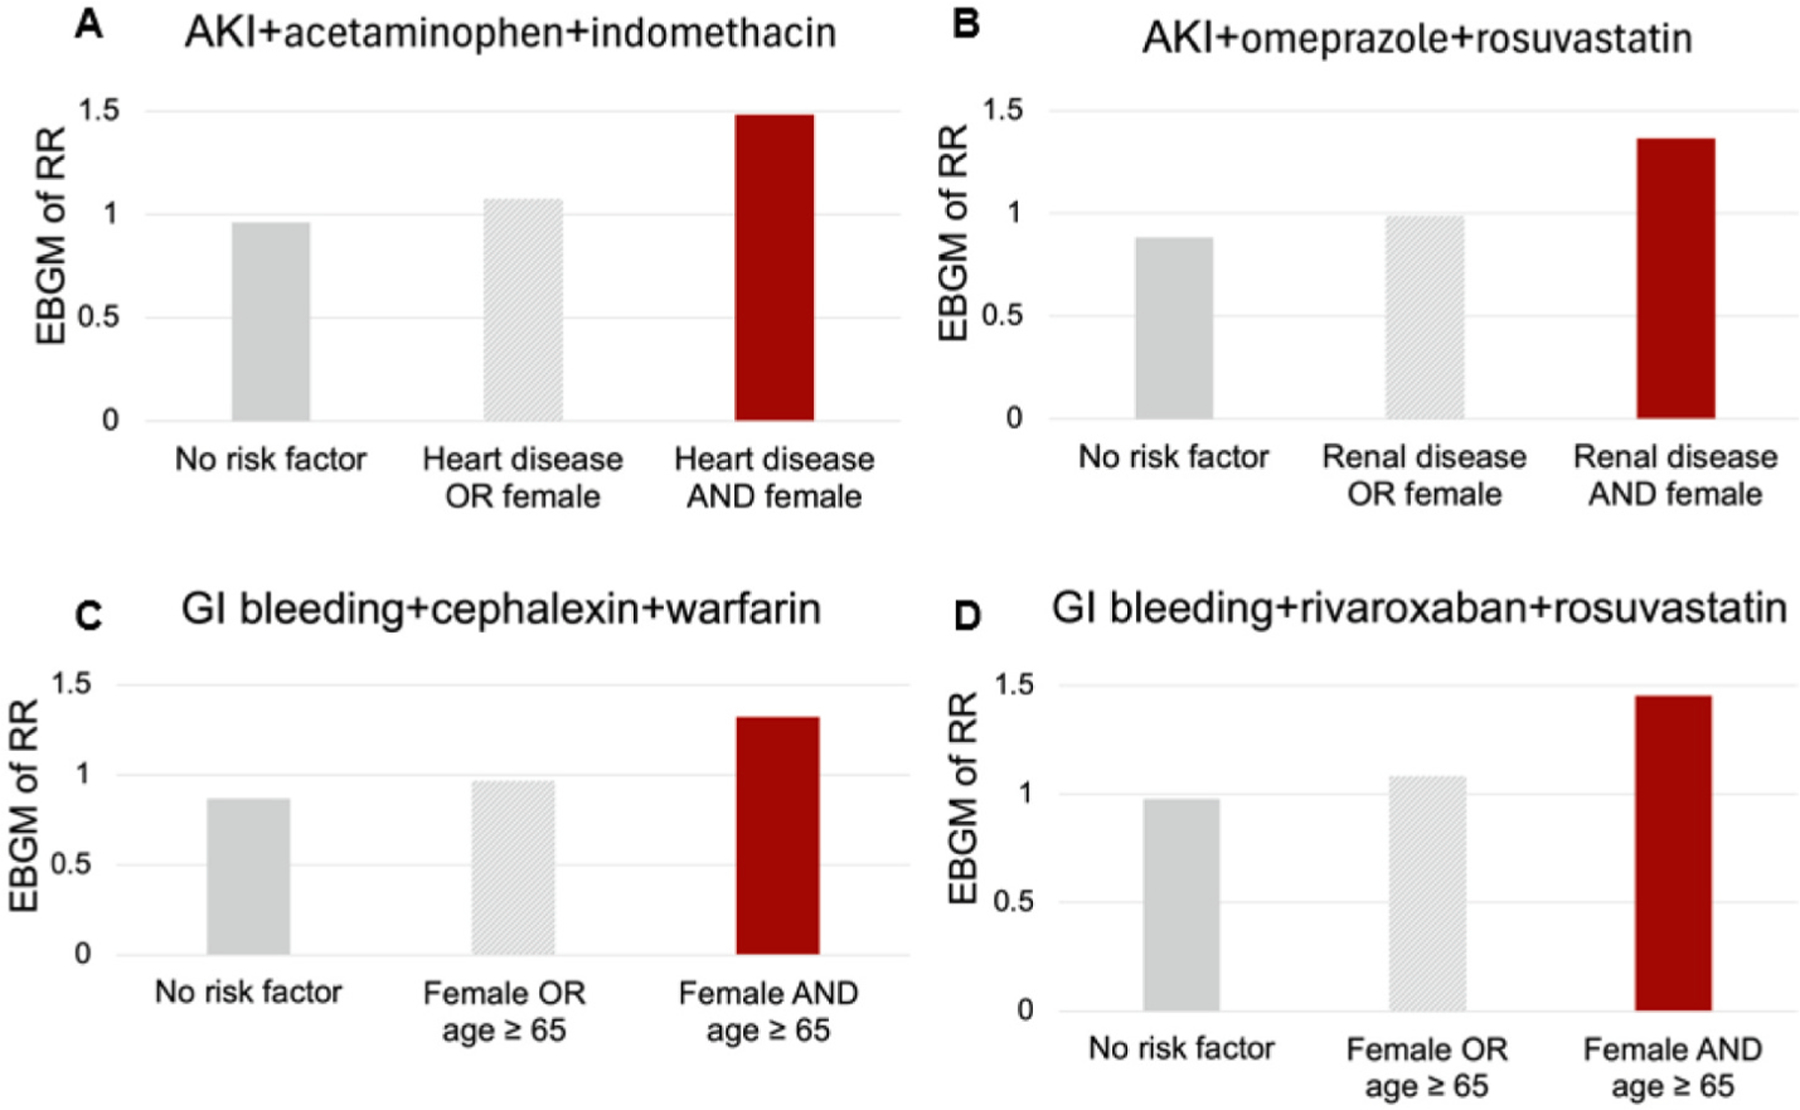
Exemplified signals with potential adverse DDHI uniquely detected by trajectory-informed model. A. Acetaminophen-indomethacin combination and acute kidney injury. B. Omeprazole-rosuvastatin combination and acute kidney injury. C. Cephalexin-warfarin combination and gastrointestinal (GI) bleeding. D. Rivaroxaban-rosuvastatin combination and gastrointestinal (GI) bleeding.
3.4. Simulation-based performance evaluation
Fig. 6A–C present the empirical FDR, false omission rate (FOR), and C-statistic for adverse interaction detection, respectively. Additionally, Fig. 6D presents the probability of detection (PD) both adverse DDI and DDHI, and Fig. 6E presents the PD for adverse DDHI. All methods demonstrated appropriate control of false positives, with empirical FDRs below the deserved level at 5 % (Fig. 6A). TIM outperformed all reference methods on PD for DDHI signals (14 % for TIM versus 0.4–10 %, Fig. 6E). Tim had higher FOR values (56 % for TIM versus 58–63 %; Fig. 6B), C-statistics (64 % for TIM versus 52–61 %; Fig. 6C), and PD (28 % for TIM versus 6–21 %; Fig. 6D) than two-component mixture model (2CMM), conditional logistic regression model (CLRM) with Benjamini and Hochberg’s approach, subgroup ratio test (SRT) based on largest effect size (SRT-LES), and SRT based on inverse variance weighting (SRT-IVW). TIM compared with shrinkage method had similar FOR, C-statistics and PD.
Fig. 6.
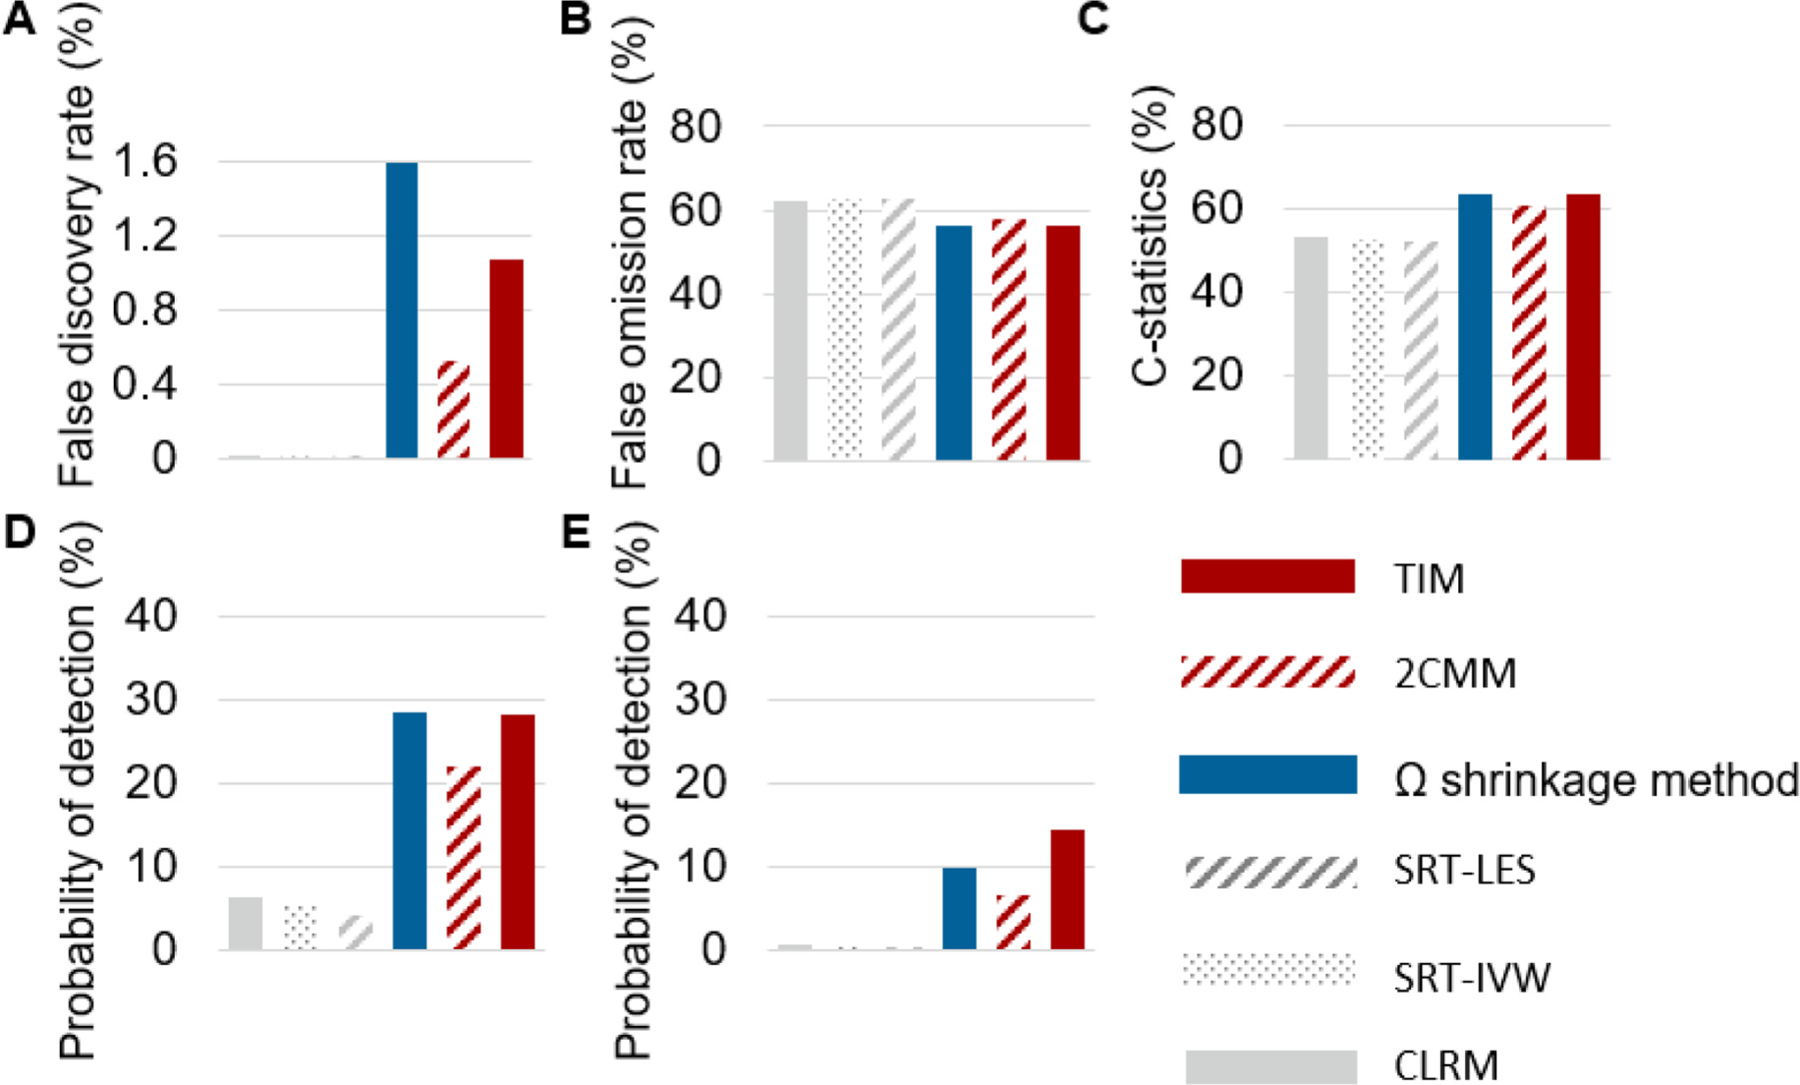
Simulation results. A. False discovery rate. B. False omission rate. C. C-statistics. D. Probability of detecting adverse interaction. E. Probability of detecting adverse drug-drug-host interaction.
4. Discussion
We developed a trajectory informed model (TIM) to identify signals of adverse drug-drug interaction (DDI) and drug-drug-host interaction (DDHI). Additionally, we proposed an optimal control selection approach to improve adverse drug event (ADE) data mining. We applied the proposed approaches to large-scale administrative claims data, inspected approximately one hundred thousand drug-drug-ADE combinations involving AKI and GI bleeding, and detected signals of DDI and DDHI at a low false positive rate. We observed that TIM demonstrated proper false positive control and improved probability to detect signals, in particular for signals of DDHI. We also identified that an optimal selection of within-subject and between-subjects controls had a higher AUC value compared to using one type of controls only.
TIM identified more signals in administrative claim data analysis compared with other approaches without leveraging patient characteristics (Fig. 3A&B). Such a pattern is in concordance with the simulation study, in which TIM had an improved probability of detection as it is particularly sensitive to DDHI (Fig. 6E). Despite that TIM generated a significantly higher number of signals, the false positive control was assured due to TIM demonstrated proper false positive control in simulation study (Fig. 6A). TIM compared with all other methods detects more signals among all drug combinations (odds ratio [OR] = 1.13, P < 0.01, Fig. 3B), and has a much higher power of detection among drug combinations with frequencies ≥ 10 in cases (OR = 3.18, P < 0.01, Fig. 3B). This could be due to the WHO-used shrinkage method is sensitive to drug-combinations with a lower sample size [28, 15,27], but might be less powerful to detect signals of DDHI. Additionally, the low probability of detection for frequentist methods could be due to over-conservative on false positive control under the Benjamini and Hochberg’s approach [16,29]. Besides to have a higher probability of detection, TIM expands the existing methods with respect to detect signals of DDHI that are not detected by other methods (Fig. 3C). In fact, among all signals of DDHI detected by TIM, 62 % are only detected by TIM but not detected by other methods.
In our analysis, 37 % of all drug-drug-ADE combinations (Table S6) were estimated to have a neutral expected relative risk (RR) in individuals without risk factor and a higher trajectory-adjusted expected RR in individuals with risk factors, suggesting adverse DDHI could have a high prevalence. In fact, we identified that 29–49 % of all signals under TIM were signals of DDHI for testing the expected RR > 1–1.5 (Fig. 4A). It is worthy to note that two drugs within a potential drug-drug combination may share a same risk factor such female gender or age ≥ 65 years (Fig. 4C), suggesting a potential increased risk of ADE in older adults and females, which agrees with the literature [2,5]. TIM can reveal the relationships between drug-combination exposure, risk of ADE, and composite risk factors (e.g., female gender as a risk factor for one drug, and age ≥ 65 for the other drugs; Fig. 4D and Fig. 5). We would like to discuss a few signals of DDHI involving composite risk factors (Fig. 5A–D).
For AKI and acetaminophen-indomethacin combination (Fig. 5A), an increased risk is observed only in females with heart disease. As all of acetaminophen, indomethacin, female gender, and heart disease could increase risk of AKI [22,23,30,31], this signal could be due to an additive effect of drug-induced toxicity and risk factors. For AKI and omeprazole-rosuvastatin combination (Fig. 5B), an increased risk is observed only in females with renal disease. Rosuvastatin could cause AKI [30], and female gender and renal disease are potential risk factors for AKI [22,23]. While omeprazole does not increase the rosuvastatin concentration in health males [32], the omeprazole-rosuvastatin interaction effect in females with renal disease remains unclear. Particularly, females compared to males might have a higher rosuvastatin concentration [33]. Thus, we hypothesize this signal may involve complex DDHI, which deserves further investigation. For GI bleeding, both cephalexin-warfarin and rivaroxaban-rosuvastatin combinations have higher risks in female individuals with age ≥ 65 (Fig. 5C&D). Warfarin and rivaroxaban are known to cause GI bleeding [30]; cephalexin could interact with warfarin and cause GI bleeding [34]; and while simvastatin could interact with rivaroxaban, the relationship between rivaroxaban and rosuvastatin remains inconclusive [35]. Our results suggest that more caution shall be given to the use of potential adverse drug combinations in the older female population that have both a higher risk of GI bleeding and reduced drug metabolism [36–40].
We also observed an optimal selection of within-subject and between-subjects controls yield higher AUC values for real-world data-based ADE mining compared with using only within-subject control or between-subjects control (Fig. 2). Within-subject comparison versus between-subjects comparison could be more efficient on reducing short-term time-invariant confounding effect but could be less powerful for detecting drugs with a chronic risk of ADE induced by prolonged drug exposure [6,7], while between-subjects comparison is equally powerful to detect drugs with acute risk and drugs with chronic risk of ADE. We hypothesize patient characteristics could represent certain unobserved confounding effects and patterns of drug use (e.g., drugs with acute or chronic risks of ADE). Our observations suggest a patient characteristics-based, and gold standard-supervised control selection approach could improve ADE data mining (Fig. 2). The improved performance under the optimal control selection approach might be due to an aggregated effect of refined confounding control and improved statistical power related to detecting both acute and chronic ADE. Further studies are warranted to reveal the relationships between patient characteristics, confounding effect, and pattern of drug use.
Our study also has limitations. First, TIM is based on binary drug exposure status and risk factors (i.e., yes/no). As a consequence, TIM may not identify the complex relationship between drug dosage level and continuous patient characteristics. It is an important future direction to expand adverse interaction detection by leveraging precise information on dosage and continuous patient characteristics. Second, the signals generated from our analysis are subject to the common limitations for using real-world data, such as residual confounding effects that are not controlled by within-subject comparison or covariate matching and inaccuracy of insurance records. In our analysis, we only include AKI and GI bleeding diagnosis in first or second position for improving specificity. Third, the risk trajectories under TIM could be mis-specified. As the aim of TIM is to detect potential adverse DDIs and DDHIs, we assume the risk could keep non-increased (i.e., safe drug-combinations), increase with the presence of risk factors (i.e., adverse DDHI), and remain high (i.e., adverse DDI). While TIM has increased probability of detection (Fig. 3), some drug combinations may not fall into the aforementioned three trajectories, potentially due to a more cautious dose assignment in patients with risk factors (Table S8). As we described in the first limitation, we expect future studies to comprehensively investigate the relationships between drug combination exposure, doses, risk factors, and risk of ADE. Fourth, our findings may not be generalizable to other data sources or populations. Despite that TIM has an AUC of 0.745 in a US statewide electronic health record (EHR) data-based cross-data-source validation study (Supplemental material S7), the validation study has a small sample size. Additionally, knowledge on DDHI remains sparse, and there is a great demand in developing a gold standard for DDHI data mining. The rationale of TIM is to control false positive and increase probability of detection in generating signals of DDIs and DDHIs at a population level under a hypothesis testing framework, but not to predict ADE at a patient level. Given all the limitations, the signals shall be considered as warnings but not causal relationships. Thus, the signals shall be adjudicated by subject-matter experts, and/or validated by pharmacological and clinical studies. For validated signals, deep learning-based models can be used to further generate precision-medicine based approaches for ADE prevention at a patient level. For instance, the bidirectional gated recurrent units (BiGRU) deep learning model described in Abdelhameed et al. achieves an outstanding AUC in predicting major adverse cardiovascular events in patients undergoing liver transplantation [41], which could have a larger impact if applied broadly.
In conclusion, the trajectory-informed model (TIM) had a high probability to identify signals of adverse drug-drug interaction (DDI) and drug-drug-host interaction (DDHI) in high-throughput ADE mining while controlling false positive rates. A significant portion of drug-drug combinations were associated with the increased risk of ADEs only in certain patient subpopulations. An optimal selection of within-subject and between-subjects controls compared with using only one type of control had a higher performance in ADE data mining.
Supplementary Material
Appendix A. Supplementary material
Supplementary data to this article can be found online at https://doi.org/10.1016/j.jbi.2025.104859.
Statement of significance.
Problem:
Patients with certain characteristics persist a higher risk of adverse drug event (ADE). However, patient characteristics have not been efficiently utilized in adverse drug-drug interaction (DDI) data mining. Furthermore, using a single type of comparison (i.e., either within-subject comparison or between-subjects comparison) may have suboptimal performance for investigating all drugs.
What is already known:
Statistical models and data mining algorithms have been developed to detect signals of adverse drug-drug interaction or drug-host interaction. Existing ADE data mining studies rely on only a single type of comparison.
What this paper adds:
We developed a method to detect signals of adverse drug-drug interactions from real-world data, emphasizing the role of patient characteristics in these interactions (referred to as adverse drug-drug-host interactions). We also proposed an optimized control selection strategy, combining both within-subject comparison and between-subjects comparison to enhance the performance of real-world data-based ADE mining.
Funding:
This work was funded by the NIH (R01LM013771).
Footnotes
Declarations
Ethics approval and consent to participate: Not applicable
Consent for publication: Not applicable.
Patent applications or registrations: Not applicable.
CRediT authorship contribution statement
Yi Shi: Writing – review & editing, Writing – original draft, Visualization, Validation, Methodology, Investigation, Formal analysis, Data curation, Conceptualization. Anna Sun: Writing – review & editing, Writing – original draft, Visualization, Formal analysis, Data curation. Hongmei Nan: Methodology, Validation, Writing – review & editing. Yuedi Yang: Writing – review & editing, Writing – original draft, Visualization, Formal analysis, Data curation. Jing Xu: Writing – review & editing, Writing – original draft, Visualization, Methodology, Investigation, Funding acquisition, Data curation, Conceptualization. Michael T Eadon: Writing – review & editing, Writing – original draft, Visualization, Validation, Investigation, Funding acquisition, Conceptualization. Jing Su: Writing – review & editing, Writing – original draft, Visualization, Methodology, Investigation, Funding acquisition, Data curation, Conceptualization. Pengyue Zhang: Writing – review & editing, Writing – original draft, Visualization, Validation, Supervision, Resources, Project administration, Methodology, Investigation, Funding acquisition, Formal analysis, Data curation, Conceptualization.
Declaration of competing interest
The authors declare that they have no known competing financial interests or personal relationships that could have appeared to influence the work reported in this paper.
Availability of data and materials:
Clinformatics® Data Mart Database which are available from Optum (optum.com). Model codes are provided in Supplemental Codes.
References
- [1].CDC: Centers for Disease Control and Prevention, FastStats: Medication Safety Data, 2024, Available from: https://www.cdc.gov/medication-safety/data-research/facts-stats/index.html.
- [2].Hughes JE, et al. Drug-drug interactions and the risk of adverse drug reaction-related hospital admissions in the older population, Br. J. Clin. Pharmacol 90 (4) (2024) 959–975. [DOI] [PubMed] [Google Scholar]
- [3].Mirosevic Skvrce N, et al. Adverse drug reactions caused by drug-drug interactions reported to Croatian Agency for Medicinal Products and Medical Devices: a retrospective observational study, Croat. Med. J. 52 (5) (2011) 604–614. [DOI] [PMC free article] [PubMed] [Google Scholar]
- [4].Lu Z, Suzuki A, Wang D, Statistical methods for exploring spontaneous adverse event reporting databases for drug-host factor interactions, BMC Med Res Methodol 23 (1) (2023) 71. [DOI] [PMC free article] [PubMed] [Google Scholar]
- [5].Venturini CD, et al. Gender differences, polypharmacy, and potential pharmacological interactions in the elderly, Clinics (Sao Paulo) 66 (11) (2011) 1867–1872. [DOI] [PMC free article] [PubMed] [Google Scholar]
- [6].Hennessy S, et al. Pharmacoepidemiologic methods for studying the health effects of drug-drug Interactions, Clin Pharmacol Ther 99 (1) (2016) 92–100. [DOI] [PMC free article] [PubMed] [Google Scholar]
- [7].Bykov K, et al. A case-crossover-based screening approach to identifying clinically relevant drug-drug Interactions in electronic healthcare data, Clin Pharmacol Ther 106 (1) (2019) 238–244. [DOI] [PubMed] [Google Scholar]
- [8].Moura C, Prado N, Acurcio F, Potential drug-drug interactions associated with prolonged stays in the intensive care unit: a retrospective cohort study, Clin Drug Investig 31 (5) (2011) 309–316. [DOI] [PubMed] [Google Scholar]
- [9].Wang XY, et al. Mixture drug-count response model for the high-dimensional drug combinatory effect on myopathy, Stat. Med 37 (4) (2018) 673–686. [DOI] [PMC free article] [PubMed] [Google Scholar]
- [10].Zhou M, et al. The self-controlled case series design as a viable alternative to studying clinically relevant drug Interactions, Clin. Pharmacol. Ther 107 (2) (2020) 321–322. [DOI] [PMC free article] [PubMed] [Google Scholar]
- [11].Tatonetti NP, et al. Data-driven prediction of drug effects and interactions, Sci. Transl. Med 4 (125) (2012), p. 125ra31. [DOI] [PMC free article] [PubMed] [Google Scholar]
- [12].Bykov K, et al. The case-crossover design for drug-drug interactions: considerations for implementation, Epidemiology 30 (2) (2019) 204–211. [DOI] [PubMed] [Google Scholar]
- [13].Huang L, Zalkikar J, Tiwari RC, Likelihood ratio test-based method for signal detection in drug classes using FDA’s AERS database, J. Biopharm. Stat 23 (1) (2013) 178–200. [DOI] [PubMed] [Google Scholar]
- [14].Bate A, Bayesian confidence propagation neural network, Drug Saf 30 (7) (2007) 623–625. [DOI] [PubMed] [Google Scholar]
- [15].Noren GN, et al. A statistical methodology for drug-drug interaction surveillance, Stat. Med 27 (16) (2008) 3057–3070. [DOI] [PubMed] [Google Scholar]
- [16].Shi Y, et al. A Precision mixture risk model to identify adverse drug events in subpopulations using a case-crossover design, Stat. Med 43 (27) (2024) 5088–5099. [DOI] [PMC free article] [PubMed] [Google Scholar]
- [17].Wang X, et al. Propensity score-adjusted three-component mixture model for drug-drug interaction data mining in FDA adverse event reporting system, Stat. Med 39 (7) (2020) 996–1010. [DOI] [PMC free article] [PubMed] [Google Scholar]
- [18].Harpaz R, et al. Statistical mining of potential drug interaction adverse effects in FDA’s spontaneous reporting system, AMIA Annu. Symp. Proc 2010 (2010) 281–285. [PMC free article] [PubMed] [Google Scholar]
- [19].Chasioti D, et al. Mining directional drug interaction effects on myopathy using the FAERS database, IEEE J. Biomed. Health Inform 23 (5) (2019) 2156–2163. [DOI] [PMC free article] [PubMed] [Google Scholar]
- [20].Patel U, et al. Validation of acute kidney injury cases in the mini-sentinel distributed database. 10/April/2022]; Available from: https://www.sentinelinitiative.org/sites/default/files/Drugs/Assessments/Mini-Sentinel_Validation-of-Acute-Kidney-Injury-Cases.pdf. [Google Scholar]
- [21].U.S. Food and Drug Administration (FDA). Gastrointestinal Bleed Algorithm Defined in “Stroke, Gastrointestinal Bleeding, and Intracranial Hemorrhage following Apixaban or Warfarin Use in Patients with Non-Valvular Atrial Fibrillation: a Propensity Score Matched Analysis, 2019; Available from: https://www.sentinelinitiative.org/sites/default/files/surveillance-tools/validations-literature/GI_Bleed_apixaban_final_codelist.pdf.
- [22].Finlay S, et al. Identification of risk factors associated with acute kidney injury in patients admitted to acute medical units, Clin Med (lond) 13 (3) (2013) 233–238. [DOI] [PMC free article] [PubMed] [Google Scholar]
- [23].Khwaja A, KDIGO clinical practice guidelines for acute kidney injury, NephronClin Pract 120 (4) (2012) c179–c184. [DOI] [PubMed] [Google Scholar]
- [24].Ryan PB, et al. Defining a reference set to support methodological research in drug safety, Drug Saf 36 (Suppl 1) (2013) S33–S47. [DOI] [PubMed] [Google Scholar]
- [25].DuMouchel W, Bayesian data mining in large frequency tables, with an application to the FDA spontaneous reporting system, Am. Stat 53 (3) (1999) 177–190. [Google Scholar]
- [26].Ahmed I, et al. Bayesian pharmacovigilance signal detection methods revisited in a multiple comparison setting, Stat. Med 28 (13) (2009) 1774–1792. [DOI] [PubMed] [Google Scholar]
- [27].Noguchi Y, Comment on: “drug-drug Interaction of the sodium glucose co-transporter 2 inhibitors with statins and myopathy: a disproportionality analysis using adverse events reporting data”, Drug Saf 45 (7) (2022) 809–811. [DOI] [PubMed] [Google Scholar]
- [28].Shi Y, et al. A theoretical model for detecting drug interaction with awareness of timing of exposure, Sci Rep 15 (1) (2025) 13693. [DOI] [PMC free article] [PubMed] [Google Scholar]
- [29].Shi Y, et al. A theoretical model for detecting drug interaction with awareness of timing of exposure, Sci. Rep (2025). [DOI] [PMC free article] [PubMed] [Google Scholar]
- [30].Side Effect Resource (SIDER 4.1). Available from: http://sideeffects.embl.de/.
- [31].Klomjit N, Ungprasert P, Acute kidney injury associated with non-steroidal anti-inflammatory drugs, Eur J Intern Med 101 (2022) 21–28. [DOI] [PubMed] [Google Scholar]
- [32].Shah Y, et al. Effect of omeprazole on the pharmacokinetics of rosuvastatin in healthy male volunteers, Am J Ther 23 (6) (2016) e1514–e1523. [DOI] [PubMed] [Google Scholar]
- [33].Nazir S, et al. Pharmacokinetic study of rosuvastatin in males and females, Eur J Drug Metab Pharmacokinet 40 (3) (2015) 313–318. [DOI] [PubMed] [Google Scholar]
- [34].Schelleman H, et al. Warfarin with fluoroquinolones, sulfonamides, or azole antifungals: interactions and the risk of hospitalization for gastrointestinal bleeding, Clin Pharmacol Ther 84 (5) (2008) 581–588. [DOI] [PMC free article] [PubMed] [Google Scholar]
- [35].Soh XQ, Tan DS, Chan ECY, Simvastatin, but not atorvastatin, is associated with higher peak Rivaroxaban serum levels and bleeding: an asian cohort study from Singapore, CardioVasc Drugs Ther 37 (5) (2023) 917–925. [DOI] [PubMed] [Google Scholar]
- [36].Tielleman T, Bujanda D, Cryer B, Epidemiology and risk factors for upper gastrointestinal bleeding, Gastrointest Endosc Clin N Am 25 (3) (2015) 415–428. [DOI] [PubMed] [Google Scholar]
- [37].Lenti MV, et al. Mortality rate and risk factors for gastrointestinal bleeding in elderly patients, Eur J Intern Med 61 (2019) 54–61. [DOI] [PubMed] [Google Scholar]
- [38].Vonbach P, et al. Risk factors for gastrointestinal bleeding: a hospital-based case-control study, Swiss Med Wkly 137 (49–50) (2007) 705–710. [DOI] [PubMed] [Google Scholar]
- [39].Strate LL, et al. Risk factors for mortality in lower intestinal bleeding. Clin Gastroenterol Hepatol 6(9) (2008) 1004–10; quiz 955-. [DOI] [PMC free article] [PubMed] [Google Scholar]
- [40].Polasek TM, et al. Predicted metabolic drug clearance with increasing adult age, Br J Clin Pharmacol 75 (4) (2013) 1019–1028. [DOI] [PMC free article] [PubMed] [Google Scholar]
- [41].Abdelhameed A, et al. Deep learning-based prediction modeling of major adverse cardiovascular events after liver transplantation, Mayo Clin Proc Digit Health 2 (2) (2024) 221–230. [DOI] [PMC free article] [PubMed] [Google Scholar]
Associated Data
This section collects any data citations, data availability statements, or supplementary materials included in this article.
Supplementary Materials
Data Availability Statement
Clinformatics® Data Mart Database which are available from Optum (optum.com). Model codes are provided in Supplemental Codes.