

Abstract
Objective
To develop a conversion table and compare the cross-validity of 3 types of widely utilized near vision charts: the ETDRS near chart, the N-notation chart, and the Rosenbaum chart.
Design
A prospective, cross-sectional, comparative validation study.
Participants
Aged ≥40 years.
Methods
A conversion table for the 3 types of near charts was created using objective character sizing based on vertical height captured using a surgical microscope with a 10× magnification. Eligible presbyopic patients had their near vision tested sequentially with 3 near charts in a randomized order.
Main Outcome Measures
Pearson correlation coefficient (r) for the relationship among the near visual acuity charts. The consistency between the different charts was evaluated by Bland−Altman diagrams.
Results
A total of 204 participants (129 women, 63.2%) were recruited for the study (mean age, 58.9 ± 7.1 years). For correlation, r ranged from 0.596 to 0.836 (all P < 0.001). The Rosenbaum chart had the smallest range of difference against the ETDRS chart (standard deviation [SD] = 0.12), followed by the N-notation chart (SD = 0.15). Most of the converted logarithm of the minimum angle of resolution (logMAR) values from the N-notation and Rosenbaum charts were between 0.0 and 0.1 higher than the ETDRS logMAR equivalent (range: 0.07–0.11), with a tendency for both the N-notation and Rosenbaum charts to overestimate logMAR at more positive values.
Conclusions
We have developed a conversion table for 3 types of commonly used near vision charts. When compared with the ETDRS near chart, the Rosenbaum chart had a smaller range of difference than the N-notation chart. Both the Rosenbaum and N-notation charts tended to underestimate near vision at worse vision.
Financial Disclosure(s)
The author(s) have no proprietary or commercial interest in any materials discussed in this article.
Keywords: Presbyopia, Near visual acuity, ETDRS near chart, Rosenbaum chart, N-notation chart
Near vision plays a vital role in everyday activities such as reading, writing, and various daily tasks. Near vision impairment is a significant problem affecting patients worldwide, especially with increasing age. The World Health Organization reports that approximately 1 billion people worldwide have a visual impairment that could have been prevented or remains unaddressed, with >500 million suffering from unaddressed near vision impairment.1 Near vision impairment has in recent years been defined as near visual acuity worse than N6 at 40 cm.2,3
There have been various tools developed for near vision assessment, including the ETDRS near chart, N-notation chart, and Rosenbaum chart.4 The ETDRS near chart is considered the gold standard for near visual acuity assessment and is known for its precision. For clinical trials reporting on presbyopia-correcting procedures (e.g., cataract surgery with premium intraocular lens [IOL] implantation, presbyopic laser vision correction), near vision is typically reported as logarithm of the minimum angle of resolution (logMAR) using the ETDRS near charts such as the Clinical Trial Suite (M&S Technologies).5, 6, 7
Nonetheless, in daily clinical practice, near vision is routinely assessed using other single-optotype charts such as the N-notation chart and the Rosenbaum chart in lieu of the ETDRS near chart.8, 9, 10, 11 The former is common in the United Kingdom and Australia, while the latter is used in the Americas. However, there is currently no peer-reviewed evidence on the cross-validity of near vision assessed with these 3 charts; the results from 1 chart cannot be interchangeable with those of another.12 Importantly, this limits the interoperability of different near vision assessments, amplifying the mismatch between results from clinical studies and those of daily clinical practice. This represents a significant limitation when clinicians attempt to compare their near vision results with outcomes from clinical trials.
To bridge this gap, we propose a comprehensive validation study to compare the cross-validity of 3 widely utilized near vision charts: the ETDRS, N-notation chart, and Rosenbaum chart. The results of this study may allow interchangeable interpretation of near vision assessment across the 3 commonly used near vision charts.
Methods
Study Design
Inclusion and Exclusion Criteria
This was a prospective, cross-sectional, comparative validation study. Consecutively eligible review patients were recruited from the Eye Surgery Centre at the National University Hospital, Singapore.
The study participants were included if they fulfilled all the following:
-
1.
Willing and able to participate in the study
-
2.
At least 40 years old (inclusive)
-
3.
Able to comprehend basic instructions on visual acuity assessment
-
4.
Able to independently verbalize characters on a near reading chart
-
5.
Uncorrected distance visual acuity better than or equal to logMAR 1.0 on the ETDRS chart or 6/60 on the Snellen chart in ≥1 eye
The study participants were excluded if they fulfilled any of the following:
-
1.
Unwilling or unable to participate in study
-
2.
No mental capacity for consent taking
-
3.
Concurrent ocular pathology that may affect visual acuity other than refractive error or cataracts (e.g., exudative age-related macular degeneration, advanced glaucoma, or significant ocular surface disease)
This study was conducted in accordance with the tenets of the World Medical Association's Declaration of Helsinki and had ethics approval from the National Healthcare Group Domain Specific Review Board (Reference 2023/00963). Participants gave informed consent to participate in the study before taking part.
Direct Conversion Chart between Visual Acuity Charts Using Objective Sizing
Four near visual acuity charts were included in this study: the ETDRS chart by Alcon (ETDRS-A, Alcon Inc), the ETDRS chart by Bausch & Lomb (ETDRS-BL, Bausch + Lomb), the Rosenbaum near vision chart (Veatch Ophthalmic Instruments), and the N-notation chart. For the N-notation chart, there were numerical (N-number) and alphabetical (N-letter) characters, and they were evaluated separately. To ensure adequate print quality and contrast, only new charts were used for this study.
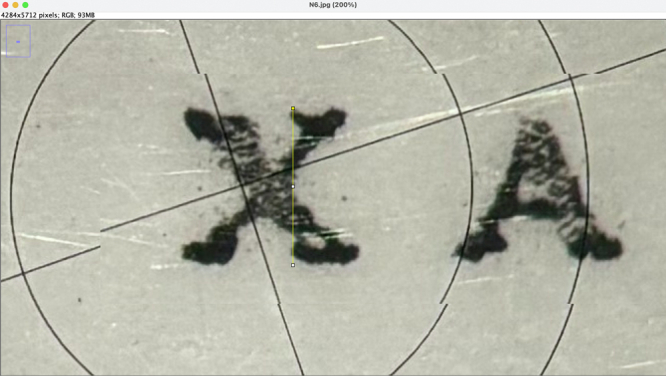
To obtain an objective conversion table between the charts, standard images were captured using a setup comprising a surgical microscope with a 10× magnification (VisuMax, Carl Zeiss Meditec AG) with an iPhone 15 (Apple Inc) stabilized through a mobile telescope mount. The first or last character in each reading line was selected and aligned with the reticule on the oculus of the microscope, and an image was captured (Fig 1). Subsequently, the maximum vertical dimension of the character was measured using the ImageJ2 software (Fiji, version 2.14.0). To obtain an accurate maximum vertical height, the image was rotated (between −2.0° and 2.0°, in 0.1° increments) to align the characters at their bases before measuring the maximum vertical height—drawn as a perpendicular line from the horizontal base of the optotype to the highest point on the character in the optotype size. This process was performed by a single grader (D.Z.C.) on 2 separate occasions, and the average value was used. After the measurements, the vertical height of each optotype size in the Rosenbaum and N-notation charts was matched to the closest averaged optotype size values of the corresponding ETDRS-A and ETDRS-BL charts (Table S1, available at www.ophthalmologyscience.org).
Figure 1.

Objective grading of various reading charts with a surgical microscope. The reticule centers on the character being used for objective measurement: (A) 20/200 character on the ETDRS chart by Alcon; (B) 20/200 character on the ETDRS chart by Bausch & Lomb; (C) J16 character on the Rosenbaum chart; and (D-E) N24 characters on the alphabetical and numerical N-notation charts, respectively.
Separately, a theoretical conversion table was mathematically derived (Table S2, available at www.ophthalmologyscience.org). The ETDRS-A and ETDRS-BL charts used Sloan optotypes (ISO 8596-2018, ISO 10938-2016, and ISO 19498-2015). The N-notation chart used print sizes based on Times New Roman font, where 1 point equals 1/72” (0.35 mm), measured vertically as an invisible box (em-square) that accommodates the tallest ascender (e.g., letter “h”) and lowest descender (e.g., letter “g”). For the vertical height of the capitalized letters, it was assumed to be 70% of the print size, as it best corresponded with the corresponding values in Table S1. The Rosenbaum chart provides a direct conversion between Jaeger print sizes and Snellen notation, and the vertical print size of the Rosenbaum chart was calculated based on the expected height of each Snellen optotype at a 14” distance.
Both tables were then reviewed and validated to produce the objective conversion table (Table 1).
Table 1.
Conversion Table Using Objective Comparison of Relative Character Sizing between Different Near Charts Tested at 40 cm
| Snellen (20/x) | Snellen (6/×) | Decimal | LogMAR | N-Notation | Rosenbaum | Rosenbaum∗ |
|---|---|---|---|---|---|---|
| 20/20 | 6/6 | 1 | 0 | J1+ | ||
| 20/25 | 6/7.5 | 0.8 | 0.1 | J1+ | J1 | |
| 20/32 | 6/9.5 | 0.63 | 0.2 | J1 | J2 | |
| 20/40 | 6/12 | 0.5 | 0.3 | N5 | J2 | J3 |
| 20/50 | 6/15 | 0.4 | 0.4 | N6 | J3 | J5 |
| 20/63 | 6/19 | 0.32 | 0.5 | N8 | J5 | |
| 20/70 | 6/21 | 0.29 | 0.55† | J7 | ||
| 20/80 | 6/24 | 0.25 | 0.6 | N10 | J7 | |
| 20/100 | 6/30 | 0.2 | 0.7 | N12 | J10 | J10 |
| 20/125 | 6/38 | 0.16 | 0.8 | |||
| 20/160 | 6/48 | 0.12 | 0.9 | N18 | J16 | |
| 20/200 | 6/60 | 0.1 | 1 | N24 | J16 | |
| 20/250 | 6/75 | 0.08 | 1.1 | |||
| 20/320 | 6/96 | 0.063 | 1.2 | N36 | ||
| 20/400 | 6/120 | 0.05 | 1.3 | N48 |
LogMAR = logarithm of the minimum angle of resolution.
Based on the Snellen equivalent conversion provided on the Rosenbaum near chart itself.
This row is not in the standard logMAR progression of 0.1 steps but is included as the Rosenbaum chart provided a Snellen equivalent of 20/70 for J7.
Patient Selection and Chart Review
To identify suitable study participants, a targeted chart review was performed for patients attending the clinic to identify patients who would be eligible. Limited patient demographics (year of birth, sex, and race) and ocular information (prior ocular surgery or laser treatment) were also retrieved from the targeted chart review should the eligible patient agree to participate in the study.
Near Visual Acuity Assessment Protocol
All study participants underwent the investigations on the day of their planned clinical visit. When both eyes were eligible, the better-seeing eye was included in the study. When both eyes had the same visual acuity, the right eye was included in the study.
Each eligible eye underwent nonmydriatic autorefraction (Canon RK-F2, Canon Inc); this was used for the distance-corrected near visual acuity (DCNVA) assessment. Participants were then fit a trial frame with distance correction based on autorefraction. After which, each participant was asked to read sequentially from 3 near charts (ETDRS near charts, N-notation chart, and Rosenbaum chart) in random order. Randomization was performed using Microsoft Excel (Microsoft Corporation) with simple random sampling of the combination of charts to be read (1 of 6 sequence combinations). All near visual acuity tests were performed under identical photopic conditions (233 lux) measured with a digital light meter (LX1330B, Dr.meter, Hongkong Thousandshores Ltd). For the ETDRS near charts and N-notation chart, each near chart was presented at 40 cm from the participants' eye (measured with a measuring tape from the lateral canthus to the handheld near chart). For the Rosenbaum chart, it was presented at 36 cm from the participants' eye as instructed in the instructions (“card is held in good light 14 inches from eye”). Each chart was held by the participant personally and at the same reading angle, which was deemed natural and comfortable to the study participant. At the beginning of each near chart testing, the specified reading distance to the reading chart was remeasured to ensure accuracy. To ensure the reading distance was maintained throughout, the research coordinator would visually inspect and—where necessary—remeasure the reading distance and adjust accordingly during the reading test for each near chart. In addition, each ETDRS near chart also had a string attached, which corresponded to the near vision distance of 40 cm—this was held taut by the study coordinator throughout the test duration.
For each near chart testing, the participant was instructed to point to the smallest line they could read and start reading from left to right. If the participant could read ≥3 of the first 5 characters (where available) on the line, they will be instructed to read the next smaller line. The process was repeated until the line of logMAR 0.0, N5, or J1+ was read on the ETDRS near chart, N-notation chart, or Rosenbaum chart, respectively, and the smallest line with ≥3 of 5 first characters correctly read was documented. If the participant was unable to read ≥3 of 5 first characters, the participant was instructed to read the next larger line. The process was repeated until the line of logMAR 1.0, N48, or J16 is read on the ETDRS near chart, N-notation chart, or Rosenbaum chart, respectively. All near charts were tested in the same sitting, with up to 2 minutes of break in between different charts if the participant desired.
Primary and Secondary Objectives
The primary objective of this study was to develop a conversion table for near visual acuity conversion among the ETDRS near chart, N-notation chart, and Rosenbaum chart and determine the relationship between the visual acuity readings among these charts.
The secondary objectives of the study included the following:
-
1.
To identify demographic and selected ocular factors that may account for differences in near visual acuity performance.
-
2.
To investigate the relationship between objective optotype sizing and subjective visual performance for all 3 near visual acuity charts.
Sample Size Calculation and Statistical Analysis
Assuming a Pearson correlation coefficient (r) of 0.7, standard deviation (SD) of 0.2 logMAR, and targeted standard error of simple linear regression of 0.01 logMAR, a minimum of 204 participants would be required. The sample size yields the standard error of the mean logMAR, given that the ETDRS near chart is 2 SD apart from the mean of 0.022 logMAR—this translates to a 95% confidence interval (CI) of ±0.045 logMAR (i.e., 2 ∗ standard error). The standard error of the mean logMAR at 1 SD from the mean will be 0.014 logMAR. To account for a dropout of 10% and rounding up to the nearest 10th participant, we aimed to recruit 230 participants.
The Pearson correlation coefficient (r) was calculated for the relationship among the near visual acuity charts. After objective conversion of the near charts to ETDRS equivalent readings (Table 1), simple linear regression was used to assess the relationship across the different near vision charts. Both point estimate and 95% CI were reported. The consistency between the different charts was evaluated by Bland−Altman diagrams. For this study, ETDRS-A was considered the gold standard reference chart. Statistical analyses were performed using SPSS version 29.0 (IBM). A P value of <0.05 was considered statistically significant in this manuscript.
Results
Between April 2024 and July 2024, a total of 1397 patients were screened, of whom 551 patients were ineligible after screening, 516 patients were missed, and 126 patients did not turn up for planned appointments (Table S3, available at www.ophthalmologyscience.org). In total, 204 participants were recruited for the study; all participants completed the study uneventfully. The demographics of the study participants and basic clinical parameters were included in Table 2.
Table 2.
Demographics and Clinical Characteristics of Study Participants (N = 204)
| Parameter | Value |
|---|---|
| Age in yrs, mean ± SD | 58.9 ± 7.1 |
| Female, N (%) | 129 (63.3) |
| Race, N (%) | |
| Chinese | 168 (82.4) |
| Malay | 19 (9.3) |
| Indian | 15 (7.4) |
| Others (Myanmar) | 2 (1.0) |
| Right eye, N (%) | 141 (69.1) |
| Prior ocular treatment, N (%) | |
| None | 147 (72.1) |
| Pseudophakic | 33 (16.2) |
| Monofocal IOL | 29 (14.2) |
| Multifocal IOL | 5 (2.5) |
| Laser refractive surgery | 18 (8.8) |
| Panretinal photocoagulation | 5 (2.5) |
| Laser peripheral iridotomy | 2 (1.0) |
| Laser retinopexy | 1 (0.5) |
| Test duration in min, mean ± SD | 19.5 ± 4.3 |
| SER by autorefraction, mean D ± SD | −0.82 ± 1.90 |
| SER by autorefraction, median D (minimum, maximum) | −0.50 (−6.50, +3.50)∗ |
| DCNVA, mean logMAR ± SD | 0.51 ± 0.18 |
| DCNVA, median logMAR (minimum, maximum) | 0.52 (−0.1, 0.92) |
D = diopters; DCNVA = distance-corrected near visual acuity; IOL = intraocular lens; logMAR = logarithm of the minimum angle of resolution; N = number; SD = standard deviation; SER = spherical equivalent refraction.
The patient with −6.50 D refraction had nuclear sclerotic cataract in the tested eye.
Correlation between Near Vision Charts for DCNVA
Using the conversion generated from Table 1 and ETDRS-A as the reference chart, Pearson correlation coefficients for ETDRS-BL, Rosenbaum chart, N-notation chart (letters), and N-notation chart (numbers) were 0.836, 0.624, 0.596, and 0.659, respectively (all P < 0.001). Accordingly, using ETDRS-A as the reference chart, point estimates using simple linear regression for ETDRS-BL, Rosenbaum chart, N-notation chart (letters), and N-notation chart (numbers) were 0.885 (logMAR to logMAR; 95% CI, 0.804–0.966), 0.685 (logMAR to converted logMAR; 95% CI, 0.581–0.789), 0.630 (logMAR to converted logMAR; 95% CI, 0.531–0.730), and 0.680 (logMAR to converted logMAR; 95% CI, 0.590–0.771), respectively. For the N-notation chart, both the letters and numbers were evaluated, which demonstrated excellent overall correlation with each other (r = 0.853, both P < 0.001).
The Bland−Altman plots using the DCNVA of the N-notation and Rosenbaum charts when compared with ETDRS-A and ETDRS-BL are presented in Figure 2. For all plots except the comparison between ETDRS-A and ETDRS-BL, there was a trend toward more positive differences as logMAR values increased, suggesting that the N-notation and Rosenbaum charts overestimated logMAR at more positive values. Table 3 summarizes the mean differences and SDs of the N-notation and Rosenbaum charts against the ETDRS-A and ETDRS-BL equivalents. In this subjective testing by study participants, the Rosenbaum chart had the smallest range of difference against both the ETDRS-A and ETDRS-BL charts (SD = 0.13 and 0.12, respectively), followed by N-number (SD = 0.14 for both), and then N-letter (SD = 0.15 for both). Like the Bland−Altman plots, most of the converted logMAR values from the N-notation and Rosenbaum charts were between 0.0 and 0.1 higher than the ETDRS logMAR (range: 0.07–0.11), with a tendency for both the N-notation and Rosenbaum charts to overestimate logMAR at more positive values (i.e., both N-notation and Rosenbaum charts reported poorer visual acuity than their ETDRS chart counterparts when the near vision of participants got worse).
Figure 2.

Bland−Altman plots of N-notation and Rosenbaum charts against ETDRS-A and ETDRS-BL as reference. Various Bland−Altman plots depicting comparisons between (A) ETDRS-BL against ETDRS-A, (B) ETDRS-A against N-notation chart letters, (C) ETDRS-A against N-notation chart numbers, (D) ETDRS-A against Rosenbaum chart numbers, (E) ETDRS-BL against N-notation chart letters, (F) ETDRS-BL against N-notation chart numbers, and (G) ETDRS-BL against Rosenbaum chart numbers. ETDRS-A = ETDRS chart by Alcon; ETDRS-BL = ETDRS chart by Bausch & Lomb; logMAR = logarithm of the minimum angle of resolution.
Table 3.
Agreement between Different Near Reading Charts for logMAR Visual Acuity When Tested against Distance-Corrected Near Visual Acuity
| Comparator | Sample Size | Minimum | Maximum | MD | SD |
|---|---|---|---|---|---|
| ETDRS-A - ETDRS-BL | 204 | −0.44 | 0.40 | 0 | 0.10 |
| N-notation (letters) - ETDRS-A | 204 | −0.24 | 0.60 | 0.10 | 0.15 |
| N-notation (numbers) - ETDRS-A | 204 | −0.34 | 0.60 | 0.09 | 0.14 |
| Rosenbaum - ETDRS-A | 204 | −0.30 | 0.88 | 0.07 | 0.14 |
| Rosenbaum∗ - ETDRS-A | 204 | −0.35 | 0.98 | 0.02 | 0.18 |
| N-notation (letters) - ETDRS-BL | 204 | −0.20 | 0.54 | 0.11 | 0.15 |
| N-notation (numbers) - ETDRS-BL | 204 | −0.26 | 0.54 | 0.10 | 0.14 |
| Rosenbaum - ETDRS-BL | 204 | −0.24 | 0.50 | 0.07 | 0.12 |
| Rosenbaum∗ - ETDRS-BL | 204 | −0.32 | 0.60 | 0.03 | 0.17 |
ETDRS-A = ETDRS chart by Alcon; ETDRS-BL = ETDRS chart by Bausch & Lomb; logMAR = logarithm of the minimum angle of resolution; MD = mean difference; SD = standard deviation.
Based on the Snellen equivalent conversion provided on the Rosenbaum near chart itself.
Empirical Conversion Chart Based on Study Participants' Responses
Using the results from the study participants, a separate conversion table was created (Table S4, available at www.ophthalmologyscience.org). Of note, there were some differences when compared with the results in Table 1: when using clinical data, the logMAR values of N-notation charts and Rosenbaum charts were comparatively lower at the same optotype size from N8 and J5 onward, respectively (corresponding to logMAR 0.5 onward).
Factors Associated with Variability in Performance
When evaluating demographic and ocular factors associated with differences in near vision performance between the different near vision charts (using the ETDRS-A as the reference chart), age, sex, and prior ocular surgery were not found to be significant (all P > 0.05). Between the ETDRS-A and N-notation chart (letters), race was a significant factor, with the greatest difference seen in Malays and the least difference seen in Indians (Chinese, 0.10 ± 0.15; Malay, 0.19 ± 0.15; Indian, 0.04 ± 0.10; others, 0.05 ± 0.07; P = 0.015, 1-way analysis of variance). No other significant factors were found for other near vision chart pairings.
Discussion
In this study, we performed a clinical evaluation of the comparisons between different near vision charts commonly used in clinical practice. Using objective measurements of character sizing, we provide a conversion table for various commercially available near vision charts, which could be useful for approximating near vision performances of different clinical studies involving presbyopia correction, including comparisons with previously published data or retrospective clinical data. With the increasing prevalence of presbyopia and growing importance of presbyopic correction,13,14 our study thus fills a significant gap when comparing results of near vision correction from clinical studies with clinical performances of patients when assessed with these 2 convenient handheld near charts.
Despite the objective conversion chart, our study revealed several key nuances: (1) the N-notation chart tests up to a logMAR of 0.3 (Snellen 20/40 equivalent) when held at 40 cm, which may not be adequate to discriminate between finer characters as opposed to the logMAR near charts; and (2) when held at 40 cm instead of the intended 36 cm, the Rosenbaum chart may underestimate near vision by around 0.1 logMAR, up to 20/80 (J7). Despite the convenience of handheld near charts, the latter point highlights the importance of maintaining an appropriate reading distance during near testing, as inadvertent shifts in reading distance could introduce inaccuracies. It is worth noting that while the Rosenbaum chart is typically tested at 36 cm (14”), at least one other version of Rosenbaum chart is calibrated for 40 cm (Precision Vision);15 this version was not tested in our study. For the ETDRS-A and ETDRS-BL near charts, they have an attached string of precalibrated distance (40 cm) to aid the user in maintaining the correct reading distance during the test.
The Bland−Altman plots (Fig 2) also showed that—compared with ETDRS-A—both the N-notation charts and Rosenbaum charts tended to underestimate near visual acuity when near vision is poorer. This could be explained by several possibilities. As the Rosenbaum chart had only a few optotypes at larger sizes (e.g., J7, J10, and J16), the chances of inaccuracies resulting in a poorer visual acuity by the testing algorithm were higher. For example, the J10 line only had 3 optotypes available, meaning the participant had to answer all 3 correctly to progress to the next level, while any incorrect response would result in the vision being recorded at the next higher level (J16). For the N-notation charts, as characters are not equally spaced and all the characters are presented at once, there could be a crowding phenomenon when the participant was asked to read the first 5 characters, leading to poorer than expected performance.16
The differences in performance among the charts could also be observed when comparing the objective conversion table (Table 1) with the conversion table generated using the clinical data obtained (Table S4). For the N-notation charts, it could be seen that the clinical data in Table S4 showed a closer clustering at higher logMAR values (logMAR 0.5, or N8 onward). Likewise, the Rosenbaum chart also showed that the progression of J characters was in equal steps (Table S4), while there were gaps at higher logMAR values in the objective conversion table (Table 1). As the optotype sizes increased nonlinearly for the Rosenbaum and N-notation charts at higher values, it is possible that participants who were not able to read a specific optotype size were assigned a poorer near visual acuity than their actual performance deserved.
Gupta et al had previously reported good intraclass correlation between near visual acuity assessment using different near charts.17 However, there currently exists no interchangeable conversion table for the ETDRS near charts, N-notation chart, and Rosenbaum charts—3 of the charts commonly used for near vision assessment after cataract surgeries. This leads to heterogeneity in reporting of near vision, and the results reported from 1 study may not be easily compared to another when different reading charts were used.12 As presbyopia correction is an increasingly vital component of cataract surgeries, there is a need for a simple tool to interchangeably compare the near vision when different near vision charts are used.
Print size of near vision charts has been evaluated in a previous study by Radner.18 However, the study omitted the N-notation chart and used a Jaeger chart, testing only at 32 cm. The N-notation chart, common in the United Kingdom and Australia, uses a standardized point size using the Times New Roman font, where 1 point equals 1/72” (0.35 mm). Only the points of 5, 6, 8, 10, 12, 14, 18, 24, 36, and 48 are used in the N-notation chart.19 The Rosenbaum chart provides a handy conversion tool for Snellen and Jaeger notation but lacks the N-notation. Our study, therefore, helps to address this gap in literature and provide a handy reference for common conversion of past and future studies that utilize any of the above charts.
In addition, through the objective standardized measurement of the vision charts, we identified several manufacturer-related sources of variability. For instance, even though both ETDRS-A and ETDRS-BL used Sloan optotypes, the vertical dimensions measured differed significantly in some optotype sizes between the 2 charts, with the optotypes from ETDRS-BL consistently greater between 12% and 20% (Table S1). These could be a result of differences between letters (in ETDRS-A) and numbers (in ETDRS-BL), nonstandardization by different manufacturers, or manufacturer printer variability. This difference is magnified at larger optotypes. In addition, it also became apparent that the optotypes in ETDRS charts were not of identical height, and letters such as “O” and “C” were consistently shorter than letters such as “Z,” though the differences were much smaller than the difference between ETDRS-A and ETDRS-BL. In contrast, the N-notation charts had more consistent height measurements between the numbers and letters (Table S1). However, the optotypes used in the N-notation had greater ink variability such that the base of the characters was not exactly horizontal (Fig S1, available at www.ophthalmologyscience.org). This can further contribute to the differences in spatial acuity of the different near charts, even if the optotype heights were identical among them.
Murali et al had previously reported a conversion table for N-notation and logMAR.20 However, the N-notation provided in the table did not follow the standard N-notation progression, and the proposed conversion appeared highly implausible (e.g., N10 correlated to 0.18 logMAR and N12 correlated to logMAR 0.22). The article cited also did not provide an interpretable table for N-notation conversion to logMAR.21 Neither author provided a clear methodology on how the conversion was determined. To the best of our knowledge, there is no other peer-reviewed literature on conversion between N-notation and ETDRS near charts.
Our study identified minor differences in performance for different races. This finding was only significant when comparing the ETDRS-A and N-notation chart (letters). One possibility could be that the font used in the N-notation chart may be easier to differentiate when compared with fonts used in the ETDRS near chart, leading to a greater variability in performance. Of note, the ETDRS-A and the N-notation chart (letters) are the only charts that utilize the English alphabet in testing instead of Roman numerals; thus, a slightly greater disparity may be noticed when the characters are not standardized despite similar vertical dimensions.22,23 Overall, however, patient and ocular factors had little impact on the differences in DCNVA measurements between different near vision charts in this study.
Aside from the near vision testing using individual optotypes, there are also other methods to evaluate near vision. In this study, we only evaluated reading of individual characters and omitted other aspects of near vision (reading speed, critical print size, reading score, or other reading tests). While word charts may be preferred to letter charts and more representative of functional vision,24, 25, 26 there is no ETDRS equivalent near charts available. Reading speed and reading scores are also less commonly reported methods for near vision assessment after cataract surgery.
There are several strengths in our study, including a standardized evaluation process of near vision assessment. All the tests were performed by 1 experienced clinical optometrist under identical settings and lighting conditions. By randomizing the sequence of different near charts being tested, we minimize the risk of systemic bias being introduced due to user fatigue. We also included the presbyopic population, a mixture of both phakic and pseudophakic study participants, and a range of refractive errors, which would apply well to patients who may be considering cataract surgery or evaluation after cataract surgery.
This study has several limitations. Firstly, we only tested the near vision of the N-notation chart at 40 cm; ostensibly, different individuals would have different preferred near vision distances. Another commonly used testing distance would be 33 cm. We decided to align the testing distance for the N-notation chart with the ETDRS near chart for easier standardization. Secondly, due to resource constraint, DCNVA was determined using nonmydriatic autorefraction instead of manifest refraction, which could have underestimated DCNVA, thus introducing a systemic bias. Thirdly, the vision testing algorithm in our study had to be modified from the ETDRS standard due to the difference in the number of optotypes in each size for the N-notation (>5 in each line) and Rosenbaum charts (ranging from 3 to 6 in each line). This may have resulted in less accurate and an overestimated DCNVA when compared with the ETDRS testing standard. Likewise, certain participant categories (e.g., participants with multifocal IOL implants) may have reduced contrast compared with pseudophakic patients with monofocal IOLs and contribute to reduced accuracy. Fourthly, the objective quantification of optotype size using a standardized microscope could have introduced variability due to measurements. At smaller optotypes (e.g., logMAR 0.0), it was sometimes difficult to identify the absolute upper and lower borders of the characters due to reduced resolution of the image; we attempted to mitigate this through a repeat measurement of the same results, which yielded almost identical values (Table S1). Finally, test−retest was not performed due to practical limitations, and there could be intrarater variability, with fatigue setting in toward the later part of testing. We attempted to mitigate this by allowing study participants to take ample breaks in between the reading assessments.
In conclusion, in this proof-of-concept study, we have developed a simple conversion table for interchangeable comparison of the ETDRS near chart, the N-notation chart, and the Rosenbaum chart. The Rosenbaum chart provided better agreement with the ETDRS near chart than the N-notation chart. When comparing to the ETDRS near chart, both the Rosenbaum chart (held at the instructed 36 cm) and the N-notation chart (held at 40 cm) tended to underestimate near vision (give a more positive logMAR value) at worse visions. Further testing in specific dedicated subgroups (e.g., pseudophakic patients with different classes of IOLs, etc.) would help to refine the validity of this conversion table in these populations.
Manuscript no. XOPS-D-25-00021.
Footnotes
Supplemental material available atwww.ophthalmologyscience.org.
Disclosure(s):
All authors have completed and submitted the ICMJE disclosures form.
The author(s) have no proprietary or commercial interest in any materials discussed in this article.
This study was supported by the Summit Programme in Innovation (SPIN) Grant (NUHSRO/2022/RO5+6/SPIN/02).
Support for Open Access publication was provided by the National University Hospital, Singapore.
HUMAN SUBJECTS: Human subjects were included in this study. This study was conducted in accordance with the tenets of the World Medical Association's Declaration of Helsinki and had ethics approval from the National Healthcare Group Domain Specific Review Board (Reference 2023/00963). Participants gave informed consent to participate in the study before taking part.
No animal subjects were used in this study.
Author Contributions:
Conception and design: Chen, Tham, Shen
Data collection: Chen
Analysis and interpretation: Chen, Tham, Shen, Chee
Obtained funding: Chen
Overall responsibility: Chen, Tham, Shen, Chee
Supplementary Data
Figure S1.
A photo of 2 optotypes from the N6 row of the N-notation chart taken from the microscope. Due to printing ink variability, the heights of these optotypes are not uniform the bases of the optotypes are not horizontal.
References
- 1.GBD 2019 Blindness and Vision Impairment Collaborators Vision loss expert Group of the global burden of disease study. Causes of blindness and vision impairment in 2020 and trends over 30 years, and prevalence of avoidable blindness in relation to VISION 2020: the right to sight: an analysis for the global burden of disease study. Lancet Glob Health. 2021;9:e144–e160. [Google Scholar]
- 2.Bourne R.R.A., Flaxman S.R., Braithwaite T., et al. Magnitude, temporal trends, and projections of the global prevalence of blindness and distance and near vision impairment: a systematic review and meta-analysis. Lancet Glob Health. 2017;5:e888–e897. doi: 10.1016/S2214-109X(17)30293-0. [DOI] [PubMed] [Google Scholar]
- 3.GBD 2019 Blindness and Vision Impairment Collaborators Vision loss expert Group of the global burden of disease study. Trends in prevalence of blindness and distance and near vision impairment over 30 years: an analysis for the global burden of disease study. Lancet Glob Health. 2021;9:e130–e143. [Google Scholar]
- 4.Tiraset N., Poonyathalang A., Padungkiatsagul T., et al. Comparison of visual acuity measurement using three methods: standard ETDRS chart, near chart and a smartphone-based eye chart application. Clin Ophthalmol. 2021;15:859–869. doi: 10.2147/OPTH.S304272. [DOI] [PMC free article] [PubMed] [Google Scholar]
- 5.Vasavada V., Vasavada S.A., Shastri L., et al. Visual outcomes comparing emmetropia vs mini-monovision after bilateral implantation of a nondiffractive extended vision intraocular lens: randomized trial. J Cataract Refract Surg. 2024;50:799–804. doi: 10.1097/j.jcrs.0000000000001458. [DOI] [PubMed] [Google Scholar]
- 6.Kılıç A., Özpınar A., Tanrıverdi C. Comparison of visual outcomes of two trifocal IOLs. J Refract Surg. 2023;39:524–530. doi: 10.3928/1081597X-20230424-01. [DOI] [PubMed] [Google Scholar]
- 7.Pantanelli S.M., O'Rourke T., Bolognia O., et al. Vision and patient-reported outcomes with nondiffractive EDOF or neutral aspheric monofocal intraocular lenses. J Cataract Refract Surg. 2023;49:360–366. doi: 10.1097/j.jcrs.0000000000001123. [DOI] [PMC free article] [PubMed] [Google Scholar]
- 8.Thananjeyan A.L., Siu A., Jennings A., Bala C. Extended depth-of-focus intraocular lens implantation in patients with age-related macular degeneration: a pilot study. Clin Ophthalmol. 2024;18:451–458. doi: 10.2147/OPTH.S442931. [DOI] [PMC free article] [PubMed] [Google Scholar]
- 9.Benozzi G., Cortina M.E., Gimeno E., et al. A multicentric study of pharmacological treatment for presbyopia. Graefes Arch Clin Exp Ophthalmol. 2021;259:2441–2450. doi: 10.1007/s00417-021-05138-8. [DOI] [PubMed] [Google Scholar]
- 10.Benozzi G., Perez C., Leiro J., et al. Presbyopia treatment with eye drops: an eight year retrospective study. Transl Vis Sci Technol. 2020;9:25. doi: 10.1167/tvst.9.7.25. [DOI] [PMC free article] [PubMed] [Google Scholar]
- 11.Tavassoli S., Ziaei H., Yadegarfar M.E., et al. Trifocal versus extended depth of focus (EDOF) intraocular lenses after cataract extraction. Cochrane Database Syst Rev. 2024;7:CD014891. doi: 10.1002/14651858.CD014891.pub2. [DOI] [PMC free article] [PubMed] [Google Scholar]
- 12.Williams M.A., Moutray T.N., Jackson A.J. Uniformity of visual acuity measures in published studies. Invest Ophthalmol Vis Sci. 2008;49:4321–4327. doi: 10.1167/iovs.07-0511. [DOI] [PubMed] [Google Scholar]
- 13.Katz J.A., Karpecki P.M., Dorca A., et al. Presbyopia - a review of current treatment options and emerging therapies. Clin Ophthalmol. 2021;15:2167–2178. doi: 10.2147/OPTH.S259011. [DOI] [PMC free article] [PubMed] [Google Scholar]
- 14.Wolffsohn J.S., Davies L.N. Presbyopia: effectiveness of correction strategies. Prog Retin Eye Res. 2019;68:124–143. doi: 10.1016/j.preteyeres.2018.09.004. [DOI] [PubMed] [Google Scholar]
- 15.Anon Rosenbaum pocket card. Precision vision. https://precision-vision.com/products/visual-acuity-reading-charts/reading-charts/pocket-cards-reading-charts/rosenbaum-pocket-card/
- 16.Feng C., Jiang Y., He S. Horizontal and vertical asymmetry in visual spatial crowding effects. J Vis. 2007;7(13):1–10. doi: 10.1167/7.2.13. [DOI] [PubMed] [Google Scholar]
- 17.Gupta N., Wolffsohn J.S.W., Naroo S.A. Comparison of near visual acuity and reading metrics in presbyopia correction. J Cataract Refract Surg. 2009;35:1401–1409. doi: 10.1016/j.jcrs.2009.03.026. [DOI] [PubMed] [Google Scholar]
- 18.Radner W. Ophthalmologische leseproben. Ophthalmologe. 2016;113:1029–1035. doi: 10.1007/s00347-015-0175-7. [DOI] [PubMed] [Google Scholar]
- 19.Law F.W. Standardization of reading types. Br J Ophthalmol. 1951;35:765–773. doi: 10.1136/bjo.35.12.765. [DOI] [PMC free article] [PubMed] [Google Scholar]
- 20.Murali K., Ramesh A., Murthy S.R., Goyal A. Binocular therapy as primary intervention in adults with anisometropic amblyopia. Taiwan J Ophthalmol. 2022;12:317–324. doi: 10.4103/tjo.tjo_37_21. [DOI] [PMC free article] [PubMed] [Google Scholar]
- 21.Oduntan A.O. A practical logMAR near reference table for low vision practitioners: design and applications. Afr Vis Eye Health. 2006;65:157–162. [Google Scholar]
- 22.Bailey I.L., Lovie J.E. New design principles for visual acuity letter charts. Am J Optom Physiol Opt. 1976;53:740–745. doi: 10.1097/00006324-197611000-00006. [DOI] [PubMed] [Google Scholar]
- 23.McMonnies C.W., Ho A. Letter legibility and chart equivalence. Ophthalmic Physiol Opt. 2000;20:142–152. [PubMed] [Google Scholar]
- 24.Sheedy J.E., Subbaram M.V., Zimmerman A.B., Hayes J.R. Text legibility and the letter superiority effect. Hum Factors. 2005;47:797–815. doi: 10.1518/001872005775570998. [DOI] [PubMed] [Google Scholar]
- 25.Liu L., Arditi A. How crowding affects letter confusion. Optom Vis Sci. 2001;78:50–55. doi: 10.1097/00006324-200101010-00014. [DOI] [PubMed] [Google Scholar]
- 26.Simmers A.J., Gray L.S., McGraw P.V., Winn B. Contour interaction for high and low contrast optotypes in normal and amblyopic observers. Ophthalmic Physiol Opt. 1999;19:253–260. [PubMed] [Google Scholar]
Associated Data
This section collects any data citations, data availability statements, or supplementary materials included in this article.