

Abstract
Objectives:
As alcohol use is common among older depressives, we assessed structural brain changes over 2 years and examined their association with changes in alcohol consumption.
Design:
Longitudinal cohort study.
Setting:
Academic health center.
Participants:
Adults aged 60 and older who met DSM criteria for a major depressive episode.
Intervention:
Participants were offered treatment with sertraline.
Measurements:
Participants completed structured interviews for reported alcohol consumption, had a clinical interview with a study psychiatrist, completed a cognitive battery at baseline and every twelve months, and underwent a 3T structural MRI as baseline and at 2-year follow-up. Volumetric brain changes were calculated.
Results:
Among 58 participants, 45 were classified as moderate drinkers (≤7 drinks/week) and 13 as risky drinkers (>7 drinks/week). Compared with moderate drinkers, risky drinkers at baseline had significantly thinner cortical thickness and smaller volume in several frontal cortical regions, posterior cingulate, postcentral cortices, right insula, right putamen, and right inferior parietal sulcus. Annualized change in cortical thickness and volume correlated negatively with changes in the average number of drinks per week. Decreased depression severity, increased cognitive function score, and decreased alcohol consumption over the 2-year follow-up were each associated with annualized volumetric changes in specific common regions.
Conclusion:
These MRI findings demonstrate the adverse impact of alcohol use in older adults on the fronto-striatal circuit. They highlight the need for careful screening and treatment referral for risky alcohol use among older adults with depression.
Keywords: Alcohol, depression, neuroimaging, risky drinking
Alcohol Use Disorder (AUD) in older adults has been described as a hidden epidemic that is under-recognized and untreated.1 Recent studies have noted that the incidence of heavy drinking and AUD have increased among older adults over the past decade.2,3 Major depression and AUD are frequently comorbid in older adults, yet are understudied in terms of epidemiology, outcome, and underlying neural mechanisms. Structural and functional neuroimaging approaches may provide insights into the unique and conjoint neural changes associated with development and course of these conditions.4
Late-life depression (LLD) is linked to disturbances in fronto-striatal circuity5 and more broadly with the Executive Control (including prefrontal cortex and hippocampus, Salience (including insula and thalamus), and Reward Networks (including nucleus accumbens, putamen, and ventromedial prefrontal cortex).6 Similar structures have been identified in recent models of stages of alcohol use. For example, a model of the neurocircuitry of addiction identified dysfunction in the Salience Network, the Executive Control Network, and the Reward Network, leading to craving and intoxication.7 Both LLD and alcohol use are associated with cognitive impairment in older adults.8,9 Identifying neural networks that are common or may differ among LLD, AUD, and cognitive dysfunction would enhance understanding of neural mechanisms related to co-occurrences of among these conditions.
In the current study, we aimed to examine structural brain changes over 2 years in older depressed adults, while assessing drinking history and cognitive function. Longitudinal clinical and neuroimaging data were obtained from the Neurobiology of Late-life Depression (NBOLD) study, in which older depressed adults provided annual interview-elicited reports of recent drinking and had baseline and 2-year magnetic resonance imaging (MRI) scans. Given similarities in suggested neural structures between LDD and AUD, as well as mild cognitive impairment, we hypothesized that higher levels of reported drinking over time would be associated with smaller volumes of prefrontal cortices and white matter.
METHODS
Research Participants
Participants were enrolled in NBOLD, a NIMH-funded study (R01 MH096725, R01 MH098301) at the University of Connecticut Health Center (UCHC) and the Olin Neuropsychiatry Research Center (ONRC) at the Institute of Living of Hartford Hospital, whose methods have been previously reported.10 NBOLD was supported by two NIH grants that allowed for baseline and follow-up assessment and neuroimaging, standardized treatment, and a treatment component. The study was approved by the Institutional Review Boards of UCHC and Hartford Hospital. Participants were given information about the study, then provided written, informed consent to participate, and received $100 for participation.
Participants with depression were recruited from clinic referrals, newspaper advertisements and community presentations. Inclusion criteria were age 60 or above, met criteria for major depression, ability to read and write English, and Mini-Mental State Examination score 25 or greater. Exclusion criteria were: lifetime alcohol or drug dependence; conditions associated with MRI abnormalities; acute endocrine disorder other than diabetes mellitus; physical or intellectual disability that may affect completion of self-rating instruments; established clinical diagnosis of dementia; other primary psychiatric disorders; and any metal or pacemaker in the body that might preclude MRI. In addition, current treatment with fluoxetine was an exclusion for the depressed group given its long wash-out period.
Baseline Assessments
For alcohol use, a trained clinical research assistant initially asked participants if they drank alcoholic beverages. If the participant answered “yes,” then the participant was asked the following: i. When did you start (how many years have you been drinking?) ii. What do you drink? iii. How much do you drink? (example: numbers of beers a day). If participants answered “no” regarding current drinking, they were asked “did you ever drink? Those who responded “yes” were asked the following: i. When did you begin drinking? ii. How many years did you drink? iii. What did you drink? iv. How often did you drink? For current drinkers who reported a range of drinking, e.g., “one to two drinks per day,” we developed two variables, an “average” amount of reported drinking (in this case, 1.5 drinks per day), and a “maximum” amount of reported drinking (in this case two drinks per day). For individuals who reported a specific number over a specific timeframe (e.g., day or week), average number of drinks and maximum number of drinks were the same. We converted all responses to average weekly and maximum weekly number of drinks as our outcome measures to compare the impact of different estimation methods. There was no specific question on binge drinking. Guidelines from the American Geriatrics Society and the National Institute for Alcohol Abuse and Alcoholism recommend older adults drink no more than 7 standard drinks (12-oz beer, 4- to 5-oz glass of wine, 1.5 oz of 80-proof liquor) per week.11 With this recommendation in mind, we designated participants who reported >7 drinks per week over the past month at baseline entry as “risky drinkers,” and those who reported ≤7 drinks per week were identified as “moderate drinkers.”
At study entry, each participant was interviewed by a study geriatric psychiatrist to establish a clinical diagnosis of major depression (for depressed subjects) or rule out history of mental illness (for comparison subjects). During the visit, the following assessments were completed: Montgomery-Åsberg Depression Rating Scale (MADRS),12 Mini-Mental Status Examination (MMSE), the Clinical Global Impression - Severity scale (CGIS), and the Cumulative Illness Rating Scale (CIRS), as modified for geriatric patients.13 Cognitive function was assessed using the Consortium to Establish a Registry for Alzheimer’s Disease (CERAD).14
Treatment Protocol
Study psychiatrists followed a treatment protocol that employed both structured and naturalistic components. All participants were offered open-label treatment with sertraline for 12 weeks with options to change dosage or to switch medications depending on response and tolerability such that treatment was available for at least 2 years. Individuals taking antidepressants at baseline who otherwise met inclusion criteria, underwent a study-related 2-week medication washout with weekly telephone contact to assess clinical status and provide in-person assessments as warranted. Those who had prescribers or psychotherapists who did not wish to participate in study-based treatment could continue medication treatment or psychotherapy outside the study. Among the 58 participants who were included in this study, 41 were medicated with Sertraline (dosage ranged from 25 mg to 100 mg), and 17 were either taking other antidepressants and chose not to receive medication.
Longitudinal Follow-Up Assessments
All study participants were followed-up in both clinical assessments and neuroimaging for 2 years. LLD subjects who remained non-remitted were followed clinically every 2 weeks during which their depression status was assessed with the MADRS and CGIS. Those LLD subjects who were remitted or partially remitted were followed every three months. Cognitive function and alcohol use were assessed on all study participants annually.
Neuroimaging Protocol
MRI acquisition methods. At the ONRC, participants received a brain MRI using a Skyra 3T scanner (Siemens) with 32 surface coils located at ONRC at baseline and 18 to 24 months later. During each visit, five high-resolution axial T1-weighted magnetization-prepared rapid gradient-echo (MPRAGE) images were acquired parallel with the anterior commissure-posterior commissure (AC-PC) line. The acquisition parameters were TR/TE=2200/2.88 ms, flip angle = 13°, matrix = 220 × 320 × 208, and voxel size 0.8 × 0.8 × 0.8 mm.
Image preprocessing and data analysis. The five MPRAGE images were first co-registered and averaged. The averaged image was processed and segmented using the FreeSurfer (version 6.0.0) pipeline to generate cortical and subcortical volumetric measures as well as white matter hypointensities. The technical details of the pipeline procedures are described in prior publications.15,16 We first processed the two images (from baseline and follow-up scan) independently as in cross-sectional analysis using the regular FreeSurfer processing stream (recon-all) following the volume-based stream and surface-based stream analyses including: an affine registration with MNI305 space, skull stripping, B1 bias field correction, gray-white matter segmentation, reconstruction of cortical surface models (gray-white boundary surface and pial surface), labeling of regions on the cortical surface, as well as subcortical brain structures. Image processing steps were visually inspected (skull-stripping errors and gray/white matter boundary) to ensure they had been conducted correctly. We then created the within-subject template (the average anatomy of the subject across the two time points) for quality checking or editing. Finally, we generated the two longitudinal runs which were automatically assigned. Regional cortical thicknesses and volumes, and white matter volumes were extracted using Destrieux 2009 atlas-segmented brain regions as regions of interest (ROIs). For baseline volume data (including white matter volumes), we used regional volume/total intracranial volume (TIV) percentage. For longitudinal data, we simply used annualized changes (not including a ratio with TIV).
Statistical Approach
For baseline data, we conducted a two-sample t-test to examine differences in brain cortical thickness (or regional volume) between the moderate and risky drinker groups using Qdec program of FreeSurfer with age, gender, baseline depression severity (MADRS), and baseline cognitive function (CERAD) as covariates. The threshold of significance was set at p <0.05 with FDR correction. For the longitudinal data analysis, we followed a two-stage model in which changes in MRI variables were annualized due to variability in length of time between the two scans (18−30 months). In Stage 1, we computed the annualized thickness (or volume) change for each subject. In Stage 2, we used a general linear model mri_glmfit function to examine the association between annualized changes in cortical thickness (or volume) and changes in average number (also maximum number separately) of drinks per week, with age, gender, changes in depression severity (as measure by MARDS), and changes in cognitive function (as measured by CERAD total score) as covariates. We used mri_glmfit-sim to conduct cluster correction with p <0.05 as threshold.
The Freesurfer software also provided T1-weighted hypointensity volumes, which are analogous to T2-weighted white matter hyperintensity volumes. We explored hypointensity volumes initially using correlation analyses. As we found no significant correction between change in alcohol consumption and change in hypointensity volume, we did not conduct further analyses.
To further examine similar versus differential effects on brain regions that may be related to alcohol consumption, late-life depression, and cognitive function changes, we further examined the correlation between annualized brain thickness (or volume) change and changes in depression severity (measured by MADRS) and changes in cognitive function (measured by CERAD). We conducted MANCOVA across all study participants, with changes in MADRS, CERAD, age, and average number of drinks per week as a independent variables, and gender as a covariate. In order to examine common effects among these independent variables on brain structure, we used a lenient threshold of p <0.05 without correction for multiple comparisons, and then a conjunction analysis on the significant maps with the final outcome map thresholded at p <0.02 (p = 0.05 × 4) without correction for multiple comparisons.
We next performed statistical analyses on ROIs using the R program with the same models to confirm the results from the whole-brain voxelwised analyses with p <0.05 and FDR corrections on the significant ROIs. All the above analyses were conducted using both average number of drinks per week and maximum number of drinks.
RESULTS
The sample included 58 older participants with depression, among which 45 were classified as moderate drinkers and 13 were classified as risky drinkers based on baseline self-reports. The risky drinking group included 62% women with a mean age of 73.89 years, and the moderate drinking groups included 71% women with a mean age of 71.3 years. As shown in Table 1, there was no significant difference between the two drinking groups in demographic variables, depression severity measured by MADRS, or months of drinking history. The groups differed significantly on cognitive function. Risky drinkers had significantly lower cognitive scores as measured by total CERAD score compared with moderate drinkers (Table 1). The average and maximum number of drinks per week were also significantly different between the two groups, consistent with our definition.
TABLE 1.
Baseline and Longitudinal Characteristics of Study Participants
| Risky Drinker (n = 13) Mean (SD) | Moderate Drinker (n = 45) Mean (SD) | t-Test Value, Degrees of Freedom, p Value | |
|---|---|---|---|
| Age, years | 73.89 (8.18) | 70.71 (7.16) | 0.300 |
| Gender, numbers of women/men | 8/5 | 32/13 | 0.511b |
| Education, years | 16.78 (2.82) | 16.12 (2.32) | 0.53 |
| MADRS score, baseline | 18.89 (3.37) | 19.65 (4.94) | 0.62 |
| CERAD total score, baseline | 78.11 (6.43) | 83.89 (9.01) | 0.049a |
| Reported prior months of drinking | 242.20 (417.72) | 155.12 (414.63) | 0.69 |
| Average weekly number of drinks reported at baseline | 7.94 (2.96) | 1.79 (1.57) | <0.001a |
| Maximum number of weekly drinks reported at baseline | 10.67 (5.57) | 2.45 (2.15) | 0.002a |
| Change in MADRS score, year 2 – baseline | −10.78 (6.91) | −10.52 (6.73) | 0.93 |
| Change in CERAD total score, year 2 – baseline | 0.2 (4.3) | 1.9 (4.9) | 0.318 |
| Change in average weekly number of reported drinks, year 2 – baseline | −2.25 (4.15) | 0.28 (1.78) | 0.08 |
| Change in maximum number of reported weekly drinks, year 2 – baseline | −4.00 (5.93) | −0.02 (2.19) | 0.06 |
p <0.05 from two-sample t tests.
chi-square test.
Study participants had a follow-up MRI scan at 18 to 30 months after baseline with mean (SD) of 22.37 (2.96) months. Overall, study participants in both groups decreased drinking over the 2 years. Among subjects in the risky drinking group, 6 out of 13 changed to moderate drinking. Among subjects in the moderate drinking group, 2 out of 43 changed to no drinking and 1 changed to risky drinking. Quantitatively, the risky drinking group showed a marginally significant decrease in the maximum (t53 = 2.09, p = 0.06) and average (t53 = 1.81, p = 0.08) number of drinks per week (Year 2 − baseline) compared with the moderate drinking group over the 2 years (Table 1). Changes in depression severity were not significantly different between the two groups. However, a Pearson’s coefficient coefficient analysis revealed a decrease in depression severity was associated with a decrease in reported average drinking (r56 = 0.26, p = 0.049). The risky drinking group didn’t show significant differences in the increase of cognitive function (measured in CERAD total score) over the 2 years compared with the moderate drinking group (Table 1). There was a trend of a negative correlation between reported alcohol drinking and increased cognitive function that did not reach statistical significance (r56 = −0.24, p = 0.06).
Whole-brain two-sample t tests (corrected using FDR for multiple comparisons) at baseline (Fig. 1A) revealed that, compared with moderate drinkers, risky drinkers had significantly thinner cortical thickness and smaller volume in bilateral medial prefrontal cortex (mPFC), right middle frontal cortex (MFC), right insula, precentral and postcentral cortices, posterior cingulate cortex (PCC), right putamen, and right inferior parietal sulcus (IPS). The atlas-based ROI analysis (not corrected for multiple comparisons) on reginal thickness and regional volume/total intracranial volume (TIV) largely confirmed the results from the whole brain analysis (Fig. 1B and Table 2). The ROI analysis also showed that the risky drinkers had significantly thinner cortices or smaller regional volumes or white matter volumes in the frontal pole, superior, middle, and inferior frontal gyrus, paracentral cortex, and white matter volume of cerebellum. In addition, the risky drinking group also had significantly larger bilateral lateral ventricular volume (Table 2). Given the small and uneven sample sizes between the moderate and risky drinking groups, we also conducted Wilcoxon Rank-Sum Test followed by FDR correction for multiple comparisons using the R program. We only focused on the brain regions that we found significant in the analysis using Qdec. The results remained significant.
FIGURE 1.
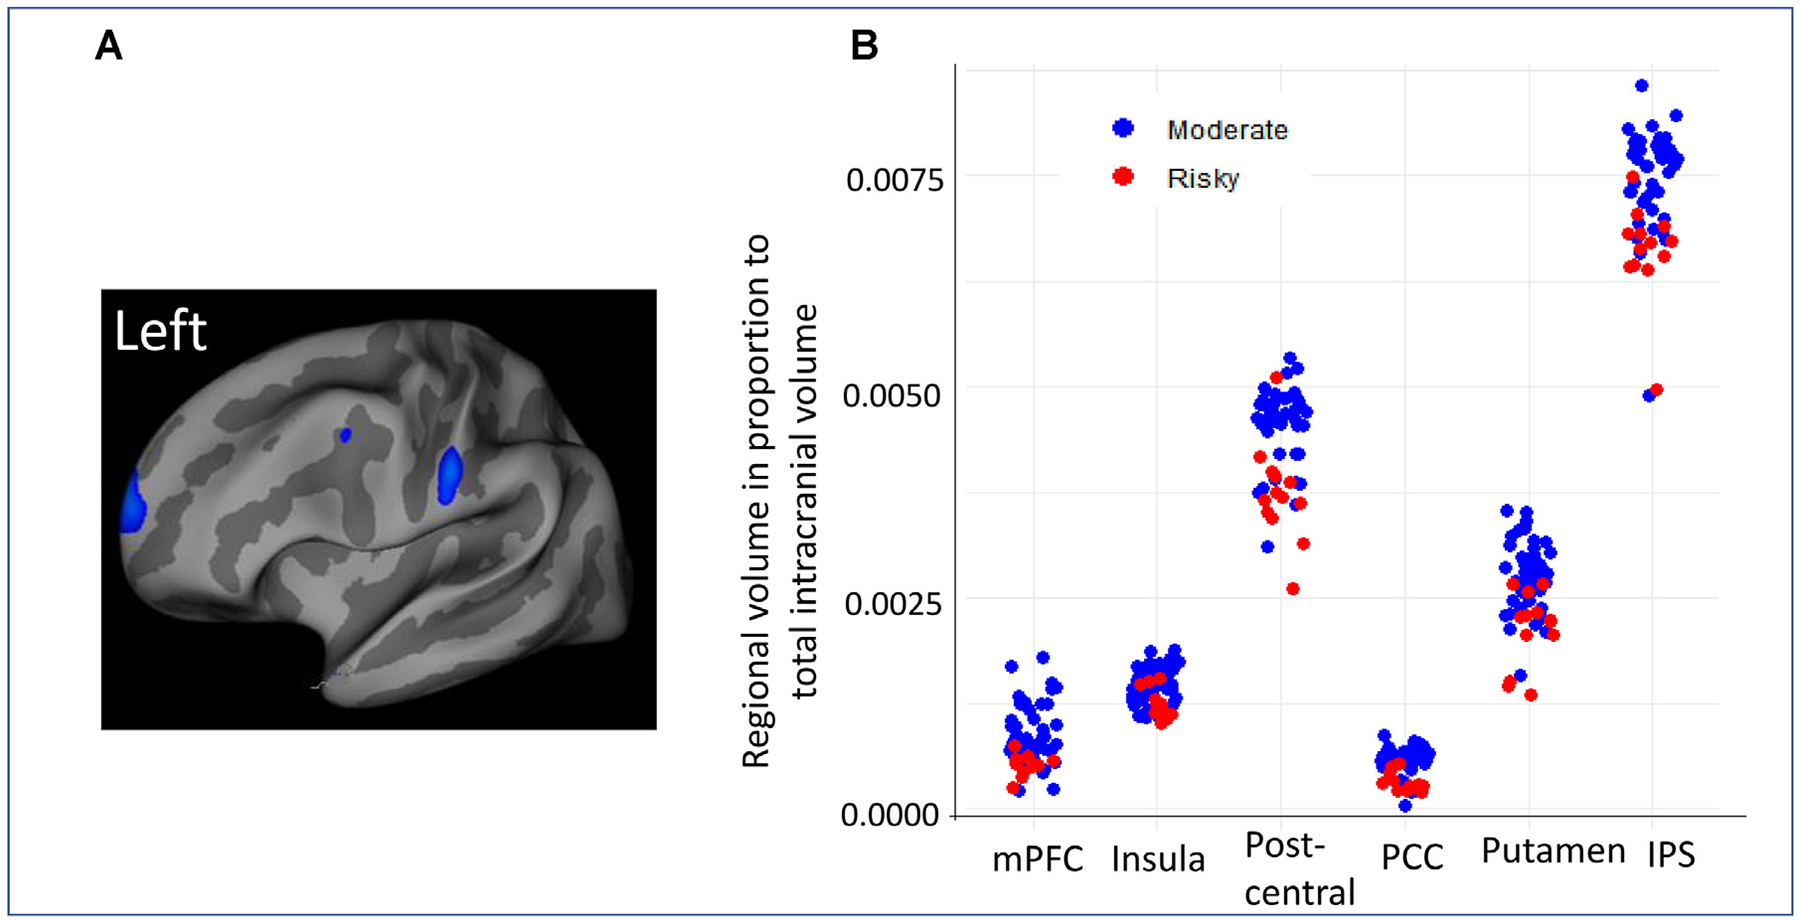
[A] Whole-brain two-sample t-test (corrected using FDR for multiple comparisons) results on cortical thickness at baseline showing significantly reduced cortical thickness in the risky drinking group compared with the moderate drinking group in bilateral medial prefrontal cortex (mPFC), left superior frontal cortex (frontal eye area), superior parietal cortex, and right temporal pole. [B] The scatter plots of brain regions that showed significant differences between risky drinking group and moderate drinking group using region of interests (ROI) analysis on regional brain volume/total intracranial volume ratio. PCC = posterior cingulate cortex, IPC = inferior parietal cortex.
TABLE 2.
Brain Regions That Showed Significant Differences in Cortical Thickness or Volume Size at Baseline Between the Risky Drinking Group Compared With the Moderate Drinking Group Using Two-Sample T-Tests with Age and Gender as Covariates (df = 56)
| Brain Regions | Moderate Drinking Mean (SD) | Risky Drinking Mean (SD) | T Value | p-Valuea | |
|---|---|---|---|---|---|
| Frontal pole | Left frontal pole thickness | 2.452 (0.233) | 2.265 (0.180) | 2.387 | 0.020 |
| Right frontal pole thickness | 2.452 (0.205) | 2.306 (0.189) | 2.082 | 0.021 | |
| Right frontal pole white matter volume/TIVb ratio | 0.0029 (0.0006) | 0.0019 (0.0004) | 2.869 | 0.006 | |
| Left frontomargin thickness | 2.355 (0.021) | 2.256 (0.112) | 2.165 | 0.041 | |
| Middle frontal gyrus (MFG) | Right MFG thickness | 2.166 (0.152) | 2.085 (0.075) | 2.508 | 0.010 |
| Inferior frontal gyrus (IFG) | Left IFG volume/TIV ratio | 0.0268 (0.0050) | 0.0262 (0.0037) | 2.12 | 0.038 |
| left IFG white matter volume/TIV ratio | 0.0198 (0.0035) | 0.0186 (0.0032) | 2.240 | 0.029 | |
| Medial prefrontal cortex (mPFC) | Right superior frontal white matter volume/TIV ratio | 0.0109 (0.0014) | 0.0107 (0.0012) | 2.120 | 0.038 |
| Left ventral mPFC sulcus thickness | 2.319 (0.311) | 2.149 (0.093) | 3.168 | 0.003 | |
| Left ventral mPFC sulcus volume/TIV ratio | 0.0105 (0.0023) | 0.0094 (0.0021) | 2.136 | 0.037 | |
| Left ventral mPFC white matter volume/TIV ratio | 0.0162 (0.0025) | 0.0160 (0.0020) | 2.047 | 0.045 | |
| right medial orbital frontal sulcus (vmPFC) thickness | 2.271 (0.242) | 2.178 (0.105) | 1.955 | 0.056c | |
| Right ventral mPFC white matter volume/TIV ratio | 0.0241 (0.0003) | 0.0224 (0.0002) | 2.177 | 0.034 | |
| Insula | Left superior insula volume/TIV ratio | 0.0229 (0.0006) | 0.0200 (0.0004) | 2.839 | 0.006 |
| Posterior cingulate (PCC) and precuneus | Right isthmucingulate white matter volume/TIV ratio | 0.0155 (0.0002) | 0.0142 (0.0003) | 2.338 | 0.023 |
| Left dorsal PCC volume/TIV ratio | 0.0187 (0.0003) | 0.0175 (0.0002) | 1.956 | 0.055c | |
| Right ventral PCC volume/TIV ratio | 0.0191 (0.0003) | 0.0177 (0.0002) | 2.442 | 0.018 | |
| Right precuneus volume/TIV ratio | 0.0788 (0.0008) | 0.0767 (0.0012) | 2.432 | 0.009 | |
| Intraparietal sulcus (IPS) | right IPS thickness | 0.0241 (0.0004) | 0.0220 (0.0027) | 2.168 | 0.034 |
| Superior parietal sulcus (SPS) | Left SPS volume/TIV ratio | 0.0822 (0.0122) | 0.0804 (0.0088) | 2.321 | 0.024 |
| Left SPS white matter volume/TIV ratio | 0.0815 (0.0113) | 0.0758 (0.0124) | 2.412 | 0.019 | |
| Pre, post, and paracentral cortex | Right precentral white matter volume/TIV | 0.0876 (0.0138) | 0.0840 (0.0096) | 2.379 | 0.021 |
| Left postcentral thickness | Pre, post and paracentral cortex | 2.064 (0.127) | 2.400 | 0.024 | |
| Left postcentral volume/TIV ratio | 0.0187 (0.0028) | 0.0175 (0.0024) | 2.523 | 0.015 | |
| Right postcentral white matter volume/TIV ratio | 0.0478 (0.0065) | 0.0465 (0.0065) | 2.284 | 0.026 | |
| Left paracentral white matter volume/TIV ratio | 0.0235 (0.0042) | 0.0226 (0.0045) | 2.664 | 0.010 | |
| Right paracentral white matter volume/TIV ratio | 0.0288 (0.0047) | 0.0208 (0.0044) | 3.011 | 0.004 | |
| Putamen | Right putamen volume/TIV ratio | 0.0274 (0.0004) | 0.0236 (0.0032) | 2.538 | 0.014 |
| Cerebellum | Left cerebellar white matter volume/TIV ratio | 0.0819 (0.0210) | 0.0786 (0.0221) | 2.05 | 0.045 |
| Lateral ventricle | Left lateral ventricle volume/TIV ratio | 0.0912 (0.0358) | 0.1067 (0.0557) | −2.082 | 0.042 |
| Right lateral ventricle volume/TIV ratio | 0.1063 (0.0429) | 0.1175 (0.0613) | −2.049 | 0.045 |
Reported p-values are uncorrected for multiple statistical comparisons.
TIV, total intracranial volume, all regional volumes reported here were in total intracranial volume.
The p-value is greater than 0.05. They are presented here to show the trend.
Next, we conducted MANCOVA analyses on the longitudinal data to examine the association between changes in cortical thickness (and in volumes) and changes in alcohol consumption (averaged and maximum number of drinks, separately) with age and gender as covariates. Results showed that the annualized change in cortical thickness (and in volumes) across all study participants was negatively correlated with changes in the average number of drinks per week in the following regions: mPFC, PCC, putamen, and postcentral cortex, which were consistent with the findings at baseline (Fig. 2A). ROI analysis revealed consistent results (Fig. 2B and Table 3). In addition, the ROI analysis also showed significantly negative correlation between changes in reported drinks and annualized changes in the mPFC white matter volume, left middle, bilateral inferior, and orbital frontal cortical thickness (MFC, IFC, & OFC), ACC cortical thickness and white matter volume, bilateral insula volume, inferior temporal cortical thickness and volume as well positive correlations with changes in the parieto-occipital and superior occipital cortical thickness and volumes.
FIGURE 2.
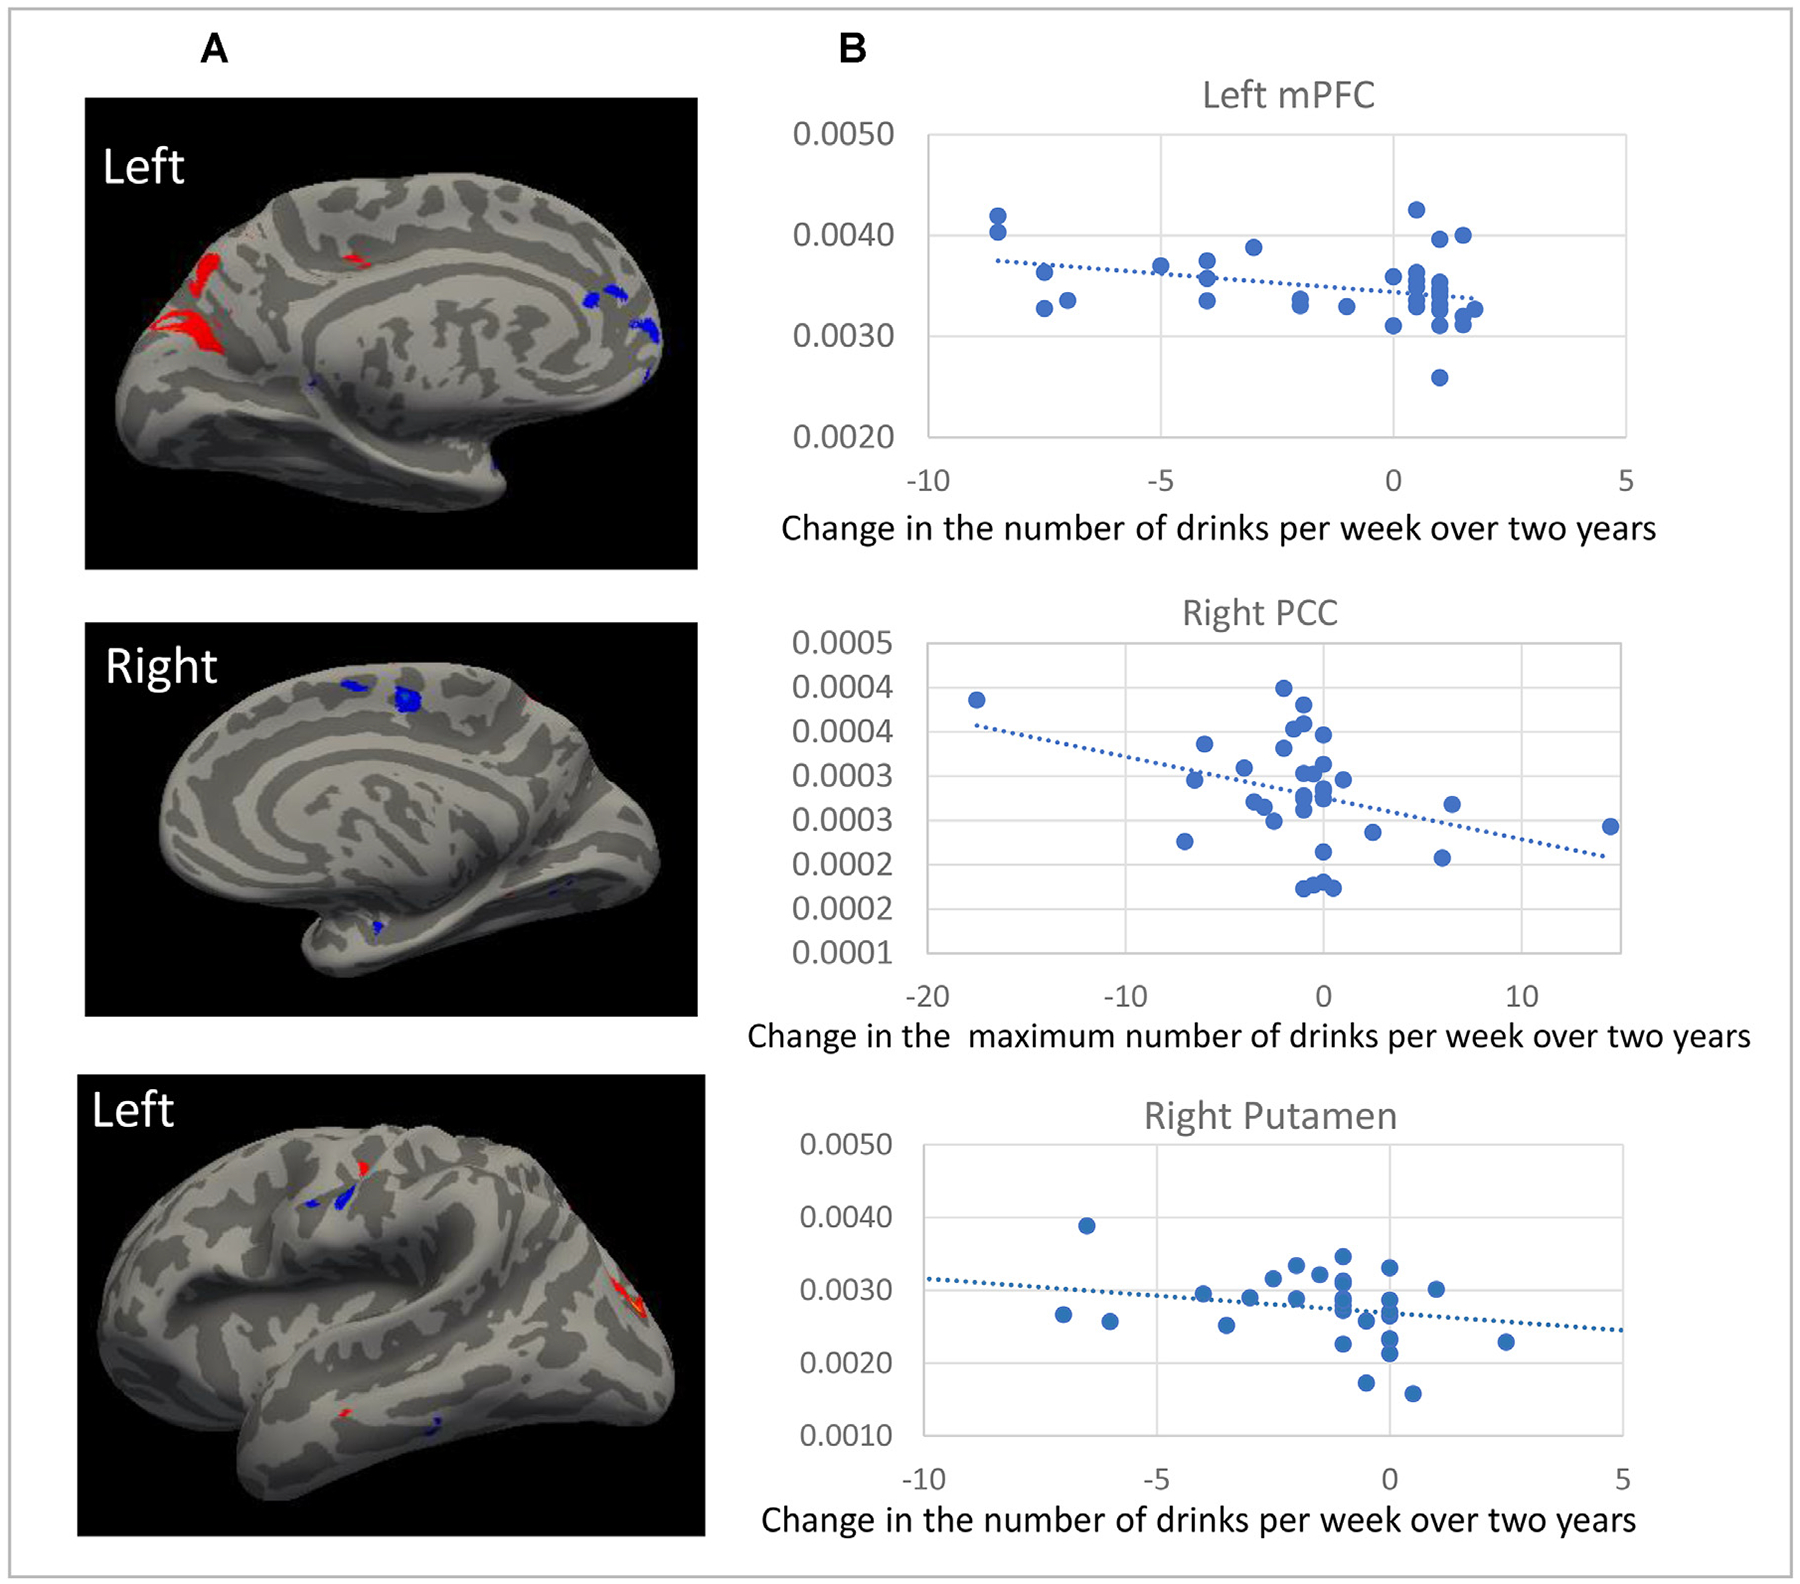
[A] Significant correlations between the change in average number of drinks per week over 2 years and the annualized changes in cortical thickness from whole-brain voxelwise analysis. Blue color = negative correlation, Red color = positive correlation [B] ROI analysis revealing significant correlation between the change in average number (or maximum number) of drinks per week over 2 years and the annualized changes in atlas-based regional volume.
TABLE 3.
Significant Correlations Between Annualized Changes in Brain Regional Thickness or Volumes And Changes in Alcohol Drinks Per Week, MADRS (Depression Severity), and Total CERAD (Cognitive Function) Over 2 Years From SPSS Using One-Way MANCOVA Analysis With Each Independent Variable Tested Separately and Controlled for Gender (df = 56)
| Brain Regions | Changes in Maximum Number of Drinks Per Week | Changes in Average Number of Drinks Per Week | Changes in MADRS | Changes in Total CERAD | Age | |
|---|---|---|---|---|---|---|
| Superior frontal gyrus (SFG)/ rostral Medial prefrontal cortex (mPFC) | Left SFG (T & V) | T: F = 6.17, p = 0.02 | ||||
| V: r = 0.42, p = 0.04 | ||||||
| Right SFG (T) | F = 5.29, p = 0.03 | |||||
| Left mPFC (WM) | F = 11.24, p = 0.002 | F = 8.42, p = 0.006 | F = 4.6, p = 0.04 | |||
| Left rectus (T) | F = 5.22, p = 0.03 | F = 4.23,p = 0.046 | ||||
| Left subcallosal (T & V) | T: F = 6.34, p = 0.02 | T: F = 4.45, p = 0.04 | ||||
| V:F = 11.7,p = 0.002 | ||||||
| Middle frontal gyrus (MFG) | Left MFG (T) | F = 7.10, p = 0.01 | F = 6.495, p = 0.015 | |||
| Right MFG (T) | F = 6.54, p = 0.015 | |||||
| Left caudal MFG (WM) | F = 6.97, p = 0.01 | |||||
| Inferior frontal gyrus (IFG) | Left IFG (T & V) | T: F = 6.59, p = 0.015 | T: F = 5.18, p = 0.029 | |||
| V: F = 4.97, p = 0.033 | ||||||
| Right IFG (T & V) | T: F = 9.95, p = 0.003 | T: F = 10.2, p = 0.003 | V: F = 4.6, p = 0.039 | V: F = 4.5,p = 0.04 | ||
| Left IFG pars triangularis (WM) | F = 4.338, p = 0.045 | |||||
| Right IFG pars orbitalis | T: F = 10.40, p = 0003 | T: F = 4.42, p = 0.042 | V: F = 11.5, p = 0.002 | |||
| (T, V, & WM) | WM: F = 5.01, p = 0.03 | |||||
| Orbitofrontal cortex (OFC) | Right OFC (T & V) | T: F = 12.56, p = 0.001 | T: F = 8.92, p = 0.005 | T: F = 5.52, p = 0.03 | V: F = 20.94 p <0.001 | V: F = 8.50, p = 0.006 |
| Left lateral OFC | WM: F = 9.04 p = 0.005 | WM: F = 6.4, p = 0.016 | V: F = 4.73, p = 0.037 | |||
| (V & WM) | ||||||
| Right lateral OFC (WM) | F = 7.66, p = 0.009 | F = 8.5, p = 0.006 | ||||
| Left OFC H shape (V) | F = 5.90, p = 0.021 | F = 10.19, p = 0.003 | ||||
| Right OFC H shape (T & V) | T: F = 6.46, p = 0.016 | |||||
| V: F = 7.73, p = 0.009 | ||||||
| Anterior cingulate cortex (ACC) | Right ACC (T & V) | T: F = 6.53, p = 0.015 | V: F = 8.7, p = 0.006 | T: F = 4.26, p = 0.047 | ||
| Left caudal ACC (WM) | F = 4.5, p = 0.041 | F = 5.5, p = 0.025 | ||||
| Right caudal ACC (WM) | F = 5.267, p = 0.028 | F = 4.156, p = 0.049 | ||||
| Left anterior-mid CC (T & V) | T: F = 4.50, p = 0.04 | T: F = 5.29, p = 0.026 | T: F = 4.0, p = 0.027 | |||
| V: F = 7.7, p = 0.009 | ||||||
| Pre- and postcentral cortex | Left precentral (T) | F = 5.07, p = 0.03 | ||||
| Right precentral (T) | F = 5.5, p = 0.025 | |||||
| Left postcentral (T & V) | T: F = 6.32, p = 0.017 | T: F = 5.28, p = 0.028 | T: F = 6.7, p = 0.014 | |||
| V:F = 11.2, p = 0.002 | ||||||
| Right postcentral (V) | F = 5.020, p = 0.032 | |||||
| Posterior cingulate cortex (PCC) & precuneus | Left mid-posterior CC (T) | T: F = 6.2, P = 0.018 | ||||
| Right mid-posterior CC | T: F = 7.8, p = 0.009 | T: F = 6.53, p = 0.015 | V: F = 4.8, p = 0.036 | |||
| (T & V) | ||||||
| Right isthmus cingulate (WM) | F = 4.19, p = 0.048 | |||||
| Right PCC (T, V, & WM) | T:F = 11.3,p = 0.002 | |||||
| V: F = 5.9,p = 0.02 WM:F = 5.6,p = 0.02 | ||||||
| Left PCC (WM) | F = 5.668 p = 0.023 | |||||
| Left cingulate marginal sulcus (T) | F = 9.46, p = 0.004 | F = 5.49, p = 0.025 | F = 5.18, p = 0.03 | |||
| Right cingulate marginal sulcus (T) | F = 4.38, p = 0.044 | |||||
| Left precuneus (T) | F = 4.16, p = 0.049 | F = 4.83, p = 0.04 | ||||
| Insula | Left anterior inferior insula (T & V) | V: F = 6.56, p = 0.015 | T: F = 4.7, p = 0.037 | V: F = 6.34, p = 0.017 | ||
| Right anterior inferior insula (T) | F = 4.72, p = 0.04 | F = 4.95, p = 0.033 | ||||
| Left central insula (V) | F = 9.54, p = 0.004 | F = 9.8, p = 0.004 | ||||
| Right superior insula T | F = 5.33, p = 0.027 | |||||
| Left insula short (V) | F = 9.42, p = 0.004 | F = 4.50, p = 0.041 | ||||
| Right insular short V | F = 4.26, p = 0.047 | F = 4.33, p = 0.021 | ||||
| Parietal cortex | Left superior parietal (V) | F = 8.56, p = 0.006 | F = 9.5, p = 0.004 | |||
| Right superior parietal (T & V) | T: F = 7.84, p = 0.008 | T: F = 13.1, p <0.001 | T: F = 4.87, p = 0.034 | |||
| V: F = 12.77, p = 0.001 | V: F = 4.36, p = 0.020 | |||||
| Left angular gyrus (T, V, & WM) | T: F = 6.52, p = 0.015 | T: F = 4.91,p = 0.33 | WM: F = 4.9, p = 0.03 | |||
| V: F = 8.45, p = 0.006 | WM: F = 6.4,p = 0.02 | |||||
| Temporal cortex | Left superior temporal (T & V) | T: F = 6.362, p = 0.017 | T: F = 4.604, p = 0.029 | V: F = 4.479, p = 0.042 | V: F = 5.730, p = 0.022 | |
| V: F = 15.320, p <0.001 | V: F = 11.783, p = 0.002 | |||||
| Right superior temporal (T & V) | F = 7.804, p = 0.009 | V: F = 13.439 p <0.001 | T: F = 5.086, p = 0.031 V: F = 5.487, p = 0.016 |
|||
| Left middle temporal (T & WM) | T = 6.05, p = 0.02 | WM: F = 4.24, p = 0.047 | ||||
| Left inferior temporal (T & V) | T: F = 12.86,p = 0.001 | T: F = 8.79, p = 0.005 | V: F = 4.99, p = 0.033 | T: F = 6.86, p = 0.013 | ||
| V: F = 4.68, p = 0.038 | V: F = 5.58, p = 0.024 | V: F = 7.84, p = 0.008 | ||||
| Right entorhinal (WM) | F = 8.3, p = 0.007 | |||||
| Left parahippocampus (T & V) | V: F = 4.6, p = 0.039 | T: F = 5.2,p = 0.03 | ||||
| Right parahippocampal (WM) | F = 4.36, p = 0.44 | F = 4.68,p = 0.038 | ||||
| Putamen | Left putamen (V) Right putamen (V) |
F = 8.13, p = 0.008 F = 8.66, p = 0.006 |
F = 4.19, p = 0.049 | |||
| Pallidum | Left pallidum (V) Right pallidum (V) |
F = 6.85, p = 0.014 F = 5.18, p = 0.030 |
||||
| Parieto-occipital cortex | Left parieto-occipital (T & V) | T: F = 11.59, p = 0.002 | T: F = 11.3, p = 0.002 | V: F = 6.40, p = 0.016 | V: F = 11.1, p = 0.002 | |
| Right parieto-occipital (T & V) | T: F = 6.83, p = 0.013 | T:F = 5.7, p = 0.02 | V:F = 4.25, p = 0.047 | |||
| Occipital-temporal cortex (OTC) | Left occipito-temporal (T & V) | T: F = 11.37, p = 0.002 V: F = 6.17, p = 0.018 |
T: F = 8.86, p = 0.005 V: F = 7.06, p = 0.012 |
V: F = 4.30, p = 0.047 | T: F = 5.41, p = 0.027 | |
| Right OTC thickness | F = 14.18, p <0.001 | F = 10.99, p = 0.002 | ||||
| Occipital cortex | Left superior occipital (T) | F = 4.88, p = 0.034 | F = 7.24, p = 0.011 | |||
| Right superior occipital (T&V) | T: F = 5.45, p = 0.026 V: F = 5.16, p = 0.030 |
T: F = 5.62, p = 0.023 V: F = 4.27, p = 0.022 |
T: F = 10.2, p = 0.003 | |||
| Right middle occipital (V) | F = 8.48,p = 0.002 | |||||
| White matter hypointensities | White matter hypointensities (V) | F = 8.68,p = 0.007 | ||||
T: cortical thickness; V: regional volume; WM: white matter volume.
To identify the similarity and differences in brain regions that may be related to alcohol consumption, depression, and cognitive function, we next conducted whole-brain MANCOVA with each independent variable (including age) separately and gender as a covariate. As shown in Figure 3 and Table 3, decreased MADRS score was associated with increased volume in the right IFC and OFC cortical thickness, bilateral lateral OFC white matter volume anterior and anterior-mid cingulate (ACC, mid CC), PCC and precuneus cortical thickness, and bilateral insula cortical thickness and volume, left entorhinal white matter volume, as well as decreased parieto-occipital thickness, temporal-occipital volume, and white matter hypointensity volume. Increased CERAD total score was associated with increased cortical thickness or volume in the mPFC (dorsal and ventral mPFC), IFC and OFC, ACC, PCC, insula, postcentral cortex, bilateral superior parietal cortex, superior and inferior temporal cortex, bilateral parahippocampal white matter volume, bilateral globus pallidum volume, and thinner occipital cortex. Older age at baseline was associated with smaller volume in the mFC, left caudal MFC white matter volume, right IFG volume, right OFC volume, bilateral precentral cortex, right insula, ACC thickness and white matter volume, superior and inferior parietal volume, right entorhinal and parahippocampus white matter volume., Conjunction analysis on changes in alcohol drinks, depressive severity, and cognitive function were identified in the mPFC, ACC, mid-CC, PCC, right IFC, and postcentral cortex, and temporal-occipital area (Fig. 4A). Adding age to the conjunction analysis revealed that mPFC (ventral and rostral mPFC) and PCC were involved in alcohol, depression, cognitive function, and aging.
FIGURE 3.
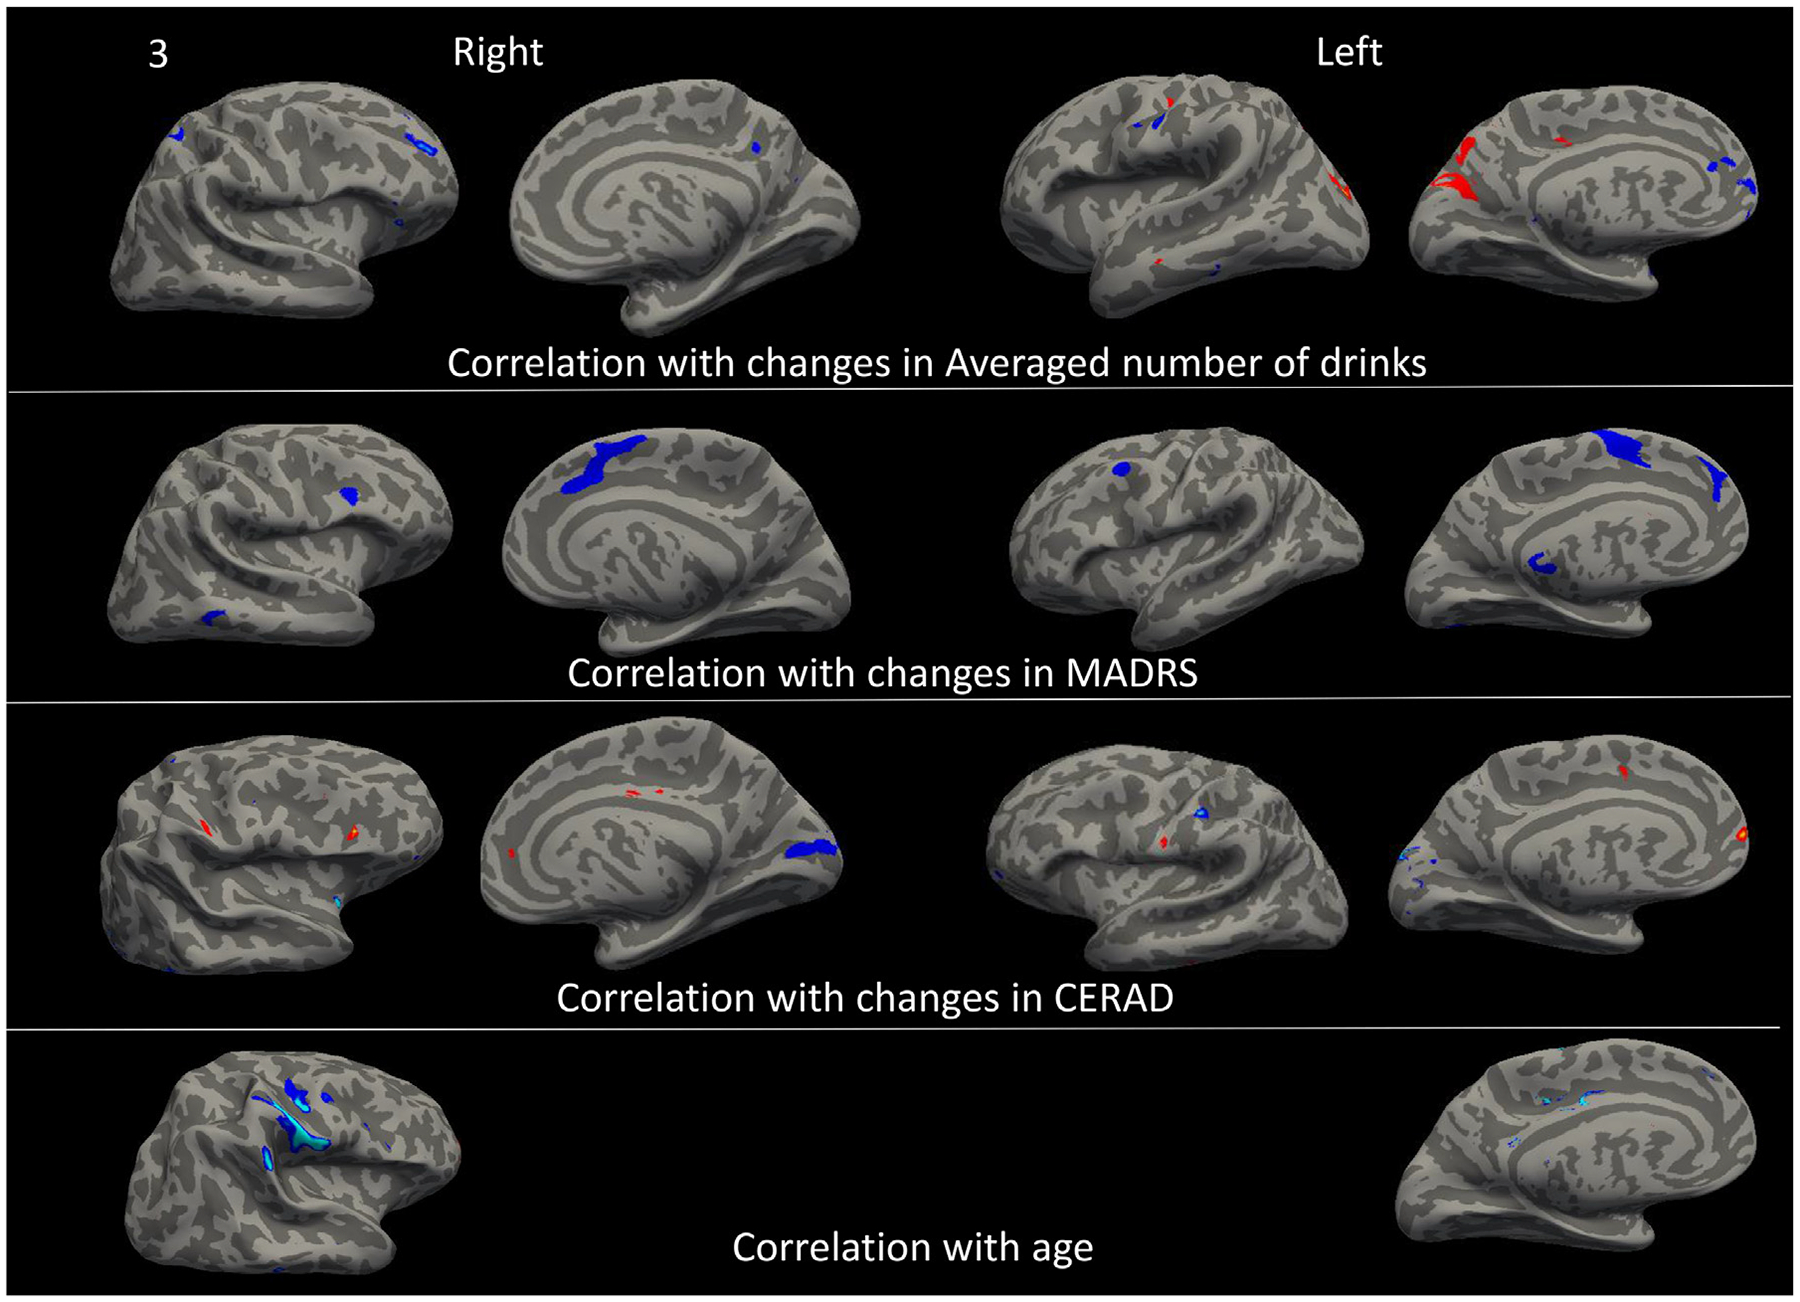
Comparison of brain regions that their annualized changes were significantly correlated with changes in alcohol consumption (measured by the average number of drinks per week over 2 years), depression severity (measured by MADRS), cognitive function (measured CERAD), and age at baseline. Blue color = negative correlation, Red color = positive correlation.
FIGURE 4.
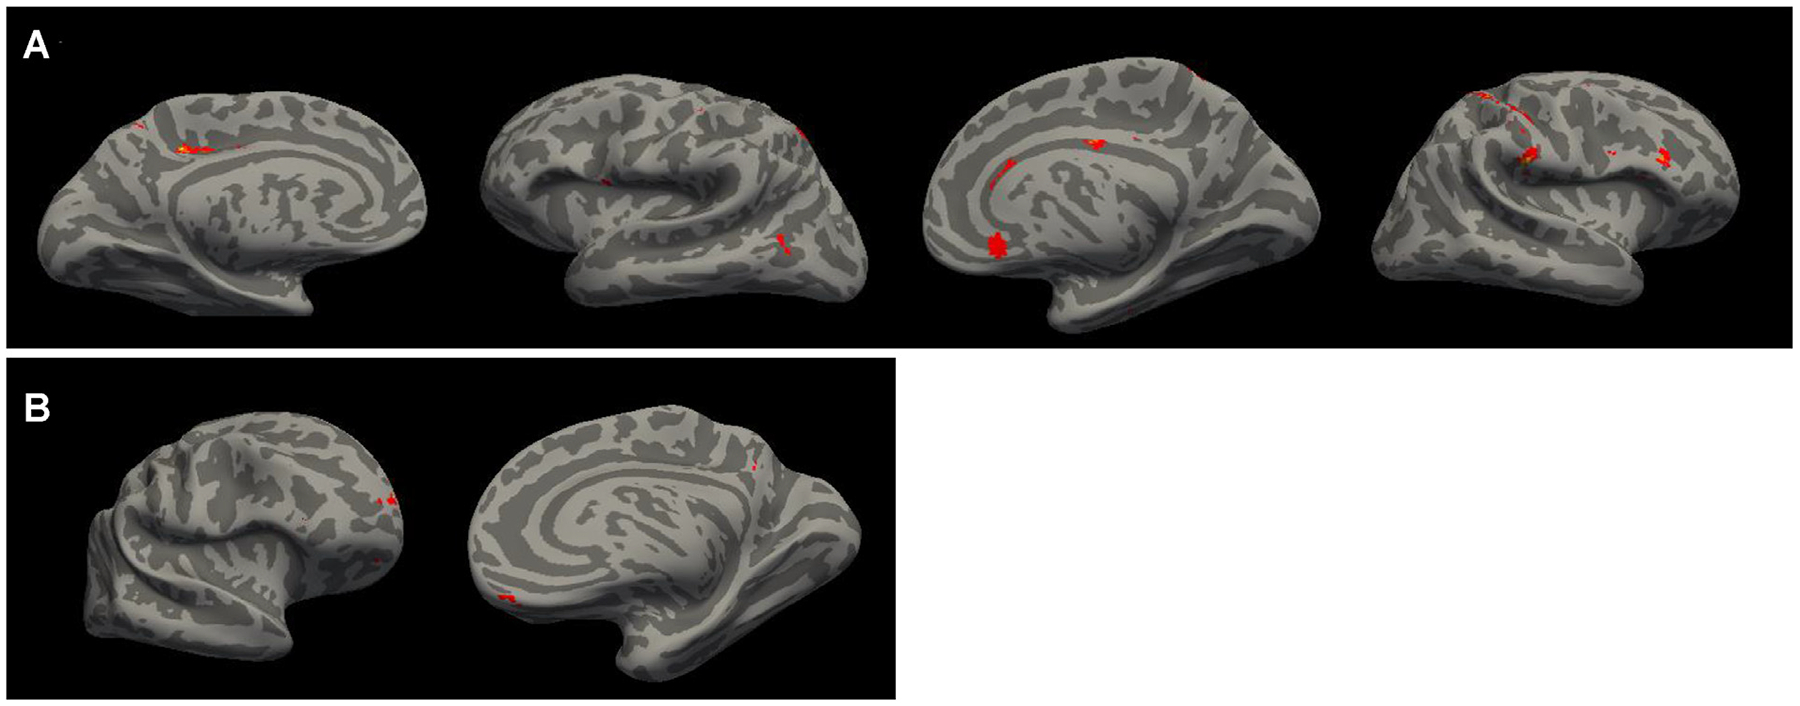
Conjunction analysis reveals the brain regions that their changes in cortical thickness were commonly correlated with changes in the average number of drinks per week, depression severity, and cognitive function [A], as well as with age [B] with p <0.025 without correction for multiple comparisons.
DISCUSSION
The major findings of this study are that in LLD, compared with moderate drinkers, risky drinkers showed significantly lower cognitive function, thinner cortical thickness and smaller volumes in several cortical regions, and that these changes were associated with 2-year change in reported drinking, and negatively associated with depression severity and positively correlated with cognitive change. Changes in the mPFC and PCC thickness which were commonly correlated with alcohol drinking, depression, cognitive function, also negatively correlated with age.
Our findings related to cortical thickness and volumes and reported alcohol drinking in older depressed adults are consistent with a meta-analysis on 27 studies with 1,045 AUD patients and 1,054 healthy controls.17 This study identified eight gray matter regions that had volume reduction in patients with AUD relative to controls, including the cingulate (anterior, middle, and posterior aspects), medial frontal gyri, paracentral lobes, left post- and precentral gyri, left anterior and right posterior insula and left superior frontal gyrus. The consistency of findings between the meta-analytic study in middle-aged adults with AUD and our study of older depressed patients with risky versus moderate drinking highlight the toxic effect of excessive alcohol consumption on the mPFC, PCC, and postcentral cortex. Both mPFC and PCC are key nodes of the default mode network. The mPFC sends and receives projections to and from sub-cortical regions including the extended amygdala and nucleus accumbens controlling mood, motivation and impulsivity.18 The mPFC also involves in executive function including decision-making and inhibition,18 as well as the extinction of alcohol-seeking behavior.19 A neuromodulatory study using rTMS theta burst stimulation to the mPFC in middle-aged adults with alcohol use disorder has shown to successfully lower alcohol consumption.20 Apparently, a thinner and smaller mPFC could be a major adverse effect of alcohol use.
Maladaptive responses of the mPFC to long-term alcohol use could enhance the salience of alcohol and cause inhibitory and executive control deficits, leading to alcohol craving, compulsive alcohol consumption, and deficits in working-memory and executive-control.19,21 Moreover, animal studies suggest that alcohol could produce differential effects on the activity of the mPFC following short- versus long-term alcohol consumption.22,23 Importantly, prospective studies examining long-term alcohol use and changes in the mPFC are lacking. Our longitudinal study suggests that an increase in chronic drinking is associated with a reduction of mPFC thickness and volume. The association of changes in mPFC cortical thickness/volume with changes in alcohol consumption, depression severity, and cognitive function highlighted the important role of this brain region in the comorbidities of alcohol use, depression, and cognitive impairment.
The PCC is mostly known for its role in memory retrieval which is consistent with our finding of a positive correlation between change in the PCC thickness and change in CERAD total score (of which a key component is learning, recall, and recognition). As a key node of the default-mode network, the PCC may also represent a shared neural substrate for avoidance, punishment sensitivity, and problem drinking.24 Gray matter volume of the PCC was found to be lower in alcohol-dependent drinkers than in healthy controls25–27 and predictive of shorter time to relapse to alcohol use.28 Further, PCC response to avoidance mediated the relationship between punishment sensitivity and alcohol use.24
Similar findings were found in the right inferior frontal cortex (IFC) and anterior cingulate cortex (ACC). The right IFC plays a key role in cognitive inhibition and is highly related to the drinking urge and unable to inhibiting drinking craving.29–31 The ACC, particularly the dorsal ACC (dACC) is a key brain region subserving sustained attention, conflict controlling, and executive function. Numerous studies have reported the association between structural and functional IFC and ACC with depression severity, cognitive impairment, and alcohol use.32–36 Our previous study also revealed that weakened ACC activation was associated with cognitive decline in older depressed adults.32 Therefore, IFG and ACC could also be an important region related to the intersecting comorbidities of alcohol use, major depression, and cognitive impairment. Future studies in large samples should be able to confirm the results.
The insular cortex is a core node of salience network, which has broad connections and integrates sensory-motor, socio-emotional, and cognitive function, and has been implicated in pathophysiology of several psychiatric disorders.37–39 A meta-analysis of 46 studies revealed the insula is one brain region identified with shared volumetric reductions between depression and mild cognitive impairment. Our finding that the thickness of insula was negatively correlated with alcohol drinking and positively correlated with cognitive function is in consistent with literature, which could be another potential therapeutic target for alcohol use.
Of note, in our older sample with depression, the majority of study participants showed reduced depression severity, improved cognitive function, decreased alcohol consumption, and increased cortical thickness and volumes over 2 years. Our results suggest that the impact of depression and alcohol use on the older brain may be reversible with antidepressant treatment. Increases in cognitive function in this sample are likely associated with practice effects, yet it is unclear that the marginal correlation between decreased alcohol use and increased cognition within individuals is fully explained by practice effects. This is an interesting question worthy of future exploration.
Limitations of this study include a relatively small sample size, especially of risky drinkers. Despite this, we were able to identify significant brain changes and to develop pilot data for larger studies, although we did not correct for multiple statistical comparisons in our ROI analyses. Additionally, variability of timing of the second scan could have affected results; we computed an annual change rate for the longitudinal data analysis to control for length of time between baseline and follow-up scans. The variability also meant that the 2-year clinical assessments may not have aligned well with the timing of the second scan. Future studies should better account for longitudinal use, assess binge drinking and include a nondepressed comparator group. In addition, our future studies should compare results of nondrinkers (both never-drinkers and former drinkers) to current drinker (both moderate and risky types). In NBOLD, the numbers of nondrinkers were quite small and precluded statistical comparisons.
Highlights.
-
What is the primary question addressed by this study?
Are there differences in structural brain changes over 2 years in older depressed adults who are risky versus moderate drinkers?
-
What is the main finding of this study?
Compared with moderate drinkers, risky drinkers at baseline had significantly thinner cortical thickness and smaller volume in several frontal cortical regions, posterior cingulate, postcentral cortices, right insula, right putamen, and right inferior parietal sulcus.
-
What is the meaning of the finding?
These MRI findings demonstrate the adverse impact of alcohol use in older adults on the fronto-striatal circuit.
DISCLOSURES
No disclosures to report. Supported by grants R01 MH108578, R01 MH098301, P30 AG067988, and P50 AA027055.
DATA SHARING STATEMENT
The datasets used and/or analyzed during the current study are publicly available via the NIMH Data Archive and are also available from the corresponding author upon reasonable request.
References
- 1.Kermel-Schiffman I, Afuta M, Zur A, et al. : Recovery from alcohol use disorder among older adults: a scoping review. J Appl Gerontol 2023; 42:1137–1150 [DOI] [PubMed] [Google Scholar]
- 2.Grucza RA, Sher KJ, Kerr WC, et al. : Trends in adult alcohol use and binge drinking in the early 21st-century United States: a meta-analysis of 6 national survey series. Alcohol Clin Exp Res 2018; 42:1939–1950 [DOI] [PMC free article] [PubMed] [Google Scholar]
- 3.White AM, Orosz A, Powell PA, et al. : Alcohol and aging - an area of increasing concern. Alcohol 2023; 107:19–27 [DOI] [PubMed] [Google Scholar]
- 4.Steffens DC, Wang L, Manning KJ, et al. : Alcohol Use Disorder in older adults: a review of recent literature on epidemiology, cognitive outcomes, and neuroimaging findings and treatment. Am J Geriatr Psychiatry Open Sci Ed Pract 2024; 1:39–51 [Google Scholar]
- 5.Kim YK, Han KM: Neural substrates for late-life depression: a selective review of structural neuroimaging studies. Prog Neuropsychopharmacol Biol Psychiatry 2021; 104:110010. [DOI] [PubMed] [Google Scholar]
- 6.Steffens DC, Wang L, Pearlson GD: Functional connectivity predictors of acute depression treatment outcome. Int Psychogeriatr 2019; 12:1831–1835 [DOI] [PMC free article] [PubMed] [Google Scholar]
- 7.Koob GF, Volkow ND: Neurocircuitry of addiction. Neuropsychopharmacology 2010; 35:217–238 [DOI] [PMC free article] [PubMed] [Google Scholar]
- 8.Livingston G, Huntley J, Sommerlad A, et al. : Dementia prevention, intervention, and care: 2020 report of the Lancet Commission. Lancet 2020; 396:413–446 [DOI] [PMC free article] [PubMed] [Google Scholar]
- 9.Sullivan EV, Pfefferbaum A: Brain-behavior relations and effects of aging and common comorbidities in alcohol use disorder: a review. Neuropsychology 2019; 33:760–780 [DOI] [PMC free article] [PubMed] [Google Scholar]
- 10.Steffens DC, Manning KJ, Wu R, et al. : Methodology and preliminary results from the neurobiology of late-life depression study. Int Psychogeriatr 2015; 27:1987–1997 [DOI] [PMC free article] [PubMed] [Google Scholar]
- 11.Kuerbis A, Sacco P, Blazer DG, et al. : Substance abuse among older adults. Clin Geriatr Med 2014; 30:629–654 [DOI] [PMC free article] [PubMed] [Google Scholar]
- 12.Montgomery SA, Asberg M: A new depression scale designed to be sensitive to change. Br J Psychiatry 1979; 134:382–389 [DOI] [PubMed] [Google Scholar]
- 13.Miller MD, Paradis CF, Houck PR, et al. : Rating chronic medical illness burden in geropsychiatric practice and research: application of the Cumulative Illness Rating Scale. Psychiatry Res 1992; 41:237–248 [DOI] [PubMed] [Google Scholar]
- 14.Morris JC, Heyman A, Mohs RC, et al. : The Consortium to Establish a Registry for Alzheimer’s Disease (CERAD). Part I. Clinical and neuropsychological assessment of Alzheimer’s disease. Neurology 1989; 39:1159–1165 [DOI] [PubMed] [Google Scholar]
- 15.Dale AM, Fischl B, Sereno MI: Cortical surface-based analysis. I. Segmentation and surface reconstruction. Neuroimage 1999; 9:179–194 [DOI] [PubMed] [Google Scholar]
- 16.Fischl B, Dale AM: Measuring the thickness of the human cerebral cortex from magnetic resonance images. Proc Natl Acad Sci U S A 2000; 97:11050–11055 [DOI] [PMC free article] [PubMed] [Google Scholar]
- 17.Spindler C, Trautmann S, Alexander N, et al. : Meta-analysis of grey matter changes and their behavioral characterization in patients with alcohol use disorder. Sci Rep 2021; 11:5238. [DOI] [PMC free article] [PubMed] [Google Scholar]
- 18.Klenowski PM: Emerging role for the medial prefrontal cortex in alcohol-seeking behaviors. Addict Behav 2018; 77:102–106 [DOI] [PubMed] [Google Scholar]
- 19.Gass JT, Chandler LJ: The plasticity of extinction: contribution of the prefrontal cortex in treating addiction through inhibitory learning. Front Psychiatry 2013; 4:46. [DOI] [PMC free article] [PubMed] [Google Scholar]
- 20.McCalley DM, Kaur N, Wolf JP, et al. : Medial prefrontal cortex theta burst stimulation improves treatment outcomes in alcohol use disorder: a double-blind, sham-controlled neuroimaging study. Biol Psychiatry Glob Open Sci 2023; 3:301–310 [DOI] [PMC free article] [PubMed] [Google Scholar]
- 21.Goldstein RZ, Volkow ND: Dysfunction of the prefrontal cortex in addiction: neuroimaging findings and clinical implications. Nat Rev Neurosci 2011; 12:652–669 [DOI] [PMC free article] [PubMed] [Google Scholar]
- 22.Tu Y, Kroener S, Abernathy K, et al. : Ethanol inhibits persistent activity in prefrontal cortical neurons. J Neurosci 2007; 27:4765–4775 [DOI] [PMC free article] [PubMed] [Google Scholar]
- 23.Klenowski PM, Fogarty MJ, Shariff M, et al. : Increased synaptic excitation and abnormal dendritic structure of prefrontal cortex layer V pyramidal neurons following prolonged binge-like consumption of ethanol. eNeuro 2016; 3:e0248–16 [DOI] [PMC free article] [PubMed] [Google Scholar]
- 24.Le TM, Zhornitsky S, Wang W, et al. : Posterior cingulate cortical response to active avoidance mediates the relationship between punishment sensitivity and problem drinking. J Neurosci 2019; 39:6354–6364 [DOI] [PMC free article] [PubMed] [Google Scholar]
- 25.Chanraud S, Reynaud M, Wessa M, et al. : Diffusion tensor tractography in mesencephalic bundles: relation to mental flexibility in detoxified alcohol-dependent subjects. Neuropsychopharmacology 2009; 34:1223–1232 [DOI] [PubMed] [Google Scholar]
- 26.Mashhoon Y, Czerkawski C, Crowley DJ, et al. : Binge alcohol consumption in emerging adults: anterior cingulate cortical “thinness” is associated with alcohol use patterns. Alcohol Clin Exp Res 2014; 38:1955–1964 [DOI] [PMC free article] [PubMed] [Google Scholar]
- 27.Mackey S, Allgaier N, Chaarani B, et al. : Mega-analysis of gray matter volume in substance dependence: general and substance-specific regional effects. Am J Psychiatry 2019; 176:119–128 [DOI] [PMC free article] [PubMed] [Google Scholar]
- 28.Rando K, Hong KI, Bhagwagar Z, et al. : Association of frontal and posterior cortical gray matter volume with time to alcohol relapse: a prospective study. Am J Psychiatry 2011; 168:183–192 [DOI] [PMC free article] [PubMed] [Google Scholar]
- 29.Aron AR, Robbins TW: Poldrack RA: inhibition and the right inferior frontal cortex: one decade on. Trends Cogn Sci 2014; 18:177–185 [DOI] [PubMed] [Google Scholar]
- 30.Wiers CE, Gawron CK, Gropper S, et al. : Decreased gray matter volume in inferior frontal gyrus is related to stop-signal task performance in alcohol-dependent patients. Psychiatry Res 2015; 233:125–130 [DOI] [PubMed] [Google Scholar]
- 31.Gropper S, Spengler S, Stuke H, et al. : Behavioral impulsivity mediates the relationship between decreased frontal gray matter volume and harmful alcohol drinking: a voxel-based morphometry study. J Psychiatr Res 2016; 83:16–23 [DOI] [PubMed] [Google Scholar]
- 32.Wang L, Potter GG, Krishnan RK, et al. : Neural correlates associated with cognitive decline in late-life depression. Am J Geriatr Psychiatry 2012; 20:653–663 [DOI] [PMC free article] [PubMed] [Google Scholar]
- 33.Ibrahim HM, Kulikova A, Ly H, et al. : Anterior cingulate cortex in individuals with depressive symptoms: a structural MRI study. Psychiatry Res Neuroimaging 2022; 319:111420. [DOI] [PMC free article] [PubMed] [Google Scholar]
- 34.Pizzagalli DA: Frontocingulate dysfunction in depression: toward biomarkers of treatment response. Neuropsychopharmacology 2011; 36:183–206 [DOI] [PMC free article] [PubMed] [Google Scholar]
- 35.Sheline YI, Price JL, Yan Z, et al. : Resting-state functional MRI in depression unmasks increased connectivity between networks via the dorsal nexus. Proc Natl Acad Sci U S A 2010; 107:11020–11025 [DOI] [PMC free article] [PubMed] [Google Scholar]
- 36.Zackova L, Jani M, Brazdil M, et al. : Cognitive impairment and depression: meta-analysis of structural magnetic resonance imaging studies. Neuroimage Clin 2021; 32:102830. [DOI] [PMC free article] [PubMed] [Google Scholar]
- 37.Uddin LQ, Nomi JS, Hebert-Seropian B, et al. : Structure and function of the human insula. J Clin Neurophysiol 2017; 34:300–306 [DOI] [PMC free article] [PubMed] [Google Scholar]
- 38.Takahashi T, Yucel M, Lorenzetti V, et al. : Volumetric MRI study of the insular cortex in individuals with current and past major depression. J Affect Disord 2010; 121:231–238 [DOI] [PubMed] [Google Scholar]
- 39.Li J, Tang Y, Womer F, et al. : Two patterns of anterior insular cortex functional connectivity in bipolar disorder and schizophrenia. World J Biol Psychiatry 2018; 19:S115–S123 [DOI] [PubMed] [Google Scholar]
Associated Data
This section collects any data citations, data availability statements, or supplementary materials included in this article.
Data Availability Statement
The datasets used and/or analyzed during the current study are publicly available via the NIMH Data Archive and are also available from the corresponding author upon reasonable request.