

ABSTRACT
Compared to skin wounds, oral mucosal wounds heal quicker with less inflammation, faster re‐epithelialization, and minimal scarring. Site‐specific keratinocytes may be one differentiating factor. This study used immortalized skin and oral keratinocytes (HaCaT and TIGK), which maintain fidelity to their primary cell counterpart, to examine functional and transcriptional differences that might contribute to the differential wound healing at the two sites. Oral keratinocytes were found to have an enhanced migratory and proliferative capacity. To examine the transcriptomic differences, we generated an mRNA‐sequencing gene expression dataset utilizing HaCaT and TIGK. Differentially expressed genes (DEGs) were identified between HaCaT and TIGK at baseline and throughout in vitro healing. DEGs in HaCaT and TIGK following injury were also identified when compared to each respective cell type's unwounded gene expression levels. Gene set enrichment analyses were performed to understand the biological significance of the DEGs. Processes related to interferon (IFN) signaling were uniquely enriched in TIGK. TIGK also exhibited a faster transcriptional response to injury and differential expression of integrins and matrix metalloproteinases (MMPs). When grown on extracellular matrix (ECM) proteins, TIGK retained its enhanced migratory capacity over HaCaT. Lastly, TIGK displayed a post‐injury secretome that promoted keratinocyte migration. Our comparative analyses suggest that specific transcriptomic differences between oral and skin keratinocytes at unwounded baseline and in response to injury may underlie the distinct wound healing phenotypes observed in these two tissues. This work also provides a new resource of HaCaT and TIGK gene expression data that can be used for future analyses.
Keywords: keratinocytes, mouth mucosa, skin, transcription factors, wound healing
To examine the site‐specific differences underlying the wound healing outcomes of skin versus oral wounds, immortalized oral (TIGK) and skin (HaCaT) keratinocytes were examined for functional and transcriptional differences. TIGK have enhanced migration and proliferation. RNA sequencing found significant transcriptomic differences between HaCaT and TIGK. TIGK transcriptome supports a quicker injury response. Integrin and matrix metalloproteinase expression in HaCaT and TIGK may influence their migration and proliferation when grown on extracellular matrix (ECM) proteins. Lastly, the TIGK post‐injury secretome promotes migration.

1. Introduction
Wound healing is an essential process that follows tissue injury. In mammals, the result is nearly always the formation of a scar. In skin, some scars may become keloids or hypertrophic scars, or result in painful contractures that significantly impact function [1]. One tissue that exhibits enhanced wound healing is the oral mucosa. Although oral mucosal and skin wounds proceed through similar stages of healing, oral mucosal wounds heal more rapidly with faster re‐epithelialization and less scarring and inflammation [2, 3, 4, 5, 6, 7, 8, 9]. Our lab and others have shown that whole tissue oral mucosal and skin wounds have site‐specific differences in their transcriptomic response to injury [4, 7, 10, 11].
Prior studies also suggest that site‐specific differences in wound healing are not simply due to environmental factors [8, 9, 12, 13, 14, 15]. The rapid healing of oral mucosa is likely due to the intrinsic cellular differences in the response to injury [2, 3]. A critical aspect of wound healing is re‐epithelialization, which results in the restoration of the epithelium and barrier function. Re‐epithelialization occurs during the proliferative phase when epithelial cells near the wound edge proliferate and migrate to replace cells lost to injury [1]. In the skin and many areas of the oral mucosa, the epithelial cells at the surface are keratinocytes. Given the breadth of cellular activity that keratinocytes exhibit during wound healing and their importance for wound re‐epithelialization, intrinsic keratinocyte characteristics have been suggested as a likely differentiating factor in skin and oral mucosa wounds [5, 16, 17, 18, 19, 20]. While some studies have compared the relative expression of specific genes between skin and oral keratinocytes, a direct and in‐depth sequencing analysis has yet to be performed [4, 10, 11]. While important, these prior studies have only provided a piecewise explanation for what drives the phenotypic differences between skin and oral keratinocytes during wound healing. Our study fills this gap in knowledge and demonstrates that the differences in the wound‐healing response of skin and oral keratinocytes are reflected in their transcriptome.
The current study utilizes the immortalized keratinocyte cell lines HaCaT and TIGK in lieu of primary keratinocytes. Primary keratinocytes are difficult to culture as they have a fairly short lifespan and require supplementary growth factors [21, 22, 23]. There are also reproducibility issues since primary keratinocytes exhibit donor‐to‐donor variability and changes in proliferation and differentiation characteristics between passages [21, 22, 23]. These issues are less pronounced in HaCaT and TIGK. Additionally, HaCaT and TIGK have functional characteristics, morphogenesis, and expression of cytokeratins, as well as other major surface markers similar to their parental primary cell [21, 22, 23]. Both of these cell lines are also already widely used as in vitro model systems of skin and oral wound healing [10, 11, 21, 22, 23, 24, 25, 26, 27].
RNA was isolated from HaCaT and TIGK at three distinct time points following in vitro wounding, and mRNA‐sequencing analysis was performed to compare the transcriptome between HaCaT and TIGK at baseline and in response to injury. Our analysis found that HaCaT and TIGK exhibit unique transcriptional responses that align with the tissue‐specific differences in healing.
2. Methods and Materials
2.1. Cell Culture
Spontaneously immortalized skin keratinocytes (HaCaT) (AddexBio, San Diego, CA, USA, Catalog # T0020001), human telomerase immortalized gingival keratinocytes (TIGK) developed by Dr. Richard Lamont, and primary human epidermal keratinocytes (NHEK—normal human epithelial keratinocytes) (ATCC, Manassas, Virginia, USA, Catalog no. PCS‐200‐011) were propagated in DermaLife K Keratinocyte Complete Medium (Lifeline Cell Technology, Frederick, MD, USA, Catalog no. LL‐0007) containing D‐Glucose (6 mM), insulin (5 μg/mL), L‐Glutamine (6 mM), epinephrine (1 μM), apo‐transferrin (5 μg/mL), TGF‐α (0.5 ng/mL), pituitary extract (0.4%), and hydrocortisone hemisuccinate (100 ng/mL) [22]. HaCaT, TIGK, and NHEK were cultured at 37°C with 5% CO2 and used for in vitro assays when 80%–90% confluent.
2.2. Assessment of Cell Migration and Proliferation
Cell migration was assessed using an in vitro wounding model in which HaCaT and TIGK were grown in a 12‐well plate until confluent and then treated with mitomycin‐C (1 μg/mL) (Sigma‐Aldrich, St. Louis, MO, USA) for 1 h to inhibit proliferation. In vitro wounds were created by performing a one × one cross‐scratch, which consisted of scraping the plate horizontally and vertically across with a 200 μL pipette tip. After wounding, cells were washed with PBS, and fresh media were added. Open areas were photographed at 0, 24, and 48 h after wounding and measured using ImageJ [28]. The migration rate is expressed as a percentage of wounds closed at each time point.
Cell proliferation was assessed by seeding 5000 HaCaT or TIGK into each well of a 96‐well plate. Proliferation was assessed at 48 and 96 h using an MTS Cell Proliferation Assay Kit (Abcam, Waltham, MA, USA, Catalog no. ab197010). Optical density (O.D.) values were read at an absorbance of 490 nm and recorded using a spectrophotometer (Molecular Devices, San Jose, CA, USA).
Cell migration and proliferation across different substrates were assessed by seeding HaCaT or TIGK into 12‐ and 96‐well plates coated with rat tail collagen I (4.44 mg/mL stock; Corning Inc., Corning, NY, USA, Catalog no. 354236) at 10 μg/cm2, human laminin (0.5 mg/mL stock; Sigma‐Aldrich, Catalog no. L4544) at 2 μg/cm2, or human collagen IV (0.3 mg/mL stock; Sigma‐Aldrich, Catalog no. C6745) at 10 μg/cm2. Migration and proliferation were then assessed as described above.
The effects of type I IFN on HaCaT migration and proliferation were assessed by first treating confluent HaCaT seeded in a 12‐well plate with 10 Units/mL Universal Type I IFN (R&D Systems, Minneapolis, MN, USA, Catalog no. 11020‐IF‐010) for 24 h. HaCaT were then scratched or seeded into a 96‐well plate for migration or proliferation assays as described above. Fresh media containing 10 Units/mL Type I IFN was added after scratch wounding or seeding. A dose‐escalation study was performed with the following doses (U/mL): 0, 5, 10, 100, 250, and 1000.
The effect of type I IFN neutralization on TIGK migration was assessed by performing a scratch assay as described. After scratching, TIGK were treated with human IFN‐α/β receptors (R&D Systems, Catalog no. 245‐AB). A dose‐escalation study was performed with the following doses (ng/mL): 0, 5, 25, 50, 250, and 500.
The effects of the secretome of HaCaT and TIGK were studied in migration and proliferation assays as described above. Following scratch wounding or post‐seeding into a 96‐well plate, media supplemented with HaCaT conditioned media (CM) was added to TIGK, while media supplemented with TIGK CM was added to HaCaT or NHEK. The percentages of CM used for these assays were 0%, 10%, 25%, and 50%.
2.3. Conditioned Media Collection
HaCaT and TIGK were grown to 100% confluency in a 6‐well plate and then wounded with three × three cross‐scratches. After washing twice with PBS, 2 mL of fresh media was added. Twenty‐four hours later, the CM was centrifuged at 1000× g for 10 min and used in a cell migration or proliferation assay. Extra CM was stored at −80°C.
2.4. RNA Extraction, Library Preparation, and Data Processing for mRNA‐Sequencing
We performed mRNA‐sequencing analysis to molecularly characterize the differences between the wound healing response of HaCaT and TIGK. HaCaT and TIGK were grown to 80%–90% confluency in multiple 6‐well plates. Three × three cross‐scratches were made in each well to ensure an ample number of injured cells, and RNA was collected at 6 and 24 h post‐wounding. RNA from non‐scratched HaCaT and TIGK was collected and considered the uninjured baseline or 0 h time point. There were three biological replicates for each cell type at each time point, resulting in 18 samples. Total RNA was isolated using TRIzol (Invitrogen, Waltham, MA, USA), purified with an RNA Clean & Concentrator‐25 kit (Zymo, Tustin, CA, USA), and treated with DNAse (ThermoFisher Scientific, Waltham, MA, USA). RNA integrity numbers (RIN) were checked with an Agilent Technologies 2100 Bioanalyzer (Agilent Technologies, Santa Clara, CA, USA). All samples had an RIN between 8.9–9.4.
Libraries generated from mRNA‐sequencing were checked with Qubit and real‐time (RT) PCR for quantification and a bioanalyzer for size distribution detection. Quantified libraries were pooled and sequenced on Illumina sequencing platforms (Illumina, Omaha, NE, USA), and clean data were obtained using in‐house Perl scripts from Novogene (Novogene America, Sacramento, CA, USA). Hisat2 (v2.0.5) was used to index and map reads to the human reference genome (GRCh38/hg38), and the mapped reads were assembled by StringTie (v1.3.3b) [29]. Read numbers mapped to each gene were counted in R using the FeatureCounts package (v1.5.0‐p3), and an FPKM of each gene was calculated [30]. The library preparation, genome mapping, and raw gene counts for mRNA‐sequencing analysis were performed by Novogene (Novogene America).
All analyses described below were done by us using R (v4.3.2) with Bioconductor v3.17. Differential expression analysis of the raw count data generated by Novogene (Novogene America) was performed by utilizing the DESeq2 package (v1.20.0) in R [31]. Only genes with at least an average raw count of 10 across all samples were analyzed. The resulting p‐values were adjusted using Benjamini and Hochberg's approach for controlling the false discovery rate (FDR) [31, 32]. Genes with an adjusted p‐value (p.adj) < 0.05 were assigned as being a DEG after DESeq2 analysis. For data visualization and principal component analysis (PCA), count data underwent variance stabilized transformation using the vst() function in DESeq2 and saved. PCA was then performed using the top 500‐highly variable genes for each sample and plotted. A Pearson's correlation coefficient based on the computed Euclidean distance matrix and hierarchical clustering using the complete agglomeration method was also performed. Pearson's correlation coefficients between samples of the same experimental group were averaged to form an aggregate value and then visualized as a heatmap. Afterward, we assessed differentially regulated genes in HaCaT and TIGK at baseline (0 h) and throughout healing (6 and 24 h) using the following parameters: p.adj < 0.01 and log(foldchange) > 1.5 or log(foldchange) < −1.5. A gene with a positive log(foldchange) was considered differentially expressed in HaCaT, while a gene with a negative log(foldchange) was considered differentially expressed in TIGK. Comparisons of the injury response were done by identifying the DEGs in HaCaT or TIGK at 6 or 24 h relative to their 0 h using the following parameters: p.adj < 0.01 and log(foldchange) > 0.2 or log(foldchange) < −0.2. Genes with a positive log(foldchange) were considered upregulated following injury, while genes with a negative log(foldchange) were considered downregulated following injury. Differentially expressed transcription factors between HaCaT and TIGK at baseline (0 h), throughout healing (6 and 24 h), and in response to injury (6 or 24 h vs. 0 h) were identified by intersecting lists of DEGs for each comparison with a list of predicted human transcription factors [33]. A list of genes corresponding to secreted proteins or the secretome of HaCaT and TIGK at 24 h relative to their 0 h was identified by intersecting the differentially upregulated genes at 24 versus 0 h with a list of predicted secreted proteins [34]. Z‐scores for genes were generated using normalized gene counts and plotted as a heatmap in R [35]. Venn diagrams were made with Venny [36].
2.5. Comparison of HaCaT and TIGK to Primary Skin and Oral Keratinocytes
Raw count matrices from mRNA‐sequencing of NHEK and normal human oral keratinocytes (NHOK) were acquired from GSE184119 and GSE262505, respectively [37, 38]. Raw counts for each gene identified in HaCaT and TIGK at unwounded baseline (0 h) from our generated mRNA‐sequencing dataset and in the samples from GSE184119 and GSE262505 were averaged. The top 500 genes based on average counts were identified in unwounded HaCaT, TIGK, NHEK, and NHOK. We then determined how many of these top 500 genes were shared or different between HaCaT and NHEK, TIGK and NHOK, HaCaT and TIGK, and NHEK and NHOK. The top 500 genes identified in each cell line also underwent reactome term enrichment analysis to determine their biological significance.
2.6. Gene Ontology (GO) and Reactome Enrichment Analysis of DEGs
GO biological processes (BP) and reactome enrichment analysis were performed with EnrichR [39, 40, 41]. P‐values were adjusted using the Benjamini and Hochberg's approach for controlling the FDR. GO BP and reactome terms with p.adj < 0.05 were considered significantly enriched, and only the top 25 terms based on p.adj were included in our analysis.
2.7. Gene Set Enrichment Analysis (GSEA) With GenePattern Platform
GSEA (version 20.4.0) of our mRNA‐sequencing generated gene sets was performed using the GenePattern Platform (https://www.genepattern.org/) [42, 43, 44]. Input gene sets were prepared as recommended by GenePattern and each probe set in the expression dataset was collapsed into a single vector for each gene [43, 44]. GSEA for GO BP and reactome terms was performed using the following reference databases stored in GenePattern: c2.cp.reactome.v2024.1.Hs.symbols.gmt and c5.go.bp.v2024.1.Hs.symbols.gmt [43]. Additionally, the gene_set permutation type and Human_Gene_Symbol_with_Remapping_MSigDB.V2 were used for our GSEA [43]. Pathways were evaluated by their normalized enrichment score (NES), nominal p‐values (NOM p‐val) assigned based on 1000 random permutation tests, and false discovery rates (FDR q‐val). For comparisons of gene sets between HaCaT and TIGK at baseline and during healing, a positive NES indicated a pathway enriched in TIGK while a negative NES indicated a pathway enriched in HaCaT. For comparisons of gene sets activated during injury in HaCaT and TIGK, a negative NES indicated a pathway enriched after injury as uninjured HaCaT or TIGK were compared to HaCaT or TIGK at 6 or 24 h. A gene set was significantly enriched when its NOM p‐val was < 0.05 and FDR q‐val was < 0.25 [42, 43, 44]. Only the top 20 GSEA terms based on NES, NOM p‐val, and FDR q‐val were included in our analyses.
2.8. Real Time‐PCR (RT‐PCR) Analysis
HaCaT cultured in 12‐well plates were treated with 10 Units/mL Type I IFN for 24 h, and then one × one cross‐scratches were made. After wounding, fresh media containing 10 Units/mL Type I IFN was added. Twenty‐four hours later, total RNA was extracted using TRIzol (Invitrogen). One μg total RNA was then treated with DNase (ThermoFisher Scientific) and converted to cDNA using a High‐Capacity cDNA Reverse Transcription Kit (Invitrogen). Relative expression of IFN‐stimulated genes (ISGs) pertaining to IFN activation was determined by semi‐quantitative PCR on a StepOnePlus RealTime PCR System (Applied Biosystems, Waltham, MA) using Power SYBR Green PCR Master Mix (Roche, Basel, Switzerland). The 2−ΔΔCT method was employed to determine the relative expression of target genes [45]. Glyceraldehyde‐3‐phosphate dehydrogenase (GAPDH) was used as a reference gene. Untreated and wounded HaCaT were used as a baseline for comparisons. Table S1 shows the genes and primers used for our RT‐PCR analyses.
2.9. Statistical Analysis
Data are expressed as mean ± standard deviation (SD), and their normality was evaluated using the Shapiro–Wilk tests. Statistical comparisons were performed using a two‐way ANOVA or multiple two‐tailed unpaired t‐test with Welch's correction followed by a two‐stage linear step‐up procedure of Benjamini, Krieger, and Yekutieli post hoc testing using GraphPad Prism version 8.0 (GraphPad, San Diego, CA, USA). Outliers were removed by Grub's test with an alpha significance level of 0.05. For our statistical comparisons, p‐values less than 0.05 were considered statistically significant. For all experiments, a power analysis using data from previous experiments was performed to estimate the n needed to identify differences between the groups with 80% accuracy (beta = 0.2) and alpha = 0.05.
3. Results
3.1. TIGK Have Enhanced Migratory and Proliferative Capacity as Compared to HaCaT
Previous work has shown that primary human oral keratinocytes have faster migration and enhanced proliferation relative to primary skin keratinocytes in vitro [5]. To examine whether these functional differences are exhibited in HaCaT and TIGK, we utilized an in vitro wound healing model to assess migration and performed an MTS proliferation assay over multiple time points. Compared to HaCaT, TIGK exhibited significantly faster closure of gap area following in vitro wounding and increased proliferation at 96 h post‐seeding in vitro (Tables S1–S31) (Figure 1A–C). These results coincide with previous work using primary human skin and oral keratinocytes and demonstrate that HaCaT and TIGK maintain fidelity to primary oral and skin keratinocytes in these two functional assays [5].
FIGURE 1.

TIGK exhibits enhanced migratory and proliferative capacity over HaCaT in vitro. (A) Representative photos of in vitro vertical HaCaT and TIGK wounds closing after one × one cross‐scratching. A black line outlines areas not covered by cells. (B) Rate of cell migration, expressed as a percentage of wound closed at each time point. N = 18–19. (C) Proliferation of HaCaT and TIGK at 48 and 96 h post‐seeding was assessed by MTS assay. N = 6, with each dot representing a biological replicate that consists of 3 technical replicates. Bars indicate mean ± SD for all graphs. *p < 0.01, **p < 0.0001. Two‐way ANOVA with a two‐stage linear step‐up procedure of Benjamini, Krieger, and Yekutieli post hoc testing (vs. HaCaT).
3.2. TIGK and HaCaT Maintain Transcriptomic Fidelity to Their Parental Primary Cell
The top 500 expressed genes of unwounded HaCaT, TIGK, NHEK, and NHOK were identified using raw count matrices from mRNA‐sequencing datasets. To assess how similar the transcriptomes of HaCaT and TIGK are to their parental primary cells, we compared the top 500 expressed genes in HaCaT and TIGK to NHEK and NHOK, respectively. HaCaT and NHEK share 281 of their top 500 genes (39.1% of all genes), while TIGK and NHOK share 314 genes (45.8% of all genes) (Figure 2A,B). Almost all of the top 10 reactome terms enriched within the top 500 genes of HaCaT, TIGK, NHEK, and NHOK are also shared among the 4 cell types (Figure 2C–J). This further demonstrates the similarities between the immortalized cell lines with their parental primary cell and each other. The top 10 significant reactome terms and their annotated genes are listed in Tables S2–S5. When comparing HaCaT and TIGK transcriptomes, we found that they share 369 of their top 500 genes (58.5% of all genes) (Figure S1A). NHEK and NHOK share 328 of their top 500 genes (48.8% of all genes) (Figure S1B). The similarities in the top expressed genes between skin and oral keratinocytes suggest that their phenotypic differences may, in part, be driven by the differential expression of shared genes. Our results also establish that HaCaT and TIGK maintain transcriptomic fidelity to NHEK and NHOK, respectively.
FIGURE 2.

HaCaT and TIGK maintain transcriptomic fidelity to their respective parental primary cells NHEK and NHOK. The top 500 expressed genes of unwounded HaCaT, TIGK, NHEK (GSE184119), and NHOK (GSE262505) were identified using raw count matrices from mRNA‐sequencing datasets. Venn diagram comparing the top 500 expressed genes between (A) HaCaT and NHEK, and (B) TIGK and NHOK. Top 10 significantly enriched reactome terms for the top 500 expressed genes in unwounded (C) HaCaT, (D) TIGK, (E) NHEK, and (F) NHOK. Venn diagram comparing the top 10 significantly enriched reactome terms for (G) HaCaT and NHEK and (H) TIGK and NHOK. Table listing the shared and unshared top 10 significantly enriched reactome terms for (I) HaCaT and NHEK, and (J) TIGK and NHOK.
3.3. HaCaT and TIGK Cluster Both by Cell Type and Time After Injury
In vitro wound healing gene expression datasets were generated through mRNA‐sequencing analysis of HaCaT and TIGK at three time points post‐wounding (0, 6, and 24 h). PCA showed that the first two PCs account for 90.96% and 5.65% of the observed variance in the dataset, respectively, and distinguish the samples by cell type and time (Figure 3A). Samples were then grouped by cell type and time post‐wounding, and the mean gene expression value was calculated for each gene within each group. An aggregate Pearson's correlation coefficient was calculated for each group's mean gene expression data (Figure 3B). Our PCA and Pearson's correlation analysis show that HaCaT and TIGK cluster first by cell type and then by their temporal response to injury (Figure 3).
FIGURE 3.

Comparative analysis of the transcriptomic response of HaCaT and TIGK to injury reveals they cluster primarily by cell type and then by time post‐wounding. (A) Principal component analysis plot of mRNA‐sequencing expression data. A colored point on the graph represents each sample. The hours (h) post‐wounding are depicted by 0, 6, and 24, with 0 representing unwounded baseline HaCaT and TIGK. The x‐axis and y‐axis are the first and second principal components, respectively. (B) Heatmap representing similarities of the mean gene expression profiles grouped by keratinocyte cell type (oral vs. skin) and time post‐wounding: 0, 6, and 24 h. Each square and its color represents aggregate Pearson's correlation coefficient values between each experimental group (cell type and time post‐wounding).
3.4. Significant Transcriptomic Differences Exist Between HaCaT and TIGK at Baseline and Throughout In Vitro Wound Healing
The mRNA‐sequencing data was examined to determine the number of DEGs between HaCaT and TIGK at each of the three time points and the directionality of the differences (Figure 4A). At unwounded baseline (0 h), there were 2451 total DEGs between HaCaT and TIGK with 765 genes upregulated in HaCaT and 1686 genes upregulated in TIGK (Figure 4A). At 6 h, there were 2344 total DEGs between HaCaT and TIGK with 720 genes upregulated in HaCaT and 1624 genes upregulated in TIGK (Figure 4A). At 24 h, there were 2203 total DEGs between HaCaT and TIGK with 862 genes upregulated in HaCaT and 1341 genes upregulated in TIGK (Figure 4A). Our differential gene expression analysis shows that at baseline and during healing, there are significant transcriptomic differences between TIGK and HaCaT.
FIGURE 4.

Enrichment of genes up‐regulated in TIGK relative to HaCaT at 0, 6, and 24 h post‐wounding reveal that wound‐activated transcriptional networks are present in both unwounded and wounded TIGK. (A) Volcano plot showing the differentially expressed genes in HaCaT and TIGK at 0, 6, and 24 h. (B) Significantly enriched reactome terms for genes up‐regulated in TIGK relative to HaCaT at 0 h. (C) Venn diagram comparing the up‐regulated genes in TIGK relative to HaCaT at 0, 6, and 24 h. Top 10 significantly enriched (D) gene ontology biological processes (GO BP) and (E) reactome terms for genes up‐regulated in TIGK relative to HaCaT at 0, 6, and 24 h. Top 10 significantly enriched gene set enrichment analyses identified GO BP and reactome terms for TIGK relative to HaCaT at (F) 0 h, (G) 6 h, and (H) 24 h.
To examine whether baseline genomic differences could help explain TIGK's enhanced migratory and proliferative capacity over HaCaT, we analyzed the DEGs upregulated in TIGK versus HaCaT at baseline (0 h). Additionally, we performed reactome enrichment analysis on these DEGs to identify processes potentially upregulated in TIGK relative to HaCaT. Significant reactome terms and their annotated genes are listed in Table S6. Reactome terms, ranked and color‐coded by the percentage of genes annotated to each term's gene set, are shown in Figure 4B. Terms enriched in TIGK relate to inflammation, such as IFN Alpha/Beta and IL‐35 signaling (Figure 4B) [46, 47, 48].
To determine what processes and signaling pathways are consistently enriched in TIGK throughout all of healing, we performed GO BP and reactome pathway enrichment analysis on the 1093 genes differentially upregulated in TIGK relative to HaCaT at baseline (0 h) and throughout wound healing (6 and 24 h) (Figure 4C). Significant GO BP and reactome terms as well as their annotated genes are listed in Tables S7 and S8. The top 10 significant GO BP and reactome terms ranked and color‐coded by the percentage of genes annotated to each term's gene set are shown in Figure 4D,E. Terms relating to inflammatory pathways and ECM modification were enriched for genes differentially upregulated in TIGK at all times. Specific terms include Interferon Alpha/Beta Signaling, Interferon Signaling, Collagen Biosynthesis and Modifying Enzymes, and ECM organization (Figure 4D,E, and Tables S7 and S8).
To confirm our GO BP and reactome enrichment analysis and possibly identify other processes enriched in TIGK relative to HaCaT, we performed GSEA for GO BP and reactome terms utilizing DESeq2 normalized count data for our mRNA‐sequencing generated gene sets as recommended by the Broad Institute [43, 44]. Significant GSEA terms enriched in TIGK relative to HaCaT at 0, 6, and 24 h and their annotated genes are listed in Tables S9–S11. Significant GSEA terms enriched in HaCaT relative to TIGK at 0, 6, and 24 h and their annotated genes are listed in Tables S12–S14. The top 10 GSEA terms enriched in TIGK relative to HaCaT at 0, 6, and 24 h ranked and color‐coded by NES are shown in Figure 4F–H. At 0 and 6 h, the top significantly enriched terms correlated to interferon signaling, angiogenesis, and Ca2+ regulation processes. Specific terms include Interferon Alpha/Beta Signaling, Branching Involved in Blood Vessel Morphogenesis, Regulation of Cytosolic Calcium Ion Concentration, and Ca2+ Pathway (Figure 4F,G, and Tables S9 and S10). There were also terms relating to ECM modification, such as Collagen Biosynthesis and Modifying Enzymes (Figure 4F,G, and Tables S9 and S10). By 24 h, many of the top significantly enriched terms in TIGK related to IFN signaling or anti‐viral processes, including Interferon Alpha/Beta Signaling, Interferon Signaling, Response to Type I Interferon, and Negative Regulation of Viral Genome Replication and Viral Processes (Figure 4H and Table S11). Results from our GSEA confirm the initial GO BP and reactome term enrichment analysis. Furthermore, both of our enrichment analyses establish that relative to HaCaT at baseline and during healing, TIGK has an enrichment of genes related to ECM modification and IFN signaling (Figure 4F–H), which may be key for the accelerated wound healing phenotype observed in TIGK.
3.5. Type I Interferon Stimulation Enhances HaCaT Migratory Capacity Following Injury
Since IFN signaling was consistently enriched in TIGK as compared to HaCaT for all of our analyses, we wanted to determine if enhancement of IFN signaling in HaCaT would improve migration and proliferation. First, we assessed whether HaCaT would exhibit gene transcription indicative of type I IFN stimulation. HaCaT treated with type I IFN exhibited significantly enhanced ISGs OAS1, OAS2, OAS3, STAT1, and STAT2, all markers of type I IFN stimulation, and GSEA identified core enrichment genes for IFN signaling‐related terms (Figure 5A and Tables S9–S11) [47, 48]. In functional assays, type I IFN treatment before and after injury significantly enhanced HaCaT migration (Figure 5B,C) but did not affect proliferation (Figure 5D). For our experiments, 10 U/mL type I IFN resulted in the most significant change in the migratory potential of HaCaT, while doses of 100 U/mL and up showed noticeable cell death and inhibition of migration (Figure S2). Treating TIGK with IFNα/ß receptors reduced TIGK migration in a dose‐dependent manner, with 250 and 500 ng/mL IFNα/ß receptor treatment causing the most reduction in TIGK migration (Figures 5E,F and S3). Our findings suggest that enhanced baseline expression of genes involved in inflammatory pathways, such as IFN signaling, may endow TIGK with its faster and more effective response to injury [49, 50].
FIGURE 5.

Type I interferon (IFN‐1) stimulation of HaCaT following in vitro wounding significantly enhances HaCaT expression of IFN‐stimulated genes and cell migration, but not proliferation. (A) Relative gene expression levels of IFN‐1 stimulated genes at 24 h post‐wounding in HaCaT grown in media supplemented with or without 10 Units/mL IFN‐1 for 24 h. Gene expression levels were normalized to GAPDH and expressed as 2−ΔΔCT. N = 6, with each dot representing a biological replicate that consists of 3 technical replicates. (B) Representative photos of in vitro vertical HaCaT and TIGK wounds closing after one × one cross‐scratching. A black line outlines areas not covered by cells. (C) Rate of cell migration, expressed as the percentage of wound closed at each time point. N = 11–13. (D) Proliferation of HaCaT grown in media supplemented with or without 10 Units/mL IFN‐1 at 48 h and 96 h post‐seeding was assessed by MTS assay. N = 3, with each dot representing a biological replicate that consists of 3 technical replicates. (E) Representative photos of in vitro vertical TIGK wounds treated with type I interferon receptors (IFN‐1 R) closing after one × one cross‐scratching. A black line outlines areas not covered by cells. (F) Rate of cell migration, expressed as the percentage of wound closed at each time point. N = 3–4. Bars indicate mean ± SD for all graphs. *p < 0.05, **p < 0.01, ***p < 0.0001. Multiple two‐tailed unpaired t‐tests with a two‐stage step‐up procedure of Benjamini, Krieger, and Yekutieli post hoc testing (vs. HaCaT) were used in A. Two‐way ANOVA with a two‐stage step‐up procedure of Benjamini, Krieger, and Yekutieli post hoc testing (vs. HaCaT) was used in C, D, and F.
3.6. Transcriptomic Response to Acute Injury in TIGK Is Greater in Magnitude Than HaCaT
We next sought to identify the number of DEGs in response to injury in HaCaT and TIGK. Differential expression analysis was performed on the gene expression profiles of HaCaT and TIGK at 6 h and 24 h relative to their 0 h. The total number of DEGs (p.adj) < 0.01, log(foldchange) > 0.2 or log(foldchange) < −0.2 for HaCaT and TIGK at 6 and 24 h relative to 0 h is shown in Figure 6A. Our results suggest that TIGK has a much faster transcriptomic response to injury, as there are more DEGs at 6 h relative to 0 h in TIGK than in HaCaT. HaCaT had 154 DEGs, with 87 DEGs upregulated and 67 DEGs downregulated at 6 h relative to 0 h, while TIGK had 385 total DEGs, with 293 DEGs upregulated and 92 DEGs downregulated at 6 h relative to 0 h (Figure 6A). By 24 h, though, the number of DEGs in HaCaT at 24 h relative to 0 h was much higher than in TIGK. HaCaT had 4425 DEGs, with only 2154 DEGs upregulated and 2271 DEGs downregulated at 24 h relative to 0 h, while TIGK had 3284 total DEGs, with 1645 DEGs upregulated and 1639 DEGs downregulated at 24 h relative to 0 h (Figure 6A). Altogether, our results suggest that following injury, TIGK shows a faster and more time‐limited response, while HaCaT exhibits a relatively delayed transcriptional response.
FIGURE 6.

TIGK exhibits a more robust response to acute injury as well as a faster activation of gene sets involved in wound healing processes relative to HaCaT. (A) Volcano plots showing the differentially expressed genes in HaCaT and TIGK at 6 or 24 h versus 0 h. (B) Venn diagrams comparing the up‐regulated genes in HaCaT and TIGK at 6 or 24 h versus 0 h. Top 10 significantly enriched (C) gene ontology biological processes (GO BP) and (D) reactome terms for genes differentially upregulated in TIGK at 6 versus 0 h. Top 10 significantly enriched (E) GO BP and (F) reactome pathway terms for genes differentially upregulated in HaCaT at 6 versus 0 h. Top 10 significantly enriched gene set enrichment analysis identified GO BP and reactome terms for TIGK at (G) 6 h or (H) 24 versus 0 h and for HaCaT at (I) 6 h or (J) 24 versus 0 h.
We compared the number of shared and unshared DEGs for each to assess how similar the 6 and 24 h injury responses are for HaCaT and TIGK. For the 6 h injury response, there were only 36 shared DEGs (10.5% of all DEGs), while for the 24 h injury response, there were 816 shared DEGs (27.4% of all DEGs) (Figure 6B). So, while there are some similarities in the transcriptomic changes following injury in HaCaT and TIGK, many genes are still expressed in a cell type‐specific manner.
To examine the potential biological significance of the DEGs, GO BP and Reactome term enrichment analysis were performed on the DEGs expressed by TIGK at 6 h relative to 0 h and by HaCaT at 6 h relative to 0 h. The top 25 significant GO BP and Reactome terms and their annotated genes are shown in Tables S15–S18. The top 10 significant GO BP and Reactome terms ranked and color‐coded by the percentage of genes annotated to each term's gene set are shown in Figure 6C–F. In TIGK, many of the top 25 significantly enriched GO BP terms for the DEGs at 6 h relative to 0 h correlate to cell migration and angiogenesis, such as Positive Regulation of Cell Motility and Migration and Positive Regulation of Angiogenesis and Vasculature Development (Figure 6C, Table S15). Reactome terms related to keratinocyte migration were enriched, including RHO GTPase cycle, ECM interactions and organization, and Type I Hemidesmosome Assembly (Figure 6D, Table S16) [51, 52, 53, 54]. Enrichment of GO BP and Reactome terms in the gene sets differentially expressed in HaCaT at 6 h relative to 0 h found that many of the GO BP terms were related to hemostasis, such as Regulation of Plasminogen Activation and Blood Coagulation (Figure 6E, Table S17). There were far fewer GO BP terms as well as annotated genes related to angiogenesis, cell migration, and proliferation as compared to TIGK for the same time frame (Figure 6E, Table S17). Reactome pathway enrichment for DEGs in HaCaT at 6 versus 0 h found terms related to cell differentiation and proliferation, such as MAPK Targets/Nuclear Events Mediated by MAP Kinases, MAP Kinase Activation, and PIP3 Activates AKT Signaling (Figure 6f, Table S18) [55, 56]. Among the top 25 significant GO BP and Reactome terms enriched for the DEGs in TIGK at 24 h relative to 0 h were those relating to anti‐viral responses and IFN signaling (Tables S19 and S20). There were also terms relating to cell cycle and division (Tables S19 and S20). Among the top 25 significant GO BP and Reactome terms enriched for the DEGs in HaCaT at 24 h relative to 0 h were terms relating to cell cycle and division, including Cell Cycle and Microtubule Cytoskeleton Organization Involved in Mitosis (Tables S21 and S22). There were no terms relating to IFN signaling, but some related to RHO GTPase cycle and signaling (Table S22).
A GSEA of gene sets comparing TIGK and HaCaT at 6 or 24 h relative to their 0 h validated our GO BP and reactome enrichment analyses. The top 20 significant GSEA terms and their annotated genes are shown in Tables S23–S26. The top 10 significant GSEA terms comparing TIGK and HaCaT at 6 or 24 h relative to their 0 h ranked and color‐coded by each term's NES are shown in Figure 6G–J. For TIGK at 6 h relative to 0 h, there were terms relating to keratinocyte differentiation, proliferation, and angiogenesis, including Regulation of Keratinocyte Proliferation and Positive Regulation of Vasculature Development (Figure 6G and Table S23). For TIGK at 24 h relative to 0 h, there were terms relating to IFN signaling, such as Interferon Alpha/Beta Signaling (Figure 6H and Table S24). For HaCaT at 6 h relative to 0 h, there were mainly terms related to translation, such as Eukaryotic Translation Elongation (Figure 6I and Table S25). For HaCaT at 24 h relative to 0 h, there were mainly terms related to immune cell activation and inflammation, including Neutrophil and Leukocyte Chemotaxis and Interleukin 10 Signaling (Figure 6J and Table S26).
Altogether, our results substantiate the notion that oral keratinocytes have a more rapid and robust response to injury [2, 5, 7, 11, 14, 57]. By 6 h post‐injury, TIGK exhibited many more DEGs and a more favorable expression of gene sets related to the features of enhanced wound healing observed in oral mucosa wounds [2, 3, 4, 5, 6, 7, 8, 9]. Many genes were related to positive regulation of cell migration, angiogenesis, and inflammation.
3.7. The TIGK Transcriptome Supports a Faster Response to Injury
Previous studies have suggested that the baseline differential expression of transcription factors allows oral keratinocytes to respond faster to injury signals [2, 5, 7, 11, 14, 57]. To determine if basal upregulation of specific transcription factors in TIGK may contribute to improved healing, we identified transcription factors upregulated in TIGK relative to HaCaT for all time points: 0, 6, and 24 h. A total of 181 transcription factors were identified to be upregulated in TIGK relative to HaCaT for all time points (Figure 7A). Notably, transcription factors PITX2, SOX4, SOX11, SIM2, and HIF1α are found in this list (Table S27). These transcription factors have been shown to modulate epidermal cell responses to injury and are believed to be involved in migration and re‐epithelialization (Table S27) [7, 11, 58, 59, 60]. STAT1 and STAT5A, ISGs important to IFN signaling, are also upregulated for all time points (Table S27) [61, 62, 63].
FIGURE 7.

The transcription factor expression profile in uninjured and injured TIGK enables TIGK to have a more rapid and robust response to wounding relative to HaCaT. (A) Venn diagram comparing the transcription factors up‐regulated in TIGK versus HaCaT at 0, 6, and 24 h. Heatmap of all differentially expressed transcription factors in (B) HaCaT and (C) TIGK at 6 vs. 0 h. Each column of the heatmap represents an independent sample. (D) Venn diagrams comparing the transcription factors differentially expressed in HaCaT and TIGK at 6 or 24 h versus 0 h.
Several transcription factors were upregulated following injury in TIGK. Analysis of differentially expressed transcription factors in TIGK or HaCaT at 6 and 24 h relative to 0 h found that TIGK exhibits more wound‐induced differential expression of transcription factors than HaCaT. At 6 h, HaCaT had only 27 differentially expressed transcription factors, 14 of which were upregulated and 13 downregulated (Figure 7B, Table S28). In TIGK, there were 39 differentially expressed transcription factors, with 37 upregulated and only 2 downregulated (Figure 7C, Table S28). Of the transcription factors differentially expressed at 6 h relative to 0 h in HaCaT and TIGK, the majority are unshared. Among the 28 transcription factors found only in TIGK at 6 h relative to 0 h that are upregulated are SNAI2 and SOX9, which have been implicated in wound healing processes, including differentiation and migration (Table S28) [64, 65]. Within the 11 shared transcription factors between HaCaT and TIGK at 6 h relative to 0 h that are upregulated are FOSB, JUN, JUNB, and ATF3 (Figure 7D and Table S28). These genes are in the Activator Protein‐1 (AP‐1) transcription factor family, which has been implicated in inflammation, inflammatory memory, differentiation, cellular migration, and wound healing [49, 66]. This suggests that HaCaT and TIGK exhibit some initial similarity in transcriptional regulation following injury. By 24 h, HaCaT differentially expresses more transcription factors than TIGK (Figure 7D and Table S28). Overall, while initial differences in transcriptional activity were found, a much higher degree of transcription factor activation in TIGK was seen during earlier stages of wound healing. The results suggest that, in addition to baseline differences, an early, more rapid transcriptional response of TIGK to injury is a vital contribution to improved mucosa repair. Our findings also suggest that there is both a differential response to wounding between HaCaT and TIGK, as well as a shared or non‐site‐specific response to wounding regarding transcription factor activation.
3.8. TIGK Retains Its Enhanced Migratory Capacity Across Varying ECM Proteins
Successful epithelial wound healing requires cell–cell and cell‐matrix interactions as well as ECM remodeling [67]. MMPs and integrins are important mediators of these processes and have been suggested to exhibit differential patterns of expression in skin and oral mucosa wounds [5, 52, 54, 67, 68, 69, 70, 71, 72, 73, 74, 75, 76]. For these reasons, we examined expression patterns of MMPs and integrins between HaCaT and TIGK at the unwounded baseline (Figure 8A,B). HaCaT exhibited higher expression of MMPs described to promote keratinocyte migration (MMP1, MMP2, MMP3, and MMP 10) (Figure 8A,B) [74, 75]. HaCaT also expressed more integrin components than TIGK, many of which recognize collagens I and IV (ITGA2, ITGB1) and laminin (ITGA2, ITGB1, ITGA6) (Figure 8A,B) [54, 76].
FIGURE 8.

TIGK exhibits enhanced migratory capacity but not proliferative capacity over HaCaT when grown on different ECM proteins. Heatmap of differentially expressed (A) MMPs and (B) integrins between HaCaT and TIGK at unwounded baseline (0 h). Each column of the heatmap represents an independent sample. Representative photographs of in vitro vertical HaCaT and TIGK wounds closing on (C) collagen I, (D) collagen IV, and (E) laminin‐coated plates after one × one cross‐scratching. A black line outlines areas not covered by cells. Rate of HaCaT and TIGK cell migration on (F) collagen I, (G) collagen IV, and (H) laminin‐coated plates, expressed as a percentage of wound closed at each time point. N = 6. Proliferation of HaCaT and TIGK at 48 and 96 h post‐seeding onto (I) collagen I, (J) collagen IV, and (K) laminin‐coated plates was assessed by MTS assay. N = 4, with each dot representing a biological replicate that consists of 2 technical replicates. Bars indicate mean ± SD for all graphs. *p < 0.05, **p < 0.0001. Two‐way ANOVA with a two‐stage linear step‐up procedure of Benjamini, Krieger, and Yekutielipost hoc testing (vs. HaCaT).
To recapitulate the ECM interactions that these differentially expressed MMPs and integrins might exhibit in tissue, and to assess whether they may alter keratinocyte functional capacities, HaCaT and TIGK, which were cultured on plates coated with collagen I, collagen IV, or laminin, underwent migration and proliferation functional assays. TIGK had a significantly faster rate of wound closure than HaCaT on all 3 substrates (Figures 8C–H and S4A). No differences existed between HaCaT and TIGK proliferation rates on any ECM protein (Figures 8I–K and S4B). These results suggest that ECM proteins differentially influence the cellular phenotype of HaCaT and TIGK.
3.9. TIGK Secretes Factors That Promote Re‐Epithelialization
To investigate whether in vitro secretions from HaCaT and TIGK post‐injury are likely to affect keratinocyte function, we identified secretome genes upregulated in HaCaT and TIGK at 24 h relative to 0 h (Table S29). We found there were many secretome genes unshared (Figure 9A, Table S29), signifying potential differences in the effects of the post‐injury secretome of HaCaT and TIGK.
FIGURE 9.
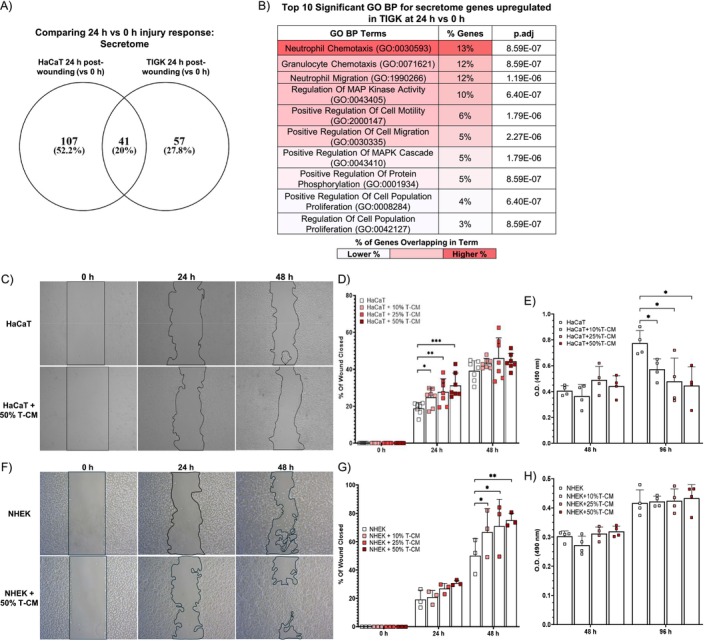
TIGK secretome enhances HaCaT and NHEK migration, but not proliferation. (A) Venn diagram comparing the secretome genes differentially upregulated in HaCaT and TIGK at 24 versus 0 h. (B) Top 10 significantly enriched gene ontology biological process (GO BP) terms enriched for the secretome genes differentially upregulated in TIGK at 24 versus 0 h. (C) Representative photographs of in vitro vertical wounds in HaCaT treated with TIGK conditioned media (T‐CM) after one × one cross‐scratching. A black line outlines areas not covered by cells. (D) Rate of cell migration for HaCaT treated with T‐CM, expressed as a percentage of wound closed. N = 6. (E) Proliferation of HaCaT treated with T‐CM at 48 and 96 h post‐seeding was assessed by MTS assay. N = 3, with each dot representing a biological replicate that consists of 3 technical replicates. (F) Representative photographs of in vitro vertical wounds in NHEK treated with TIGK conditioned media (T‐CM) after one × one cross‐scratching. A black line outlines areas not covered by cells. (G) Rate of cell migration for NHEK treated with T‐CM, expressed as a percentage of wound closed. N = 6. (H) Proliferation of NHEK treated with T‐CM at 48 and 96 h post‐seeding was assessed by MTS assay. N = 3, with each dot representing a biological replicate that consists of 3 technical replicates. Bars indicate mean ± SD for all graphs. *p < 0.05, **p < 0.01, ***p < 0.001. Two‐way ANOVA with a two‐stage linear step‐up procedure of Benjamini, Krieger, and Yekutielipost hoc testing (vs. HaCaT or vs. NHEK).
GO BP and reactome term enrichment were performed to define the biological significance of these genes. The top 25 significant GO BP terms and their annotated genes for TIGK and HaCaT at 24 h relative to 0 h are shown in Tables S30 and S31, respectively. The top 10 significant GO BP terms ranked and color‐coded by the percentage of genes annotated to each term's gene set for TIGK are shown in Figure 9B and for HaCaT in Figure S5A. The enrichment analysis suggests that the secretome of both TIGK and HaCaT at 24 h post‐injury may promote migration (Figures 9B and S5A, and Tables S30 and S31). To validate these findings, we collected CM from TIGK and HaCaT 24 h after wounding and tested its effect on migration in the in vitro wound healing model. HaCaT treated with TIGK CM had improved migration in a dose‐dependent manner, while TIGK treated with HaCaT CM did not exhibit improved migration (Figures 9C,D and S5B,C). We also assessed whether TIGK CM or HaCaT CM could affect cell proliferation. In contrast to the effect of CM on migration, both HaCaT treated with TIGK CM and TIGK treated with HaCaT CM had a dose‐dependent reduction in cell proliferation at 96 h post‐seeding (Figures 9E and S5D). We also assessed whether TIGK CM could enhance the migration or proliferation of primary human skin keratinocytes, NHEK. Similar to our findings in HaCaT, TIGK CM improved NHEK migration in a dose‐dependent manner, but did not improve proliferation (Figure 9F–H). Altogether, our results suggest that secretions from TIGK post‐injury may induce phenotype changes that enhance features of wound healing, such as cell migration, while secretions from HaCaT seemingly do not have a discernible effect.
4. Discussion
Many studies have shown that oral wound healing exhibits faster re‐epithelialization and closure, as well as less scarring and inflammation than skin wound healing [3, 4, 5, 7, 8, 9]. Analyses comparing the transcriptome of skin and oral mucosa tissue in vivo suggest that the intrinsic characteristics of oral and skin epithelium contribute to the superior healing of the oral mucosa [4, 5, 7, 57]. One cell type likely to contribute to these differences in tissue healing is the keratinocytes [5, 7]. Keratinocytes are vital to the re‐epithelialization phase, as re‐epithelialization of wounds is heavily dependent upon keratinocyte migration and proliferation [77, 78]. Keratinocytes also secrete factors that promote inflammation, angiogenesis, and the resolution of tissue repair [18, 77, 78, 79]. Assessment of specific gene sets between skin and oral keratinocytes in vitro further implicates how intrinsic differences between keratinocytes may contribute to the superior wound healing of oral mucosa over skin [10, 11]. Despite these numerous studies, the precise molecular mechanism driving the differential responses to injury between skin and oral keratinocytes has yet to be fully elucidated.
The studies here help to fill this knowledge gap. No prior studies have performed mRNA‐sequencing on skin and oral keratinocytes at baseline (0 h) and throughout healing (6 and 24 h) in vitro. Our utilization of an in vitro wound healing model and mRNA‐sequencing offers a global view of gene expression in oral and skin keratinocytes as well as a comprehensive assessment of the transcriptomic differences that underlie their differential responses to injury.
Analysis of the DEGs between HaCaT and TIGK at baseline demonstrates that TIGK has a distinct transcriptomic profile that may allow it to heal faster than HaCaT. Our analysis of the likely biological significance of the genes upregulated in TIGK suggests that these include genes involved in inflammatory processes, such as IFN signaling. While type I IFNs have not been widely investigated in the context of wound healing, type I IFNs play a role in the pathogenesis of psoriasis, a skin disorder with reduced scarring and enhanced wound‐healing features [7, 63, 80, 81]. Our results show that in vitro activation of type I IFN in HaCaT enhances migration, while neutralization of type I IFN in TIGK inhibits migration. These data support the notion that elevated IFN signaling pathways in TIGK may promote faster wound healing. Further studies are needed to determine how IFN signaling and ISGs may activate wound healing pathways and improve healing. Our analysis indicates that, at a basal state, oral keratinocytes may already be equipped with gene sets related to epithelial wound healing as compared to skin keratinocytes, which may enhance the regenerative phenotype and promote more efficient wound healing.
Assessment of the number of DEGs during the 6 h response to injury showed that compared to HaCaT, TIGK has a more robust transcriptomic response to injury. However, during the later phases of wound healing (24 h), HaCaT exhibits more DEGs. Prediction of the biological significance of the genes differentially expressed in TIGK and HaCaT during the earlier phases of wound healing (6 h) demonstrates that TIGK and HaCaT initially respond to injury differently. Genes differentially expressed in TIGK at 6 h were more likely to be involved in processes related to wound healing, such as angiogenesis, migration, and proliferation. Although there were some genes that were differentially expressed in HaCaT at 6 h relating to those same processes, the majority related to hemostasis, fibrinolysis, and translation. This suggests that oral epithelial cells more quickly induce the expression of genes that promote faster wound re‐epithelialization and angiogenesis, features found in oral mucosa wound healing relative to skin wound healing [51, 82]. Interestingly, HaCaT appears to have inflammatory processes upregulated during later stages of wound healing, as these terms appeared in HaCaT at 24 h. Perhaps this relates to the delayed inflammatory response that has been observed in skin wounds as compared to wounds of the oral mucosa [2, 4, 6, 7, 8, 57].
At the core of the transcriptomic responses in wound healing are transcriptional regulators, such as transcription factors, which are vital for the activation of gene networks responsible for wound resolution. There were 181 transcription factors basally upregulated in TIGK as compared to HaCaT. PITX2, SOX4, SOX11, SIM2, and HIF1α are notable transcription factors found in this list. Each is believed to be important for oral epithelial cell migration and to be able to accelerate skin keratinocyte migration in vitro [7, 11, 58, 59, 60]. Additionally, STAT1 and STAT5A are also upregulated in TIGK at all time points, further suggesting that the underlying elevated levels of IFN‐1 signaling or inflammatory pathways may contribute to the earlier wound response in TIGK [47, 48, 61, 62, 63]. At 6 h post‐injury, TIGK had more transcription factors differentially expressed than HaCaT. This finding may help to explain why TIGK exhibits an earlier and more robust transcriptional response to injury. Interestingly, we found that HaCaT and TIGK did share some similarity in transcription factor expression at 6 h post‐injury. These transcription factors were part of the AP‐1 family, which is activated in wound healing‐related processes [66]. However, the magnitude by which these shared differentially expressed transcription factors affect downstream genes and therefore cell behavior could be vastly different and requires further studies. Future studies identifying the pathways activated by the transcription factors basally upregulated in TIGK compared to HaCaT will help assess whether they contribute to the enhanced wound repair response of oral mucosa and their potential for accelerating wound repair and tissue regeneration. Altogether, our comparative analyses of the transcriptomes of TIGK and HaCaT at baseline and throughout healing suggest that oral keratinocytes have an underlying readiness to activate wound healing‐associated gene sets even before injury, presenting a unique advantage over skin keratinocytes.
While ECM composition varies depending on anatomical locations, its role in wound healing and as a vital cell substrate remains relatively conserved [72]. MMPs and integrins are proteins vital for epithelial cell migration and re‐epithelialization during wound healing, as they help facilitate cell–cell, cell‐matrix, and matrix remodeling [52, 54, 67, 72, 73, 74, 75, 76]. Many studies have also suggested that differential expression of these proteins may explain site‐specific differences in skin and oral wound healing [5, 52, 67, 68, 69, 70, 71, 72, 73, 74, 75]. Our differential expression analysis shows that HaCaT and TIGK have distinct MMP and integrin expression profiles. Relative to TIGK, HaCaT had more differentially upregulated integrins and MMPs relating to the recognition of and migration over ECM proteins, such as fibrillar collagens and laminins [54, 74, 75, 76]. When HaCaT and TIGK were cultured on collagens I and IV and laminin, TIGK retained its enhanced migratory capacity following in vitro wounding. Although TIGK retained its enhanced migratory capacity over HaCaT when grown on different substrates, HaCaT proliferation improved when grown over ECM proteins. Since optimal cell migration depends heavily on balanced MMP and integrin expression, it may be possible that HaCaT expression of MMPs and integrins results in inefficient remodeling and cell‐substrate interactions that slow migration as compared to TIGK [54, 76]. In our migration assays, the scratch may damage the underlying matrix. Therefore, the retention of an enhanced migratory capacity in TIGK and improved proliferation of HaCaT may be due to cell‐type‐specific integrin‐mediated signaling pathways following binding to ECM proteins [83, 84, 85, 86] prior to scratch placement and at the edges of the wound. Although the exact pathway is unknown, many integrin‐mediated signaling pathways relate to cell cycle progression, proliferation, and migration [54, 83, 84, 85, 86]. Further studies are needed to assess which integrin(s) are important for influencing HaCaT and TIGK migration and proliferation. Altogether, our results suggest that HaCaT and TIGK may differ in their abilities to bind, remodel, and respond to ECM, which may influence cell behavior and, ultimately, re‐epithelialization and wound healing.
Lastly, we investigated the biological significance of the post‐injury secretome for TIGK and HaCaT. Based on our assays, the TIGK secretome promotes keratinocyte migration, while those from HaCaT do not. TIGK and HaCaT proliferation were decreased following conditioned media treatment. This may be due to secreted factors directly inhibiting proliferation or a reduction of necessary growth factors found in baseline media. Our results also demonstrate that TIGK CM accelerates NHEK migration in a dose‐dependent manner while not affecting proliferation. These findings were similar to those observed in HaCaT treated with TIGK CM, thus giving further credibility to the pro‐healing effect of TIGK CM. Future studies assessing the transcriptomic response of keratinocytes to CM will help elucidate how exactly the secretome influences cellular responses and might aid in enhanced re‐epithelialization of wounds. Additionally, studies identifying the secretome components that help drive the enhanced healing response in HaCaT and NHEK would be informative and clinically beneficial.
To avoid complications associated with using primary skin and oral keratinocytes in vitro, such as their short lifespan and sample variability, we utilized immortalized keratinocyte cell lines HaCaT and TIGK [21, 22, 23]. HaCaT and TIGK are commonly used to study keratinocyte behavior in skin and oral wound healing in vitro [11, 21, 22, 23, 24, 25, 26, 27]. Moreover, HaCaT and TIGK have been shown to exhibit similar morphogenesis, expression of cytokeratins, as well as other major surface markers, and functional characteristics, such as response to inflammatory cytokines and proliferative capacities, as their parental primary cell [58, 59, 60, 62]. Furthermore, we compared the top‐expressed genes between NHEK and HaCaT and NHOK and TIGK and found that many were shared. These results show that HaCaT and TIGK maintain a degree of fidelity to their primary cell counterparts and may be a usable model for studying skin and oral keratinocytes.
Still, there are limitations and considerations regarding using HaCaT and TIGK to infer the responses of primary skin and oral keratinocytes to injury. HaCaT and TIGK differ in their immortalization status, as HaCaT has gain‐of‐function mutations in p53, while TIGK has an hTERT/bmi‐induced immortalization [22, 87]. Another consideration is that there is aberrantly induced NF‐kB signaling in HaCaT, which could make them less sensitive to inflammatory phenomena, such as IFN signaling [88, 89]. Non‐canonical NF‐kB signaling downregulates type I IFN through p52 and RelB expression [89, 90, 91]. In our mRNA‐sequencing analysis, NFKB1, P52, or RELB were not differentially upregulated in HaCaT relative to TIGK at baseline. This suggests that the aberrant NF‐kB signaling in HaCaT may not be differentially inducing the non‐canonical NF‐kB signaling pathway or downregulating type I IFN expression relative to TIGK. The differences in IFN signaling between TIGK and HaCaT may therefore reflect a higher baseline inflammatory profile in TIGK relative to HaCaT. Still, it is important to note that aberrant NF‐kB signaling seen in HaCaT is not seen in NHEK, as this may have ramifications for the applicability of our data to primary cells.
Lastly, there is an altered differentiation capacity of HaCaT as compared to NHEK [92, 93, 94]. Unlike HaCaT, TIGK appears to have a similar differentiation capacity as primary gingival keratinocytes [22]. This may explain our lack of differentiation‐related events in HaCaT compared to TIGK at baseline and throughout wound healing in vitro. This might also suggest that some of the differentiation capacity differences between HaCaT and TIGK may not be present in primary oral and skin keratinocytes. Nevertheless, the responses of HaCaT and TIGK likely mirror those of primary skin and oral keratinocytes, given their transcriptomic similarities. The current study is a good starting point for the comparison of the injury responses of skin and oral keratinocytes.
Overall, our work provides an analysis of the molecular mechanisms that might underlie the different wound‐healing processes between skin and oral keratinocytes. Our work also highlights how differentially expressed transcription factors in oral keratinocytes may be a factor in their more rapid and efficient wound‐healing response. A more detailed examination of these transcription factors could identify candidates that could be manipulated in skin keratinocytes to optimize their wound‐healing response so that they may heal more effectively. It is important to note that our studies compare isolated cells grown in vitro, which may not be reflective of how they function in their native tissue or when other cell types are present. Therefore, a future study utilizing single‐cell RNA‐sequencing of human skin and oral tissue to dissect transcriptomic differences between primary human keratinocytes could be more physiologically relevant and address these limitations in our study. Still, our work offers a valuable dataset that others can use to gain insights into improving wound healing and helps to establish that oral keratinocytes, even when isolated, exhibit a transcriptome that is reflective of features pertaining to enhanced wound healing.
Author Contributions
Conceptualization: C.H., T.L., L.C., M.W., and L.A.D.; data curation and investigation: C.H., Y.Z., H.Y., S.K., and L.C.; contributed reagents/materials/analysis tools: T.L., S.K., L.C., M.W., and L.A.D.; writing, review, and editing: C.H., Y.Z., H.Y., T.L., S.K., L.C., M.W., and L.A.D. All authors have read and agreed to the published version of the manuscript.
Conflicts of Interest
The authors declare no conflicts of interest.
Supporting information
Figure S1.
Table S1.
Acknowledgments
This work was supported by NIH grants: R01 GM50875 (L.A.D.), R35 GM139603‐01 (L.A.D.), F31 DE028747 (T.L.), F31 AR083830 (H.Y.), and F31 AR082287 (C.H.).
Han C., Zhang Y., Yuan H., et al., “Transcriptomic Differences Between Immortalized Oral and Skin Keratinocytes,” The FASEB Journal 39, no. 12 (2025): e70744, 10.1096/fj.202500374R.
Funding: This work was supported by NIH grants: R01 GM50875 (L.A.D.), R35 GM139603‐01 (L.A.D.), F31 DE028747 (T.L.), F31 AR083830 (H.Y.), and F31 AR082287 (C.H.).
Data Availability Statement
All mRNA‐sequencing related data generated by us are available for public access at: https://www.ncbi.nlm.nih.gov/geo/query/acc.cgi?acc=GSE270877. The mRNA‐sequencing data utilized from GSE184119 and GSE262505 are available at: https://www.ncbi.nlm.nih.gov/geo/query/acc.cgi?acc=GSE184119 and https://www.ncbi.nlm.nih.gov/geo/query/acc.cgi?acc=GSE262505. Other data that support the findings of this study are available in the [Link], [Link] of this article. The R code used in this manuscript is available on GitHub: https://github.com/ChenHanMDPhD/Transcriptomic‐Differences‐between‐Oral‐and‐Skin‐Keratinocytes/blob/main/Code%20for%20Manuscript.R.
References
- 1. Gushiken L. F. S., Beserra F. P., Bastos J. K., Jackson C. J., and Pellizzon C. H., “Cutaneous Wound Healing: An Update From Physiopathology to Current Therapies,” Lifestyles 11 (2021): 665. [DOI] [PMC free article] [PubMed] [Google Scholar]
- 2. Szpaderska A. M., Zuckerman J. D., and DiPietro L. A., “Differential Injury Responses in Oral Mucosal and Cutaneous Wounds,” Journal of Dental Research 82 (2003): 621–626. [DOI] [PubMed] [Google Scholar]
- 3. Szpaderska A. M., Walsh C. G., Steinberg M. J., and DiPietro L. A., “Distinct Patterns of Angiogenesis in Oral and Skin Wounds,” Journal of Dental Research 84 (2005): 309–314. [DOI] [PubMed] [Google Scholar]
- 4. Chen L., Arbieva Z. H., Guo S., Marucha P. T., Mustoe T. A., and DiPietro L. A., “Positional Differences in the Wound Transcriptome of Skin and Oral Mucosa,” BMC Genomics 11 (2010): 471. [DOI] [PMC free article] [PubMed] [Google Scholar]
- 5. Turabelidze A., Guo S., Chung A. Y., et al., “Intrinsic Differences Between Oral and Skin Keratinocytes,” PLoS One 9 (2014): e101480. [DOI] [PMC free article] [PubMed] [Google Scholar]
- 6. Warburton G., Nares S., Angelov N., Brahim J. S., Dionne R. A., and Wahl S. M., “Transcriptional Events in a Clinical Model of Oral Mucosal Tissue Injury and Repair,” Wound Repair and Regeneration 13 (2005): 19–26. [DOI] [PubMed] [Google Scholar]
- 7. Iglesias‐Bartolome R., Uchiyama A., Molinolo A. A., et al., “Transcriptional Signature Primes Human Oral Mucosa for Rapid Wound Healing,” Science Translational Medicine 10 (2018): eaap8798. [DOI] [PMC free article] [PubMed] [Google Scholar]
- 8. Mak K., Manji A., Gallant‐Behm C., et al., “Scarless Healing of Oral Mucosa Is Characterized by Faster Resolution of Inflammation and Control of Myofibroblast Action Compared to Skin Wounds in the Red Duroc Pig Model,” Journal of Dermatological Science 56 (2009): 168–180. [DOI] [PubMed] [Google Scholar]
- 9. Wong J. W., Gallant‐Behm C., Wiebe C., et al., “Wound Healing in Oral Mucosa Results in Reduced Scar Formation as Compared With Skin: Evidence From the Red Duroc Pig Model and Humans,” Wound Repair and Regeneration 17 (2009): 717–729. [DOI] [PubMed] [Google Scholar]
- 10. Leonardo T. R., Shi J., Chen D., Trivedi H. M., and Chen L., “Differential Expression and Function of Bicellular Tight Junctions in Skin and Oral Wound Healing,” International Journal of Molecular Sciences 21 (2020): 2966. [DOI] [PMC free article] [PubMed] [Google Scholar]
- 11. Smith C. J., Parkinson E. K., Yang J., et al., “Investigating Wound Healing Characteristics of Gingival and Skin Keratinocytes in Organotypic Cultures,” Journal of Dentistry 125 (2022): 104251. [DOI] [PubMed] [Google Scholar]
- 12. Reilly J. S., Behringer W. H., and Trocki I., “Intraoral Keloid: Complication of Forehead Flap,” Otolaryngology – Head and Neck Surgery 1979 88 (1980): 139–141. [DOI] [PubMed] [Google Scholar]
- 13. Bussi M., Valente G., Curato M. P., Carlevato M. T., and Cortesina G., “Is Transposed Skin Transformed in Major Head and Neck Mucosal Reconstruction?,” Acta Oto‐Laryngologica 115 (1995): 348–351. [DOI] [PubMed] [Google Scholar]
- 14. Overmiller A. M., Uchiyama A., Hope E. D., et al., “Reprogramming of Epidermal Keratinocytes by PITX1 Transforms the Cutaneous Cellular Landscape and Promotes Wound Healing,” JCI Insight 9 (2024): e182844. [DOI] [PMC free article] [PubMed] [Google Scholar]
- 15. Stephens P., Davies K. J., Occleston N., et al., “Skin and Oral Fibroblasts Exhibit Phenotypic Differences in Extracellular Matrix Reorganization and Matrix Metalloproteinase Activity,” British Journal of Dermatology 144 (2001): 229–237. [DOI] [PubMed] [Google Scholar]
- 16. Gillis P., Savla U., Volpert O. V., et al., “Keratinocyte Growth Factor Induces Angiogenesis and Protects Endothelial Barrier Function,” Journal of Cell Science 112, no. Pt 12 (1999): 2049–2057. [DOI] [PubMed] [Google Scholar]
- 17. Machesney M., Tidman N., Waseem A., Kirby L., and Leigh I., “Activated Keratinocytes in the Epidermis of Hypertrophic Scars,” American Journal of Pathology 152 (1998): 1133–1141. [PMC free article] [PubMed] [Google Scholar]
- 18. Jiang Y., Tsoi L. C., Billi A. C., et al., “Cytokinocytes: The Diverse Contribution of Keratinocytes to Immune Responses in Skin,” JCI Insight 5 (2020): e142067. [DOI] [PMC free article] [PubMed] [Google Scholar]
- 19. Werner S., Krieg T., and Smola H., “Keratinocyte‐Fibroblast Interactions in Wound Healing,” Journal of Investigative Dermatology 127 (2007): 998–1008. [DOI] [PubMed] [Google Scholar]
- 20. Xuanyuan X., Zhang L., Zheng Y., et al., “SPRR1B+ Keratinocytes Prime Oral Mucosa for Rapid Wound Healing via STAT3 Activation,” Communications Biology 7 (2024): 1155. [DOI] [PMC free article] [PubMed] [Google Scholar]
- 21. Colombo I., Sangiovanni E., Maggio R., et al., “HaCaT Cells as a Reliable In Vitro Differentiation Model to Dissect the Inflammatory/Repair Response of Human Keratinocytes,” Mediators of Inflammation 2017 (2017): 7435621. [DOI] [PMC free article] [PubMed] [Google Scholar]
- 22. Moffatt‐Jauregui C. E., Robinson B., de Moya A. V., et al., “Establishment and Characterization of a Telomerase Immortalized Human Gingival Epithelial Cell Line,” Journal of Periodontal Research 48 (2013): 713–721. [DOI] [PMC free article] [PubMed] [Google Scholar]
- 23. Schürer N., Köhne A., Schliep V., Barlag K., and Goerz G., “Lipid Composition and Synthesis of HaCaT Cells, an Immortalized Human Keratinocyte Line, in Comparison With Normal Human Adult Keratinocytes,” Experimental Dermatology 2 (1993): 179–185. [DOI] [PubMed] [Google Scholar]
- 24. Carretero M., Escámez M. J., García M., et al., “In Vitro and In Vivo Wound Healing‐Promoting Activities of Human Cathelicidin LL‐37,” Journal of Investigative Dermatology 128 (2008): 223–236. [DOI] [PubMed] [Google Scholar]
- 25. Liu Y., Xiong W., Wang C. W., Shi J. P., Shi Z. Q., and Zhou J. D., “Resveratrol Promotes Skin Wound Healing by Regulating the miR‐212/CASP8 Axis,” Laboratory Investigation 101 (2021): 1363–1370. [DOI] [PubMed] [Google Scholar]
- 26. Ranzato E., Patrone M., Mazzucco L., and Burlando B., “Platelet Lysate Stimulates Wound Repair of HaCaT Keratinocytes,” British Journal of Dermatology 159 (2008): 537–545. [DOI] [PubMed] [Google Scholar]
- 27. Long M., Rojo de la Vega M., Wen Q., et al., “An Essential Role of NRF2 in Diabetic Wound Healing,” Diabetes 65 (2016): 780–793. [DOI] [PMC free article] [PubMed] [Google Scholar]
- 28. Schneider C. A., Rasband W. S., and Eliceiri K. W., “NIH Image to ImageJ: 25 Years of Image Analysis,” Nature Methods 9 (2012): 671–675. [DOI] [PMC free article] [PubMed] [Google Scholar]
- 29. Pertea M., Pertea G. M., Antonescu C. M., Chang T. C., Mendell J. T., and Salzberg S. L., “StringTie Enables Improved Reconstruction of a Transcriptome From RNA‐Seq Reads,” Nature Biotechnology 33 (2015): 290–295. [DOI] [PMC free article] [PubMed] [Google Scholar]
- 30. Liao Y., Smyth G. K., and Shi W., “featureCounts: An Efficient General Purpose Program for Assigning Sequence Reads to Genomic Features,” Bioinformatics 30 (2014): 923–930. [DOI] [PubMed] [Google Scholar]
- 31. Love M. I., Huber W., and Anders S., “Moderated Estimation of Fold Change and Dispersion for RNA‐Seq Data With DESeq2,” Genome Biology 15 (2014): 550. [DOI] [PMC free article] [PubMed] [Google Scholar]
- 32. Anders S. and Huber W., “Differential Expression Analysis for Sequence Count Data,” Genome Biology 11 (2010): R106. [DOI] [PMC free article] [PubMed] [Google Scholar]
- 33. Lambert S. A., Jolma A., Campitelli L. F., et al., “The Human Transcription Factors,” Cell 172 (2018): 650–665. [DOI] [PubMed] [Google Scholar]
- 34. Uhlén M., Fagerberg L., Hallström B. M., et al., “Tissue‐Based Map of the Human Proteome,” Science 347 (2015): 1260419. [DOI] [PubMed] [Google Scholar]
- 35. Wickham H., ggplot2: Elegant Graphics for Data Analysis (Springer‐Verlag, 2016). [Google Scholar]
- 36. Oliveros J. C., “2007–2015 Venny. An Interactive Tool for Comparing Lists With Venn's Diagrams.” 2024.
- 37. Liu Y., Sun Y., Yang J., et al., “DNMT1‐Targeting Remodeling Global DNA Hypomethylation for Enhanced Tumor Suppression and Circumvented Toxicity in Oral Squamous Cell Carcinoma,” Molecular Cancer 23 (2024): 104. [DOI] [PMC free article] [PubMed] [Google Scholar]
- 38. Shukla L., Lee S. A., Du M. R. M., Karnezis T., Ritchie M. E., and Shayan R., “A Transcriptomic Dataset Evaluating the Effect of Radiotherapy Injury on Cells of Skin and Soft Tissue,” Data in Brief 41 (2022): 107828. [DOI] [PMC free article] [PubMed] [Google Scholar]
- 39. Kuleshov M. V., Jones M. R., Rouillard A. D., et al., “Enrichr: A Comprehensive Gene Set Enrichment Analysis Web Server 2016 Update,” Nucleic Acids Research 44 (2016): W90–W97. [DOI] [PMC free article] [PubMed] [Google Scholar]
- 40. Chen E. Y., Tan C. M., Kou Y., et al., “Enrichr: Interactive and Collaborative HTML5 Gene List Enrichment Analysis Tool,” BMC Bioinformatics 14 (2013): 128. [DOI] [PMC free article] [PubMed] [Google Scholar]
- 41. Xie Z., Bailey A., Kuleshov M. V., et al., “Gene Set Knowledge Discovery With Enrichr,” Current Protocols 1 (2021): e90. [DOI] [PMC free article] [PubMed] [Google Scholar]
- 42. Mootha V. K., Lindgren C. M., Eriksson K. F., et al., “PGC‐1alpha‐Responsive Genes Involved in Oxidative Phosphorylation Are Coordinately Downregulated in Human Diabetes,” Nature Genetics 34 (2003): 267–273. [DOI] [PubMed] [Google Scholar]
- 43. Reich M., Liefeld T., Gould J., Lerner J., Tamayo P., and Mesirov J. P., “GenePattern 2.0,” Nature Genetics 38 (2006): 500–501. [DOI] [PubMed] [Google Scholar]
- 44. Subramanian A., Tamayo P., Mootha V. K., et al., “Gene Set Enrichment Analysis: A Knowledge‐Based Approach for Interpreting Genome‐Wide Expression Profiles,” Proceedings of the National Academy of Sciences of the United States of America 102 (2005): 15545–15550. [DOI] [PMC free article] [PubMed] [Google Scholar]
- 45. Livak K. J. and Schmittgen T. D., “Analysis of Relative Gene Expression Data Using Real‐Time Quantitative PCR and the 2(‐Delta Delta C(T)) Method,” Methods 25 (2001): 402–408. [DOI] [PubMed] [Google Scholar]
- 46. Wolf S. J., Audu C. O., Joshi A., et al., “IFN‐κ Is Critical for Normal Wound Repair and Is Decreased in Diabetic Wounds,” JCI Insight 7 (2022): e152765. [DOI] [PMC free article] [PubMed] [Google Scholar]
- 47. Au‐Yeung N., Mandhana R., and Horvath C. M., “Transcriptional Regulation by STAT1 and STAT2 in the Interferon JAK‐STAT Pathway,” JAK‐STAT 2 (2013): e23931. [DOI] [PMC free article] [PubMed] [Google Scholar]
- 48. Platanias L. C., “Mechanisms of Type‐I‐ and Type‐II‐Interferon‐Mediated Signalling,” Nature Reviews. Immunology 5 (2005): 375–386. [DOI] [PubMed] [Google Scholar]
- 49. Larsen S. B., Cowley C. J., Sajjath S. M., et al., “Establishment, Maintenance, and Recall of Inflammatory Memory,” Cell Stem Cell 28 (2021): 1758–1774. [DOI] [PMC free article] [PubMed] [Google Scholar]
- 50. Ordovas‐Montanes J., Dwyer D. F., Nyquist S. K., et al., “Allergic Inflammatory Memory in Human Respiratory Epithelial Progenitor Cells,” Nature 560 (2018): 649–654. [DOI] [PMC free article] [PubMed] [Google Scholar]
- 51. Zegers M. M. and Friedl P., “Rho GTPases in Collective Cell Migration,” Small GTPases 5 (2014): e28997. [DOI] [PMC free article] [PubMed] [Google Scholar]
- 52. Hopkinson S. B., Hamill K. J., Wu Y., Eisenberg J. L., Hiroyasu S., and Jones J. C., “Focal Contact and Hemidesmosomal Proteins in Keratinocyte Migration and Wound Repair,” Advances in Wound Care 3 (2014): 247–263. [DOI] [PMC free article] [PubMed] [Google Scholar]
- 53. Watt F. M., “Role of Integrins in Regulating Epidermal Adhesion, Growth and Differentiation,” EMBO Journal 21 (2002): 3919–3926. [DOI] [PMC free article] [PubMed] [Google Scholar]
- 54. Hood J. D. and Cheresh D. A., “Role of Integrins in Cell Invasion and Migration,” Nature Reviews. Cancer 2 (2002): 91–100. [DOI] [PubMed] [Google Scholar]
- 55. Zhang W. and Liu H. T., “MAPK Signal Pathways in the Regulation of Cell Proliferation in Mammalian Cells,” Cell Research 12 (2002): 9–18. [DOI] [PubMed] [Google Scholar]
- 56. Xie Y., Shi X., Sheng K., et al., “PI3K/Akt Signaling Transduction Pathway, Erythropoiesis and Glycolysis in Hypoxia (Review),” Molecular Medicine Reports 19 (2019): 783–791. [DOI] [PMC free article] [PubMed] [Google Scholar]
- 57. Leonardo T. R., Chen L., Schrementi M. E., et al., “Transcriptional Changes in Human Palate and Skin Healing,” Wound Repair and Regeneration 31 (2023): 156–170. [DOI] [PMC free article] [PubMed] [Google Scholar]
- 58. Chen L., Gajendrareddy P. K., and DiPietro L. A., “Differential Expression of HIF‐1α in Skin and Mucosal Wounds,” Journal of Dental Research 91 (2012): 871–876. [DOI] [PMC free article] [PubMed] [Google Scholar]
- 59. Fitsialos G., Bourget I., Augier S., et al., “HIF1 Transcription Factor Regulates Laminin‐332 Expression and Keratinocyte Migration,” Journal of Cell Science 121 (2008): 2992–3001. [DOI] [PubMed] [Google Scholar]
- 60. Miao Q., Hill M. C., Chen F., et al., “SOX11 and SOX4 Drive the Reactivation of an Embryonic Gene Program During Murine Wound Repair,” Nature Communications 10 (2019): 4042. [DOI] [PMC free article] [PubMed] [Google Scholar]
- 61. Uddin S., Lekmine F., Sassano A., Rui H., Fish E. N., and Platanias L. C., “Role of Stat5 in Type I Interferon‐Signaling and Transcriptional Regulation,” Biochemical and Biophysical Research Communications 308 (2003): 325–330. [DOI] [PubMed] [Google Scholar]
- 62. Tanabe Y., Nishibori T., Su L., Arduini R. M., Baker D. P., and David M., “Cutting Edge: Role of STAT1, STAT3, and STAT5 in IFN‐Alpha Beta Responses in T Lymphocytes,” Journal of Immunology 174 (2005): 609–613. [DOI] [PubMed] [Google Scholar]
- 63. Zhang L. J., “Type1 Interferons Potential Initiating Factors Linking Skin Wounds With Psoriasis Pathogenesis,” Frontiers in Immunology 10 (2019): 1440. [DOI] [PMC free article] [PubMed] [Google Scholar]
- 64. Hudson L. G., Newkirk K. M., Chandler H. L., et al., “Cutaneous Wound Reepithelialization Is Compromised in Mice Lacking Functional Slug (Snai2),” Journal of Dermatological Science 56 (2009): 19–26. [DOI] [PMC free article] [PubMed] [Google Scholar]
- 65. Shi G., Sohn K. C., Li Z., et al., “Expression and Functional Role of Sox9 in Human Epidermal Keratinocytes,” PLoS One 8 (2013): e54355. [DOI] [PMC free article] [PubMed] [Google Scholar]
- 66. Garces Alonso I., Liang H. C., Turner S. D., Lagger S., Merkel O., and Kenner L., “The Role of Activator Protein‐1 (AP‐1) Family Members in CD30‐Positive Lymphomas,” Cancers (Basel) 10 (2018): 93. [DOI] [PMC free article] [PubMed] [Google Scholar]
- 67. Pastar I., Stojadinovic O., Yin N. C., et al., “Epithelialization in Wound Healing: A Comprehensive Review,” Advances in Wound Care 3 (2014): 445–464. [DOI] [PMC free article] [PubMed] [Google Scholar]
- 68. Thorup A. K., Dabelsteen E., Schou S., Gil S. G., Carter W. G., and Reibel J., “Differential Expression of Integrins and Laminin‐5 in Normal Oral Epithelia,” APMIS 105 (1997): 519–530. [DOI] [PubMed] [Google Scholar]
- 69. Madlener M., “Differential Expression of Matrix Metalloproteinases and Their Physiological Inhibitors in Acute Murine Skin Wounds,” Archives of Dermatological Research 290, no. Supp l (1998): S24–S29. [DOI] [PubMed] [Google Scholar]
- 70. Ahokas K., Skoog T., Suomela S., et al., “Matrilysin‐2 (Matrix Metalloproteinase‐26) is Upregulated in Keratinocytes During Wound Repair and Early Skin Carcinogenesis,” Journal of Investigative Dermatology 124 (2005): 849–856. [DOI] [PubMed] [Google Scholar]
- 71. Larjava H., Koivisto L., Häkkinen L., and Heino J., “Epithelial Integrins With Special Reference to Oral Epithelia,” Journal of Dental Research 90 (2011): 1367–1376. [DOI] [PMC free article] [PubMed] [Google Scholar]
- 72. O'Toole E. A., “Extracellular Matrix and Keratinocyte Migration,” Clinical and Experimental Dermatology 26 (2001): 525–530. [DOI] [PubMed] [Google Scholar]
- 73. Pang X., He X., Qiu Z., et al., “Targeting Integrin Pathways: Mechanisms and Advances in Therapy,” Signal Transduction and Targeted Therapy 8 (2023): 1. [DOI] [PMC free article] [PubMed] [Google Scholar]
- 74. Chen P. and Parks W. C., “Role of Matrix Metalloproteinases in Epithelial Migration,” Journal of Cellular Biochemistry 108 (2009): 1233–1243. [DOI] [PMC free article] [PubMed] [Google Scholar]
- 75. Kandhwal M., Behl T., Singh S., et al., “Role of Matrix Metalloproteinase in Wound Healing,” American Journal of Translational Research 14 (2022): 4391–4405. [PMC free article] [PubMed] [Google Scholar]
- 76. Huttenlocher A. and Horwitz A. R., “Integrins in Cell Migration,” Cold Spring Harbor Perspectives in Biology 3 (2011): a005074. [DOI] [PMC free article] [PubMed] [Google Scholar]
- 77. Wang Y. and Graves D. T., “Keratinocyte Function in Normal and Diabetic Wounds and Modulation by FOXO1,” Journal Diabetes Research 2020 (2020): 3714704. [DOI] [PMC free article] [PubMed] [Google Scholar]
- 78. Waasdorp M., Krom B. P., Bikker F. J., van Zuijlen P. P. M., Niessen F. B., and Gibbs S., “The Bigger Picture: Why Oral Mucosa Heals Better Than Skin,” Biomolecules 11 (2021): 1165. [DOI] [PMC free article] [PubMed] [Google Scholar]
- 79. Ridiandries A., Tan J. T. M., and Bursill C. A., “The Role of Chemokines in Wound Healing,” International Journal of Molecular Sciences 19 (2018): 3217. [DOI] [PMC free article] [PubMed] [Google Scholar]
- 80. Morhenn V. B., Nelson T. E., and Gruol D. L., “The Rate of Wound Healing Is Increased in Psoriasis,” Journal of Dermatological Science 72 (2013): 87–92. [DOI] [PMC free article] [PubMed] [Google Scholar]
- 81. Mansbridge J. N., Knapp A. M., and Strefling A. M., “Evidence for an Alternative Pathway of Keratinocyte Maturation in Psoriasis From an Antigen Found in Psoriatic but Not Normal Epidermis,” Journal of Investigative Dermatology 83 (1984): 296–301. [DOI] [PubMed] [Google Scholar]
- 82. Kirfel G. and Herzog V., “Migration of Epidermal Keratinocytes: Mechanisms, Regulation, and Biological Significance,” Protoplasma 223 (2004): 67–78. [DOI] [PubMed] [Google Scholar]
- 83. Hesse E., Hefferan T. E., Tarara J. E., et al., “Collagen Type I Hydrogel Allows Migration, Proliferation, and Osteogenic Differentiation of Rat Bone Marrow Stromal Cells,” Journal of Biomedical Materials Research. Part A 94 (2010): 442–449. [DOI] [PMC free article] [PubMed] [Google Scholar]
- 84. Lombardi F., Palumbo P., Augello F. R., et al., “Type I Collagen Suspension Induces Neocollagenesis and Myodifferentiation in Fibroblasts In Vitro,” BioMed Research International 2020 (2020): 6093974. [DOI] [PMC free article] [PubMed] [Google Scholar]
- 85. Bitterman P. B., Rennard S. I., Adelberg S., and Crystal R. G., “Role of Fibronectin as a Growth Factor for Fibroblasts,” Journal of Cell Biology 97 (1983): 1925–1932. [DOI] [PMC free article] [PubMed] [Google Scholar]
- 86. Greiling D. and Clark R. A., “Fibronectin Provides a Conduit for Fibroblast Transmigration From Collagenous Stroma Into Fibrin Clot Provisional Matrix,” Journal of Cell Science 110, no. Pt 7 (1997): 861–870. [DOI] [PubMed] [Google Scholar]
- 87. Chaturvedi V., Qin J. Z., Denning M. F., Choubey D., Diaz M. O., and Nickoloff B. J., “Apoptosis in Proliferating, Senescent, and Immortalized Keratinocytes,” Journal of Biological Chemistry 274 (1999): 23358–23367. [DOI] [PubMed] [Google Scholar]
- 88. Lewis D. A., Hengeltraub S. F., Gao F. C., Leivant M. A., and Spandau D. F., “Aberrant NF‐kappaB Activity in HaCaT Cells Alters Their Response to UVB Signaling,” Journal of Investigative Dermatology 126 (2006): 1885–1892. [DOI] [PubMed] [Google Scholar]
- 89. Jin J., Hu H., Li H. S., et al., “Noncanonical NF‐κB Pathway Controls the Production of Type I Interferons in Antiviral Innate Immunity,” Immunity 40 (2014): 342–354. [DOI] [PMC free article] [PubMed] [Google Scholar]
- 90. Hayden M. S. and Ghosh S., “Shared Principles in NF‐kappaB Signaling,” Cell 132 (2008): 344–362. [DOI] [PubMed] [Google Scholar]
- 91. Wang J., Basagoudanavar S. H., Wang X., et al., “NF‐Kappa B RelA Subunit Is Crucial for Early IFN‐Beta Expression and Resistance to RNA Virus Replication,” Journal of Immunology 185 (2010): 1720–1729. [DOI] [PMC free article] [PubMed] [Google Scholar]
- 92. Jahn M., Lang V., Diehl S., et al., “Different Immortalized Keratinocyte Cell Lines Display Distinct Capabilities to Differentiate and Reconstitute an Epidermis In Vitro,” Experimental Dermatology 33 (2024): e14985. [DOI] [PubMed] [Google Scholar]
- 93. Boelsma E., Verhoeven M. C., and Ponec M., “Reconstruction of a Human Skin Equivalent Using a Spontaneously Transformed Keratinocyte Cell Line (HaCaT),” Journal of Investigative Dermatology 112 (1999): 489–498. [DOI] [PubMed] [Google Scholar]
- 94. Moran M. C., Pandya R. P., Leffler K. A., Yoshida T., Beck L. A., and Brewer M. G., “Characterization of Human Keratinocyte Cell Lines for Barrier Studies,” JID Innovations 1 (2021): 100018. [DOI] [PMC free article] [PubMed] [Google Scholar]
Associated Data
This section collects any data citations, data availability statements, or supplementary materials included in this article.
Supplementary Materials
Figure S1.
Table S1.
Data Availability Statement
All mRNA‐sequencing related data generated by us are available for public access at: https://www.ncbi.nlm.nih.gov/geo/query/acc.cgi?acc=GSE270877. The mRNA‐sequencing data utilized from GSE184119 and GSE262505 are available at: https://www.ncbi.nlm.nih.gov/geo/query/acc.cgi?acc=GSE184119 and https://www.ncbi.nlm.nih.gov/geo/query/acc.cgi?acc=GSE262505. Other data that support the findings of this study are available in the [Link], [Link] of this article. The R code used in this manuscript is available on GitHub: https://github.com/ChenHanMDPhD/Transcriptomic‐Differences‐between‐Oral‐and‐Skin‐Keratinocytes/blob/main/Code%20for%20Manuscript.R.