

Abstract
Rhizoctonia solani is a ubiquitously distributed soil-borne fungal pathogen that causes serious diseases in many plants worldwide. It attracts significant research attention due to its considerable economic importance in agricultural production. However, the limited availability of genome information has further impeded the development of new molecular-targeted control technologies. By utilizing Illumina short-read, PacBio HiFi long-read, and high-throughput chromosome conformation capture (Hi-C) sequencing technologies, we present a comprehensive and continuous chromosome-level assembly for R. solani. The final genome size is 40,801,261 bp, consisting of 23 contigs with a N50 of 2,529,230 bp. Hi-C data aids in anchoring the assembly onto 16 chromosomes. Additionally, the genome contains 16.17% (6,597,897 bp) repeat elements, including 10,698 protein-coding genes and 232 non-coding RNAs. The high-quality genome of R. solani not only provides valuable genomic information for further comprehending the fungal pathobiology and evolution, but also contributes to the development of scientific control strategies for disease prevention and control in agriculture.
Subject terms: Fungal genomics, Fungal pathogenesis
Background & Summary
The genus Rhizoctonia belongs to the order Cantharellales, phylum Basidiomycota1. Rhizoctonia species are classified into three main groups according to the number of nuclei in the fungal cells: Uninucleate Rhizoctonia, binucleate Rhizoctonia and multinucleate Rhizoctonia2. Rhizoctonia solani is the most widely known species within the group of multinucleate Rhizoctonia and is assigned into different anastomosis groups (AGs) based on hyphal fusion reactions and subgroups based on cultural morphology3. R. solani is a soil-borne plant pathogen with a necrotrophic lifestyle that lives in soil by developing a resistant survival structure known as sclerotia4. It affects a wide host that causes numerous crop diseases, leading to significant economic losses5.
Tobacco is one of the economically important solanaceous crops, which is widely produced in the worldwide. As a major producer, consumer, and exporter of tobacco, the production and import/export trade volumes of China tobacco is are directly related to the for the global economy6. Nevertheless, tobacco diseases adversely affect both the quantity and quality of the leaf and subsequently cause serious damage to tobacco plants. Among the various diseases affecting tobacco, tobacco target leaf spot, which is caused by the R. solani, is one of the most important fungus diseases commonly found in many tobacco-growing field and pandemics in China in recent years7. Owing to the wide host range of the pathogen, strong resistance of the sclerotia, and limited availability of resistant varieties, it is highly challenging to control the disease8. At present, the most effective and economical approach for controlling this disease in many regions of the world still mainly involve in the application of chemical fungicides. Although chemical control has some advantages, such as rapid results and simplicity of application. However, widespread and long-term use of fungicide leads to resistance and pesticide residues, posing a serious threat to food safety and human health9. The timing of fungicide application is crucial for the control of tobacco target leaf spot. For example, fungicides must be applied prior to infection to control diseases caused by R. solani10. Therefore, studying and elucidating the pathogenic mechanisms underlying the effects of R. solani is essential for the development and implementation of more effective and timely fungicides application measures.
The genome sequence should open up new possibilities, and important improvement for the future would be to determine the main biochemical and molecular mechanisms involved in the pathogenicity and virulence of R. solani. A knowledge of in-depth understanding about the molecular basis and evolution of R. solani may further increase our understanding of pathogenic process of the virulent pathogen for guiding field fungicides application. The identification of crucial virulence genes may lead to reveal potential drug targets for facilitating the development of fungicides. In this study, we construct the high-quality chromosome-level reference genome R. solani, combining Illumina short-read, PacBio HiFi long-read, and Hi-C data. Within this genome, we annotate protein-coding genes, repeat elements and non-coding RNAs. The high-quality genome of R. solani provides a valuable resource for future characterization of new virulence factors of R. solani and elucidation of their molecular mechanisms.
Methods
Sample collection
The R. solani strain used in this study was collected from the Yongshun County, Xiangxi Tujia and Miao Autonomous Prefecture, Hunan, China and routinely cultured at potato dextrose agar (PDA) medium at 25 °C. The hyphae of R. solani was harvested from yeast extract peptone dextrose (YEPD) medium set at 180 rpm and immediately frozen in liquid nitrogen and finally stored at −80 °C in the laboratory before sequencing.
Library preparation and sequencing
The genome size of R. solani was determined using the Illumina. The assembly of the R. solani genome was accomplished using PacBio HiFi long-read and Hi-C data.
High-molecular-weight genomic DNA was extracted using a cetyltrimethylammonium bromide (CTAB) method11. 0.5 μg DNA per sample was used as input material for the DNA sample preparations. Sequencing libraries were generated using Annoroad® Universal DNA Fragmentase kit and Annoroad® Universal DNA Library Prep Kit following the manufacturer’s recommendations and index codes were added to attribute sequences to each sample.
For Illumina sequencing, the library was constructed and sequenced on an Illumina NovaSeq × PLUS (Illumina, USA) with Paired-End Sequencing (PE150)12. The high-quality Illumina reads were obtained for genome size and heterozygosity estimation. We used clean reads as the input file and utilized Jellyfish to determine the K-mer frequency distribution13. As is shown in Fig. 1, the size of K-mer is k = 21, and the K-mer peak coverage is 99×. The results were then analyzed by GenomeScope to estimate genome features14. The estimated genome size of R. solani is approximately 45,293,528 bp and the homozygous rate is 100%. In total, we obtained 5.3 Gb (132×) of Illumina reads, 1.6 Gb (40×) of PacBio HiFi reads, 7.8 Gb (180×) of Hi-C data, and 6.2 Gb (155×) of transcriptome data (Table 1).
Fig. 1.
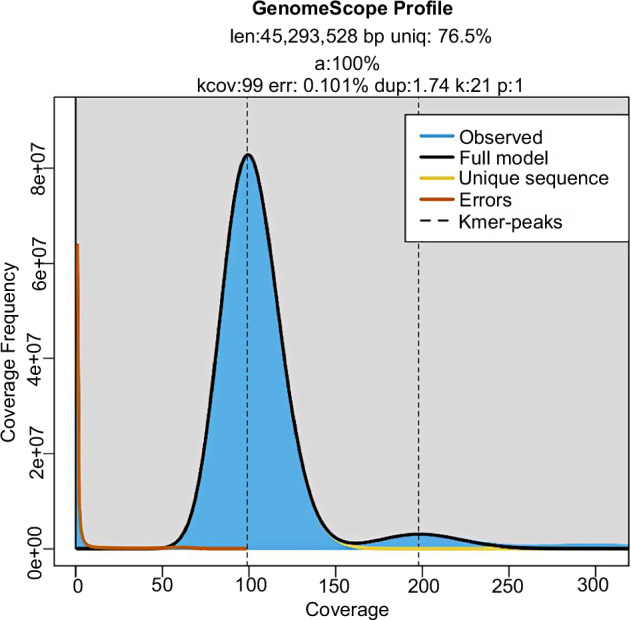
The K-mer distribution analysis of the R. solani genome. len, estimated genome size in bp; uniq, unique percent; a, homozygous rate; kcov, kmer coverage; err, error rate; dup, duplication rate; k, kmer. The x-axis represents the k-mer depth and the y-axis is the corresponding frequency.
Table 1.
Library sequencing data and methods used in this study to assemble the R. solani genome.
| Libraries | Instrument/Platform | Insert size | Raw data (Gb) | Clean data (Gb) | Sequencing coverage (×) | GC (%) |
|---|---|---|---|---|---|---|
| Illumina | Illumina NovaSeq × PLUS | 350 bp | 5.3 | 5.2 | 132 | 48.66 |
| PacBio HiFi | PacBio Revio | 15 kb | 1.6 | 1.6 | 40 | 48.36 |
| Hi-C | Illumina NovaSeq × PLUS | 350 bp | 7.8 | 7.2 | 180 | 47.9 |
| RNA | Illumina NovaSeq × PLUS | 350 bp | 6.2 | 5.6 | 155 | 52.92 |
Denovo genome assembly
For PacBio HiFi sequencing, genomic DNA was fragmented to construct a long-read library following the manufacturer’s instructions (Pacific Biosciences)15. The HiFi library was prepared using the SMRTbell Express Template Prep Kit 2.0 (Pacific Biosciences). The library was sequenced on a PacBio Revio platform using Circular Consensus Sequencing (CCS) mode with the standard parameters16. The CCS data were used to assemble 23 contigs, with the longest contig length of 3,627,449 bp and an N50 length of 2, 529, 230 bp and an average length of 15 kb using Hifiasm software17. This resulted in a total genome sequence size of 40,801,261 bp (Table 2). The completeness of the assemblies was subsequently assessed by BUSCO (Benchmarking Universal Single-Copy Orthologs) assessments18. A total of 93.9% (93.4% single-copy BUSCOs) completeness was revealed by the analysis (Table 3).
Table 2.
PacBio sequencing assembly statistics of R. solani.
| Items | Contig_len (bp) | Contig_num |
|---|---|---|
| Total | 40,801,261 | 23 |
| Max | 3,627,449 | — |
| Number>=2000 bp | — | 23 |
| N50 | 2,529,230 | 7 |
| N60 | 2,313,031 | 9 |
| N70 | 2,265,040 | 10 |
| N80 | 2,071,711 | 12 |
| N90 | 1,932,555 | 14 |
Table 3.
BUSCO evaluation of R. solani genome assembly.
| Items | Number | Percent (%) |
|---|---|---|
| Complete BUSCOs (C) | 712 | 93.9 |
| Complete and single-copy BUSCOs (S) | 708 | 93.4 |
| Complete and duplicated BUSCOs (D) | 4 | 0.5 |
| Fragmented BUSCOs (F) | 10 | 1.3 |
| Missing BUSCOs (M) | 36 | 4.8 |
| Total BUSCO groups searched | 758 | 100 |
Chromosomal-level genome scaffolding with Hi-C data
Hi-C technology (High-throughput/resolution chromosome conformation capture) was applied to obtain the genome at the chromosomal level19. The Hi-C library was prepared using a modified method according to standard protocol20. After being cultured in YEPD at 180 rpm, the mycelia of R. solani were collected. Then, they were crosslinked with formaldehyde for 10 minutes. Subsequently, the reaction was quenched by adding 2.5 M glycine for 20 minutes. After that, the crosslinked DNA was extracted from the nuclei and digested using the MboI restriction enzyme. After the enzyme was inactivated at 65 °C for 20 min, the cohesive ends were filled in by biotin. The final step was the ligation and DNA purification, DNA ligase was used to start proximity ligation. To reverse the cross-linked state of DNA, proteinase digestion was applied, followed by purification of DNA. Biotin labeled Hi-C sample were specifically enriched using streptavidin magnetic beads. The fragment ends were adding A-tailing by Klenow (exo-) and then adding Illumina paired-end sequencing adapter and ligated to Illumina paired-end sequencing adapters. At last, the Hi-C libraries were amplified by 10–12 cycles PCR, and subsequent sequencing via the Illumina NovaSeq × PLUS platform.
The clean reads were first aligned on the genome assembly using the bowtie (http://bowtiebio.sourceforge.net/bowtie2/manual.shtml)21. The unmapped reads were mainly composed of the chimeric regions spanning across the ligation junction. Then, HiC-Pro was used to detect the ligation site of unmapped reads (https://github.com/nservant/HiC-Pro)22. The results of both mapping steps were merged into a single alignment file while the low mapping quality and multiple hitting reads and singletons were discarded. High-quality clean data was used for preliminary assembly by applying Lachesis software using default parameters (https://github.com/shendurelab/LACHESIS)23. The tool first clustered the contigs into chromosomal groups with the agglomerative hierarchical clustering algorithm and then ordered and oriented the contigs of each chromosomal group into pseudochromosomes24. After clustering, ordering, and orienting the contigs, we obtained the final assembly results. The Hi-C data further confirmed that the chromosome-anchored size of R. solani is 40,801,261 bp, and the scaffold N50 length is 2,529,230 base pairs (Table 4). High-quality Hi-C reads were further utilized to scaffold the contigs into 16 chromosomes. (Fig. 2, Table 5). As shown in Fig. 3, the Hi-C data signal was strongest along the diagonal, demonstrating effective genome assembly.
Table 4.
Hi-C scafolding assembly statistics of R. solani.
| Items | Contig_len (bp) | Contig_num | Scaffold_len (bp) | Scaffold_num |
|---|---|---|---|---|
| Total | 40,801,261 | 23 | 40,801,261 | 23 |
| Max | 3,627,449 | — | 3,627,449 | — |
| Number>=2000 bp | — | 23 | — | 23 |
| N50 | 2,529,230 | 7 | 2,529,230 | 7 |
| N60 | 2,313,031 | 9 | 2,313,031 | 9 |
| N70 | 2,265,040 | 10 | 2,265,040 | 10 |
| N80 | 2,071,711 | 12 | 2,071,711 | 12 |
| N90 | 1,932,555 | 14 | 1,932,555 | 14 |
Fig. 2.

Circular plot showing the gene features in R. solani genome. The tracks from the outer ring to the inner ring represent the sixteen chromosomes (Chr1-Chr16), gene position, Repeat element density, non-coding RNA and GC content. The densities are calculated in 50 kb windows. Chr: chromosome.
Table 5.
Summary of assembled 16 chromosomes of R. solani.
| Pseudomolecule | Contig Num | Length |
|---|---|---|
| Chr1 | 1 | 3,627,449 |
| Chr2 | 1 | 3,573,590 |
| Chr3 | 1 | 3,426,110 |
| Chr4 | 1 | 3,305,306 |
| Chr5 | 1 | 2,637,193 |
| Chr6 | 1 | 2,548,320 |
| Chr7 | 1 | 2,529,230 |
| Chr8 | 1 | 2,380,807 |
| Chr9 | 1 | 2,313,031 |
| Chr10 | 1 | 2,265,040 |
| Chr11 | 1 | 2,195,284 |
| Chr12 | 1 | 2,071,711 |
| Chr13 | 1 | 1,982,266 |
| Chr14 | 1 | 1,932,555 |
| Chr15 | 1 | 1,839,756 |
| Chr16 | 1 | 1,444,347 |
| Total anchored | 16 | 40,071,995 |
| Unanchored | 7 | 729,266 |
Fig. 3.

Hi-C interaction heat map of chromosomal level genome in R. solani.
RNA extraction and sequencing
To annotate the protein-coding genes, total RNA was extracted using the TRIzol approach (Invitrogen, USA) from hyphae of R. solani25. The high-quality RNA was used for total mRNA-Seq library construction by the Illumina TruSeq RNA Library Prep kit (Illumina, CA), following the manufacturer’s instructions. RNA-seq analysis was performed on an Illumina NovaSeq × PLUS platform. A total of 5.6 Gb of clean, paired-end RNA-seq data were obtained, which were then checked for quality control using fastp and mapped to the assembled genome sequence using Hisat2 under default parameters26,27. Mapping ratios were calculated using SAMtools28.
Gene annotation and repetitive elements analysis
Repetitive sequences were predicted by two strategies: homology-based and de novo methods. For homology-based repeat identification, we used RepeatMasker and RepeatProteinMask to scan the whole genome for known transposable elements in RepBase database (https://www.girinst.org/server/RepBase/index.php)29,30. De novo repeats were identified using RepeatModeler (version 1.0.11) (http://www.repeatmasker.org/RepeatModeler/)31. Tandem Repeats Finder (TRF) was used to search tandem repeats in the genome with default parameters32. The analysis conducted by RepeatMasker revealed that the R. solani genome comprises approximately 16.17% repetitive elements (Table 6).
Table 6.
Repeat elements statistics in the R. solani genome.
| Type | Repeat length(bp) | % of genome |
|---|---|---|
| RepeatMasker | 859,167 | 2.11 |
| ProteinMask | 2,395,606 | 5.87 |
| Denovo | 4,493,601 | 11.01 |
| Trf | 246,570 | 0.6 |
| Total | 6,597,897 | 16.17 |
Gene structure and function annotation
Gene structure was annotated using three strategies: transcriptome-based, homolog-based, and ab initio predictions27,33,34. GETA (Genome-wide Electronic Tool for Annotation) (https://github.com/chenlianfu/geta) was used to generate the high confidence, non-redundant gene set. The functional annotation of the predicted proteins was performed using multiple tools and databases, including the BLAST (Basic Local Alignment Search Tool), HMMER tools, as well as several databases such as the NT database (https://www.ncbi.nlm.nih.gov/nucleotide/)35, Swiss-prot database (https://web.expasy.org/docs/swissprot_guideline.html)36, eggNOG database (evolutionary genealogy of genes: Non-supervised Orthologous Groups, http://eggnogdb.embl.de/)37, GO database (Gene Ontology, http://geneontology.org/page/go-database)38, KEGG database (Kyoto Encyclopedia of Genes and Genomes, http://www.genome.jp/kegg/)39, and PFAM database (http://xfam.org/)40. In total, 10,698 of predicted protein models were functional annotated in the R. solani genome. Specifically, 10,339 protein models were annotated in the NCBI NR database (Table 7).
Table 7.
Summary of the functional gene annotation of the R. solani genome.
| Database | Count | Percentage (%) |
|---|---|---|
| BLASTP | 6482 | 62.03 |
| BLASTX | 6301 | 60.3 |
| GO | 6348 | 60.75 |
| KO | 3305 | 31.63 |
| Map | 2021 | 19.34 |
| NR | 10339 | 98.94 |
| NT | 4106 | 39.29 |
| PFAM | 8934 | 85.49 |
| eggNOG | 2508 | 24 |
| Total_anno | 10698 | 99.14 |
Non-coding RNA annotation
To identify noncoding RNA, BAsic Rapid Ribosomal RNA Predictor (BARRNAP) and tRNAScan-SE were executed for predicting rRNA and tRNA, respectively41. Infernal was used to identify the remaining noncoding RNA based on the alignment with the Rfam library42,43. Finally, 232 noncoding RNAs (ncRNAs) were predicted, including, 24 ribosomal RNAs (rRNAs), 23 small nuclear RNAs (snRNAs), and 185 transfer RNAs (tRNAs) (Table 8).
Table 8.
Summary statistics of Non-coding RNA annotation results.
| Class | Type | Copy | Average length (bp) | Total length (bp) | % of genome |
|---|---|---|---|---|---|
| miRNA | miRNA | 0 | 0 | 0 | 0 |
| tRNA | tRNA | 172 | 85.33 | 14676 | 0.03597 |
| 18S | 13 | 678.15 | 8816 | 0.02161 | |
| rRNA | 26S | 16 | 81.62 | 1306 | 0.0032 |
| 5.8S | 5 | 146 | 730 | 0.00179 | |
| CD-box | 3 | 93.33 | 280 | 0.00069 | |
| snRNA | HACA-box | 1 | 164 | 164 | 0.0004 |
| splicing | 22 | 143.23 | 3151 | 0.00772 |
Data Records
The raw sequencing data for this study are deposited in the National Center for Biotechnology Information (NCBI) under BioProject ID: PRJNA1171317. Illumina, transcriptome, PacBio HiFi and Hi-C sequencing data are available under the Sequence Read Archive ID: SRR30963447–SRR3096345044–48. The genome assembly and annotation data are deposited on NCBI GenBank under accession number GCA_049245135.149.
Technical Validation
DNA sample quality
The purity of the sample was determined by NanoPhotometer® (IMPLEN, CA, USA). The concentration of the sample was determined by Qubit® 3.0 Flurometer (Life Technologies, CA, USA). The Integrity of the DNA sample was evaluated by agarose gel electrophoresis.
RNA sample quality
The Nanodrop2000 microspectrophotometer detects sample purity and concentration. Labchip GX touch microfluidic capillary system detects the integrity of RNA samples.
Evaluation the quality of the genome assembly
Quality of the genome was evaluated as follow: (1) Benchmarking Universal Single-Copy Orthologs (BUSCO) software was applied to measure of genome completeness with the single-copy orthologs. The final genome assembly demonstrated a BUSCO completeness of 93.9%, with 93.4% single-copy BUSCOs, 0.5% duplicated BUSCOs, 1.3% fragmented BUSCOs, and 4.8% missing BUSCOs (Table 3). (2) The Illumina short reads were mapped to genome using the Burrows-Wheeler Aligner (BWA) software for calculating the mapping rates and genome coverage. (3) Transcripts from Illumina RNA-seq data were used to estimate the quality of the assembled genome. These data largely support a high-quality genome assembly of R. solani, which can be used for further investigation.
Acknowledgements
The authors thank Yuanwen Guo and Cong Huang (Institute of Plant Protection, Chinese Academy of Agricultural Sciences) for the assistance in uploading the assembly and annotation files. This project was supported by the Youth Innovation Program of the Chinese Academy of Agricultural Sciences (Y2023QC04), Major Science and Technology Projects (110202101045 (LS-05), 110202201020 (LS-04)) and the Agricultural Science and Technology Innovation Program (ASTIP).
Author contributions
G.T. and H.X. conceived and supervised the project. T.L collected the samples. H.X. and Y.H. carried out the experiments. H.X., Y.H., Q.G. and H.W. performed the bioinformatics analyses. G.T. wrote the manuscript. All authors have read and approved the final manuscript.
Code availability
No custom code was used for this study. All data analyses were conducted using published bioinformatics software with default settings unless otherwise specified.
Competing interests
The authors declare no competing interests.
Footnotes
Publisher’s note Springer Nature remains neutral with regard to jurisdictional claims in published maps and institutional affiliations.
These authors contributed equally: Haoxue Xia, Tianbo Liu.
References
- 1.Gónzalez, D. et al. Phylogenetic relationships of Rhizoctonia fungi within the Cantharellales. Fungal Biol120, 603–619 (2016). [DOI] [PMC free article] [PubMed] [Google Scholar]
- 2.Abdoulaye, A.H., Foda, M.F. & Kotta-Loizou, I. Viruses Infecting the Plant Pathogenic Fungus Rhizoctonia solani. Viruses11,1113 (2019). [DOI] [PMC free article] [PubMed]
- 3.Kaushik, A. et al. Pangenome analysis of the soilborne fungal phytopathogen Rhizoctonia solani and development of a comprehensive web resource: RsolaniDB. Front Microbiol13, 839524 (2022). [DOI] [PMC free article] [PubMed] [Google Scholar]
- 4.Sun, M. et al. Biological characteristics and metabolic phenotypes of different anastomosis groups of Rhizoctonia solani strains. BMC Microbiol24, 217 (2024). [DOI] [PMC free article] [PubMed] [Google Scholar]
- 5.Gonzalez, M. et al. Tobacco leaf spot and root rot caused by Rhizoctonia solani Kühn. Mol Plant Pathol12, 209–216 (2011). [DOI] [PMC free article] [PubMed] [Google Scholar]
- 6.Xu, S. et al. Morphological and molecular characterization of Rhizoctonia solani AG-3 associated with tobacco target leaf spot in China. J Basic Microbiol63, 200–209 (2023). [DOI] [PubMed] [Google Scholar]
- 7.Wu, Y. H., Zhao, Y. Q., Fu, Y., Zhao, X. X. & Chen, J. G. First report of target spot of flue-cured tobacco caused by Rhizoctonia solani AG-3 in China. Plant disease96, 1824 (2012). [DOI] [PubMed] [Google Scholar]
- 8.Singh, P., Mazumdar, P., Harikrishna, J. A. & Babu, S. Sheath blight of rice: a review and identification of priorities for future research. Planta250, 1387–1407 (2019). [DOI] [PubMed] [Google Scholar]
- 9.Zhong, J. et al. Characterization and biocontrol mechanism of Streptomyces olivoreticuli as a potential biocontrol agent against Rhizoctonia solani. Pesticide biochemistry and physiology197, 105681 (2023). [DOI] [PubMed] [Google Scholar]
- 10.Cheng, X. et al. Fungicide SYP-14288 inducing multidrug resistance in Rhizoctonia solani. Plant disease104, 2563–2570 (2020). [DOI] [PubMed] [Google Scholar]
- 11.Allen, G. C., Flores-Vergara, M. A., Krasynanski, S., Kumar, S. & Thompson, W. F. A modified protocol for rapid DNA isolation from plant tissues using cetyltrimethylammonium bromide. Nature protocols1, 2320–2325 (2006). [DOI] [PubMed] [Google Scholar]
- 12.Li, R. et al. De novo assembly of human genomes with massively parallel short read sequencing. Genome Res20, 265–272 (2010). [DOI] [PMC free article] [PubMed] [Google Scholar]
- 13.Marçais, G. & Kingsford, C. A fast, lock-free approach for efficient parallel counting of occurrences of k-mers. Bioinformatics (Oxford, England)27, 764–770 (2011). [DOI] [PMC free article] [PubMed] [Google Scholar]
- 14.Vurture, G. W. et al. GenomeScope: fast reference-free genome profiling from short reads. Bioinformatics (Oxford, England)33, 2202–2204 (2017). [DOI] [PMC free article] [PubMed] [Google Scholar]
- 15.Hon, T. et al. Highly accurate long-read HiFi sequencing data for five complex genomes. Sci Data7, 399 (2020). [DOI] [PMC free article] [PubMed] [Google Scholar]
- 16.Wenger, A. M. et al. Accurate circular consensus long-read sequencing improves variant detection and assembly of a human genome. Nature biotechnology37, 1155–1162 (2019). [DOI] [PMC free article] [PubMed] [Google Scholar]
- 17.Cheng, H., Concepcion, G. T., Feng, X., Zhang, H. & Li, H. Haplotype-resolved de novo assembly using phased assembly graphs with hifiasm. Nature methods18, 170–175 (2021). [DOI] [PMC free article] [PubMed] [Google Scholar]
- 18.Simão, F. A., Waterhouse, R. M., Ioannidis, P., Kriventseva, E. V. & Zdobnov, E. M. BUSCO: assessing genome assembly and annotation completeness with single-copy orthologs. Bioinformatics (Oxford, England)31, 3210–3212 (2015). [DOI] [PubMed] [Google Scholar]
- 19.van Berkum, N.L. et al. Hi-C: a method to study the three-dimensional architecture of genomes. Journal of visualized experiments: JoVE, 1869 (2010). [DOI] [PMC free article] [PubMed]
- 20.Lieberman-Aiden, E. et al. Comprehensive mapping of long-range interactions reveals folding principles of the human genome. Science (New York, N.Y.)326, 289–293 (2009). [DOI] [PMC free article] [PubMed] [Google Scholar]
- 21.Langmead, B. & Salzberg, S. L. Fast gapped-read alignment with Bowtie 2. Nature methods9, 357–359 (2012). [DOI] [PMC free article] [PubMed] [Google Scholar]
- 22.Servant, N. et al. HiTC: exploration of high-throughput ‘C’ experiments. Bioinformatics (Oxford, England)28, 2843–2844 (2012). [DOI] [PMC free article] [PubMed] [Google Scholar]
- 23.Burton, J. N. et al. Chromosome-scale scaffolding of de novo genome assemblies based on chromatin interactions. Nature biotechnology31, 1119–1125 (2013). [DOI] [PMC free article] [PubMed] [Google Scholar]
- 24.Zhou, C., McCarthy, S.A. & Durbin, R. YaHS: yet another Hi-C scaffolding tool. Bioinformatics (Oxford, England)39, btac808 (2023). [DOI] [PMC free article] [PubMed]
- 25.Fokkens, L. et al. A chromosome-scale genome assembly for the Fusarium oxysporum strain Fo5176 to establish a model Arabidopsis-fungal pathosystem. G3 (Bethesda, Md.)10, 3549–3555 (2020). [DOI] [PMC free article] [PubMed] [Google Scholar]
- 26.Chen, S., Zhou, Y., Chen, Y. & Gu, J. fastp: an ultra-fast all-in-one FASTQ preprocessor. Bioinformatics (Oxford, England)34, i884–i890 (2018). [DOI] [PMC free article] [PubMed] [Google Scholar]
- 27.Kim, D., Paggi, J. M., Park, C., Bennett, C. & Salzberg, S. L. Graph-based genome alignment and genotyping with HISAT2 and HISAT-genotype. Nature biotechnology37, 907–915 (2019). [DOI] [PMC free article] [PubMed] [Google Scholar]
- 28.Danecek, P. et al. Twelve years of SAMtools and BCFtools. GigaScience10, giab008 (2021). [DOI] [PMC free article] [PubMed]
- 29.Tarailo-Graovac, M. & Chen, N. Using RepeatMasker to identify repetitive elements in genomic sequences. Current protocols in bioinformaticsChapter 4, 4.10.11–14.10.14 (2009). [DOI] [PubMed] [Google Scholar]
- 30.Bao, W., Kojima, K. K. & Kohany, O. Repbase Update, a database of repetitive elements in eukaryotic genomes. Mobile DNA6, 11 (2015). [DOI] [PMC free article] [PubMed] [Google Scholar]
- 31.Flynn, J. M. et al. RepeatModeler2 for automated genomic discovery of transposable element families. Proceedings of the National Academy of Sciences of the United States of America117, 9451–9457 (2020). [DOI] [PMC free article] [PubMed] [Google Scholar]
- 32.Benson, G. Tandem repeats finder: a program to analyze DNA sequences. Nucleic Acids Res27, 573–580 (1999). [DOI] [PMC free article] [PubMed] [Google Scholar]
- 33.Birney, E., Clamp, M. & Durbin, R. GeneWise and Genomewise. Genome Res14, 988–995 (2004). [DOI] [PMC free article] [PubMed] [Google Scholar]
- 34.Stanke, M., Steinkamp, R., Waack, S. & Morgenstern, B. AUGUSTUS: a web server for gene finding in eukaryotes. Nucleic Acids Res32, W309–312 (2004). [DOI] [PMC free article] [PubMed] [Google Scholar]
- 35.McGinnis, S. & Madden, T. L. BLAST: at the core of a powerful and diverse set of sequence analysis tools. Nucleic Acids Res32, W20–25 (2004). [DOI] [PMC free article] [PubMed] [Google Scholar]
- 36.Boutet, E., Lieberherr, D., Tognolli, M., Schneider, M. & Bairoch, A. UniProtKB/Swiss-Prot. Methods in molecular biology (Clifton, N.J.)406, 89–112 (2007). [DOI] [PubMed] [Google Scholar]
- 37.Powell, S. et al. eggNOG v3.0: orthologous groups covering 1133 organisms at 41 different taxonomic ranges. Nucleic Acids Res40, D284–289 (2012). [DOI] [PMC free article] [PubMed] [Google Scholar]
- 38.Ashburner, M. et al. Gene ontology: tool for the unification of biology. The Gene Ontology Consortium. Nature genetics25, 25–29 (2000). [DOI] [PMC free article] [PubMed] [Google Scholar]
- 39.Kanehisa, M., Goto, S., Sato, Y., Furumichi, M. & Tanabe, M. KEGG for integration and interpretation of large-scale molecular data sets. Nucleic Acids Res40, D109–114 (2012). [DOI] [PMC free article] [PubMed] [Google Scholar]
- 40.Mistry, J. et al. Pfam: The protein families database in 2021. Nucleic Acids Res49, D412–d419 (2021). [DOI] [PMC free article] [PubMed] [Google Scholar]
- 41.Chan, P. P., Lin, B. Y., Mak, A. J. & Lowe, T. M. tRNAscan-SE 2.0: improved detection and functional classification of transfer RNA genes. Nucleic Acids Res49, 9077–9096 (2021). [DOI] [PMC free article] [PubMed] [Google Scholar]
- 42.Griffiths-Jones, S. et al. Rfam: annotating non-coding RNAs in complete genomes. Nucleic Acids Res33, D121–124 (2005). [DOI] [PMC free article] [PubMed] [Google Scholar]
- 43.Nawrocki, E. P. & Eddy, S. R. Infernal 1.1: 100-fold faster RNA homology searches. Bioinformatics (Oxford, England)29, 2933–2935 (2013). [DOI] [PMC free article] [PubMed] [Google Scholar]
- 44.NCBI BioProjecthttps://www.ncbi.nlm.nih.gov/bioproject/PRJNA1171317 (2024).
- 45.NCBI Sequence Read Archivehttps://identifiers.org/ncbi/insdc.sra:SRR30963447 (2024).
- 46.NCBI Sequence Read Archivehttps://identifiers.org/ncbi/insdc.sra:SRR30963448 (2024).
- 47.NCBI Sequence Read Archivehttps://identifiers.org/ncbi/insdc.sra:SRR30963449 (2024).
- 48.NCBI Sequence Read Archivehttps://identifiers.org/ncbi/insdc.sra:SRR30963450 (2024).
- 49.NCBI GenBankhttps://identifiers.org/ncbi/insdc.gca:GCA_049245135.1 (2025).
Associated Data
This section collects any data citations, data availability statements, or supplementary materials included in this article.
Data Citations
- NCBI Sequence Read Archivehttps://identifiers.org/ncbi/insdc.sra:SRR30963447 (2024).
- NCBI Sequence Read Archivehttps://identifiers.org/ncbi/insdc.sra:SRR30963448 (2024).
- NCBI Sequence Read Archivehttps://identifiers.org/ncbi/insdc.sra:SRR30963449 (2024).
- NCBI Sequence Read Archivehttps://identifiers.org/ncbi/insdc.sra:SRR30963450 (2024).
Data Availability Statement
No custom code was used for this study. All data analyses were conducted using published bioinformatics software with default settings unless otherwise specified.