

Abstract
Classifying chondroid tumors is an essential step for effective treatment planning. Recently, with the advances in computer-aided diagnosis and the increasing availability of medical imaging data, automated tumor classification using deep learning shows promise in assisting clinical decision-making. In this study, we propose a hybrid approach that integrates deep learning and radiomics for chondroid tumor classification. First, we performed tumor segmentation using the nnUNetv2 framework, which provided three-dimensional (3D) delineation of tumor regions of interest (ROIs). From these ROIs, we extracted a set of radiomics features and deep learning-derived features. After feature selection, we identified 15 radiomics and 15 deep features to build classification models. We developed 5 machine learning classifiers including Random Forest, XGBoost, Gradient Boosting, LightGBM, and CatBoost for the classification models. The approach integrating features from radiomics, ROI-originated deep learning features, and clinical variables yielded the best overall classification results. Among the classifiers, CatBoost classifier achieved the highest accuracy of 0.90 (95% CI 0.90–0.93), a weighted kappa of 0.85, and an AUC of 0.91. These findings highlight the potential of integrating 3D U-Net-assisted segmentation with radiomics and deep learning features to improve classification of chondroid tumors.
Supplementary Information
The online version contains supplementary material available at 10.1038/s41598-025-07128-w.
Keywords: Chondroid tumors, MRI images, Tumor segmentation, Computer-aided diagnosis, Deep learning, Radiomics, 3D U-Net, Machine learning algorithms
Subject terms: Health care, Medical imaging, Bone imaging
Introduction
Chondroid tumor is a group of diverse spectra characterized by the production of a cartilage-like matrix, which ranges from benign forms, such as enchondroma, to malignant forms like chondrosarcoma1. While benign chondroid tumors are often asymptomatic and can easily be diagnosed via medical images, their malignant counterparts pose significant challenges due to their invasive nature and potential for metastasis2,3. Differentiating between benign and malignant tumors is crucial, as it determines the treatment strategy: conservative monitoring for benign cases versus surgical intervention for malignant ones. However, this distinction is often challenging based solely on morphology-based findings from traditional medical imaging techniques, highlighting the need for advanced diagnostic tools to improve precision and consistency in chondroid tumor classification.
One promising approach is radiomics, a technique that extracts a large array of quantitative features from medical images4,5. By converting qualitative imaging data into measurable features based on shape, structure, and intensity, radiomics enables an objective analysis6. This methodology has shown significant advancements in the classification of musculoskeletal tumors, including chondroid tumors, where the differentiation between benign and malignant is challenging7. Radiomics allows clinicians to conduct a comprehensive analysis of tumor heterogeneity8. However, radiomics cannot handle complex, high-dimensional patterns, and not all radiomics features are clinically relevant9,10.
To address these limitations, deep learning (DL) has emerged as an approach to overcoming the limitations of radiomics11. DL is increasingly applied to medical imaging due to the ability to extract and learn complex features from large datasets automatically12,13. In a classification of chondroid tumors, DL models outperform radiologists or radiomics-based approaches by identifying complex patterns from MRI14,15. DL also reduces the time for labor-intensive processes such as manual segmentation and feature extraction by focusing more on automatically extracting features16,17. However, when extracting deep and high-dimension features, DL can sometimes overlook clinically relevant, handcrafted features that radiomics can provide.
Recognizing the complementary strengths of radiomics and deep learning, recent research has focused on combining these two methods to develop robust and high-performance tumor classification models18. This hybrid strategy integrates handcrafted radiomics with automatically learned high-dimensional features of DL, leading to a significant improvement in classification accuracy19. This combined approach was particularly valuable for predicting malignant nodules, in which both handcrafted radiomics and deep features are crucial for distinguishing benign and malignant nodules classification20. Studies have shown that machine learning models integrating both radiomics and deep features outperform models that use either method alone, offering a more comprehensive analysis21,22. This hybrid approach represents a promising direction for improving the precision of diagnosis and supporting clinical decision-making in musculoskeletal oncology.
The integration of radiomics and deep learning approach has proven not only in 2D but also in 3D imaging, providing robustness and versatility in tumor classification23,24. Recent studies have focused on using 3D radiomics features to extract morphological and textural details from volumetric data, providing a comprehensive view of tumor characteristics compared to the 2D approach in breast and lung cancers25,26. This approach demonstrates the increasing utility of 3D imaging on in capturing complex morphological and textural features, thereby extracting and enhancing classification performance in oncology. Therefore, the purpose of this study is to develop a streamlined approach using automatic segmentation and classification based on combined radiomics and DL-features in chondroid bone tumors.
Results
Clinical characteristics
A total of 147 patients who performed MRIs for chondroid tumors were included in our study. The MRI sequences consisted of coronal or sagittal fat-suppressed T2-weighted images, and axial T1-weighted, T2-weighted and fat-suppressed T2-weighted images, DWI with ADC map, and contrast-enhanced fat-suppressed T1-weighted image. The data were divided into training and testing set. The training set consisted of 117 patients, and the testing set comprised 30 patients. The mean age in the training set is 42 (range: 12–78), while the mean age in the testing set is 43 (range: 20–78). There were 41 male and 76 female patients in the training set, while 8 males and 22 females were in the testing set. Tumors were classified into three categories: enchondroma (class 0), grade 1 chondrosarcoma (class 1), and grade 2 & 3 chondrosarcoma (class 2). The training set contained 94 enchondromas, 14 grade 1 chondrosarcomas, and 9 grade 2 & 3 chondrosarcomas. The testing set comprised 24 enchondromas, 3 grade 1 chondrosarcomas, and 3 grade 2 & 3 chondrosarcomas (Table 1).
Table 1.
Patient characteristics.
| Clinical characteristics | Training dataset | Testing dataset | p-value |
|---|---|---|---|
| No. of patients | 117 | 30 | |
| Age | 42 (12–78) | 43 (20–78) | 0.968 |
| Sex | 0.936 | ||
| Man | 41 | 8 | |
| Woman | 76 | 22 | |
| Tumor categories | 0.895 | ||
| Enchondroma | 94 | 24 | |
| Grade 1 chondrosarcoma | 14 | 3 | |
| Grade 2 & 3 chondrosarcoma | 9 | 3 |
Segmentation performance
Table 2 shows the segmentation performance, which is consistent across the five-folds, with an average training loss of 0.1572 and a range of 0.1496–0.1695. The validation loss ranged from 0.1993 to 0.3215 in folds 2 and3, respectively, with the fold 3 performing the best. Regarding segmentation accuracy, the fold 3 also produces outstanding results compared to the others, with the highest dice score (0.9118) and mean validation dice score (0.8833). In general, the average dice (0.8491) and mean validation dice (0.8488) across all folds indicate the robust segmentation of the model. This segmentation performance influences the extracted shape features. However, we did not manually correct the segmentation since our goal was to build an end-to-end automated pipeline from segmentation to classification.
Table 2.
Performance Results of 3D U-Net for Chondroid Tumor Segmentation.
| Fold | Train loss | Validation loss | Dice | Mean validation dice |
|---|---|---|---|---|
| Fold 0 | 0.1561 | 0.2552 | 0.8310 | 0.8462 |
| Fold 1 | 0.1496 | 0.2783 | 0.8523 | 0.8541 |
| Fold 2 | 0.158 | 0.3215 | 0.7902 | 0.8155 |
| Fold 3 | 0.1695 | 0.1993 | 0.9118 | 0.8833 |
| Fold 4 | 0.1528 | 0.2711 | 0.8601 | 0.8447 |
| Average | 0.1572 | 0.2651 | 0.8491 | 0.8488 |
Classification performance
Models are evaluated on multiple metrics, including accuracy, weighted kappa, and area under the curve (AUC), provide comprehensive insight into classification performance. The following analysis provides insights into the classification capability of each modeling approach and highlights the importance of integrative types of data. Table 3 presents the classification performance across five models using five different classifiers. Receiver operating characteristic (ROC) curves of the models are shown in Fig. 1. The confusion matrix of the CatBoost classifier, which demonstrated the highest performance among the models, is presented in Fig. 2. Supplementary Fig. 2 illustrates confusion matrices for all 5 models and classifiers.
Table 3.
Classification performance of features combination models.
| Classifiers | Accuracy (95% CI) | Weighted Kappa | AUC |
|---|---|---|---|
| Model 1: radiomics-only features model | |||
| Random forest | 0.75 (0.75–0.82) | 0.57 | 0.75 |
| Gradient boosting | 0.68 (0.68–0.75) | 0.42 | 0.68 |
| XGBoost | 0.75 (0.75–0.82) | 0.62 | 0.75 |
| LightGBM | 0.69 (0.68–0.75) | 0.42 | 0.68 |
| CatBoost | 0.81 (0.81–0.87) | 0.69 | 0.81 |
| Model 2: deep learning-only features model | |||
| Random forest | 0.74 (0.74–0.80) | 0.52 | 0.63 |
| Gradient boosting | 0.78 (0.78–0.84) | 0.61 | 0.74 |
| XGBoost | 0.78 (0.78–0.84) | 0.58 | 0.74 |
| LightGBM | 0.81 (0.81–0.87) | 0.65 | 0.77 |
| CatBoost | 0.84 (0.84–0.89) | 0.71 | 0.79 |
| Model 3: radiomics + deep learning model | |||
| Random forest | 0.81 (0.81–0.86) | 0.76 | 0.71 |
| Gradient boosting | 0.84 (0.84–0.89) | 0.82 | 0.80 |
| XGBoost | 0.87 (0.87–0.91) | 0.84 | 0.83 |
| LightGBM | 0.83 (0.83–0.87) | 0.79 | 0.85 |
| CatBoost | 0.87 (0.86–0.92) | 0.84 | 0.85 |
| Model 4: radiomics + deep learning + clinical model | |||
| Random forest | 0.80 (0.80–0.84) | 0.64 | 0.73 |
| Gradient boosting | 0.83 (0.83–0.86) | 0.70 | 0.85 |
| XGBoost | 0.80 (0.80–0.84) | 0.66 | 0.83 |
| LightGBM | 0.81 (0.81–0.85) | 0.69 | 0.86 |
| CatBoost | 0.89 (0.88–0.92) | 0.78 | 0.87 |
| Model 5: Radiomics + deep roi + clinical model | |||
| Random forest | 0.88 (0.87–0.90) | 0.77 | 0.75 |
| Gradient boosting | 0.89 (0.88–0.91) | 0.80 | 0.88 |
| XGBoost | 0.89 (0.88–0.92) | 0.81 | 0.89 |
| LightGBM | 0.90 (0.89–0.92) | 0.80 | 0.90 |
| CatBoost | 0.90 (0.90–0.93) | 0.85 | 0.91 |
Fig. 1.
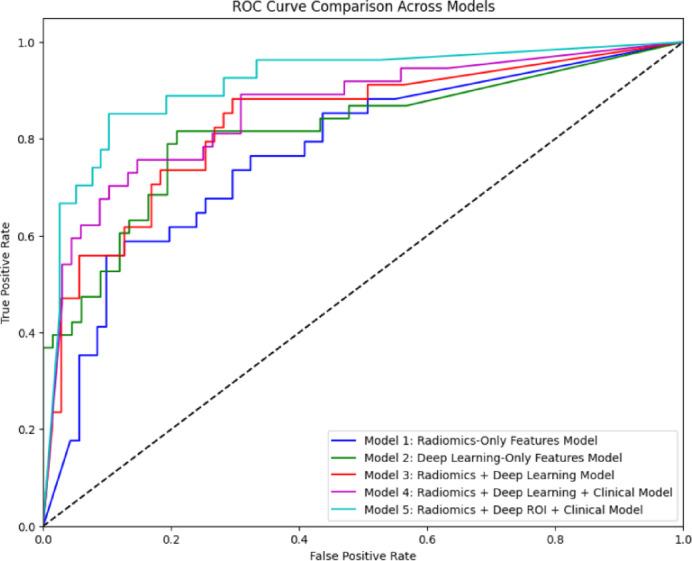
Comparison of ROC curve between models on chondroid tumor classification. The curve plots the true positive rate against the false positive rate across five models: Model 1 (Radiomics-Only, blue), Model 2 (Deep Learning-Only, green), Model 3 (Radiomics + Deep Learning, pink), Model 4 (Radiomics + Deep Learning + Clinical, red), and Model 5 (Radiomics + Deep ROI + Clinical, cyan). The dashed line illustrated the random classifier (AUC = 0.5). Model 5 shows the highest AUC, indicating the best classification performance, followed by Model 4, 3, 2, and 1.
Fig. 2.

Confusion Matrix of CatBoost classifier across different combined-features datasets. Each matrix represents performance across 5 models: (Top left) Model 1: Radiomics-Only, (Top right) Model 2: Deep Learning-Only, (Middle left) Model 3: Radiomics + Deep Learning, (Middle right) Model 4: Radiomics + Deep Learning + Clinical, (Bottom left) Model 5: Radiomics + Deep ROI + Clinical. These matrices plot a number of correct and incorrect samples in each class (Class 0: Enchondroma, Class 1: Grade 1 chondrosarcoma, and Class 2: Grade 2 & 3 chondrosarcoma). Darker cells along the diagonal indicate a larger number of correct classification counts, suggesting the enhanced performance of feature integration models, particularly Model 5.
Model 1: radiomics-only features model
This model achieved the highest performance with the CatBoost classifier, yielding an accuracy of 0.81 (95% CI 0.81–0.87), a weighted kappa of 0.69, and an AUC of 0.81. Despite demonstrating a moderate classification performance, this model highlights the limitation of relying solely on radiomics features. AUC shows some effectiveness in classification power. However, the overall performance indicates the need to integrate further features to enhance predictive ability.
Model 2 deep learning-only features model
This model showed slightly improved metrics, with the best performance again achieved by CatBoost, which produced an accuracy of 0.84 (95% CI 0.84–0.89), a weighted kappa of 0.71, and an AUC of 0.79. This performance illustrated the strengths of deep learning features, particularly in capturing complex patterns in images. The results reinforced that deep learning can outperform traditional methods when capturing intricate features.
Model 3: radiomics + deep learning model
This model demonstrated significant improvement, achieving the highest performance on the CatBoost classifier: an accuracy of 0.87 (95% CI 0.86–0.92), a weighted kappa of 0.84, and an AUC of 0.85. The significant increase in classification accuracy shows the advanced ability to leverage radiomics and deep learning features. A high score of weighted kappa indicated strong agreement between the model prediction and the ground truth, demonstrating the model’s stability in practical applications.
Model 4: radiomics + deep learning + clinical model
This model achieved the best scores with CatBoost again, attaining an accuracy of 0.89 (95% CI 0.88–0.92), weighted kappa of 0.78, and AUC of 0.87. The integration of clinical information into this model significantly enhances the classification abilities and underscores the importance of combining various data types to improve model performance. A high AUC score indicated the model’s effectiveness in distinguishing different chondroid tumor classes, demonstrating that clinical information can enhance model performance.
Model 5: radiomics + deep ROI + clinical model
This model achieved the highest overall classification performance among the other models and utilized the CatBoost model as the best classifier, with an accuracy of 0.90 (95% CI 0.90–0.93), a weighted kappa of 0.85, and an AUC of 0.91. This result highlights the effectiveness of integrating deep ROI features, allowing a focus on important tumor areas. The high AUC and accuracy suggest that this approach can enhance predictive performance and improve clinicians’ reliability in classifying chondroid tumors.
Discussion
In this study, we developed an automatic segmentation and classification model for chondroid bone tumors by integrating radiomics and DL-features. Chondroid tumors represent a heterogeneous group of neoplasms characterized by the production of a chondroid matrix, and classified as benign, intermediate, and malignant categories according to the 2020 WHO classification27. While histologic and cytogenetic criteria provide the foundation for this classification, conventional MRI findings—such as the extent of marrow replacement and cortical disruption—often overlap between adjacent tumor grades, making imaging differentiation challenging28,29.
Although advanced MRI techniques, such as DWI and dynamic contrast-enhanced MRI (DCE-MRI), have been introduced to provide quantitative parameters related to tumor cellularity and vascularity30. These modalities also exhibit considerable overlap in measured parameters among tumor grades, limiting their reliability for precise grading31.
These limitations underscore the need for alternative diagnostic strategies, such as radiomics and deep learning, which can capture subtle imaging patterns and integrate diverse information to enhance diagnostic accuracy. Moreover, adopting a streamlined approach that incorporates automatic tumor segmentation can enhance the consistency of feature extraction and increase clinical usability, further supporting the integration of these advanced methods into routine practice.
Our segmentation model demonstrated strong segmentation performance, achieving an average dice score of 0.849 and the highest dice score of 0.912 for chondroid tumor segmentation on MRIs. These results highlight the effectiveness of 3D U-Net architecture in accurately segmenting tumor regions in MRI scans. When compared to the previous studies, our results are on par with or exceed segmentation performance in related fields. While no prior research has specifically assessed chondroid bone tumor segmentation using MRI, related studies on other bone tumors provide a helpful context.
Ye et al.32 developed a multitask deep learning framework for detecting, segmenting, and classifying primary bone tumors and infections using multi-parametric MRI, reporting Dice scores of 0.75 ± 0.26 for T1-weighted imaging and 0.70 ± 0.33 for T2-weighted imaging on an external validation set. Although these scores are slightly lower than our results, their multi-center study demonstrates the broad applicability of MRI-based methods for bone tumors. Similarly, Wang et al.33 achieved Dice scores of 0.871 on a testing set and 0.815 on an independent validation set for both bone and soft tissue tumors using a deep learning model. Other imaging modalities generally show lower segmentation performance. PET-CT and CT-based methods reported lower Dice scores, reflecting the challenges of limited soft-tissue contrast34,35.Similarly, the work of Claudio E. von Schacky et al.36 focused on deep multitask learning for X-Ray images, and reported a dice score of 0.6 ± 0.370, emphasizing the limitations of 2D image-based methods. These results highlight the significance of our MRI-based segmentation approach, which uses high-contrast soft-tissue imaging and the advanced 3D U-Net architecture, thereby establishing a benchmark for automated chondroid tumor segmentation.
Our study demonstrates that a hybrid model integrating diverse data types—specifically radiomics features, deep learning features, and clinical parameters—can achieve superior classification performance compared to models relying on a single data source. The progressive improvements observed in accuracy, weighted kappa, and AUC across the models highlight the importance of combining complementary feature sets. Notably, Model 5, which incorporated radiomics features, deep learning features, and clinical parameters, demonstrated the highest performance with an accuracy of 0.9 (CI 95% 0.90–0.93), weighted kappa of 0.85, and AUC of 0.91. In comparison to previous studies, our approach offers several novel contributions. A previous study focused on bone chondrosarcoma classification using only MRI radiomics features reported an AUC of 0.85 for the training set and 0.78 for the testing set, which is lower than our results, possibly due to the absence of integrated deep learning and clinical information37 Another study using CT of chondroid bone tumors achieved an accuracy ranging from 0.75 to 0.81 and AUC between 0.78 and 0.89 for distinguishing atypical cartilaginous tumors and chondrosarcomas38 Similarly, radiographs-based models reported an accuracy from 0.79 to 0.83. However, direct comparison with CT- and radiograph approaches is difficult, as this model may primarily rely on calcification patterns and often lacks sufficient soft-tissue contrast39. Co-clinical radiomics studies, such as Roy et al.40, have explored the correlation between clinical and radiomics features, which strongly supports our hybrid approach. Our study advances the field by enabling automated classification based on segmentations, radiomics features, deep learning-derived features, and clinical variables, coupled with post-feature selection, to significantly improve classification performance compared to radiomics-only or deep-feature-only approaches reported in previous studies.
There are several limitations in our study. First, external validation was not feasible in this study due to the rarity of chondroid tumors. The consistent segmentation performance across cross-validation folds and the improved classification performance across multiple classifiers may suggest that our approach approximates reproducible results within the current dataset. However, its robustness and generalizability to broader populations cannot be guaranteed without external validation, preferably using multicenter datasets. Second, the relatively small sample size increases the risk of overfitting during the feature selection process. We applied LASSO regression nested within a fivefold cross-validation framework to select 15 radiomics features and 15 deep features, aiming to reduce overfitting. However, this approach does not fully eliminate the risk. Third, we used the 3D U-Net model for segmentation, without comparing alternative segmentation methods, which might offer complementary performance. However, our focus was to improve classification performance by combining sets of features. Fourth, we did not evaluate inter-rater agreements for segmentation. While intraclass correlation coefficient (ICC) is commonly employed to assess feature reproducibility across raters or repeated measures, in this study, our focus was on feature selection stability within a single ground-truth framework. Future studies incorporating multi-rater annotations or test–retest data could further explore ICC-based reproducibility assessments. Lastly, the class imbalance in our dataset reflects the natural prevalence of chondroid tumor subtypes, with benign tumors being significantly more common than intermediate- and high-grade tumors. To mitigate this, we applied SMOTE for data augmentation, which helped address the imbalance to some extent. However, this method may not fully resolve the challenges associated with underrepresented classes.
Further studies should focus on validating these models with larger datasets from multiple institutions to establish generalizability. In addition, the integration of other data modalities, like genomics or histopathological information, may provide a more comprehensive understanding of tumor characteristics, potentially leading to the development of more effective classification models and advancing personalized medicine approaches in bone oncology. In conclusion, our study demonstrates that integrating radiomics, deep learning, and clinical information has improved the classification performances of chondroid tumors. The improvement in performance metrics across the models highlights the potential of a multi-modal approach to enhance clinical diagnosis.
Method
This retrospective study was approved by the institutional review board (IRB of The Catholic University of Korea, Seoul St. Mary’s Hospital, approval number: KC21RASI0081). All procedures performed in this study were conducted in accordance with relevant guidelines and regulations, including the principles outlined in the Declaration of Helsinki. The IRB waived the requirement for informed consent due to the retrospective nature of the study.
Study population
In this study, we retrospectively collected data from patients who were consecutively diagnosed with primary chondroid tumors and underwent multi-sequence MRI preoperatively using Vida or Verio (Simens Healthcare, Erlangen, Germany) from November 2008 to December 2021. A total of 183 patients were initially collected.
After applying exclusion criteria, including small lesion size (< 1 cm, n = 20), motion artifacts (n = 9), incomplete sequences (n = 6), and previous biopsies or treatments (n = 3), 38 patients were excluded from the study. The final dataset comprised 147 patients with primary chondroid tumors, classified as follows: 118 enchondromas, 17 chondrosarcomas grade 1, and 12 chondrosarcomas grade 2 or 3 (Fig. 3). A sample of MRI sequences with corresponding segmentation can be found in Supplementary Fig. 1, the complete clinical characteristics are described in Supplementary Table 1.
Fig. 3.

Patient selection flowchart for chondroid tumor classification based on MRI sequences from 2008 to 2021.
3D U-Net segmentation
Lesion segmentation was performed using the open-source software ITK-SNAP (version 3.9.0, http://www.itksnap.org/). A musculoskeletal radiologist with 3 years of experience (H.P) performed the initial segmentation along the tumor borders on each sequence and subsequently validated by another musculoskeletal radiologist with 16 years of experience (J.Y.J). We utilized 3D U-Net to segment the suspicious lesions as the architecture has been proven to be a standard solution for medical image segmentation41 (Fig. 4). Roy et al.42 also demonstrated the ability of using computer-aided segmentation for T2-weighted MRI sequences, which supports the use of 3D U-Net approach. The U-Net architecture was deployed using the nnUNetv2 library43 with the configuration 3d_fullres to handle the high-resolution volumetric data. To cope with the shortage of medical data for segmentation, we applied structured pretrained and transfer learning for nnUNetv2. We fine-tuned a pretrained nnUNetv2 model using our chondroid tumor dataset, transferring the learned weights from a publicly available medical tumor segmentation dataset. Different sequences from the same patient were treated as individual data in order to train a unified model capable of segmenting tumors across various sequence types. To prevent data leakage, all MRI sequences from a single patient were assigned to the same fold during fivefold cross-validation, ensuring that no patient’s data appeared simultaneously in both the training and validation sets.
Fig. 4.

Illustration of 3D U-Net architecture for chondroid tumor segmentation. This model works on 3D image patches size of [64 × 64 × 64] with voxel spacing standardized to [2.0, 0.265, 0.265] mm. The five-stage decoder-encoder structure reduces the resolution to half in each encoder stage, starting with the input of (64 × 64 × 64), and then decreasing to (32 × 32 × 32), (16 × 16 × 16), (8 × 8 × 8), and finally (4 × 4 × 4). The decoder path restores the resolution by upsampling, reversing the process to the original dimension. The skip connections link each encoder layer to the corresponding decoder layer to retain spatial information.
Features extraction
Tumor delineation
We utilized multiple MRI sequences, which included T1-weighted, T2-weighted, gadolinium-enhanced fat-suppressed T1-weighted, and DWI with ADC. These image sequences were chosen to have comprehensive information on chondroid tumors across modalities, which enhances the classification outcomes. After a process of training and fine-tuning to automatically segment using 3D U-Net, the segmented regions of interest were then used as the primary input for the subsequent feature extraction phase.
Radiomics features ( )
)
Radiomics features extract diverse quantitative features representing tumor heterogeneity from the ROI.
 |
First-order statistics  collect intensity distribution metrics like mean
  , standard deviation
  , skewness
  , and kurtosis
  . Shape features
  describe geometry characteristics like volume
  and surface area of the tumor
  . Texture features
  , based on the Gray-Level Co-occurrence Matrix (GLCM), capture spatial patterns in voxel intensities. Wavelet features
  provide multi-resolution information and extract both the coarse and fine-grained tumor characteristics. Full list of radiomics features is provided in Supplementary Table 2.
Deep learning features ( )
)
DL features were extracted using Convolutional Neural Network (CNN) architecture44 which was trained on image patches of size 64 × 64 × 64 taken from original MRI scans. We separately extracted two types of deep learning features, one for the whole volume and one for the ROI region. The entire volume captures the global contextual patterns and relationships of the tumor with its surrounding areas, while the deep ROI features include fine-grained and detailed information about the tumor. The EfficientNet45 encoder consisted of multiple convolutional layers  , followed by activation and pooling layers. The activation layers introduce non-linearity and help the network to learn complex relationships. The pooling layers help to down-sample the feature maps and capture hierarchical representations within the image. Each CNN layer,
  , computes the feature map
  as:
as:
 |
where  represents the weight filters for layer
  ,
,  is the bias term, and
  is the activation function (e.g., ReLU). The final deep feature vector
  is obtained by flattening the last convolutional layer’s output:
 |
Deep ROI ( )
)
In this study, we extracted deep features from MRI images and the segmented tumor regions of interest (ROI). DL features extracted from ROI focus more on the tumor region and help to capture details and relevant information. This approach can enhance the classification performance since the network prioritizes features from the most important area. Both features were used to evaluate the impact of the whole image and ROI-based features on the model classification results.
 |
Clinical features ( )
)
Clinical features such as age, gender, tumor location, and other relevant parameters were incorporated to complement imaging features to evaluate their influence on the model’s performance in predicting outcomes. These included both categorical variables (e.g., gender, tumor location) and quantitative variables (e.g., age). However, we did not include MRI-derived quantitative biomarkers such as ADC, as these were already represented within the radiomics feature set.
 |
Data augmentation and feature selection
We used SMOTE46 for data augmentation and LASSO47 for the feature selection in our machine-learning pipeline. For data augmentation, we conducted experiments to compare class balancing techniques, including oversampling and weighted loss functions. The confusion matrix in Supplementary Figs. 4 and 6 illustrates the superior classification results of SMOTE over other methods. For feature selection, out of over 100 original features, LASSO reduced them to 15 radiomics (Supplementary Fig. 3) and 15 deep features, selecting 30 main features. The process of dimension reduction plays an important role in improving the accuracy of machine learning models by focusing on relevant features, thereby optimizing tumor classification for subsequent analysis.
Data augmentation
To address data class imbalance, the Synthetic Minority Oversampling Technique (SMOTE) was employed for data augmentation. SMOTE generates synthesis samples for minority class by interpolating between a minority sample  with its k-nearest neighbors called
  :
:
 |
In which,  is a random number. This method ensures the train samples are balanced and enhances the generalizability of the model. In this study, class 0 (Enchondroma) is the majority class with training 417 samples, class 1 (Grade 1 Chondrosarcoma) is the minority class with 58 training samples and class 2 (Grade 2 & 3 Chondrosarcoma) is a severely minority class with only 43 training samples. SMOTE selects a sample from a minority class, then finds its k-nearest neighbors and randomly selects a neighbor, interpolating this neighbor with the selected sample. This process iterates until the minority class meets the expected number of samples. Additionally, SMOTE parameters were fine-tuned to minimize the synthetic noise, ensuring alignment with the minority class. Supplementary Fig. 4 demonstrates the effect of SMOTE on classification outcomes with our dataset.
Feature selection
After augmenting data, feature selection was performed by using LASSO regression (Least Absolute Shrinkage and Selection Operator) to reduce dimensionality. LASSO was nested within each fold of the fivefold cross-validation to prevent bias. The algorithm optimized the selection of 15 radiomics and 15 deep features by minimizing the following objective function to remove unnecessary features:
 |
where:  is the observed value of
  sample;
  is
is  feature value of
  sample;
  is coefficient of
  feature;
  is total number of samples;
  is total number of features;
  term controls the strength of penalties.
The first term  is residual sum of squares, measuring how well the model fit into the data. The second term
  is
is  penalty, which help to shrink coefficient to zero. Selected radiomics features are listed in Table 4 with feature names and feature categories.
Table 4.
Selected features after apply LASSO method.
| Feature category | Feature name |
|---|---|
| Shape features | Original_shape_MinorAxisLength |
| Original_shape_LeastAxisLength | |
| Original_shape_MajorAxisLength | |
| Original_shape_Maximum3DDiameter | |
| First-order statistics | Diagnostics_Image-original_Mean |
| Original_firstorder_InterquartileRange | |
| Original_firstorder_90Percentile | |
| Original_firstorder_Maximum | |
| Original_firstorder_10Percentile | |
| GLCM features | Original_glcm_ClusterTendency |
| Original_glcm_Contrast | |
| GLSZM features | Original_glszm_GrayLevelNonUniformity |
| Original_glszm_GrayLevelVariance | |
| GLDM features | Original_gldm_GrayLevelVariance |
| Original_gldm_SmallDependenceHighGrayLevelEmphasis |
To understand the impact of different features on the classification performance of each model, we used built-in library of the CatBoost classifier. After training the model using the CatBoost classifier for the feature importance scores, these are normalized and adjusted to ensure comparability across feature sets. We summarize the important features across models and find that Deep ROI features have the most significant impact on classification outcomes, followed by Deep Learning features and Radiomics features. Clinical features have the lowest impact. Supplementary Fig. 5 demonstrates our findings.
Model classification and evaluation metrics
This section evaluates five models by combining features from radiomics, deep learning, and clinical information. Classification algorithms include Random Forest48, Gradient Boosting49, XGBoost50, LightGBM51, and CatBoost52. Each classifier has its strengths in handling complex data and reducing overfitting to find the best method for classification based on feature combination. The dataset is divided into 117 training cases (80%) and 30 testing cases (20%) using a stratified sampling technique to maintain a ratio of chondroid tumor classes (enchondroma, grade 1 chondrosarcoma, grade 2 & 3 chondrosarcoma).
Combining features
We build five different classification models by integrating radiomics features, deep features, and clinical features in various configurations:
- Model 1: Radiomics-Only features model (
 )
)
- Model 2: Deep Learning-Only features model (
 )
)
- Model 3: Radiomics + Deep Learning Model (
 )
)
- Model 4: Radiomics + Deep Learning + Clinical Model (
 )
)
- Model 5: Radiomics + Deep ROI + Clinical Model (
 )
)
Fitting and evaluation
Each classification model was trained by a fivefold cross-validation strategy to ensure generalizability and prevent overfitting. The dataset was randomly divided into 5 small subsets. In each iteration, 4 subsets were used for and the remaining subset as validation. We used grid search for hyperparameter optimization to maximize classification performance. To evaluate model performance, we employed accuracy, weighted kappa, and AUC. The combination of these metrics provides a comprehensive evaluation of the classification models, not only ensuring the overall correctness but also penalizing classification errors via weighted-kappa), and assessing the ability to discriminate tumor types through AUC. The results section presents the performance outcomes of our hybrid approach, including the segmentation performance achieved by the 3D U-Net model and the classification results obtained across the five machine learning classifiers. The overall classification pipeline is illustrated in Fig. 5.
Fig. 5.

Classification pipeline incorporating radiomics, deep learning, deep ROI, and clinical features to improve performance.
Electronic supplementary material
Below is the link to the electronic supplementary material.
Acknowledgements
This work was supported by the National Research Foundation of Korea (NRF) grant funded by the Korea government (MSIT) (2022R1A2C4002395).
Author contributions
Conceptualization, T.L.D. and J.Y.J.; Methodology, T.L.D. and J.Y.J.; Software, T.L.D and K.S.C.; Validation: J.Y.J and S.W.L.; Data Curation, S.G.L., H.P., S.W.L, H.C., and J.Y.J; Writing—Original Draft Preparation, T.L.D.; Writing—Review and Editing, J.Y.J; Supervision: J.Y.J., and S.W.L; Funding Acquisition, J.Y.J.
Data availability
Datasets collected and/or analyzed in this study are currently not publicly available due to patient confidentiality and institutional regulations, but are available from the corresponding authors upon reasonable request.
Code availability
This study utilizes several open-source libraries: nnU-Net (https://github.com/MIC-DKFZ/nnUNet) for segmentation and PyRadiomics (https://github.com/AIM-Harvard/pyradiomics) for feature extraction. Additionally, implementations of Random Forest, Gradient Boosting (https://github.com/scikit-learn/scikit-learn), XGBoost (https://github.com/dmlc/xgboost), LightGBM (https://github.com/microsoft/LightGBM), and CatBoost (https://github.com/catboost/catboost) were employed for classification. These publicly available libraries ensure reproducibility and facilitate further research.
Declarations
Competing interests
The authors declare no competing interests.
Footnotes
Publisher’s note
Springer Nature remains neutral with regard to jurisdictional claims in published maps and institutional affiliations.
References
- 1.Gómez-León, N. et al. Chondroid tumors: Review of salient imaging features and update on the WHO Classification. Curr. Probl. Diagn. Radiol.52(3), 197–211 (2023). [DOI] [PubMed] [Google Scholar]
- 2.Afonso, P. D., Isaac, A. & Villagrán, J. M. Chondroid tumors as incidental findings and differential diagnosis between enchondromas and low-grade chondrosarcomas. in Seminars in Musculoskeletal Radiology Vol. 23, No. 01 (Thieme Medical Publishers, 2019). [DOI] [PubMed]
- 3.Flemming, D. J. & Murphey, M. D. Enchondroma and chondrosarcoma. Semin. Musculoskelet. Radiol.4(1), 0059–0072 (2000). [DOI] [PubMed] [Google Scholar]
- 4.Rogers, W. et al. Radiomics: from qualitative to quantitative imaging. Br. J. Radiol.93(1108), 20190948 (2020). [DOI] [PMC free article] [PubMed] [Google Scholar]
- 5.Rogers, W. et al. Radiomics: Images are more than pictures, they are data. Radiology278(2), 563–577 (2016). [DOI] [PMC free article] [PubMed] [Google Scholar]
- 6.Kumar, V. et al. Radiomics: The process and the challenges. Magn. Reson. Imaging30(9), 1234–1248 (2012). [DOI] [PMC free article] [PubMed] [Google Scholar]
- 7.Brandenberger, D. & White, L. M. Radiomics in musculoskeletal tumors. Semin. Musculoskelet. Radiol.28(01), 049–061 (2024). [DOI] [PubMed] [Google Scholar]
- 8.Lambin, P. et al. Radiomics: The bridge between medical imaging and personalized medicine. Nat. Rev. Clin. Oncol.14(12), 749–762 (2017). [DOI] [PubMed] [Google Scholar]
- 9.Rizzo, S. et al. Radiomics: The facts and the challenges of image analysis. Eur. Radiol. Exp.2, 1–8 (2018). [DOI] [PMC free article] [PubMed] [Google Scholar]
- 10.Yip, S. S. & Aerts, H. J. Applications and limitations of radiomics. Phys. Med. Biol.61(13), R150 (2016). [DOI] [PMC free article] [PubMed] [Google Scholar]
- 11.Y. Y. B. a. G. H. LeCun, Deep learning. Nature521(7553):436–444 (2015). [DOI] [PubMed]
- 12.Shen, D., Wu, G. & Suk, H. I. Deep learning in medical image analysis. Annu. Rev. Biomed. Eng.19(1), 221–248 (2017). [DOI] [PMC free article] [PubMed] [Google Scholar]
- 13.Litjens, G. et al. A survey on deep learning in medical image analysis. Med. Image Anal.42, 60–68 (2017). [DOI] [PubMed] [Google Scholar]
- 14.He, Y. et al. Deep learning-based classification of primary bone tumors on radiographs: A preliminary study. EBioMedicine62, 103121 (2020). [DOI] [PMC free article] [PubMed] [Google Scholar]
- 15.Georgeanu, V. A., Mămuleanu, M., Ghiea, S. & Selișteanu, D. Malignant bone tumors diagnosis using magnetic resonance imaging based on deep learning algorithms. Medicina58(5), 636 (2022). [DOI] [PMC free article] [PubMed] [Google Scholar]
- 16.Ker, J., Wang, L., Rao, J. & Lim, T. Deep learning applications in medical image analysis. IEEE Access6, 9375–9389 (2017). [Google Scholar]
- 17.Cai, L., Gao, J. & Zhao, D. A review of the application of deep learning in medical image classification and segmentation. Ann. Translat. Med.8(11), 713 (2020). [DOI] [PMC free article] [PubMed] [Google Scholar]
- 18.Fritz, B., Paul, H. Y., Kijowski, R. & Fritz, J. Radiomics and deep learning for disease detection in musculoskeletal radiology: an overview of novel MRI-and CT-based approaches. Invest. Radiol.58, 3–13 (2023). [DOI] [PubMed] [Google Scholar]
- 19.Beuque, M. P. et al. Combining deep learning and handcrafted radiomics for classification of suspicious lesions on contrast-enhanced mammograms. Radiology307(5), e221843 (2023). [DOI] [PubMed] [Google Scholar]
- 20.Paul, R. et al. Predicting malignant nodules by fusing deep features with classical radiomics features. J. Med. Imaging5(1), 011021–011021 (2018). [DOI] [PMC free article] [PubMed] [Google Scholar]
- 21.A. e. a. Bizzego, Integrating deep and radiomics features in cancer bioimaging. in 2019 IEEE Conference on Computational Intelligence in Bioinformatics and Computational Biology 1–8.
- 22.Jeong, S. et al. Comparing deep learning and handcrafted radiomics to predict chemoradiotherapy response for locally advanced cervical cancer using pretreatment MRI. Sci. Rep.14(1), 1180 (2024). [DOI] [PMC free article] [PubMed] [Google Scholar]
- 23.Bijari, S. et al. Radiomics and deep features: Robust classification of brain hemorrhages and reproducibility analysis using a 3D autoencoder neural network. Bioengineering11(7), 643 (2024). [DOI] [PMC free article] [PubMed] [Google Scholar]
- 24.Mehta, K. et al. Lung nodule classification using biomarkers, volumetric radiomics, and 3D CNNs. J. Digit. Imaging34, 647–666 (2021). [DOI] [PMC free article] [PubMed] [Google Scholar]
- 25.Militello, C. et al. 3D DCE-MRI radiomic analysis for malignant lesion prediction in breast cancer patients. Acad. Radiol.29(6), 830–840 (2022). [DOI] [PubMed] [Google Scholar]
- 26.Guo, Y. et al. Histological subtypes classification of lung cancers on CT images using 3D deep learning and radiomics. Acad. Radiol.28(9), e258–e266 (2021). [DOI] [PubMed] [Google Scholar]
- 27.Choi, J. H. & Ro, J. Y. The 2020 WHO classification of tumors of bone: An updated review. Adv. Anat. Pathol.28(3), 119–138 (2021). [DOI] [PubMed] [Google Scholar]
- 28.Douis, H., Parry, M., Vaiyapuri, S. & Davies, A. M. What are the differentiating clinical and MRI-features of enchondromas from low-grade chondrosarcomas?. Eur. Radiol.28, 398–409 (2018). [DOI] [PubMed] [Google Scholar]
- 29.Yoo, H. J. et al. Differentiating high-grade from low-grade chondrosarcoma with MR imaging. Eur. Radiol.19, 3008–3014 (2009). [DOI] [PubMed] [Google Scholar]
- 30.De Coninck, T. et al. Dynamic contrast-enhanced MR imaging for differentiation between enchondroma and chondrosarcoma. Eur. Radiol.23, 3140–3152 (2013). [DOI] [PubMed] [Google Scholar]
- 31.Douis, H., Jeys, L., Grimer, R., Vaiyapuri, S. & Davies, A. M. Is there a role for diffusion-weighted MRI (DWI) in the diagnosis of central cartilage tumors?. Skeletal. Radiol.44, 963–969 (2015). [DOI] [PubMed] [Google Scholar]
- 32.Ye, Q. et al. Automatic detection, segmentation, and classification of primary bone tumors and bone infections using an ensemble multi-task deep learning framework on multi-parametric MRIs: A multi-center study. Eur. Radiol.34(7), 4287–4299 (2024). [DOI] [PubMed] [Google Scholar]
- 33.Wang, S. et al. Advancing musculoskeletal tumor diagnosis: Automated segmentation and predictive classification using deep learning and radiomics. Comput. Biol. Med.175, 108502 (2024). [DOI] [PubMed] [Google Scholar]
- 34.Diao, Z., Jiang, H., Han, X. H., Yao, Y. D. & Shi, T. EFNet: Evidence fusion network for tumor segmentation from PET-CT volumes. Phys. Med. Biol.66(20), 205005 (2021). [DOI] [PubMed] [Google Scholar]
- 35.Yildiz Potter, I. et al. Automated bone tumor segmentation and classification as benign or malignant using computed tomographic imaging. J. Digit. Imaging36(3), 869–878 (2023). [DOI] [PMC free article] [PubMed] [Google Scholar]
- 36.von Schacky, C. E. et al. Multitask deep learning for segmentation and classification of primary bone tumors on radiographs. Radiology301(2), 398–406 (2021). [DOI] [PubMed] [Google Scholar]
- 37.Gitto, S. et al. MRI radiomics-based machine-learning classification of bone chondrosarcoma. Eur. J. Radiol.128, 109043 (2020). [DOI] [PubMed] [Google Scholar]
- 38.Gitto, S. et al. CT radiomics-based machine learning classification of atypical cartilaginous tumours and appendicular chondrosarcomas. EBioMedicine68, 103407 (2021). [DOI] [PMC free article] [PubMed] [Google Scholar]
- 39.Gitto, S. et al. X-rays radiomics-based machine learning classification of atypical cartilaginous tumour and high-grade chondrosarcoma of long bones. EBioMedicine101, 105018 (2024). [DOI] [PMC free article] [PubMed] [Google Scholar]
- 40.Roy, S. et al. Optimal co-clinical radiomics: Sensitivity of radiomic features to tumour volume, image noise and resolution in co-clinical T1-weighted and T2-weighted magnetic resonance imaging. EBioMedicine59, 102963 (2020). [DOI] [PMC free article] [PubMed] [Google Scholar]
- 41.Ronneberger, O., Fischer, P., & Brox, T., U-net: Convolutional networks for biomedical image segmentation. in Medical Image Computing and Computer-Assisted Intervention–MICCAI 2015: 18th International Conference, Munich, Germany, October 5–9, 2015, Proceedings, Part III, vol. 18 (2015).
- 42.Roy, S., & Shoghi, K. I., Computer-aided tumor segmentation from T2-weighted MR images of patient-derived tumor xenografts. Image Analysis and Recognition: 16th International Conference, Waterloo, ON, Canada, August 27–29 (2019).
- 43.Isensee, F., Jaeger, P. F., Kohl, S. A., Petersen, J. & Maier-Hein, K. H. nnU-Net: a self-configuring method for deep learning-based biomedical image segmentation. Nat. Methods18(2), 203–211 (2021). [DOI] [PubMed] [Google Scholar]
- 44.Fukushima, K. Neocognitron: A self-organizing neural network model for a mechanism of pattern recognition unaffected by shift in position. Biol. Cybern.36(4), 193–202 (1980). [DOI] [PubMed] [Google Scholar]
- 45.Tan, M. & Le, Q. Efficientnet: Rethinking model scaling for convolutional neural networks. in International Conference on Machine Learning 6105–6114 (2019).
- 46.Chawla, N. V., Bowyer, K. W., Hall, L. O. & Kegelmeyer, W. P. SMOTE: Synthetic minority over-sampling technique. J. Artif. Intell. Res.16, 321–357 (2002). [Google Scholar]
- 47.Tibshirani, R. Regression shrinkage and selection via the lasso. J. R. Stat. Soc. Ser. B Stat Methodol.58(1), 267–288 (1996). [Google Scholar]
- 48.Breiman, L. Random forests. Mach. Learn.45, 5–32 (2001). [Google Scholar]
- 49.Friedman, J. H. Stochastic gradient boosting. Comput. Stat. Data Anal.38(4), 367–378 (2002). [Google Scholar]
- 50.Chen, T. & Guestrin, C. Xgboost: A scalable tree boosting system. In Proceedings of the 22nd acm Sigkdd International Conference on Knowledge Discovery and Data Mining 785–794 (2016).
- 51.Ke, G. et al. Lightgbm: A highly efficient gradient boosting decision tree. Adv. Neural. Inf. Process. Syst.30, 3149–3157 (2017). [Google Scholar]
- 52.Prokhorenkova, L., Gusev, G., Vorobev, A., Dorogush, A. V. & Gulin, A. CatBoost: unbiased boosting with categorical features. Adv. Neural. Inf. Process. Syst.31, 6639–6649 (2018). [Google Scholar]
Associated Data
This section collects any data citations, data availability statements, or supplementary materials included in this article.
Supplementary Materials
Data Availability Statement
Datasets collected and/or analyzed in this study are currently not publicly available due to patient confidentiality and institutional regulations, but are available from the corresponding authors upon reasonable request.
This study utilizes several open-source libraries: nnU-Net (https://github.com/MIC-DKFZ/nnUNet) for segmentation and PyRadiomics (https://github.com/AIM-Harvard/pyradiomics) for feature extraction. Additionally, implementations of Random Forest, Gradient Boosting (https://github.com/scikit-learn/scikit-learn), XGBoost (https://github.com/dmlc/xgboost), LightGBM (https://github.com/microsoft/LightGBM), and CatBoost (https://github.com/catboost/catboost) were employed for classification. These publicly available libraries ensure reproducibility and facilitate further research.