

Abstract
The objective cognitive status is incompletely known in Subjective Cognitive Impairment (SCI) and similar constructs. To characterize subspan and supraspan memory performance in groups with SCI, Mild Cognitive Impairment (MCI), and Cognitively Unimpaired individuals (CU) in relation to brain atrophy and CSF biomarkers. Performance on subspan (Digit Span Forward) and supraspan memory (trial 1 in the Rey Auditory Verbal Learning test) was investigated in patients diagnosed with SCI (n = 237) and MCI (n = 1038) from memory clinics in the Stockholm region and CU individuals from Stockholm university, Department of Psychology (n = 124). All participants had an extensive cognitive assessment. In addition, MCI and SCI patients had a comprehensive clinical examination, brain imaging scan (medial temporal lobe, cortical global atrophy, and white-matter-hyperintensities), and CSF biomarker analyses (Abeta, p-tau, and total-tau). Groups differed significantly in demographic characteristics, which were adjusted for in all analyses. The three groups differed significantly on supraspan, but not subspan, memory performance in line with the severity of cognitive impairment. The test-by-group interaction was also significant showing that SCI was characterized by selective supraspan impairment in conjunction with memory overload and in contrast to the previous conception of no objective impairment in SCI. CSF biomarkers and brain abnormality in MTA, GCA, and WMH did not provide additional predictive power over the diagnostic group on supraspan in SCI. Supraspan memory performance differed by diagnostic group in relation to the degree of cognitive impairment in memory clinic participants (CU > SCI > MCI) indicating objective memory impairment in SCI interpreted as due to supraspan overload.
Supplementary Information
The online version contains supplementary material available at 10.1038/s41598-025-07664-5.
Keywords: Subspan, Supraspan, Memory, Subjective cognitive impairment
Subject terms: Psychology, Diseases
Introduction
The construct of Subjective Cognitive Decline (SCD) describes individuals who report persistent subjective cognitive symptoms that have not existed previously and do not show any objectively measured cognitive impairment1–4. The prevalence of SCD in the aging population has been estimated to be a quarter of individuals over 60 years of age5. The most frequently reported symptom is the inception of memory complaints6. Findings show that SCD individuals are at a higher risk to develop future cognitive impairment e.g., Mild Cognitive Impairment (MCI) and dementia such as Alzheimer’s disease, compared to individuals with no cognitive complaints7–13. Further, abnormalities in SCD have been reported in white matter with brain imaging14–16, CSF biomarkers17,18, PET biomarkers8,19. In addition, low cognitive performance has been found in SCD, although within the normal range8,20 that were not identified in baseline examinations. In addition, affective symptoms such as depression and anxiety have been described in previous reviews of SCD9,21,22. In agreement with these findings, self-reported concern about cognitive change has been added to the revised criteria for SCD together with seeking medical help as a measure of coping2. Together, these findings indicate that SCD may represent a pathologic stage that occurs earlier than MCI but is not associated with any marked objective cognitive changes. In contrast, there are studies suggesting that the majority of SCD patients do not develop dementia or MCI over six years of follow-up making SCD a predominantly benign condition23.
Recent research has shown that at least some individuals diagnosed with SCD may have subtle cognitive impairments that could predict future progression to MCI years later7,24, although the type of cognitive dysfunction is unsettled. In one study, the total learning score (sum of correct responses over trials) was most associated with amnestic MCI, and the trial 1 score on the RAVL test25,26 was most associated with non-amnestic MCI, while predictive power was lacking in other cognitive functions (global cognition, language, visuospatial, short-term memory, and processing), when demographic characteristics were accounted for7. Another study24 showed that progression was predicted by age, memory, and processing speed. Furthermore, recently we showed that individuals diagnosed with subjective cognitive impairment (from now on, SCI is handled as comparable to SCD) performed significantly poorer than the cognitively unimpaired adults (CU) on trial 1 in the Rey Auditory Verbal Learning test (RAVL;27). It is well known that performance in tasks with a limited number of items (subspan) and tasks with an extended number of items (supraspan) are associated with different mental processes and different regional brain involvement28–30. Subspan performance involves apprehension, attention, temporary storage as well as manipulation of the temporarily stored information that is known to activate prefrontal regions and parietal cortex30–33. Supraspan performance involves processes of encoding/learning and activation of brain structures in the medial temporal lobe29,30,34.
Hypothetically, the difference in performance relates to difference in task demands in subspan and supraspan particularly due to the amount of information to process, i.e., limited in subspan (less than the capacity limit) and extended in supraspan (15 items). The number of items in the classical subspan task is known as the “Magical number” corresponding to 7 ± 2 items35, whereas the number of items in supraspan tasks exceeds the capacity of the subspan task. This difference between subspan and supraspan has been linked to the memory load concept29,36. In a study of memory overload using the n-back task (4 items vs. 2 items), results showed increased dorsolateral prefrontal cortex activity linked to overload and impaired memory performance, and increased amygdala activity as a possible emotional reaction following difficulties and failure due to the memory overload36,37.
The challenge remains to properly characterize the three groups (CU, SCI and MCI). Hypothetically, there is no marked cognitive or subjective impairment or change in CU (see38, while there are both subjective and observable cognitive changes in MCI39. The question is whether SCI should be understood solely as self-experienced cognitive impairment or more critically as affected by objective cognitive change as well?
The purpose of the present study was to investigate the interaction between performance in two memory tasks, subspan vs. supraspan, and three groups varying in degree of cognitive impairment (MCI, SCI, and CU). The subspan task was operationalized by the Digit Span Forward test (DSpF) and the supraspan task was operationalized by trial 1 in the RAVL test (t1 RAVL). Characterization of MCI and SCI groups was extended by using information from brain imaging and CSF biomarkers. Based on findings in previous studies7,24,27, the hypothesis was that there is a task-by-group interaction as shown by increasing group differences (MCI > SCI > CU) on the supraspan task in contrast to relatively similar performance across groups in the subspan test. Hypothetically, the difference between performance in the subspan and supraspan tasks could be supported by differences in brain atrophy (more prominent in supraspan than subspan), primarily in MTA31,34 as well as in CSF biomarkers (more prominent in supraspan than subspan). This hypothesis deviates from the common understanding that SCI and CU are cognitively comparable1,2,4.
Methods
Participants
Patients diagnosed with SCI (n = 237) and MCI (n = 1038) were recruited from the MemClin project collecting data from 9 of 10 memory clinics in the Stockholm metropolitan area40 between April 2016 and January 2021. The MemClin project has an unselected approach, and all patients referred to a neuropsychological examination were considered for participation. Completeness of collected data varied between sites, most likely because of variations in examination methods used on a patient-to-patient basis.
In addition, CU individuals (n = 124) were volunteers examined by students practicing psychological testing at the Department of Psychology, Stockholm University. They were not paid for participation but offered information about their results and an evaluation of their cognitive status. Among the original 146 volunteers, 11 were excluded due to two or more missing test results, and 11 were excluded due to two or more test results < −2 SD below the age-related mean. All participants were 65–90 years of age, fluent in Swedish, and evaluated as CU.
Clinical examination and diagnosis
Details of the clinical examination of patients have been described previously40. In brief, diagnosis was determined at each Memory clinic through a multidisciplinary consensus meeting based on all information from the clinical examinations. The SCI patients did not have any objectively verified cognitive impairment based on the clinical assessment in accordance with ICD-10 diagnostic criteria41, while the presence of symptoms was self-reported or reported by a close informant1,2,4,9. The MCI patients were diagnosed according to international consensus criteria39 including subjective symptoms as well as objective findings of cognitive decline that did not fulfill the criteria for dementia41.
The examination included structural brain imaging (derived from computer tomography and/or magnetic resonance imaging) of medial temporal atrophy (MTA;42), global cortical atrophy (GCA;43), and white matter hyperintensities (WMH;44).
CSF biomarkers were analysed with standard CSF Abeta-sensitive methods (ELISA, CLEIA, or ECLIA) that are highly concordant45. This result supports that the same cut-off values were used for all participants. The cut-off for Abeta abnormality in the present study was ≤ 550 ng/l. For p-tau and total-tau, the cut-off values of abnormality were p-tau ≥ 80 ng/l, and t-tau ≥ 400 ng/l40.
The volunteers from Stockholm University were evaluated as cognitively unimpaired (CU) according to a comprehensive examination including 10 tests from WAIS-IV46 and seven non-WAIS tests, the same tests as used in the MemClin examination (see the Supplement for a detailed description of test results (M ± SD) for the three groups).
Memory tests
Two specific memory tests were used to assess subspan memory (Digit Span Forward, DSpF;46) and supraspan memory (trial 1 in the Rey Auditory Verbal Learning test, RAVL;25,26). The items are presented orally by the test administrator and responses are delivered orally by the subject in both tests. However, there are important differences in the procedure in the subspan and supraspan tests. The subject should report items (digits) in the same order as they were presented in DSpF, while the items (words) should be reported in any order in RAVL trial 1. The number of correct responses was used as the outcome measure in both tests. The maximum number of items to be remembered in the subspan task is commonly nine or less in accordance with the capacity limit of short-term memory. Furthermore, the procedure of presentation differs considerably between tests. In the subspan task, there is a series of presentations starting with 3 digits, and if they are correct, the presentation continues with 4 digits, and so on until the subject fails in two subsequent trials with the same number of items. In contrast, the number of items to be remembered in the supraspan task is 15 and they are presented once, without any pretest exercise. In both tests, the instructions make it clear what kind of performance is required. Previous research has demonstrated that the use of digits vs words in the subspan has a minimal influence on the results47.
As previously mentioned, response items need to be delivered in correct order in DSpF but not in t1 RAVL. Despite this, the subject commonly starts reporting some of the recently presented words (recency phenomenon), followed by some words that were first presented (primacy phenomena). These phenomena may indicate that recency represents a readout of acoustic short-term memory. Hypothetically, this same mental process (readout) is used during the DSpF testing. In contrast, primacy represents the binding of items to a timeline or sequence reflecting conscious efforts to encode the material. The two suggested mental processes illustrate hypothetical events that differentiate subspan and supraspan memory performance29,30.
Ethical approval
All patients had signed consent to use clinical data for research which was approved by the Regional Ethics Committee in Stockholm (Dnr 2016/29-31/1). A similar document for CU was approved by the Regional Ethics Committee in Stockholm (Dnr 2017/549-31/1). All collected data were handled according to the EU General Data Protective Regulation and applicable Swedish legislation to ensure patient security. The study was performed in agreement with the Declaration of Helsinki rules.
Statistical analyses
Calculations were carried out by using SPSS, version 28. One-way (diagnostic group) ANOVA was used to analyse group differences in demographics, global cognition (MMSE;48), and subspan and supraspan memory tests (see Tables 1 and 2 and Fig. 1) showing descriptive data, significance, and effect size (η2). A two-way repeated measures (tests) MANCOVA with the diagnostic group as independent variable and demographics as covariates were used to analyse the interaction between the tests (subspan and supraspan) vs group and brain abnormality (MTA, GCA, and WMH defined as absent/very mild, mild, and moderate/severe, separately for each brain measure, see Table 3 and Table 1 in the Supplement for statistical analyses. Post-hoc t-test were used to delineate the difference between groups and tests. The importance of CSF biomarkers (Abeta, p-tau and total-tau) was analysed separately for each biomarker using MANCOVA with tests as DV, diagnostic groups, and CSF abnormality in two categories (defined as abnormal or normal) as IVs and demographics as covariates, see Table 4 and Supplement Table 2.
Table 1.
Demographic (age, sex, and years of education) and background clinical characteristics (MMSE) in MCI, SCI, and CU groups and two-way (diagnostic group) Outcome of ANOVA’s on demographics (age, sex and education) and MMSE with p-values and effect size (η2) as well as post-hoc pair-wise differences in age, female frequency (%), years of education and MMSE.
| MCI | p | SCI | p | CU | p | η2 | |
|---|---|---|---|---|---|---|---|
| N (% females) | 1038 (53%) | ** | 237 (42%) | ns | 124 (40%) | < .001 | .010 |
| Age, y | 76.7 ± 6.4 | *** | 73.7 ± 7.8 | ** | 71.6 ± 5.4 | < .001 | .064 |
| Education, y | 13.2 ± 3.5 | ** | 13.9 ± 3.7 | ns | 14.2 ± 2.4 | < .001 | .010 |
| MMSE, score | 27.4 ± 2.0 | *** | 28.8 ± 1.6 | – | .714 |
* = p < .05, ** = p < .01, ***p = < .001, ns = not significant.
Table 2.
Test results in subspan (Digit Span Forward) and supraspan (RAVL trial 1) for MCI, SCI and CU groups with one-way (group) ANOVA statistics (p-value and effect size, η2) and covariates (age, sex and education) with p-values as well as p-value for test difference within each group.
| Test | MCI | SCI | CU | η2 | A | S | E | |||
|---|---|---|---|---|---|---|---|---|---|---|
| Raw score | n = 1022 | p | n = 230 | p | n = 124 | p | ||||
| DSpF | 5.74 ± 1.06 | ** | 6.04 ± 1.09 | ** | 6.40 ± 1.10 | < .001 | .028 | *** | *** | *** |
| p (test) | ** | ** | ns | |||||||
| RAVL t1 | 3.89 ± 1.64 ** | 5.58 ± .72 | ** | 6.39 ± 2.00 | < .001 | .197 | *** | *** | *** | |
A = Age, S = Sex, E = education.
* = p < .05, ** = p < .01, ***p < .001, ns = not significant.
Fig. 1.
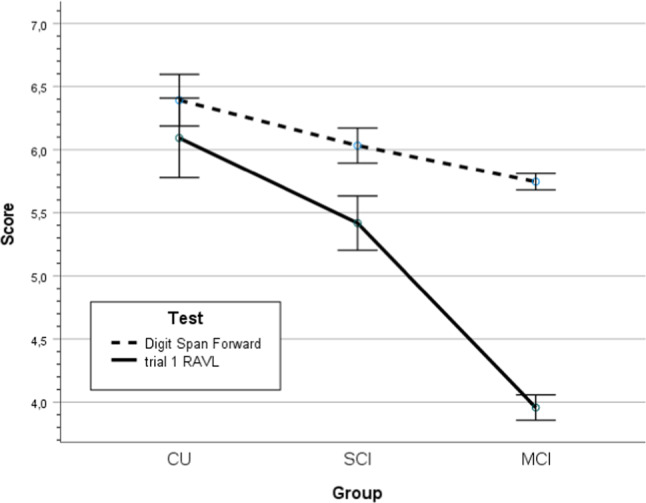
Score on tests of subspan (Digit Span Forward) and supraspan (RAVL trial 1) memory with 95% confidence interval for cognitively unimpaired individuals, subjective cognitive impairment and Mild Cognitive Impairment (CU, SCI, and MCI).
Table 4.
Frequency of CSF sampling in SCI and MCI patients (%) and frequency of abnormal (%) and normal CSF biomarkers (Abeta, p-tau, and total-tau).
| Measure | SCI n = 90 |
MCI n = 440 |
||
|---|---|---|---|---|
| Normal | Abnormal | Normal | Abnormal | |
| n, % | n, % | n, % | n, % | |
| Abeta | 78, 87% | 12, 13% | 301, 68% | 139, 32% |
| p-tau | 86, 96% | 4, 4% | 334, 76% | 105, 24% |
| Total-tau | 67, 74% | 23, 26% | 233, 53% | 206, 47% |
Results
The demographic characteristics (age, sex, and education) and global cognitive function as indicated by the MMSE48 for the three groups are presented in Table 1. The groups differed significantly in all demographic characteristics (age, sex distribution and years of education) and global cognitive function (MMSE). Post-hoc pairwise group differences (See Table 1) showed that MCI patients were significantly older than SCI and that SCI patients were significantly older than CU. Female frequency was significantly higher in MCI than SCI, but not significantly different in SCI vs. CU. Pairwise post-hoc group difference in education showed that SCI patients were significantly more educated than MCI, but not in CU vs. SCI.
Subspan and supraspan memory in MCI, SCI and CU
Subspan and supraspan test results for the three groups (MCI, SCI, and CU) are presented in Table 2. The main effects of group and demographic characteristics were significant as well (p’s < .001; group, age, sex and education, respectively). Correcting for demographic factors, there was a significant test-by-group interaction in line with the hypothesis (p < .001, η2 = .079), see Fig. 1. In addition, the test-by-age and test-by-sex interactions were significant (p’s < .001, η2 = .034, η2 = .024, respectively), but not test-by-education. The pairwise subgroup differences between MCI vs SCI and SCI vs CU were significant (p’s < .01, Cohen’s d > .280). The pairwise test difference between DSpF and RAVL t1 were not significant in CU (p > .1, d = 0.004), but significant in SCI (p < .001, d = .231) and MCI (p < .001, d = .1.006), see Table 2 and Fig. 1.
Brain atrophy in SCI and MCI
Brain atrophy was investigated in about 81% of all patients (both in SCI and MCI), see Table 3. The frequency of brain abnormality (binarized as 0 = absent or very mild vs 1 = all other categories) was significantly different between groups on MTA (p < .001, d = .512), GCA (p < .05, d = .289) and WMH (p < .001, d = .315)..
Table 3.
Frequency and percentage of brain abnormality in Medial Temporal Atrophy (MTA), Global Cortical Atrophy (GCA) and White Matter Hyperintensity (WMH) for SCI and MCI patients.
| Scale | MTA | GCA | WMH | |||
|---|---|---|---|---|---|---|
| SCI n, % |
MCI n, % |
SCI n, % |
MCI n, % |
SCI n, % |
MCI n, % |
|
| 0 and 0.5 | 62, 33% | 146, 17% | 46, 23% | 142, 17% | 77, 41% | 233, 28% |
| 1 and 1.5 | 90, 48% | 356, 42% | 124, 62% | 476, 56% | 69, 37% | 326, 39% |
| 2 and more | 38, 20% | 348, 41% | 30, 15% | 233, 27% | 42, 22% | 283, 34% |
| Σ | 190 | 850 | 200 | 851 | 188 | 842 |
Absent or very mild atrophy (0 and 0.5), mild (1 or 1.5) or marked/severe (2+).
The impact of group (SCI and MCI) and brain atrophy (MTA, GCA and WMH) on subspan and supraspan memory tests
The MANCOVA analyses on the test (subspan and supraspan) as repeated dependent variable and brain atrophy and group as independent variables showed that the effect of tests was significant (p < .05, η2 = .008), see Table 2 in the Supplement for details of the statistical analysis. The effect of diagnosis was significant (p < .001, η2 = .103), but not the effect of MTA abnormality. The test-by-group interaction was significant (p < .001, η2 = .043), but not the group-by-MTA abnormality, the test-by-MTA, and three-way interactions. The interactions for test-by-age and test-by-sex were significant (p’s < .001, η2 = .031, η2 = .027, respectively), but not the test-by-education. The main effects of age and sex were significant (p’s < .001, η2 = .015, η2 = .010, respectively), but not education.
The pattern of MANCOVA results with WMH abnormality was equivalent to the pattern of significance and non-significance results for MTA. The same outcome pattern was obtained for MANCOVA with GCA with one exception, the test-by-group interaction was significant (p < .001, η2 = .033).
In summary, the MANCOVA results on subspan and supraspan memory tests as dependent variables vs diagnostic group and brain atrophy (MTA, GCA and WMH) as IVs and demographics as covariates showed that brain atrophy MTA and WMH) did not add predictive power to the analyses of test performance over the diagnostic group, while GCA influenced test performance significantly (p < .05, η2 = .004). There was a general influence by age, sex, and years of education on test performance (p’s < .01, η2 = .015, η2 = .007, η2 = .030, respectively) as well as an interaction with age and sex on test performance (p’s < .001, η2 = .030, η2 = .026, respectively).
CSF biomarkers in SCI and MCI
The CSF biomarkers were divided into categories of normal or abnormal memory values using the clinical cut-off values, see the Method section. In total, CSF examination was performed in 42% of all patients (n = 530) and more frequently in SCI (55%) than in MCI (32%), see Table 4. The frequency of abnormal results was significantly different between diagnostic groups on all three biomarkers, clearly higher in MCI than in SCI for all three biomarkers (p’s < .001, x), see Table 3 in the Supplement. The highest frequency of abnormal CSF values was observed in total-tau (47%) for MCI) vs 26% for SCI. In Abeta, the abnormal values were found in 32% of MCI vs 13% in SCI and still lower abnormality frequencies were observed in p-tau, 24% for MCI compared to 4% in SCI.
The impact of group (SCI and MCI) and CSF biomarkers (Abeta, p-tau and total-tau) on subspan and supraspan memory tests
The possible influence of CSF biomarkers on the test-by-group interaction was investigated in the cohort, in which a CSF examination was performed, i.e., n = 530 of the original cohort of MCI and SCI patients (n = 1274). The two cohorts, with and without a CSF examination, were not comparable, because those with a CSF examination were significantly younger (p < .001, d = .26) and performed better in RAVL learning (p < .05, d = .14) than those without a CSF examination, while the proportion of SCI and MCI was not significantly different (p > 0.1).
CSF Abeta
To analyze the influence of diagnostic group (MCI and SCI) and Abeta pathology on memory load, a two-way MANCOVA with tests (DSpF and t1 RAVL) as repeated dependent variable and group and CSF Abeta abnormality (yes/no, defined by cut-off data, see the Method section) as independent variables and demographics as covariates (age, sex and education). For details of the statistical analysis, see Table 3 in the Supplement. The influence on tests was not significant. The effect of group was markedly significant (p < .001, η2 = .087), but not the influence of CSF Abeta abnormality. Among the six two-way interactions, four were significant: the test-by-group (p < .05, η2 = .050; see Fig. 2A), Abeta-by-group (p < .01, η2 = .011; see Fig. 2B) showing better test results in SCI with Abeta abnormality, test-by-age (p < .001, η2 = .031) and test-by-sex (p < .001, η2 = .027), but not the test-by-education and test-by-Abeta pathology, despite the visual impression, see Fig. 2C. In Fig. 2C, the two tests were collapsed. If tests are separated, the result showed that SCI and MCI patients performed similarly in DSpF and independent of Abeta level, but differently in the trial 1 RAVL test and better, when Abeta was abnormal compared to normal Abeta (see comment in the discussion). However, this three-way (test-by-group-by-Abeta pathology) was not significant.
Fig. 2.

(A) A line graph with 95% CI showing the significant diagnosis-by-CSF Abeta interaction across tests. (B) A line graph with 95% CI showing the significant diagnosis-by-test interaction across CSF Abeta abnormality. (C) A line graph with 95% CI showing the non-significant CSF Abeta-by-test interaction across diagnostic groups.
CSF p-tau
The pattern of significant results with MANCOVA using CSF p-tau pathology as biomarker together diagnostic group as independent variables and demographic covariates on the two memory tests as repeated dependent variable was the same as obtained with CSF Abeta. The only exception was a non-significant outcome for group-by-CSF p-tau interaction (p > .1) in contrast to the significant group-by-CSF Abeta interaction, see above.
CSF total-tau
The pattern of significant results with CSF total-tau pathology showed a pattern of results that was in correspondence with the results for CSF p-tau pathology.
In summary, the MANCOVA results on subspan and supraspan memory tests as dependent variables vs diagnostic group and CSF biomarkers (Abeta, p-tau and total-tau) as IVs and demographics as covariates showed that no single CSF biomarkers did add predictive power to the analyses of test performance over the diagnostic group, while the Abeta-by-group was significant. There was a general influence by age, sex, and years of education on test performance.
Discussion
The main finding
In keeping with the hypothesis, a significant group-by-test interaction was shown by a minor decrease across groups in subspan memory from CU to SCI to MCI and a major decrease across groups in supraspan memory from CU to SCI to MCI. Furthermore, the difference between subspan and supraspan memory was not significant in CU, but significant in SCI, and markedly significant in MCI. In contrast, the difference between groups on supraspan memory was significant in all three groups, largest in MCI weaker in SCI, and least in CU. This pattern of results supports the conclusion that there is a clear objective memory impairment in SCI in contrast to the current understanding that SCI and SCD do not present any cognitive decline1,2,4. The subspan vs supraspan difference has also been shown previously in AD47 and has been interpreted as caused by memory overload29. To our awareness, the supraspan memory impairment in SCI is a novel finding.
A possible explanation for the unexpected objective memory impairment is that SCI patients may be misdiagnosed and that they should be diagnosed as part of the MCI diagnosis as has been suggested previously7,8,49.
Another possible interpretation of objective memory impairment in SCI is to introduce two types of SCI, stable and declining20. It is possible to use brain imaging or CSF biomarker or cognitive methods to predict future dysfunction in SCI8,16,17,20,50.
A third interpretation is to relate the findings to variation in memory load, i.e., number of items that are presented in the two tests. Hypothetically, the low-load test (DSpF, subspan) involves at least two requires mental processes, attention and memory. The DSpF test is a manageable task, and the performance is successful until the individual reaches the short-term memory capacity limit35. This task relies on activation of brain regions particularly in the dorsolateral prefrontal cortex and bilateral inferior parietal lobule31,32,51. In addition, the performance in the DSpF test is to some degree related to attention and linked to alertness, orientation and control51,52, that is associated with brain activity in attentional brain networks51,52.
In contrast, the high-load test (t1 RAVL, supraspan) is not manageable, the individual will fail, because the number of items to report are too many. During the presentation of the 15 words, the time is limited for elaborating and learning the material. The activation of brain regions that are important for learning, the medial temporal region and particularly hippocampus29,30,34 fall short. The individual may be overwhelmed and experience emotional discomfort due to mastering difficulties. How the individual tolerates stress will be important for optimal performance. To speculate this factor explains that the result on supraspan is lower than the result on subspan in majority of SCI individuals.
Interestingly, a fMRI study on working memory overload in healthy young adults showed lower performance with n-back test (4 vs 2 items) in conjunction with brain activation in dorsolateral prefrontal cortex and amygdala activation in line with failure degree36. In this study, the participants were evaluated as healthy, and the activation of amygdala was a direct reaction to the difficulty in the n-back test. In previous research it has been shown that personality features of anxiety and stress susceptibility are more frequent in SCI compared to healthy controls53. Here it must be pointed out that there was no assessment of emotional reactions during testing or evaluation of the individual’s status in terms of anxiety or other psychic features. So, it is an open question whether the result on supraspan is direct a reaction to the test difficulty or if it represents a proneness in general to be tested.
Now, worries in general have been added to the revised criteria of SCD2,9,21,22,49. To speculate, a comparison of performance in tests varying in load may be a more sensitive method for detecting subtle cognitive impairment compared to using standard cognitive tests in clinical assessment54. Indeed, it is a general dilemma to differentiate normal functions and the first early changes in preclinical disease like SCI55,56.
The second finding
Brain atrophy did not add predictive power to the association between diagnostic group and memory test performance. This was unexpected because memory performance is typically associated with brain atrophy, particularly in MTA30,34. However, the influence of brain atrophy was probably discounted by using diagnostic group as the primary predictor. Furthermore, non-optimal conditions with reduced variation (low frequency of clear abnormal atrophy) or too large and unspecific brain regions may limit the sensitivity of brain imaging in the present study.
The third finding
The CSF pathology (Abeta, p-tau and total-tau) did not have a significant effect on memory test performance as a single factor independent of group. However, the interaction between tests and diagnostic group was significant showing relatively good performance for both groups on the subspan test and better performance in SCI in the supraspan test (see Fig. 2A). The group-by-Abeta abnormality interaction was significant (Fig. 2B). According to visual inspection, the MCI group performed poorly and independently of Abeta levels, while SCI patients performed better when they had abnormal Abeta (n = 12) compared to normal values (n = 78). However, this 3-way interaction was not significant. Presently, the favorable Abeta result on supraspan is considered a spurious result rather than reflecting a valid finding.
The clinical diagnosis tied to severity of disease was the main factor that influenced the memory test results, while there was no significant influence on the memory tests by CSF p-tau or total-tau. The main limiting factor for CSF biomarker influence was that less than half of the participants had an examination of SCF biomarkers. However, subgroups with vs without CSF data were comparable in comparable memory performance.
Strength and shortcomings
The relatively large sample size and the naturalistic character of the cohort recruited from memory clinics in the Stockholm metropolitan region represent favorable features of the study. However, the clinical diagnosis of patients may include several etiologies because there was a lack of extensive biological data to support the diagnostic specificity. In the same vein, there was a lack of longitudinal data to help diagnose patients as SCI and MCI. Further, it was a drawback that data were missing particularly for CSF biomarkers and to some extent for brain imaging. The clinical examination did not separate self- and informant-reports on symptoms. There was no assessment of possible emotional reactions in relation to the memory tests; furthermore, there was no assessment of neuropsychiatric proneness in participants. Therefore, the results of this study need to be replicated.
Implications
The present study was based on the idea that cognitive load in memory indicated by number of items was an important factor in contrast the standard test idea based on task difficulty (cf test design). Interestingly, the idea on load is used in the subspan task to examine the memory span. In a similar vein the number of items is an important factor for perception (cf. the concept subitizing) and practicing mental search (cf. xx). In this study, the idea of cognitive load had clinical implication for diagnosis of stages of cognitive impairment (CU vs SCD vs MCI). A second implication relates to the possible interaction between cognitive performance and the impact of emotional reactions that may disturb cognitive performance. This hypothesis has to be investigated in future research.
Conclusion
SCI was characterized by objective memory impairment in high-load supraspan memory test compared to CU individuals. This is a novel finding with possible clinical prospects. The effect was interpreted as selective emotional involvement due to memory overload in supraspan performance in SCI. In the low-load subspan memory test, the diagnostic groups performed equally. The main explanatory factor for memory performance was load-dependent and clinical group that included CSF abnormality (Abeta, p-tau and total-tau) and brain atrophy (MTA, GCA and WMH).
Electronic supplementary material
Below is the link to the electronic supplementary material.
Acknowledgements
The authors are grateful to all clinical psychologists, who have collected the data in the MemClin project, to all personal involved at the Memory clinics for making resources available and, to all patients and voluntary healthy adults, who participated in the project.
Author contributions
The CRediT taxonomy has been followed for authorship contributions. OA: conceptualization of the present study; formal analysis; writing the original draft; editing comments by co-authors. MG: review and editing of the draft. SN: review and editing of the draft. MLR: review and editing of the draft. EW: conceptualization of the MemClin project; funding acquisition. UE: conceptualization of the MemClin project and the present study; funding acquisition; study administration; supervision; review and editing of the draft. All authors accepted the final manuscript.
Funding
Open access funding provided by Karolinska Institute. This study was financially supported by the Swedish Research Council (VR), the Swedish Research Council for Health, Working Life and Welfare (FORTE), the Center for Innovative Medicine (CIMED), the Swedish Foundation for Strategic Research (SSF), the Strategic Research Programme in Neuroscience at Karolinska Institutet (StratNeuro), the Åke Wiberg foundation, Hjärnfonden, Alzheimerfonden, Demensfonden, Stiftelsen Olle Engkvist Byggmästare, and Birgitta och Sten Westerberg. The funding sources had no influence on the study design, data collection, analysis or interpretation, or the writing of the manuscript. Open access funding was provided by the Karolinska Institute.
Data availability
Data availability statement The data may be available upon reasonable request from Associate Professor Urban Ekman, urban.ekman@ki.se.
Declarations
Competing interests
The authors declare no competing interests.
Footnotes
Publisher’s note
Springer Nature remains neutral with regard to jurisdictional claims in published maps and institutional affiliations.
References
- 1.Jessen, F. et al. A conceptual framework for research on subjective cognitive decline in preclinical Alzheimer’s disease. Alzheimers Dementia.10, 844–852 (2014). [DOI] [PMC free article] [PubMed] [Google Scholar]
- 2.Jessen, F. et al. The characterization of subjective cognitive decline. Lancet Neurol.19, 271–278 (2020). [DOI] [PMC free article] [PubMed] [Google Scholar]
- 3.Molinuevo, J. L. et al. Subjective cognitive decline initiative (SCD-I) working group. Implementation of subjective cognitive decline criteria in research studies. Alzheimers Dement.13, 296–311 (2017). [DOI] [PMC free article] [PubMed] [Google Scholar]
- 4.Rabin, L. A., Smart, C. M. & Amariglio, R. E. Subjective cognitive decline in preclinical Alzheimer’s disease. Annu. Rev. Clin. Psychol.13, 369–396 (2017). [DOI] [PubMed] [Google Scholar]
- 5.Röhr, S. et al. For cohort studies of memory in an international consortium (COSMIC) Estimating prevalence of subjective cognitive decline in and across international cohort studies of aging: A COSMIC study. Alzheimers Res. Ther.12, 167 (2020). [DOI] [PMC free article] [PubMed] [Google Scholar]
- 6.Rabin, L. A. et al. Alzheimer’s disease neuroimaging initiative; Canadian longitudinal study on aging; health and aging brain study: Health disparities (HABS-HD) study team. Linking self-perceived cognitive functioning questionnaires using item response theory: The subjective cognitive decline initiative. Neuropsychology37, 463–499 (2023). [DOI] [PMC free article] [PubMed] [Google Scholar]
- 7.Jester, D. J. et al. Progression from subjective cognitive decline to mild cognitive impairment or dementia: The role of baseline cognitive performance. J. Alzheimers Dis.86, 1763–1774 (2022). [DOI] [PubMed] [Google Scholar]
- 8.Langhough Koscik, R. et al. Validity evidence for the research category, “Cognitively Unimpaired—Declining,” as a Risk marker for mild cognitive impairment and Alzheimer’s disease. Front. Aging Neurosci.13, 688478 (2021). [DOI] [PMC free article] [PubMed] [Google Scholar]
- 9.Pike, K. E., Cavuoto, M. G., Li, L., Wright, B. J. & Kinsella, G. J. Subjective cognitive decline: Level of risk for future dementia and mild cognitive impairment, a meta-analysis of longitudinal studies. Neuropsychol. Rev.32, 703–735 (2022). [DOI] [PubMed] [Google Scholar]
- 10.Pitti, H. et al. Cerebrovascular damage in subjective cognitive decline: A systematic review and meta-analysis. Ageing Res. Rev.82, 101757 (2022). [DOI] [PubMed] [Google Scholar]
- 11.Reisberg, B. et al. Psychometric cognitive decline precedes the advent of subjective cognitive decline in the evolution of Alzheimer’s disease. Dement. Geriatr. Cogn. Disord.49, 16–21 (2020). [DOI] [PMC free article] [PubMed] [Google Scholar]
- 12.Slot, R. E. R., Sikkes, S. A. M., Berkhof, J., Brodaty, H., Buckley, R., Cavedo, E. et al; Alzheimer’s Disease Neuroimaging Initiative; DESCRIPA working group; INSIGHT-preAD study group; SCD-I working group; van der Flier WM. Subjective cognitive decline and rates of incident Alzheimer’s disease and non-Alzheimer’s disease dementia. Alzheimers Dement. 15, 465–476 (2019). [DOI] [PMC free article] [PubMed]
- 13.Wang, X. T. et al. Association of subjective cognitive decline with risk of cognitive impairment and dementia: A systematic review and meta-analysis of prospective longitudinal studies. J. Prev. Alzheimers Dis.8, 277–285 (2021). [DOI] [PubMed] [Google Scholar]
- 14.Benedictus, M. R. et al. White matter hyperintensities relate to clinical progression in subjective cognitive decline. Stroke46, 2661–2664 (2015). [DOI] [PubMed] [Google Scholar]
- 15.Selnes, P. et al. Diffusion tensor imaging surpasses cerebrospinal fluid as predictor of cognitive decline and medial temporal lobe atrophy in subjective cognitive impairment and mild cognitive impairment. J. Alzheimers Dis.33, 723–736 (2013). [DOI] [PubMed] [Google Scholar]
- 16.Yue, L. et al. Prediction of 7-year’s conversion from subjective cognitive decline to mild cognitive impairment. Hum. Brain. Mapp.42, 192–203 (2021). [DOI] [PMC free article] [PubMed] [Google Scholar]
- 17.Scarth, M., Rissanen, I., Scholten, R. J. P. M. & Geerlings, M. I. Biomarkers of Alzheimer’s disease and cerebrovascular lesions and clinical progression in patients with subjective cognitive decline: A systematic review. J. Alzheimers Dis.83(3), 1089–1111 (2021). [DOI] [PubMed] [Google Scholar]
- 18.Wolfsgruber, S., Molinuevo, J. L., Wagner, M., Teunissen, C. E., Rami, L., Coll-Padrós, N.; Euro-SCD working group. Prevalence of abnormal Alzheimer’s disease biomarkers in patients with subjective cognitive decline: cross-sectional comparison of three European memory clinic samples. Alzheimer’s Res. Ther. 11, 8 (2019). [DOI] [PMC free article] [PubMed]
- 19.Pavisic, I. M. et al. Subjective cognitive complaints at age 70: Associations with amyloid and mental health. J. Neurol. Neurosurg Psychiatry.92, 1215–1221 (2021). [DOI] [PMC free article] [PubMed] [Google Scholar]
- 20.Stark, M. et al. Relevance of minor neuropsychological deficits in patients with subjective cognitive decline. Neurology101, e2185–e2196 (2023). [DOI] [PMC free article] [PubMed] [Google Scholar]
- 21.Munro, C. E. et al. Recent contributions to the field of subjective cognitive decline in aging: A literature review. Alzheimers Dement (Amst).15, e12475 (2023). [DOI] [PMC free article] [PubMed] [Google Scholar]
- 22.Desai, R. et al. Affective symptoms and risk of progression to mild cognitive impairment or dementia in subjective cognitive decline: A systematic review and meta-analysis. Ageing Res. Rev.71, 101419 (2021). [DOI] [PubMed] [Google Scholar]
- 23.Hessen, E. et al. Subjective cognitive impairment is a predominantly benign condition in memory clinic patients followed for 6 years: The Gothenburg-Oslo MCI study. Dement. Geriatr. Cogn. Dis. Extra.7, 1–14 (2017). [DOI] [PMC free article] [PubMed] [Google Scholar]
- 24.Perron, A. et al. In individuals with subjective cognitive decline, age, memory and speed scores at baseline predict progression to cognitive impairment. Alzheimer Dis. Assoc. Disord.36, 359–361 (2022). [DOI] [PubMed] [Google Scholar]
- 25.Lezak, M. D., Howieson, D. B. & Loring, D. W. Neuropsychological Assessment 4th edn. (Oxford University Press, 2004). [Google Scholar]
- 26.Schmidt, M. Rey Auditory Verbal Learning Test: A handbook. Western Psychological Services (1996).
- 27.Almkvist, O., Rennie, A., Westman, E., Wallert, J. & Ekman, U. Methods for assessment of Rey Auditory Verbal Learning test performance in memory clinic patients and healthy adults—At the cross-roads of learning theory and clinical utility. Clin. Neuropsychol.12, 1–15 (2024). [DOI] [PubMed] [Google Scholar]
- 28.Grasby, P. M. et al. Functional mapping of brain areas implicated in auditory–verbal memory function. Brain116, 1–20 (1993). [DOI] [PubMed] [Google Scholar]
- 29.Jeneson, A. & Squire, L. R. Working memory, long-term memory, and medial temporal lobe function. Learn Mem.19, 15–25 (2011). [DOI] [PMC free article] [PubMed] [Google Scholar]
- 30.Witt, J. A. et al. When does conscious memory become dependent on the hippocampus? The role of memory load and the differential relevance of left hippocampal integrity for short- and long-term aspects of verbal memory performance. Brain Struct. Funct.224, 1599–1607 (2019). [DOI] [PubMed] [Google Scholar]
- 31.Owen, A. M. The role of the lateral frontal cortex in mnemonic processing: The contribution of functional imaging. Exp. Brain Res.133, 33–43 (2000). [DOI] [PubMed] [Google Scholar]
- 32.Wager, T. D. & Smith, E. E. Neuroimaging studies of working memory: A meta-analysis. Cogn. Affect. Behav. Neurosci.3, 255–274 (2003). [DOI] [PubMed] [Google Scholar]
- 33.Wendelken, C., Bunge, S. A. & Carter, C. S. Maintaining structured information: An investigation into functions of parietal and lateral prefrontal cortices. Neuropsychologia46, 665–678 (2008). [DOI] [PubMed] [Google Scholar]
- 34.Putcha, D., Brickhouse, M., Wolk, D. A., Dickerson, B. C.; Alzheimer’s Disease Neuroimaging Initiative. Fractionating the Rey Auditory Verbal Learning Test: Distinct roles of large-scale cortical networks in prodromal Alzheimer’s disease. Neuropsychologia.129, 83–92 (2019). [DOI] [PMC free article] [PubMed]
- 35.Miller, G. A. The magical number seven, plus or minus two: Some limits on our capacity for processing information. Psychol. Rev.1956(101), 343–352 (1956). [DOI] [PubMed] [Google Scholar]
- 36.Yun, R. J., Krystal, J. H. & Mathalon, D. H. Working memory overload: Fronto-limbic interactions and effects on subsequent working memory function. Brain Imaging Behav.4, 96–108 (2010). [DOI] [PMC free article] [PubMed] [Google Scholar]
- 37.Moran, T. P. Anxiety and working memory capacity: A meta-analysis and narrative review. Psychol. Bull.142, 831–864 (2016). [DOI] [PubMed] [Google Scholar]
- 38.Breit, M., Scherrer, V., Tucker-Drob, E. M. & Preckel, F. The stability of cognitive abilities: A meta-analytic review of longitudinal studies. Psychol. Bull.150, 399–439 (2024). [DOI] [PMC free article] [PubMed] [Google Scholar]
- 39.Winblad, B. et al. Mild cognitive impairment-beyond controversies, towards a consensus: Report of the international working group on mild cognitive impairment. J. Int. Med.2004(256), 240–246 (2004). [DOI] [PubMed] [Google Scholar]
- 40.Ekman, U. et al. The MemClin project: A prospective multi memory clinics study targeting early stages of cognitive impairment. BMC Geriatr.20, 1–9 (2020). [DOI] [PMC free article] [PubMed] [Google Scholar]
- 41.World Health Organization. The ICD-10 classification of mental and behavioural disorders: Clinical descriptions and diagnostic guidelines (1992).
- 42.Scheltens, P. et al. Atrophy of medial temporal lobes on MRI in “probable” Alzheimer’s disease and normal ageing: Diagnostic value and neuropsychological correlates. J. Neurol. Neurosurg. Psychiatry.55, 967–972 (1992). [DOI] [PMC free article] [PubMed] [Google Scholar]
- 43.Scheltens, P., Pasquier, F., Weerts, J. G., Barkhof, F. & Leys, D. Qualitative assessment of cerebral atrophy on MRI: Inter- and intra-observer reproducibility in dementia and normal aging. Eur. Neurol.37, 95–99 (1997). [DOI] [PubMed] [Google Scholar]
- 44.Fazekas, F., Chawluk, J. B., Alavi, A., Hurtig, H. I. & Zimmerman, R. A. MR signal abnormalities at 1.5 T in Alzheimer’s dementia and normal aging. AJR Am. J. Roentgenol.149, 351–356 (1987). [DOI] [PubMed] [Google Scholar]
- 45.Dakterzada, F. et al. Assessment of the concordance and diagnostic accuracy between Elecsys and Lumipulse fully automated platforms and Innotest. Front. Aging Neurosci.13, 604119 (2021). [DOI] [PMC free article] [PubMed] [Google Scholar]
- 46.Wechsler, D. WAIS-IV Svensk Version [Swedish Version] (Publisher, 2010). [Google Scholar]
- 47.Cherry, B. J., Buckwalter, J. G. & Henderson, V. W. Better preservation of memory span relative to supraspan immediate recall in Alzheimer’s disease. Neuropsychologia2002(40), 846–852 (2023). [DOI] [PubMed] [Google Scholar]
- 48.Folstein, M. F., Folstein, S. E. & McHugh, P. R. “Mini-mental state”. A practical method for grading the cognitive state of patients for the clinician. J. Psychiatr. Res.12, 189–198 (1975). [DOI] [PubMed] [Google Scholar]
- 49.Burmester, B., Leathem, J. & Merrick, P. Subjective cognitive complaints and objective cognitive function in aging: A systematic review and meta-analysis of recent cross-sectional findings. Neuropsychol. Rev.26, 376–393 (2016). [DOI] [PubMed] [Google Scholar]
- 50.Gerton, B. K. et al. Shared and distinct neurophysiological components of the digits forward and backward tasks as revealed by functional neuroimaging. Neuropsychologia42, 1781–1787 (2004). [DOI] [PubMed] [Google Scholar]
- 51.Petersen, S. E. & Posner, M. I. The attention system of the human brain: 20 years after. Annu. Rev. Neurosci.35, 73–89 (2012). [DOI] [PMC free article] [PubMed] [Google Scholar]
- 52.Posner, M. I., Rothbart, M. K. & Voelker, P. Developing brain networks of attention. Curr. Opin. Pediatr.28, 720–724 (2016). [DOI] [PMC free article] [PubMed] [Google Scholar]
- 53.Ausén, B., Edman, G., Almkvist, O. & Bogdanovic, N. Self- and informant ratings of personality in mild cognitive impairment, reviewed. Dement. Geriatr. Cogn. Disord.32, 387–393 (2011). [DOI] [PubMed] [Google Scholar]
- 54.Grober, E. et al. Association of stages of objective memory impairment with incident symptomatic cognitive impairment in cognitively normal individuals. Neurology100(22), e2279–e2289 (2023). [DOI] [PMC free article] [PubMed] [Google Scholar]
- 55.Karanth, S. D. et al. Four common late-life cognitive trajectories patterns associate with replicable underlying neuropathologies. J. Alzheimers Dis.82, 647–659 (2021). [DOI] [PMC free article] [PubMed] [Google Scholar]
- 56.Tucker-Drob, E. M. Cognitive aging and dementia: A life span perspective. Annu. Rev. Dev. Psychol.1, 177–196 (2019). [DOI] [PMC free article] [PubMed] [Google Scholar]
Associated Data
This section collects any data citations, data availability statements, or supplementary materials included in this article.
Supplementary Materials
Data Availability Statement
Data availability statement The data may be available upon reasonable request from Associate Professor Urban Ekman, urban.ekman@ki.se.