

Abstract
Purpose
The purpose of this study was to explore the value of different skeletal muscles in assessing muscle mass in elderly chronic obstructive pulmonary disease (COPD) patients with sarcopenia.
Patients and methods
A cross-sectional analysis was conducted on a sample of elderly COPD patients with and without sarcopenia. Muscle mass measurements, including body mass index (BMI), weight, skeletal muscle index (SMI), 6-m walk test (6MWT), five-repetition sit-to-stand test (5STS), grip strength, calf circumference (CC), rectus abdominis thickness (RAT), rectus femoris cross-sectional area (RF-CSA), quadriceps femoris muscle thickness (QFMT), L1 muscle cross-sectional area (L1M CSA), and pectoralis muscle cross-sectional area (PM CSA). Statistical analyses were performed to assess the correlations between these muscle measurements and muscle mass, as well as the diagnostic value of low muscle mass (LMM) in elderly COPD patients.
Results
The results showed that there were significant differences in BMI, weight, SMI, gait speed, 5STS, grip strength, and CC between the LMM group and the normal muscle mass (NMM) group (P < 0.05). The ultrasound measurements showed that RAT, RF-CSA, and QFMT were significantly lower in the LMM group compared to the NMM group (P < 0.05). Similarly, the comparison of CT measurement parameters revealed that in the LMM group, both L1M CSA and PM CSA were significantly lower than those in the NMM group (P < 0.05). Correlation analysis revealed strong positive correlations between SMI and CC, L1M CSA, and RAT in the LMM group (p < 0.01), but no significant correlations were found with certain parameters. Receiver-operating characteristic curve analysis showed that the AUC values of PM CSA, QFMT, L1M CSA, RF-CSA and RAT in the diagnosis of LMM in elderly male COPD patients were 0.850, 0.830, 0.802, 0.722 and 0.684.
Conclusion
L1M CSA, RAT, RF-CSA, PM CSA, QFMT, and CC are positively correlated with muscle mass in elderly COPD patients with sarcopenia, and CC is a good screening index for predicting muscle mass. PM CSA and QFMT may be good indicators for the diagnosis of LMM in elderly male COPD patients with sarcopenia.
Keywords: Aging, COPD, Muscle mass, Diagnosis, Sarcopenia
Introduction
Chronic obstructive pulmonary disease (COPD) is a progressive and debilitating respiratory condition characterized by persistent airflow limitation. It is primarily caused by exposure to harmful particles or gases, most commonly from tobacco smoking [1]. COPD is a major global health concern, affecting millions of individuals worldwide and leading to significant morbidity and mortality [2, 3]. Sarcopenia, refers to a progressive loss of muscle mass, strength, and function associated with aging and/or diseases [4]. It is a multifactorial condition influenced by various factors, including hormonal changes, physical inactivity, poor nutrition, and chronic diseases [4]. Sarcopenia is gaining increasing recognition as an important comorbidity in patients with COPD [5, 6]. People with COPD appear to have an increased risk of developing sarcopenia, with prevalence estimates ranging from 15 to 55% [7]. In addition, sarcopenia has also been shown to result in a worse prognosis for COPD patients [6]. The relationship between COPD and sarcopenia is bidirectional, with each condition impacting the other. COPD leads to muscle wasting and weakness due to systemic inflammation, oxidative stress, physical inactivity, and malnutrition. On the other hand, sarcopenia further exacerbates the functional impairment and exercise intolerance seen in COPD patients [8]. This synergistic interaction between COPD and sarcopenia has significant implications for the overall health and prognosis of affected individuals, therefore, the whole family and the society.
Unfortunately, there is currently a lack of effective diagnostic methods for elderly COPD patients with sarcopenia [4, 9]. Although various methods have been proposed to assess muscle mass and function in this population, including dual-energy X-ray absorptiometry (DXA), bioelectrical impedance analysis (BIA), ultrasound and computed tomography (CT) [10]. However, there is no global agreement on diagnostic criteria for sarcopenia, both Asian and European working groups on sarcopenia recommend muscle mass as an important part of the diagnosis [11, 12]. Muscle mass in different parts of the body, including quadriceps femoris muscle thickness (QFMT), femoral muscle thickness (FMT), rectus abdominis thickness (RAT), diaphragm thickening fraction (DTF), pectoralis muscle cross-sectional area (PM CSA), and L1 muscle cross-sectional area (L1M CSA), is associated with the development of sarcopenia. Among the diagnostic tools, ultrasound is widely accepted for its universality, portability, and affordability. It is a valuable tool for assessing muscle mass and function in COPD patients in various clinical settings, including community healthcare [13, 14]. CT scanning, on the other hand, offers high resolution and excellent repeatability in distinguishing different types of tissues such as muscle, fat, and water [12, 14–16]. It is considered to be a good measure of muscle mass with good accuracy and precision. CT and ultrasound are fast, affordability, and noninvasive, they are becoming an extremely attractive diagnostic tools. Currently, there are few studies on diagnosing elderly COPD patients with sarcopenia by measuring muscle mass in different parts of the body with CT and ultrasound. Particularly in pectoralis muscle, quadriceps femoris muscle, L1 muscle rectus abdominis muscle, rectus femoris muscle. Compared with the previous diagnoses of sarcopenia, our team's research aims to explore a convenient and economical way to diagnose elderly COPD with sarcopenia.
Therefore, this study aims to explore the diagnostic value of measuring muscle mass at different sites in elderly COPD patients with sarcopenia. By evaluating the correlation between muscle measurements and sarcopenia in this specific population, we aim to contribute to the development of improved diagnostic strategies for managing sarcopenia in elderly COPD patients.
Material and methods
Study population
The study included a total of 54 patients who were recruited from the Pulmonary Function Laboratory and Respiratory Outpatient Department of the Sichuan Provincial People's Hospital, located in Sichuan Province, China. Data collection was conducted from September 2021 to January 2022. Collecting demographic data, including age, gender, height, occupation, and educational level (categorized into 5 levels: illiterate as level 0, elementary school as level 1, middle school as level 2, high school as level 3, and college or above as level 4). Ethical approval for this study was obtained from the Ethics Committee of Sichuan Provincial People's Hospital, with approval number: Ethical Review (Research) 2021 No. 413-1. Detailed information regarding the experimental procedures and protocol was provided to each participant and their families. Informed consent forms were signed voluntarily by each participant, indicating their understanding and agreement to participate in the study.
Inclusion criteria
(1) Age between 60 and 90 years.
(2) Patients with stable COPD diagnosed according to the criteria outlined in the Global Initiative for Chronic Obstructive Pulmonary Disease (GOLD) 2021 guidelines [17]. Stable COPD refers to stable or mild symptoms such as cough, expectoration, and shortness of breath, and the condition basically returns to the state before acute exacerbation.
(3) Patients with available chest CT scan images and pulmonary function test results obtained within one month.
Exclusion criteria
(1) Individuals with confirmed diagnoses of other diseases or characteristic pathological or radiological features of airflow limitation, such as bronchial asthma, bronchiectasis, obstructive pneumonia, pleural effusion, airway foreign body, pulmonary tuberculosis, diffuse panbronchiolitis, restrictive ventilatory dysfunction, etc.
(2) Acute infection within the past 28 days.
(3) Coexistence of severe active lesions in the cardiovascular, cerebral, hepatic, renal, neuromuscular, and metabolic systems, or advanced stages of malignant tumors.
(4) Limited lower limb mobility, limb amputation, or individuals with prosthetic limbs.
(5) Presence of cardiac pacemaker, metallic nails, plates, or other metal objects in the body.
(6) Inability or unwillingness to cooperate, such as moderate or higher cognitive impairment, severe frailty CFS (Clinical Frailty Score) level 7 or above, a Morse Fall Scale score exceeding 45 points.
(7) Patients who are participating in pulmonary rehabilitation, patients who have participated in exercise in the past 6 months, or patients with exercise habits.
mMRC grading and CAT scoring
Based on whether the subjects with COPD in stable phase are using medication, they are categorized as medicated (yes) or nonmedicated (no). Other collected data include: time since COPD diagnosis (years), course of COPD (years), and frequency of acute exacerbations. Breathlessness measurement is assessed using the modified British Medical Research Council (mMRC), although the health status is measured using the COPD Assessment Test (CAT) [18]. All participants undergo questionnaire interpretation and measurements by the same respiratory physician.
(1) mMRC scoring It is divided into five levels ranging from 0 to 4, with higher levels indicating more severe breathlessness associated with COPD.
(2) CAT scoring The CAT score is completed by the participants themselves and consists of eight items: cough, sputum, chest tightness, breathlessness, activity limitation, confidence, sleep, and energy. Participants rate the extent of their own symptoms on a scale of 0 to 5, with a total score ranging from 0 to 40. Higher scores indicate poorer quality of life and more severe disease condition.
Measurement parameters for skeletal muscle
The CAMPY EH101 handheld electronic grip strength meter (CAMPY, China) was used to assess muscle strength through measurement of hand grip strength. Muscle function was evaluated through the 6-m walk test (6MWT) and the five-repetition sit-to-stand test (5STS) [15]. Through BIA with the Inbody 770 device (Inbody, South Korea), measurements of weight and appendicular skeletal muscle mass was taken to calculate the Appendicular skeletal muscle index (SMI). Muscle mass assessment in patients with sarcopenia can be completed through ultrasound examination [13, 19]. RAT, FMT, RF-CSA, QFMT, diaphragm thickness at functional residual capacity (TdiFRC), diaphragm thickness at total lung capacity (TdiTLC), diaphragm thickness at residual volume (TdiRV), and diaphragm excursion during quiet breathing (Dq-DE) were measured using the Samsung RS80A ultrasound machine (Samsung, South Korea). The DTF was calculated based on these parameters [19]. Patients were assessed for muscle mass through chest CT scan [20]. PM CSA and L1M CSA were measured using the Siemens Force CT scanner (Siemens, Germany). calf circumference (CC) of the patient was measured using an inelastic tape measure. In the above measurement methods, the patients'grip strength, 6MWT, 5STS, BIA, and ultrasound were measured on the same day under the condition of fasting, and CT was examined 2 weeks prior to that day.
Diagnostic criteria for sarcopenia
This study adopts the diagnostic criteria for sarcopenia according to AWGS 2019 [15]:
(1) Grip strength: < 28 kg for males, < 18 kg for females.
(2) Muscle function: gait speed < 1.0 m/s over 6 m, sit-to-stand time ≥ 12 s for 5 repetitions, or SPPB (Short Physical Performance Battery) score ≤ 9. Meeting any one of these criteria is sufficient.
(3) Skeletal muscle mass: Estimated using the reference index SMI: < 7.0 kg/m2 for males, < 5.4 kg/m2 for females using DXA or < 7.0 kg/m2 for males, < 5.7 kg/m2 for females using BIA.
Staging of sarcopenia: Meeting only criterion (1) or (2) indicates possible sarcopenia, meeting both criterion (1) and (3), or (2) and (3) indicates sarcopenia, and meeting all three criteria (1), (2), and (3) indicates severe sarcopenia. In this study, patients with SMI < 7.0 kg/m2 for males and SMI < 5.7 kg/m2 for females were defined as the low muscle mass (LMM) group, although those who did not meet these criteria were classified as the normal muscle mass (NMM) group.
Statistical analysis
The data were analyzed using IBM SPSS Statistics version 27.0 software (IBM Corporation, United States). Normally distributed continuous variables were reported as mean ± standard deviation, and between-group comparisons were conducted using independent samples t test. For non-normally distributed continuous or count variables, median with interquartile range were used, and between-group comparisons were performed using the Mann–Whitney U test. Parametric correlation analysis was conducted using Pearson's correlation method, while nonparametric correlation analysis was performed using Spearman's correlation method. Receiver-operating characteristic (ROC) curve analysis was employed to evaluate the diagnostic performance of muscle parameters for muscle mass. Statistical significance was set at p < 0.05.
Results
Characteristics of clinical demographic data
There were 54 COPD patients enrolled in this study. According to Table 1, we observed statistically significant differences in body mass index (BMI), weight, SMI, gait speed, 5STS, grip strength, and CC between the LMM and NMM groups (P < 0.05). However, there were no statistically significant differences between the NMM and LMM groups in terms of age, gender, height, educational level, course of COPD, PEF, FEV1%pred, FEV1/FVC (%), GOLD classification, ABCD grouping, CAT score, and mMRC score(P > 0.05).
Table 1.
Analysis of Clinical Characteristics Data between LMM and NMM Groups
| LMM group (n = 33) (61%) | NMM group (n = 21) (39%) | P | |
|---|---|---|---|
| Basic information | |||
| Age (years) | 66.0 (66.0,74.5) | 67.0 (66.0,71.5) | 0.285 |
| Gender (male/female) | 27/6 | 17/4 | 0.937 |
| Educational Level (0/1/2/3/4) | 0/12/9/6/6 | 2/6/5/4/4 | 0.826 |
| Weight (kg) | 51.14 ± 7.61 | 65.84 ± 9.02 | < 0.001*** |
| Height (cm) | 160.0(154.5,166.0) | 164.1(155.5,171.0) | 0.145 |
| BMI(kg/m2) | 20.0 (18.1,21.9) | 25.2 (23.6,26.7) | < 0.001*** |
| COPD Assessment | |||
| Time since COPD diagnosis (years) | 4.0(1.0,6.0) | 1.0 (1.0,3.0) | 0.091 |
| Course of COPD (years) | 10.0 (7.5,20.0) | 10.0 (5.0,12.5) | 0.163 |
| PEF(L/s) | 3.55 ± 1.69 | 4.48 ± 1.72 | 0.059 |
| FEV1% pred (%) | 65.70 (45.00,73.45) | 54.50 (38.55,65.85) | 0.325 |
| FEV1/FVC (%) | 52.14 ± 10.60 | 54.12 ± 9.28 | 0.484 |
| GOLD classification (1/2/3/4) | 5/8/14/6 | 0/9/9/3 | 0.932 |
| ABCD grouping (A/B/C/D) | 20/10/1/2 | 12/3/2/4 | 0.450 |
| CAT score | 12 (10,15) | 13 (9,15) | 0.993 |
| mMRC score (0/1/2/3/4) | 0/19/9/4/1 | 1/13/6/1/1 | 0.314 |
| Sarcopenia assessment | |||
| SMI(kg/m2) | 6.17 (5.59,6.50) | 7.34 (7.05,7.84) | < 0.001*** |
| Gait speed (m/s) | 0.98 (0.94,1.14) | 1.26 (1.10,1.34) | < 0.001*** |
| 5STS(seconds) | 10.78 ± 2.02 | 9.21 ± 1.37 | 0.003** |
| Grip strength (kg) | 25.89 ± 6.67 | 32.27 ± 7.07 | 0.001** |
| CC (cm) | 32.44 ± 1.86 | 37.21 ± 1.855 | < 0.001*** |
Statistically significant (**P < 0.01, ***P < 0.001)
BMI Body Mass Index, PEF peak expiratory flow, FEV1 forced expiratory volume in one second, FVC forced vital capacity, CAT score COPD Assessment Test score, mMRC score modified British Medical Research Council (mMRC) score, SMI appendicular skeletal muscle mass index, 5STS five-repetition sit-to-stand test, CC calf circumference
Comparison of diaphragm parameters
The TdiRV levels in the LMM group were significantly lower than those in the NMM group (P < 0.05) (Fig. 1). However, there were no significant differences between the LMM and NMM groups in terms of TdiFRC, TdiTLC, Dq-DE, and DTF (P > 0.05) (Fig. 1).
Fig. 1.
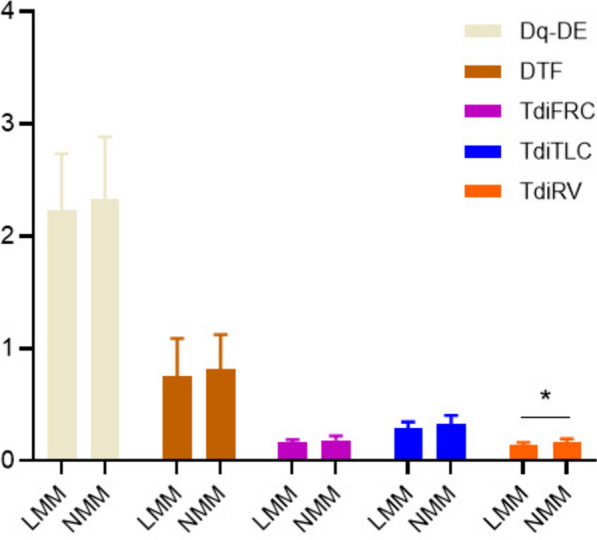
Comparison of diaphragm parameters between the LMM and NMM groups. statistically significant (*P < 0.05). LMM low muscle mass, NMM normal muscle mass, Dq-DE diaphragm excursion during quiet breathing, DTF diaphragm thickening fraction, TdiFRC diaphragm thickness functional residual capacity, TdiTLC diaphragm thickness at total lung capacity, TdiRV diaphragm thickness at residual volume
Peripheral muscle parameters analysis
Figure 2 presents ultrasound results of the peripheral muscles in the NMM and LMM groups. The results revealed that in the LMM group, RAT, RF-CSA, and QFMT were significantly lower compared to those in the NMM group (P < 0.05). However, there was no statistically significant difference in FMT between the LMM and NMM groups (P > 0.05).
Fig. 2.
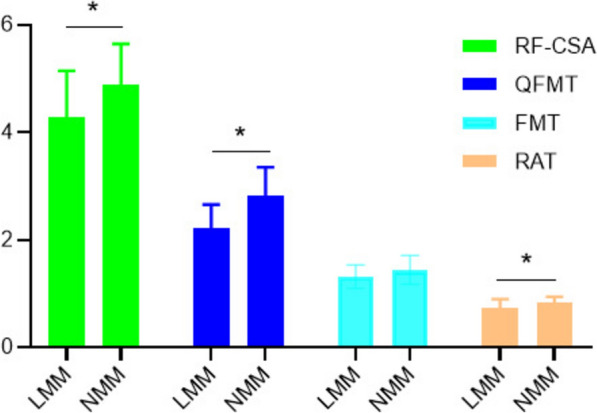
Comparison of peripheral muscle ultrasound parameters between the LMM and NMM groups. statistically significant (*P < 0.05). LMM low muscle mass, NMM normal muscle mass, RF-CSA rectus femoris cross-sectional area, QFMT quadriceps femoris muscle thickness, FMT femoral muscle thickness, RAT rectus abdominis thickness
Chest muscle parameters analysis
Based on the comparison of CT measurement parameters in Fig. 3 between the NMM and LMM groups, we found that in the LMM group, both L1M CSA and PM CSA were significantly lower than those in the NMM group (P < 0.05).
Fig. 3.
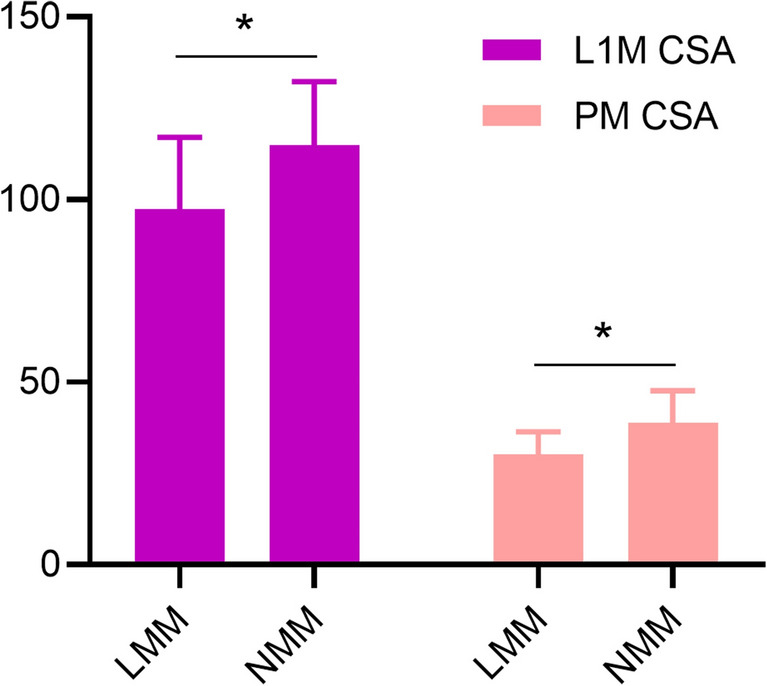
Analysis of muscle parameters measured by chest CT. statistically significant (*P < 0.05). LMM low muscle mass; NMM normal muscle mass, L1M CSA L1 muscle cross-sectional area, PM CSA pectoralis muscle cross-sectional area
Correlation between skeletal muscle parameters and SMI
In Table 2, we found that SMI was positively correlated with L1M CSA, RF-CSA, CC, PM CSA, RAT, and QFMT in both LMM and NMM group (P < 0.05). In the LMM group, SMI showed a strong correlation with CC, L1M CSA, and RAT, a moderate correlation with RF-CSA and PM CSA, and a weak correlation with QFMT. In the NMM group, SMI showed an extremely strong correlation with L1M CSA, a strong correlation with RF-CSA, and a moderate correlation with CC, PM CSA, RAT, and QFMT. There were no significant correlations observed between Dq-DE, TdiFRC, TdiTLC, TdiRV, DTF, and SMI (p > 0.05).
Table 2.
Correlation between skeletal muscle parameters and SMI
| Parameters | LMM group (n = 33) (61%) | NMM group (n = 21) (39%) |
|---|---|---|
| r | r | |
| DTF | − 0.091 | 0.242 |
| TdiTLC | 0.038 | 0.328 |
| TdiFRC | 0.222 | 0.141 |
| TdiRV | 0.189 | 0.229 |
| Dq-DE | − 0.026 | − 0.095 |
| CC | 0.727*** | 0.540* |
| QFMT | 0.372* | 0.546* |
| PM CSA | 0.438* | 0.579** |
| L1M CSA | 0.650*** | 0.832*** |
| RF-CSA | 0.597*** | 0.617** |
| RAT | 0.629*** | 0.492* |
Statistically significant (*P < 0.05, **P < 0.01, ***P < 0.001)
LMM low muscle mass, NMM normal muscle mass, DTF diaphragm thickening fraction, TdiTLC diaphragm thickness at total lung capacity, TdiFRC diaphragm thickness functional residual capacity, TdiRV diaphragm thickness at residual volume, Dq-DE diaphragm excursion during quiet breathing, CC calf circumference, QFMT quadriceps femoris muscle thickness, PM CSA pectoralis muscle cross-sectional area, L1M CSA L1 muscle cross-sectional area, RF-CSA rectus femoris cross-sectional area; RAT, rectus abdominis thickness
Diagnostic efficacy of muscle parameters in males for LMM
Figure 4 depicts the diagnostic performance of muscle parameters in elderly male COPD patients for LMM using ROC curve analysis. Unfortunately, only 10 women were included in this study, so women were excluded from the ROC curve analysis. The area under curve (AUC) values for PM CSA, QFMT, L1M CSA, RF-CSA, and RAT were 0.850, 0.830, 0.802, 0.722, and 0.684, respectively (P < 0.05). The corresponding sensitivities were 70.6%, 64.7%, 70.6%, 88.2%, and 58.8%, while the specificities were 88.9%, 96.3%, 85.2%, 51.9%, and 77.8% (Table 3), respectively. We further analyzed the cutoff values for CT and ultrasound measurements with better diagnostic performance, which were found to be 38.46 cm2 for PM CSA and 2.815 cm for QFMT.
Fig. 4.
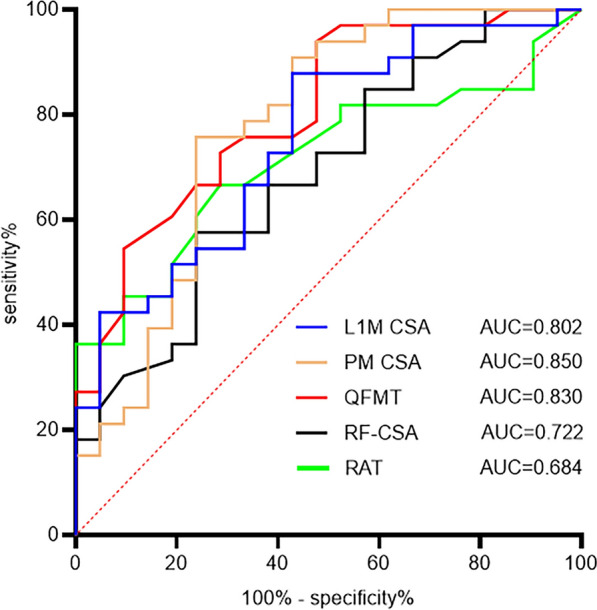
ROC curve analysis of muscle parameters for diagnosing LMM in male COPD patients. L1M CSA L1 muscle cross-sectional area, PM CSA pectoralis muscle cross-sectional area, QFMT quadriceps femoris muscle thickness, RF-CSA rectus femoris cross-sectional area, RAT rectus abdominis thickness, AUC area under curve
Table 3.
The ROC curve values of muscle parameters
| Parameters | AUC | Cutoff values | 95% CI | Sensitivity (%) | Specificity (%) | P |
|---|---|---|---|---|---|---|
| PM CSA | 0.850 | 38.46 | 0.723–0.976 | 70.6 | 88.9 | < 0.001*** |
| QFMT | 0.830 | 2.815 | 0.701–0.959 | 64.7 | 96.3 | < 0.001*** |
| L1M CSA | 0.802 | 118.03 | 0.670–0.934 | 70.6 | 85.2 | < 0.001*** |
| RF-CSA | 0.722 | 4.32 | 0.567–0.878 | 88.2 | 51.9 | 0.014* |
| RAT | 0.684 | 0.87 | 0.526–0.842 | 58.8 | 77.8 | 0.042* |
Statistically significant (*P < 0.05, ***P < 0.001)
L1M CSA L1 muscle cross-sectional area, PM CSA pectoralis muscle cross-sectional area, QFMT quadriceps femoris muscle thickness, RF-CSA rectus femoris cross-sectional area; RAT rectus abdominis thickness, AUC area under curve, CI confidence interval
Discussion
This study explored the value of different skeletal muscles in evaluating muscle mass in elderly COPD patients with with sarcopenia. Firstly, this study analyzed the clinical characteristics of patients in the LMM group and the NMM group. BMI and weight were significantly lower in the LMM group than in the NMM group. Previous studies have also shown that BMI and body weight are significantly reduced in COPD patients with sarcopenia, and lower BMI and body weight are independent risk factors for death in COPD patients [21]. Therefore, it is of great value to take screening and intervention measures for BMI and weight to reduce LMM in COPD patients.
In addition, we also found significant differences in gait speed, grip strength, 5STS, and CC between the two groups, which are better indicators for assessing muscle mass. This is also consistent with the assessment tool recommended by the working group on sarcopenia [12, 15].
The diaphragm is located between the chest and abdominal cavity. Reduced diaphragm movement or delayed diaphragm movement during deep breathing can reflect diaphragm function [22]. For COPD patients with sarcopenia, prolonged airflow limitation and excessive lung swelling can lead to changes in diaphragm morphology and function, which can be better evaluated by ultrasound measurement [23, 24]. We found that in elderly COPD patients, the TdiRV value of the LMM group was significantly lower than that of the NMM group, which was similar to the results of Yetkin's study [24]. However, when we analyzed the correlation between TdiRV and SMI, there was no correlation between them. TdiRV is not suitable as a predictor of muscle mass in elderly COPD patients with sarcopenia. Currently, there are few studies on the relationship between diaphragm and muscle mass, and more studies are needed to confirm its diagnostic value on muscle mass.
Inflammatory mediators and oxidative stress in COPD patients can affect the protein metabolism of peripheral muscles, resulting in increased muscle proteolysis and decreased synthesis of muscle protein [25]. Furthermore, ultrasound measurement of peripheral muscle has a high validity in the diagnosis of sarcopenia [13, 26]. In our study, it was found that RAT, RF-CSA, and QFMT were significantly lower in LMM group than in NMM group. They are also positively correlated with muscle mass and may be potential indicators for evaluating muscle mass in elderly COPD patients with sarcopenia. Similarly, Rustani et al. [27] also found that RF-CSA can be used as a good indicator for ultrasound measurement of muscle mass in sarcopenia. The overall skeletal muscle function and quality of COPD patients show a downward trend, especially in peripheral muscles [23]. QFMT and RAT are generally lower in patients with sarcopenia than in normal people, and they are indicators of better muscle mass, which is consistent with our study conclusions [28]. The reason for this is that COPD is a wasting disease. When there is malnutrition, it will seriously affect the synthesis and metabolism of the quadriceps femoris and rectus abdominis, resulting in their thickness being reduced [29, 30]. However, Jiraporn et al. [31] used ultrasound measurement of FMT in 857 sarcopenia patients and found that FMT is a good indicator of sarcopenia muscle mass, which is inconsistent with our results. The reason for this difference may be caused by the small sample size that we included.
CT scan can directly measure muscle area and thickness and is recommended as the gold standard for muscle mass assessment [15, 16]. Among the indicators measured by CT, L3 muscle cross-sectional area (L3M CSA) is its most commonly used [4, 32, 33]. However, COPD patients do not reach the level of L3 when they undergo chest CT scans. Fortunately, some studies have found that muscle mass at L1M CSA can be used as a surrogate for assessment at L3M CSA [34–36]. In our study, it was found that L1M CSA and PM CSA in the LMM group were significantly lower than those in the NMM group, and they were positively correlated with SMI. These results suggest that L1M CSA and PM CSA are potential Indicators for assessing muscle mass in elderly COPD patients with sarcopenia.
In addition, using ROC curve analysis, we found that in elderly male COPD patients, the sensitivity and specificity of CT-measured PM CSA for diagnosing LMM were 70.6% and 88.9%, and cutoff value was 38.46 cm2. Ultrasound-measured QFMT had a sensitivity of 64.7% and specificity of 96.3%, and cutoff value was 2.815 cm. PM CSA and QFMT may be an effective method for the diagnosis of LMM in elderly COPD patients with sarcopenia. CC is the most convenient and cost-effective method for assessing muscle mass. Kim et al. [37] conducted a study on 2,123 residents aged 70–84 and confirmed that CC is an effective screening indicator for sarcopenia. Our study also found a strong positive correlation between CC and SMI, suggesting that CC is a good screening indicator of muscle mass when other methods are not available.
This study has some limitations. First, the sample size in this study was small and only patients with COPD in the stable stage were included. Second, the sample size of female patients in this study was small, and no ROC curve analysis of elderly women COPD patients. Future research will work to address these limitations and provide more comprehensive insights.
Conclusion
L1M CSA, RAT, RF-CSA, PM CSA, QFMT, and CC are positively correlated with muscle mass in elderly COPD patients with sarcopenia, and CC is a good screening index for predicting muscle mass. PM CSA and QFMT may be good indicators for the diagnosis of LMM in elderly male COPD patients with sarcopenia.
Acknowledgements
Thanks to the Health Examination Department of Sichuan Provincial People’s Hospital for the equipment support.
Author contributions
Jing Huang and Fei Guo wrote the main manuscript text, Jierong Quan prepared Figs. 1, 2, 3, 4, Guanghong Zhou and Lu Yu did lung function tests, Jierong Quan did ultrasound tests, Qian Su did body composition analysis of the relevant checks. All authors reviewed the manuscript.
Funding
This project was supported by funding from Health Science Research Project of Sichuan Province (Chuan Gan Yan ZH2021-201).
Data availability
No datasets were generated or analysed during the current study.
Declarations
Ethics approval and consent to participate
The study was approved by the Ethics Committee of Sichuan Provincial People's Hospital. The study abides by principles in the Declaration of Helsinki for the use of human samples. Signed informed consent was obtained from all patients.
Competing interests
The authors declare no competing interests.
Footnotes
Publisher's Note
Springer Nature remains neutral with regard to jurisdictional claims in published maps and institutional affiliations.
Jing Huang, Jierong Quan and Fei Guo have authors contributed equally to this work.
References
- 1.Christenson SA, Smith BM, Bafadhel M, Putcha N. Chronic obstructive pulmonary disease. Lancet. 2022;399(10342):2227–42. [DOI] [PubMed] [Google Scholar]
- 2.Ho T, Cusack RP, Chaudhary N, Satia I, Kurmi OP. Under- and over-diagnosis of COPD: a global perspective. Breathe (Sheff). 2019;15(1):24–35. [DOI] [PMC free article] [PubMed] [Google Scholar]
- 3.Labaki WW, Rosenberg SR. Chronic obstructive pulmonary disease. Ann Intern Med. 2020;173(3):17–32. [DOI] [PubMed] [Google Scholar]
- 4.Cruz-Jentoft AJ, Sayer AA. Sarcopenia. Lancet. 2019;393(10191):2636–46. [DOI] [PubMed] [Google Scholar]
- 5.Kaluźniak-Szymanowska A, Krzymińska-Siemaszko R, Deskur-Śmielecka E, Lewandowicz M, Kaczmarek B, Wieczorowska-Tobis K. Malnutrition, sarcopenia, and malnutrition-sarcopenia syndrome in older adults with COPD. Nutrients. 2021;14(1):44. [DOI] [PMC free article] [PubMed] [Google Scholar]
- 6.Sepúlveda-Loyola W, Osadnik C, Phu S, Morita AA, Duque G, Probst VS. Diagnosis, prevalence, and clinical impact of sarcopenia in COPD: a systematic review and meta-analysis. J Cachexia Sarcopenia Muscle. 2020;11(5):1164–76. [DOI] [PMC free article] [PubMed] [Google Scholar]
- 7.Jones SE, Maddocks M, Kon SS, Canavan JL, Nolan CM, Clark AL, Polkey MI, Man WD. Sarcopenia in COPD: prevalence, clinical correlates and response to pulmonary rehabilitation. Thorax. 2015;70(3):213–8. [DOI] [PubMed] [Google Scholar]
- 8.Demircioğlu H, Cihan FG, Kutlu R, Yosunkaya Ş, Zamani A. Frequency of sarcopenia and associated outcomes in patients with chronic obstructive pulmonary disease. Turk J Med Sci. 2020;50(5):1270–9. [DOI] [PMC free article] [PubMed] [Google Scholar]
- 9.Goisser S, Kob R, Sieber CC, Bauer JM. Diagnosis and therapy of sarcopenia-an update. Internist (Berl). 2019;60(2):141–8. [DOI] [PubMed] [Google Scholar]
- 10.Ticinesi A, Meschi T, Narici MV, Lauretani F, Maggio M. Muscle ultrasound and sarcopenia in older individuals: a clinical perspective. J Am Med Dir Assoc. 2017;18(4):290–300. [DOI] [PubMed] [Google Scholar]
- 11.Chen LK, Liu LK, Woo J, Assantachai P, Auyeung TW, Bahyah KS, Chou MY, Chen LY, Hsu PS, Krairit O, et al. Sarcopenia in Asia: consensus report of the Asian working group for sarcopenia. J Am Med Dir Assoc. 2014;15(2):95–101. [DOI] [PubMed] [Google Scholar]
- 12.Cruz-Jentoft AJ, Bahat G, Bauer J, Boirie Y, Bruyère O, Cederholm T, Cooper C, Landi F, Rolland Y, Sayer AA, et al. Sarcopenia: revised European consensus on definition and diagnosis. Age Ageing. 2019;48(1):16–31. [DOI] [PMC free article] [PubMed] [Google Scholar]
- 13.Perkisas S, Bastijns S, Baudry S, Bauer J, Beaudart C, Beckwée D, Cruz-Jentoft A, Gasowski J, Hobbelen H, Jager-Wittenaar H, et al. Application of ultrasound for muscle assessment in sarcopenia: 2020 SARCUS update. Eur Geriatr Med. 2021;12(1):45–59. [DOI] [PubMed] [Google Scholar]
- 14.Albano D, Messina C, Vitale J, Sconfienza LM. Imaging of sarcopenia: old evidence and new insights. Eur Radiol. 2020;30(4):2199–208. [DOI] [PubMed] [Google Scholar]
- 15.Chen LK, Woo J, Assantachai P, Auyeung TW, Chou MY, Iijima K, Jang HC, Kang L, Kim M, Kim S, et al. Asian working group for sarcopenia: 2019 consensus update on sarcopenia diagnosis and treatment. J Am Med Dir Assoc. 2020;21(3):300-307.e302. [DOI] [PubMed] [Google Scholar]
- 16.Yuki A, Ando F, Shimokata H. Transdisciplinary approach for Sarcopenia. Sarcopenia: definition and the criteria for Asian elderly people. Clin Calcium. 2014;24(10):1441–8. [PubMed] [Google Scholar]
- 17.Halpin DMG, Criner GJ, Papi A, Singh D, Anzueto A, Martinez FJ, Agusti AA, Vogelmeier CF. Global Initiative for the diagnosis, management, and prevention of chronic obstructive lung disease. The 2020 GOLD science committee report on COVID-19 and chronic obstructive pulmonary disease. Am J Respir Crit Care Med. 2021;203(1):24–36. [DOI] [PMC free article] [PubMed] [Google Scholar]
- 18.Cheng SL, Lin CH, Wang CC, Chan MC, Hsu JY, Hang LW, Perng DW, Yu CJ, Wang HC. Comparison between COPD Assessment Test (CAT) and modified medical research council (mMRC) dyspnea scores for evaluation of clinical symptoms, comorbidities and medical resources utilization in COPD patients. J Formos Med Assoc. 2019;118(1 Pt 3):429–35. [DOI] [PubMed] [Google Scholar]
- 19.Santana PV, Cardenas LZ, Albuquerque ALP, Carvalho CRR, Caruso P. Diaphragmatic ultrasound: a review of its methodological aspects and clinical uses. J Bras Pneumol. 2020;46(6): e20200064. [DOI] [PMC free article] [PubMed] [Google Scholar]
- 20.Sanders KJC, Degens J, Dingemans AC, Schols A. Cross-sectional and longitudinal assessment of muscle from regular chest computed tomography scans: L1 and pectoralis muscle compared to L3 as reference in non-small cell lung cancer. Int J Chron Obstruct Pulmon Dis. 2019;14:781–9. [DOI] [PMC free article] [PubMed] [Google Scholar]
- 21.Wada H, Ikeda A, Maruyama K, Yamagishi K, Barnes PJ, Tanigawa T, Tamakoshi A, Iso H. Low BMI and weight loss aggravate COPD mortality in men, findings from a large prospective cohort: the JACC study. Sci Rep. 2021;11(1):1531. [DOI] [PMC free article] [PubMed] [Google Scholar]
- 22.Nason LK, Walker CM, McNeeley MF, Burivong W, Fligner CL, Godwin JD. Imaging of the diaphragm: anatomy and function. Radiographics. 2012;32(2):E51-70. [DOI] [PubMed] [Google Scholar]
- 23.Barreiro E, Gea J. Respiratory and limb muscle dysfunction in COPD. COPD. 2015;12(4):413–26. [DOI] [PubMed] [Google Scholar]
- 24.Yetkin NA, Akın S, Kocaslan D, Baran B, Rabahoglu B, Oymak FS, Tutar N, Gulmez İ. The role of diaphragmatic ultrasound in identifying sarcopenia in COPD patients: a cross-sectional study. Int J Chron Obstruct Pulmon Dis. 2025;20:1–9. [DOI] [PMC free article] [PubMed] [Google Scholar]
- 25.Ma K, Huang F, Qiao R, Miao L. Pathogenesis of sarcopenia in chronic obstructive pulmonary disease. Front Physiol. 2022;13: 850964. [DOI] [PMC free article] [PubMed] [Google Scholar]
- 26.Staempfli JS, Kistler-Fischbacher M, Gewiess J, Bastian JD, Eggimann AK. The validity of muscle ultrasound in the diagnostic workup of sarcopenia among older adults: a scoping review. Clin Interv Aging. 2024;19:993–1003. [DOI] [PMC free article] [PubMed] [Google Scholar]
- 27.Rustani K, Kundisova L, Capecchi PL, Nante N, Bicchi M. Ultrasound measurement of rectus femoris muscle thickness as a quick screening test for sarcopenia assessment. Arch Gerontol Geriatr. 2019;83:151–4. [DOI] [PubMed] [Google Scholar]
- 28.Fu H, Wang L, Zhang W, Lu J, Yang M. Diagnostic test accuracy of ultrasound for sarcopenia diagnosis: a systematic review and meta-analysis. J Cachexia Sarcopenia Muscle. 2023;14(1):57–70. [DOI] [PMC free article] [PubMed] [Google Scholar]
- 29.de Figueiredo RS, Nogueira RJN, Springer AMM, Melro EC, Campos NB, Batalha RE, Brandão MB, de Souza TH. Sarcopenia in critically ill children: a bedside assessment using point-of-care ultrasound and anthropometry. Clin Nutr. 2021;40(8):4871–7. [DOI] [PubMed] [Google Scholar]
- 30.Qaisar R, Ustrana S, Muhammad T, Shah I. Sarcopenia in pulmonary diseases is associated with elevated sarcoplasmic reticulum stress and myonuclear disorganization. Histochem Cell Biol. 2022;157(1):93–105. [DOI] [PubMed] [Google Scholar]
- 31.Sri-On J, Rueanthip S, Vanichkulbodee A, Paksopis T, Chetanasilpin C. The validity of ultrasonographic measurements of the rectus femoris muscle in older adults with sarcopenia in thai population. Clin Interv Aging. 2022;17:1249–59. [DOI] [PMC free article] [PubMed] [Google Scholar]
- 32.Amini B, Boyle SP, Boutin RD, Lenchik L. Approaches to assessment of muscle mass and myosteatosis on computed tomography: a systematic review. J Gerontol A Biol Sci Med Sci. 2019;74(10):1671–8. [DOI] [PMC free article] [PubMed] [Google Scholar]
- 33.Kim EH, Kim KW, Shin Y, Lee J, Ko Y, Kim YJ, Lee MJ, Bae SJ, Park SW, Choe J, et al. Reference data and T-scores of lumbar skeletal muscle area and its skeletal muscle indices measured by CT scan in a healthy Korean population. J Gerontol A Biol Sci Med Sci. 2021;76(2):265–71. [DOI] [PubMed] [Google Scholar]
- 34.McDonald ML, Diaz AA, Ross JC, San Jose Estepar R, Zhou L, Regan EA, Eckbo E, Muralidhar N, Come CE, Cho MH, et al. Quantitative computed tomography measures of pectoralis muscle area and disease severity in chronic obstructive pulmonary disease. A cross-sectional study. Ann Am Thorac Soc. 2014;11(3):326–34. [DOI] [PMC free article] [PubMed] [Google Scholar]
- 35.Derstine BA, Holcombe SA, Ross BE, Wang NC, Su GL, Wang SC. Skeletal muscle cutoff values for sarcopenia diagnosis using T10 to L5 measurements in a healthy US population. Sci Rep. 2018;8(1):11369. [DOI] [PMC free article] [PubMed] [Google Scholar]
- 36.Wang Y, Li S, Zhang Z, Sun S, Feng J, Chen J, Pei Y, Peng X. Accelerated loss of trunk muscle density and size at L1 vertebral level in male patients with COPD. Front Endocrinol. 2022;13:1087110. [DOI] [PMC free article] [PubMed] [Google Scholar]
- 37.Kim M, Won CW. Sarcopenia in Korean community-dwelling adults aged 70 years and older: application of screening and diagnostic tools from the Asian working group for sarcopenia 2019 update. J Am Med Dir Assoc. 2020;21(6):752–8. [DOI] [PubMed] [Google Scholar]
Associated Data
This section collects any data citations, data availability statements, or supplementary materials included in this article.
Data Availability Statement
No datasets were generated or analysed during the current study.