

ABSTRACT
We compared MIC test strips (MTS) with the reference Clinical and Laboratory Standards Institute (CLSI) broth microdilution method using an international panel of 100 Candidozyma auris (Candida auris) isolates belonging to different clades. The agreement (±1 twofold dilution) between the methods and the categorical agreement (CA) based on the Centers for Disease Control and Prevention’s (CDC’s) tentative resistance breakpoints and MTS-specific wild-type upper limit values (WT-ULVs) were determined. The MTS-CLSI agreement was poor to weak for posaconazole (3%), itraconazole (20%), voriconazole (31%), and 5-flucytosine (37%), and moderate to strong for isavuconazole (58%), anidulafungin (68%), caspofungin (72%), micafungin (77%), and amphotericin B (85%). Most fluconazole MICs were off-scale, precluding a corresponding estimation. Significant interpretation discrepancies were recorded using the CDC’s breakpoints for amphotericin B (66% CA, 34% major errors; MaEs), but not for fluconazole (98% CA, 1% MaEs, 1% very major errors; VmEs), anidulafungin (97% CA, 3% MaEs, 0% VmEs), micafungin (99% CA, 1% MaEs, 0% VmEs), and caspofungin (95% CA, 5% MaEs, 0% VmEs). Discrepancies were minimized using the amphotericin B method-specific WT-ULV of 4 mg/L (98% CA, 2% MaEs). The MTS-specific WT-ULVs of echinocandins could help to detect 100% of FKS1 mutants. MTS generated higher MICs than the CLSI for azoles and 5-flucytosine. MTS could accurately detect fluconazole and echinocandin resistance among C. auris isolates. Nevertheless, it overestimated amphotericin B resistance as per the CDC’s breakpoint of 2 mg/L. This can be improved by using the MTS-specific WT-ULV of 4 mg/L.
IMPORTANCE
Candidozyma auris (Candida auris) may exhibit resistance to multiple and sometimes even all currently available classes of antifungals. Hence, antifungal susceptibility testing (AFST) is of key importance to guide the clinician in therapeutic decision-making and to detect novel patterns of resistance. Gradient diffusion strips, referred to both Etest and MIC test strip (MTS), are broadly used in laboratory routine for AFST of yeasts. We therefore compared MTS with the reference Clinical and Laboratory Standards Institute (CLSI) broth microdilution method using an international panel of 100 C. auris isolates belonging to different clades. Significant interpretation discrepancies were recorded for amphotericin B (66% categorical agreement, 34% major errors), which could be minimized using the amphotericin B method-specific wild-type upper limit value of 4 mg/L. MTS generated higher MICs than the CLSI for azoles and 5-flucytosine. MTS could accurately detect fluconazole and echinocandin resistance.
KEYWORDS: Candida auris, MIC test strip, wild type upper limit values, antifungal susceptibility testing, resistance
INTRODUCTION
Candidozyma auris (Candida auris) is a rapidly emerging cause of life-threatening invasive infections and hospital outbreaks globally (1). Indeed, the World Health Organization classified it among the fungal pathogens that pose an urgent threat to public health (2), while both the Centers for Disease Control and Prevention (CDC) and the European Centre for Disease Prevention and Control reported its spread in healthcare settings at an alarming rate (3, 4). In contrast to other Candida spp., C. auris frequently exhibits resistance to multiple and sometimes even all currently available classes of antifungals (1, 5, 6), a feature especially disturbing, given the limited antifungal arsenal. Of note, several clinical cases in which antifungal resistance was acquired in vivo have been described, indicating the therapy-induced selection of mutant C. auris strains (7–10). Hence, antifungal susceptibility testing (AFST) is of key importance to guide the clinician in therapeutic decision-making and to detect novel patterns of resistance (11).
Gradient diffusion strips (GDS), referred to both Etest and MIC test strip (MTS) hereafter, contain a predefined, dried gradient of an antifungal drug and are broadly used in laboratory routine for AFST of yeasts. However, previous studies have demonstrated variable levels of agreement between the GDS technique and the reference broth microdilution (BMD) methodology depending on the Candida spp., antifungal agent, and incubation time (12). Currently, comparative evaluations of the GDS and BMD methods for C. auris AFST rely on testing isolates derived from restricted geographical areas and are characterized by clade-dependent results (13–17).
Notably, commercially available products for AFST do not always correlate with the standardized BMD method, leading to incorrect classifications when the breakpoints of the latter are applied. Given that the GDS MIC distributions may be different than the BMD MIC distributions, GDS-specific epidemiological cutoff values (ECVs) have been determined for different Candida spp. and antifungal drugs (18). To date, tentative fluconazole, amphotericin B, and echinocandin breakpoints for detecting resistance in C. auris with the Clinical and Laboratory Standards Institute (CLSI) protocol have been recommended by the CDC (19), whereas species-specific BMD ECVs have been proposed (20, 21). Moreover, C. auris-specific wild-type upper limit values (WT-ULVs) for Sensititre YeastOne and amphotericin B (22), as well as for Vitek 2 and most antifungal agents included in the AST-YS08 cards (23), have recently been estimated. Still, no GDS-specific interpretive criteria are available for C. auris versus any antifungal agent.
Based on these grounds, we assessed the MTS performance of C. auris AFST compared to the reference CLSI BMD method using an international collection of well-characterized isolates selected to cover various susceptibility phenotypes, aiming to evaluate the accuracy of MTS MICs in the global context and to determine method-specific WT-ULVs.
RESULTS
CLSI AFST
The CLSI MIC distributions of C. auris isolates by clade are depicted in Fig. 1, while the modal (range) CLSI MICs for each clade separately and all isolates are shown in Table 1. Narrow unimodal MIC distributions were observed for amphotericin B and 5-flucytosine (3–4 twofold dilutions), regardless of clade. All isolates were interpreted as amphotericin B-non-resistant, whereas the modal MIC of clade I strains was slightly higher than the modal MICs of strains from the other clades (1 versus 0.25–0.5 mg/L). Clade I and III isolates had a slightly lower 5-flucytosine modal MIC than the modal MIC of clade IV and V isolates (0.06 versus 0.125–0.25 mg/L).
Fig 1.
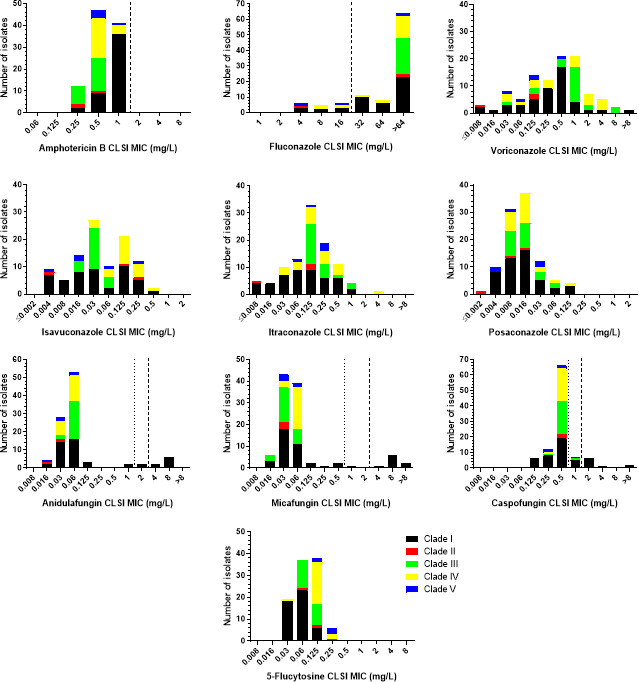
CLSI MIC distributions of C. auris isolates by clade. The broken and dotted lines indicate the CDC’s tentative resistance breakpoints and CLSI ECVs for C. auris (where available), respectively (19, 21).
TABLE 1.
Clade-specific CLSI and MTS MIC data for C. auris isolates obtained in the present studye
| Antifungal agent | Clade (No of isolates) |
Modal (range) MIC (mg/L)a | Median (range) difference CLSI-MTSb | % agreement | CDC BP (mg/L) | % CA (MaE, VmE) based on CDC BP | ||
|---|---|---|---|---|---|---|---|---|
| CLSI | MTS | ±1 | ±2 | R ≥ | ||||
| Amphotericin B | All (100) | 0.5 (0.25–1) | 1 (0.125–>32) | 1 (−2 to 6) | 85% | 96% | 2 | 66% (34%, 0%) |
| I (47) | 1 (0.25–1) | 2 (0.25–>32) | 1 (−1 to 6) | 83% | 91% | 2 | 32% (68%, 0%) | |
| II (3) | 0.25 (0.25–0.5) | 0.125 (0.125–0.5) | −1 (−2 to 1) | 67% | 100% | 2 | 100% (0%, 0%) | |
| III (23) | 0.5 (0.25–0.5) | 0.5 (0.5–1) | 1 (0 to 2) | 83% | 100% | 2 | 100% (0%, 0%) | |
| IV (22) | 0.5 (0.5–1) | 1 (0.5–2) | 1 (−1 to 2) | 95% | 100% | 2 | 96% (4%, 0%) | |
| V (5) | 0.5 (0.5–1) | 0.5 (0.5–2) | 0 (−1 to 2) | 80% | 100% | 2 | 80% (20%, 0%) | |
| 5-Flucytosine | All (100) | 0.125 (0.03–0.25) | 0.25 (0.03–4) | 2 (−2 to 6) | 37% | 69% | NA | ND |
| I (47) | 0.06 (0.03–0.125) | 0.25 (0.06–4) | 3 (1 to 6) | 9% | 43% | NA | ND | |
| II (3) | ΝDc (0.06–0.25) | 0.03 (0.03–0.25) | −1 (−2 to 0) | 67% | 100% | NA | ND | |
| III (23) | 0.06 (0.06–0.125) | 0.25 (0.03–2) | 1 (−1 to 5) | 57% | 91% | NA | ND | |
| IV (22) | 0.125 (0.03–0.25) | 0.25 (0.25–0.5) | 1 (0 to 4) | 64% | 95% | NA | ND | |
| V (5) | 0.25 (0.125–0.25) | 0.5 (0.25–1) | 1 (1 to 3) | 80% | 80% | NA | ND | |
| Anidulafungin | All (100) | 0.06 (0.016–8) | 0.06 (0.008–>32) | 1 (−4 to 6) | 68% | 79% | 4 | 97% (3%, 0%) |
| I (47) | 0.06 (0.016–8) | 0.06 (0.016–>32) | 1 (−4 to 6) | 47% | 62% | 4 | 94% (6%, 0%) | |
| II (3) | 0.03 (0.016–0.03) | 0.06 (0.008–0.06) | 1 (−2 to 2) | 33% | 100% | 4 | 100% (0%, 0%) | |
| III (23) | 0.06 (0.03–0.06) | 0.03 (0.016–0.125) | −1 (−2 to 1) | 96% | 100% | 4 | 100% (0%, 0%) | |
| IV (22) | 0.06 (0.03–0.06) | 0.06 (0.03–0.5) | 1 (−1 to 4) | 86% | 91% | 4 | 100% (0%, 0%) | |
| V (5) | 0.03/0.06 (0.016–0.06) | 0.03 (0.03–1) | 1 (0 to 5) | 80% | 80% | 4 | 100% (0%, 0%) | |
| Micafungin | All (100) | 0.03 (0.016–>8) | 0.06 (0.016–>32) | 1 (−3 to 7) | 77% | 91% | 4 | 99% (1%, 0%) |
| I (47) | 0.03 (0.016–>8) | 0.125 (0.016–>32) | 1 (−3 to 7) | 55% | 81% | 4 | 98% (2%, 0%) | |
| II (3) | 0.03 (0.03–0.03) | 0.03 (0.016–0.03) | 0 (−1 to 0) | 100% | 100% | 4 | 100% (0%, 0%) | |
| III (23) | 0.03 (0.03–0.06) | 0.06 (0.03–0.125) | 0 (−1 to 2) | 96% | 100% | 4 | 100% (0%, 0%) | |
| IV (22) | 0.06 (0.03–0.06) | 0.06 (0.06–0.125) | 0 (0 to 1) | 100% | 100% | 4 | 100% (0%, 0%) | |
| V (5) | 0.03 (0.03–0.06) | 0.06 (0.016–0.125) | 0 (−1 to 2) | 80% | 100% | 4 | 100% (0%, 0%) | |
| Caspofungin | All (100) | 0.5 (0.125–>8) | 0.25/0.5 (0.125–>32) | 0 (−2 to 6) | 72% | 85% | 2 | 95% (5%, 0%) |
| I (47) | 0.5 (0.125–>8) | 0.5 (0.125–>32) | 1 (−2 to 6) | 51% | 68% | 2 | 92% (8%, 0%) | |
| II (3) | 0.5 (0.5–0.5) | 0.25 (0.125–0.25) | −1 (−2 to −1) | 67% | 100% | 2 | 100% (0%, 0%) | |
| III (23) | 0.5 (0.25–1) | 0.25 (0.25–2) | −1 (−2 to 2) | 91% | 100% | 2 | 96% (4%, 0%) | |
| IV (22) | 0.5 (0.25–0.5) | 0.5 (0.25–1) | 0 (−1 to 2) | 95% | 100% | 2 | 100% (0%, 0%) | |
| V (5) | 0.25/0.5 (0.25–1) | 0.25 (0.25–0.25) | −1 (−2 to 0) | 80% | 100% | 2 | 100% (0%, 0%) | |
| Fluconazole | All (100) | >64 (4–>64) | >256 (1–>256) | NDd | NDd | NDd | 32 | 98% (1%, 1%) |
| I (47) | >64 (4–>64) | >256 (1–>256) | NDd | NDd | NDd | 32 | 100% (0%, 0%) | |
| II (3) | >64 (4–>64) | >256 (1–>256) | NDd | NDd | NDd | 32 | 100% (0%, 0%) | |
| III (23) | >64 (>64–>64) | >256 (>256–>256) | NDd | NDd | NDd | 32 | 100% (0%, 0%) | |
| IV (22) | >64 (8–>64) | >256 (8–>256) | NDd | NDd | NDd | 32 | 92% (4%, 4%) | |
| V (5) | 4/>64 (4–>64) | 1/>256 (1–>256) | NDd | NDd | NDd | 32 | 100% (0%, 0%) | |
| Voriconazole | All (100) | 0.5/1 (≤0.008–>8) | >32 (0.016–>32) | 2 (−2 to 9) | 31% | 52% | NA | ND |
| I (47) | 0.5 (≤0.008–>8) | 0.25 (0.03–>32) | 2 (−2 to 9) | 40% | 70% | NA | ND | |
| II (3) | 0.125 (≤0.008–0.125) | ΝDc (0.03–2) | 3 (2 to 4) | 0% | 33% | NA | ND | |
| III (23) | 1 (0.03–8) | >32 (0.5–>32) | 6 (−1 to 9) | 9% | 13% | NA | ND | |
| IV (22) | 1/2/4 (0.03–4) | >32 (0.06– 32) |
2 (−1 to 6) | 41% | 55% | NA | ND | |
| V (5) | 0.125 (0.03–0.125) | 0.016 (0.016–>32) | 2 (−2 to 9) | 20% | 60% | NA | ND | |
| Isavuconazole | All (100) | 0.03 (0.004–0.5) | 0.06 (0.004–2) | 1 (−5 to 6) | 58% | 82% | NA | ND |
| I (47) | 0.125 (0.004–0.5) | 0.016 (0.004–2) | 1 (−4 to 6) | 57% | 79% | NA | ND | |
| II (3) | ΝDc (0.004–0.25) | ΝDc (0.004–1) | 1 (0 to 2) | 67% | 100% | NA | ND | |
| III (23) | 0.03 (0.0160.06) | 0.06 (0.03–0.5) | 1 (0 to 3) | 61% | 91% | NA | ND | |
| IV (22) | 0.125 (0.03–0.5) | 0.5 (0.06–1) | 1 (0 to 3) | 59% | 86% | NA | ND | |
| V (5) | 0.016 (0.004–0.25) | 0.008/1 (0.008–1) | 1 (−5 to 6) | 40% | 40% | NA | ND | |
| Posaconazole | All (100) | 0.016 (≤0.002–0.125) | 0.125 (0.03–1) | 4 (1 to 7) | 3% | 21% | NA | ND |
| I (47) | 0.016 (0.004–0.125) | 0.06 (0.03–1) | 3 (1 to 7) | 6% | 32% | NA | ND | |
| II (3) | ΝDc (≤0.002–0.016) | ΝDc (0.03–1) | 5 (4 to 7) | 0% | 0% | NA | ND | |
| III (23) | 0.008/0.016 (0.008–0.06) | 0.25 (0.06–0.5) | 4 (2 to 5) | 0% | 9% | NA | ND | |
| IV (22) | 0.016 (0.008–0.125) | 0.25 (0.125–1) | 4 (2 to 6) | 0% | 14% | NA | ND | |
| V (5) | 0.004/0.03 (0.004–0.03) | 0.06 (0.06–1) | 4 (2 to 7) | 0% | 20% | NA | ND | |
| Itraconazole | All (100) | 0.125 (≤0.008–4) | 0.25 (0.06–8) | 2 (−2 to 8) | 20% | 52% | NA | ND |
| I (47) | 0.06/0.125 (≤0.008–1) | 0.25 (0.06–4) | 2 (−2 to 8) | 20% | 52% | NA | ND | |
| II (3) | 0.125 (≤0.008–0.125) | ΝDc (0.125–4) | 4 (4 to 5) | 0% | 0% | NA | ND | |
| III (23) | 0.125 (0.125–1) | 0.5 (0.25–2) | 2 (−2 to 3) | 26% | 74% | NA | ND | |
| IV (22) | 0.125 (0.03–4) | 1 (0.5–8) | 3 (−2 to 5) | 5% | 32% | NA | ND | |
| V (5) | 0.25 (0.06–0.25) | ΝDc (0.125–2) | 2 (−1 to 4) | 40% | 60% | NA | ND | |
For bimodal distributions, both modal MICs are presented.
Number of twofold dilutions.
Different MIC value for each isolate precluding the determination of the mode.
Most of the MIC values were off-scale (64/100 isolates with CLSI MIC >64 mg/L and 83/100 isolates with MTS MIC >256 mg/L), precluding the estimation of quantitative agreement.
BP: breakpoint, NA: not available, ND: not determined, R: resistant.
Overall, unimodal MIC distributions were found for echinocandins. Taking into account the different clades, clade I strains demonstrated wider distributions of MIC values compared to the MIC distributions of strains belonging to the other clades (4–5 versus 1–3 twofold dilutions of non-FKS1 mutants). All WT strains had anidulafungin, micafungin, and caspofungin MICs of 0.016–0.125, 0.016–0.25, and 0.125–1 mg/L, respectively. On the other hand, the FKS1 mutants (S639F/P/T/Y, M690V, and Δ635F) had anidulafungin, micafungin, and caspofungin MICs of 1 to 8 mg/L, 0.5 to >8 mg/L, and 1 to >8 mg/L, respectively (Table 2). FKS1 mutants with WT MICs were retested, and their MICs were within ±1 twofold dilution. All FKS1 mutant isolates displayed additional resistance to fluconazole (MICs >64 mg/L).
TABLE 2.
Echinocandins’ CLSI and MTS MIC data for the 13 C. auris FKS1 mutant isolates belonging to clade Ia
| IDb | FKS1 genotype | OD530nm at 24 h | Anidulafungin MIC (mg/L) | Micafungin MIC (mg/L) |
Caspofungin MIC (mg/L) |
|||
|---|---|---|---|---|---|---|---|---|
| CLSI | MTS | CLSI | MTS | CLSI | MTS | |||
| AMU129 | S639F | 0.1815 | 4 | >32 | 8 | >32 | 2 | >32 |
| AMU134 | S639F | 0.2359 | 8 | >32 | 8 | >32 | 2 | >32 |
| AMU135 | S639F | 0.1764 | 8 | >32 | 8 | 8 | 2 | >32 |
| AMU128 | S639P | 0.1808 | 1 | >32 | 8 | 8 | 2 | >32 |
| AUH 2689 | S639P | 0.2073 | 4 | >32 | 4 | >32 | 8 | >32 |
| AMU132 | S639P | 0.2213 | 8 | >32 | 8 | >32 | 4 | >32 |
| AMU111 | S639T | 0.1991 | 2 | >32 | 1 | 0.5 | 1 | >32 |
| AMU133 | S639Y | 0.2411 | 2 | >32 | 0.5 | >32 | 1 | >32 |
| AMU137 | M690V | 0.2167 | 8 | >32 | 8 | >32 | 2 | >32 |
| AMU130 | Δ635F | 0.2358 | 8 | >32 | >8 | >32 | >8 | >32 |
| AMU131 | Δ635F | 0.1853 | 8 | >32 | >8 | >32 | >8 | >32 |
| No of resistant isolates (%) (CDC BP) | 8 (73%) | 11 (100%) | 9 (82%) | 10 (91%) | 9 (82%) | 11 (100%) | ||
| No of non-WT isolates (%) (CLSI ECV) | 10 (91%) | 11 (100%) | 10 (91%) | 10 (91%) | 11 (100%) | 11 (100%) | ||
| No of non-WT isolates (%) (MTS WT-ULV) | ND | 11 (100%) | ND | 11 (100%) | ND | 11 (100%) | ||
Shaded cells indicate resistance based on the CDC’s breakpoints (BP) (anidulafungin/micafungin/caspofungin 4/4/2 mg/L) (19). Underlined numbers indicate wild-type (WT) phenotype based on the CLSI epidemiological cutoff values (ECV) (anidulafungin/micafungin/caspofungin 1/0.5/0.5 mg/L) (21). All isolates were non-WT based on the MTS wild-type upper limit value (WT-ULV) (anidulafungin/micafungin/caspofungin 0.25/0.25/2 mg/L) determined in the present study. ND: not determined.
AMU; Attikon Mycology Unit, AUH: Attikon University Hospital.
In total, the MIC distributions of azoles spanned ≥6 to ≥ 12 twofold dilutions (the exact number of dilution steps could not be determined because of off-scale MICs). In addition, more than one peak was observed for voriconazole and isavuconazole MIC distributions (4 and 2 peaks, respectively), as opposed to the unimodal itraconazole and posaconazole MIC distributions. However, clade-specific patterns were detected. In particular, multimodal MIC distributions were observed for voriconazole and clade IV strains, isavuconazole and clade I and II strains, itraconazole and clade I strains, and posaconazole and clade II, III, and V strains. The number of peaks could not be evaluated for fluconazole because of high off-scale MICs. All clade III isolates were fluconazole resistant (MIC >64 mg/L), while the fluconazole resistance rates of clade I, II, IV, and V strains were 83%, 67%, 77%, and 40%, respectively (overall 83%).
The absolute inter-observer agreement was excellent (96%), while the MIC values for the quality control strains were within the reference ranges.
MTS AFST
The MTS MIC distributions of C. auris isolates by clade are presented in Fig. 2, whereas the modal (range) MTS MICs for each clade separately and all isolates are shown in Table 1. The amphotericin B MIC distribution was unimodal, regardless of clade, although clade-specific patterns were found, with MIC ranges of clade I strains spanning ≥9 twofold dilutions (6 two-fold dilutions if the isolate with an MTS MIC >32 mg/L is excluded), as opposed to the narrow MIC ranges of strains from the other clades (2–3 twofold dilutions). Moreover, clade II isolates had lower MICs (modal MIC 0.25 mg/L) than clade I isolates (modal MIC 2 mg/L), and clade III, IV, and V strains had in-between MICs (modal MIC 0.5–1 mg/L). Hence, amphotericin B resistance rates varied from 0% for clade II and III isolates to 5%, 20%, and 68% for clade IV, V, and I isolates, respectively.
Fig 2.
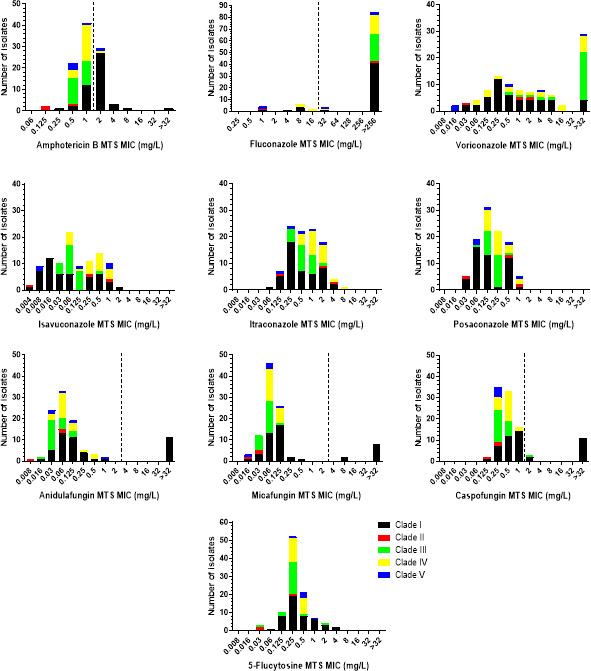
MTS MIC distributions of C. auris isolates by clade. The broken lines indicate the CDC’s tentative resistance breakpoints for C. auris (where available) (19).
With regards to 5-flucytosine, a unimodal MIC distribution was observed, regardless of clade, with clade I and III strains demonstrating wider distributions of MIC values compared to the MIC distributions of strains from the other clades (7 versus 2–4 twofold dilutions). In addition, clade II isolates had a lower modal MIC than the modal MIC of the other clades (0.03 versus 0.25–0.5 mg/L).
Concerning the echinocandins, the MIC distributions were unimodal, regardless of clade, with clade I strains showing wider distributions of MIC values compared to the MIC distributions of strains from the other clades (4–7 versus 1–4 twofold dilutions, excluding the FKS1 mutants). Clade I and IV isolates had a slightly higher anidulafungin and caspofungin modal MIC than the modal MIC of the other clades (0.06 versus 0.03 mg/L and 0.5–1 versus 0.25 mg/L, respectively), whereas the micafungin modal MIC of clade II strains was slightly lower than the modal MICs of strains from the other clades (0.03 versus 0.06–0.125 mg/L). All non-FKS1 mutants had anidulafungin, micafungin, and caspofungin MTS MICs 0.008–1, 0.016–0.25, and 0.125–2 mg/L, respectively. On the contrary, the FKS1 mutants had anidulafungin, micafungin, and caspofungin MICs of 1 to >32, 0.5 to >32 and >32 mg/L, respectively (Table 2). The FKS1 mutant with a WT micafungin MIC was retested, and its MIC remained unchanged. All FKS1 mutant isolates exhibited additional resistance to fluconazole (MICs >256 mg/L), while the majority (9/11) also demonstrated resistance to amphotericin B (MICs 2–4 mg/L).
Regarding the azoles, the MIC ranges of voriconazole, isavuconazole, itraconazole, and posaconazole were wide, spanning 6–≥13 twofold dilutions. Multimodal MIC distributions were found for all azoles except posaconazole, for which a unimodal MIC distribution was found. However, clade-specific differences were observed. Voriconazole MIC distributions of clade I, III, and V isolates were unimodal, with clade IV isolates having low MICs (modal MIC 0.016 mg/L), as opposed to clade I isolates (modal MIC 0.25 mg/L) and clade III isolates (modal MIC >32 mg/L). Similarly, the itraconazole MIC distributions of clade III and clade IV strains were unimodal, with clade IV strains having a one-step-higher modal MIC than the modal MIC of clade III strains (1 versus 0.5 mg/L). Isavuconazole MIC distributions of all but clade III isolates (modal MIC 0.06 mg/L), as well as posaconazole MIC distributions of clade I and clade II isolates, were multimodal. The number of peaks could not be evaluated for fluconazole because of high off-scale MICs. All clade III strains were fluconazole resistant (MIC >256 mg/L), while the resistance rates varied from 60% and 67% for clade V and II strains to 77% and 89% for clade IV and I strains, respectively (overall 83%).
The absolute/±1 log2 dilution inter-observer and inter-experimental method’s agreement was 51%/88% and 60%/100%, respectively, with the categorical agreement (CA) between both the blinded readers and the independent replicates being excellent (100%) for amphotericin B, fluconazole, and echinocandins. The MTS MIC values for the quality control isolates were within the expected ranges.
CLSI versus MTS methods and detection of resistance
Amphotericin B
The CLSI-MTS agreement within ±1 twofold dilution was strong (85%), with a median (range) difference of 1 (−2 to 6) twofold dilution. The 6 twofold differences between CLSI and MTS MICs were found only for one isolate (AUH 2751), which was reproducible in independent replicates. This isolate reached a lower OD530nm at 24 h compared to other isolates (Fig. 3). Differences for all other isolates ranged from −2 to 2 twofold dilutions. Excellent agreement was found within ±2 twofold dilutions (96%) (Table 1). Although the MIC values generated with these two methods were significantly different (P < 0.0001), they demonstrated significant but moderate correlation (Pearson r 0.52, P < 0.0001), indicating that the MTS MIC distribution is shifted by an average of one twofold dilution higher than the CLSI MIC distribution. Albeit all isolates were interpreted as non-resistant based on the CLSI MICs, 34/100 strains were classified as resistant based on MTS. The corresponding CA was 66% (Cohen’s kappa coefficient (κ) =0; no agreement) with 34% major errors (MaEs) (Table 1; Fig. 4).
Fig 3.

Representative photos for FKS1 WT C. auris isolates with increasing MTS MICs despite similar CLSI MICs. Note that the largest difference between MTS and CLSI was found for isolate AUH2751, which had the lowest OD530nm at 24 h, indicating poor growth in liquid media.
Fig 4.

Scatter plots of CLSI MICs versus MTS MICs. Numbers represent the number of C. auris isolates (total n = 100) at each MIC pair. The black broken lines indicate the CDC’s tentative resistance breakpoints for C. auris (where available) (19). The green shaded areas represent categorical agreement, while the pink and red areas indicate major error (MaE) and very major error (VmE), respectively.
5-Flucytosine
The CLSI-MTS agreement within ±1 twofold dilution was weak (37%), with a median (range) difference of 2 (−2 to 6) twofold dilutions. Moderate agreement was found within ±2 twofold dilutions (69%) (Table 1). The MIC values obtained via the two methods were significantly different (P < 0.0001) and were not correlated (Pearson r 0.15, P = 0.07). As there are no MIC interpretative criteria for detecting resistance, CA was not determined.
Echinocandins
The CLSI-MTS agreement within ±1 twofold dilution was moderate for anidulafungin (68%), micafungin (77%), and caspofungin (72%), with a median (range) difference of 1 (−4 to 6), 1 (−3 to 7), and 0 (−2 to 6) twofold dilution, respectively. Higher agreement was found within ±2 twofold dilutions (79%, 91%, and 85% for anidulafungin, micafungin, and caspofungin, respectively) (Table 1). Despite the fact that the MIC values of all three echinocandins, obtained with the two methods, were significantly different (P < 0.006), they showed very strong correlation for anidulafungin and micafungin (Pearson r 0.87 and 0.91, respectively, P < 0.0001), and significant but moderate correlation for caspofungin (Pearson r 0.64, P < 0.0001).
If the CLSI BMD was selected as the gold standard, the CAs for anidulafungin, micafungin, and caspofungin were 97% (3% MaEs, 0% VmEs, κ = 0.83 [95% CI 0.64–1]; strong agreement), 99% (1% MaEs, 0% VmEs, κ = 0.94 [95% CI 0.83–1]; almost perfect agreement), and 95% (5% MaEs, 0% VmEs, κ = 0.76 [95% CI 0.55–0.96]; moderate agreement), respectively. The aforementioned interpretation discrepancies for all three echinocandins occurred mainly for isolates belonging to clade I (Table 1; Fig. 4). However, 0–1/11 (0%–9%) isolates with FKS1 mutations had MTS MICs below the respective CDC resistance breakpoints for anidulafungin, micafungin, and caspofungin. The corresponding levels for CLSI were higher, 18%–27% (Table 2).
Azoles
The CLSI-MTS agreement within ±1 twofold dilution was poor to weak for posaconazole (3%), itraconazole (20%), and voriconazole (31%), with a median difference of 4 (1 to 7), 2 (−2 to 8), and 2 (−2 to 9) twofold dilutions, respectively. On the contrary, the agreement was moderate for isavuconazole (58%), with a median difference of 1 (−5 to 6) twofold dilution. Greater agreement was found within ±2 twofold dilutions (posaconazole 21%, itraconazole/voriconazole 52%, and isavuconazole 82%) (Table 1). The MIC values generated with the two methods were significantly different (P < 0.0001) and showed significant but moderate correlation (Pearson r 0.34–0.68, P ≤ 0.0003). As there are no MIC interpretative criteria for detecting resistance, CA was not determined.
For fluconazole, most of the MIC values were off-scale (64/100 isolates with CLSI MIC >64 mg/L and 83/100 isolates with MTS MIC >256 mg/L), precluding the corresponding agreement estimation. All but one of the CLSI fluconazole-non-resistant isolates were correctly classified as such with the MTS method, whereas one CLSI fluconazole-resistant isolate was incorrectly interpreted as fluconazole-non-resistant with the MTS, corresponding to 98% CA (κ = 0.93, 95% CI 0.83–1; almost perfect agreement), 1% MaEs, and 1% VmEs. Both of the abovementioned interpretation discrepancies occurred for clade IV strains (Table 1; Fig. 4).
MTS WT-ULVs
The estimated MTS-specific WT-ULV was 4 mg/L for amphotericin B, 1 mg/L for 5-flucytosine, 0.25 mg/L for anidulafungin, 0.25 mg/L for micafungin, and 1 mg/L for caspofungin (Table 3). WT-ULVs for azoles were not determined as most isolates had high off-scale MICs of fluconazole, and for the other azoles, MIC distributions were multimodal, indicating isolates with different resistance mechanisms. As different modal MICs were found for each clade as described above, the determined WT-ULVs may reflect differences among clades rather than a true WT population.
TABLE 3.
MTS statistical and visual wild-type upper limit values (WT-ULVs) for the 100 C. auris isolates used in the present studyb
| Antifungal agent | WT-ULV via visual eyeball method (mg/L) | Statistical WT-ULV at indicated endpoint (mg/L) | CLSI ECV (mg/L) | ||||
|---|---|---|---|---|---|---|---|
| 95% | 97.5% | 99% | 99.5% | 99.9% | |||
| Amphotericin B 5-Flucytosine |
4 1 |
4 0.5 |
4 0.5 |
4 1 |
4 1 |
8 1 |
2a NA |
| Anidulafungin | 0.25 | 0.125 | 0.25 | 0.25 | 0.25 | 0.5 | 1 |
| Micafungin | 0.25 | 0.125 | 0.25 | 0.25 | 0.25 | 0.25 | 0.5 |
| Caspofungin | 2 | 1 | 1 | 2 | 2 | 2 | 0.5 |
Based on ECOFFinder 99% ECV determined in a single-center study (20).
ECV: epidemiological cutoff value, ND: not determined, NA: not available.
Based on the MTS-specific amphotericin B WT-ULV of 4 mg/L, CA increased to 98% with only two false-resistant isolates. Based on MTS-specific WT-ULVs of echinocandins, all FKS1 mutants had anidulafungin, micafungin, and caspofungin MTS MICs higher than the WT-ULVs (Table 2).
DISCUSSION
The comparative evaluation of MTS and CLSI reference BMD methodologies for AFST against an international panel of C. auris isolates indicated that the commercial assay showed drug-related performance patterns. Overall, amphotericin B MTS MICs were slightly higher (modal MIC 1 mg/L) than CLSI MICs (modal MIC 0.5 mg/L); however, notable interpretation discrepancies were observed (34% MaEs, 0% VmEs), which were minimized when a MTS-specific WT-ULV of 4 mg/L was applied (2% MaEs, 0% VmEs). On the contrary, the MTS method could be reliably used for susceptibility testing of fluconazole (1% MaEs, 1% VmEs) and echinocandins (95%–99% CA, 1%–5% MaEs, and 0% VmEs). Some FKS1 mutants were missed using either the CDC’s breakpoints or CLSI ECVs, as their MICs overlapped with WT isolates or were below the resistance breakpoints. The CLSI-MTS agreement within ±1 twofold dilution was poor to moderate for the rest of azoles (3%–58%) and weak for 5-flucytosine (37%), with MTS resulting in higher MICs.
Studies on antifungal susceptibility patterns of C. auris, which have primarily been conducted following the reference BMD methodology, indicate that the MIC distributions can differ significantly among isolates belonging to different clades as found in the present study, although the resistance rate order of fluconazole>amphotericin B>echinocandins seems consistent (1). In fact, such variations may be attributed to differences in the cell morphology and the distinct metabolic properties of each clade-specific C. auris phenotype (24–26). Given the variable regional patterns of antifungal resistance, clade-dependent performance of the GDS methods for C. auris AFST has been reported, for example, 100% CA for clade II isolates with Etest (17), 86% CA (87% agreement within ±2 twofold dilutions) for clade I isolates with Etest (16), and 86% CA (39% agreement ±2 twofold dilutions) for clade III isolates with MTS (15). A possible explanation for the aforementioned variation could be the clade-specific differences in amphotericin B MIC distributions. In particular, the modal MIC for clade II isolates was 0.5 mg/L (17) as opposed to 1 mg/L for clade I strains, just one twofold dilution step lower from the CDC’s tentative resistance breakpoint of 2 mg/L (16), and the MIC50 (MIC range) for clade III isolates was 0.125 (0.06–0.25) mg/L for European Committee on Antimicrobial Susceptibility Testing (EUCAST) and 1 (0.016–2) mg/L for MTS (15).
Considering that treatment with liposomal amphotericin B administered at high doses is recommended as an alternative therapeutic option for C. auris-related infections (27), an issue of particular importance is the misleading elevated amphotericin B MTS MICs found for a significant number of strains tested in the present study, leading to 66% CA (34% MaEs). Indeed, Arendrup et al. have recently shown that isolates belonging to three clades exhibited amphotericin B resistance rates of 8%–28% and 45%–63% based on CLSI and Etest MICs, respectively (13), corroborating our findings. Of note, our study revealed that this phenomenon was more prominent among clade I isolates (agreement within ±1/±2 twofold dilutions 83%/91%), resulting in only a 32% CA (68% MaEs). This could be due to the higher MTS MIC values of clade I strains compared to isolates belonging to other clades (modal MIC 2 mg/L versus 0.125–1 mg/L), which is consistent with previous observations using Etest (28, 29). On the other hand, Kathuria et al. reported 86% CA for clade I isolates, most clonal (16), although the evaluation was performed using antibiotic medium three agar plates, a medium that tends to provide slightly lower amphotericin B Etest MICs for Candida spp. compared to RPMI (30), whereas lot-to-lot and brand-to-brand variability cannot be excluded, as it is not standardized (31). Clade II isolates were not falsely misclassified with MTS as amphotericin B-resistant (100% CA), as previously described for Etest (17), since they tend to have lower MICs than other clades, while the MTS could be a reliable tool for AFST against clade IV isolates (95% CA), which is in line with previous findings using Etest (14). Isolates with known resistance mechanisms were not included for the comparative evaluation. Yet, the described mechanisms contributing to clinical resistance to amphotericin B in C. auris are currently limited (5, 10), whereas there are indications that it may be epigenetic, and thus, the MICs may be reduced after a passage of the isolates in the laboratory with no drug pressure (32).
Unimodal amphotericin B CLSI MIC distributions for C. auris have been described (1), supporting our results and revealing a relatively low resistance rate, which is also corroborated by a meta-analysis indicating an overall level of resistance of 12% (33). Nonetheless, a resistance rate of 30% (modal MIC and MIC90 values of 0.5 and 2 mg/L, respectively) was found when the susceptibility pattern of 85 Colombian isolates was determined using Etest (34). The corresponding results obtained for strains isolated in the USA (n = 200) (35) and Kuwait (n = 314) (36) were more pronounced, as the resistance rates according to Etest-generated susceptibility data were 46% (modal MIC and MIC90 values of 1 and 2 mg/L, respectively) and 64% (modal MIC and MIC90 values of 2 and 4 mg/L, respectively), respectively. Alarmingly, overestimation of amphotericin B resistance in C. auris has also been reported with other widely used commercial AFST assays (22, 23), including Etest (37). This discrepancy has been endorsed by both the CLSI (38) and the EUCAST (39) and could be overcome with method-specific ECVs. Notably, amphotericin B resistance would be diminished to 0%, 3%, and 1% for the aforementioned strains, respectively, adopting the MTS-specific amphotericin B WT-ULV of 4 mg/L proposed here.
Furthermore, we incorporated echinocandin-resistant (FKS1 mutant) strains, as opposed to all previous published studies (14–16). Indeed, echinocandins are currently considered to be the frontline agents for the treatment of infections due to C. auris (27), while breakthrough infections, mainly catheter and urinary tract-related, were associated with FKS1 mutants becoming more frequent (7–9). Therefore, echinocandin AFST data may play a key role in potentially effective therapeutic management, and thus, it is critical to test a collection of truly resistant and non-resistant strains, if the true performance of an AFST assay is sought. Previous evaluations have shown a 61%/84% EUCAST-MTS agreement within ±1/±2 twofold dilutions for anidulafungin and 84%/94% for micafungin (100% CA for both drugs) (15), a 100% CA between CLSI and Etest for micafungin (14) and a CLSI-Etest CA of 99%–100% (0%–1% VmEs) for caspofungin (14, 16), which are in concordance with our results. However, when studies are performed using an abundance of susceptible/WT isolates, as in the latter (14–16), VmEs are uncommon (40), and thus, these results should be interpreted cautiously with respect to whether the method is suitable for the identification of resistant/non-WT isolates. MTS was also able to detect all FKS1 mutants, with MTS MICs being higher than the CLSI MICs for those isolates.
Moreover, the MTS better discriminated between FKS1 WT and mutant isolates than the reference BMD technique using the CDC’s breakpoints, as previously also described for C. albicans using Etest (41, 42). However, it should be noted that the currently available CDC’s resistance breakpoints are tentative and were not defined based on clinical outcome data (19). Indeed, isolates carrying a FKS1 mutation have been associated with poor in vivo response to echinocandins despite having CLSI MICs below the CDC’s resistance breakpoint (43), suggesting a review of existing echinocandins’ tentative breakpoints for C. auris (19). CLSI ECVs or MTS WT-ULVs would help to detect better FKS1 mutants.
Although the majority (>87%) of C. auris strains show resistance to fluconazole (1), non-resistant isolates have been recorded, especially within the clade II and to a lesser extent within the clades I and IV (32). The MTS method allowed correct discrimination between fluconazole-resistant and -non-resistant isolates (98% CA, 1% MaEs, and 1% VmEs), as previously described for GDS (14, 15). Nevertheless, one should keep in mind that persistent or breakthrough C. auris candidemias caused by fluconazole-non-resistant isolates (CLSI MICs 2-8 mg/L) have been reported (44), questioning the CDC’s tentative resistance breakpoint of 32 mg/L (19) and discouraging the administration of fluconazole as a therapeutic approach for most clinical cases of C. auris-driven infection (45).
To date, the use of fluconazole susceptibility profile is recommended as a surrogate marker for second-generation triazole susceptibility assessments (19). Voriconazole, isavuconazole, itraconazole, and posaconazole CLSI MIC data are comparable with those previously recorded, showing high MIC values and wide distributions (1, 26). In agreement with previous reports using GDS (14–16), a similar picture was observed for our MTS MIC distributions. Overall, the MTS MICs were higher than the CLSI MICs. Head-to-head comparisons of the MICs obtained by the GDS and BMD methods are limited. Kathuria et al. reported a 79% CLSI-Etest agreement within ±2 twofold dilutions for voriconazole (modal Etest MIC 1 mg/L) likely of clonal clade I (Indian) isolates (16), which is in line with our findings. However, Ruiz-Gaitán et al. found a 0%/0% EUCAST-MTS agreement within ±1/±2 twofold dilutions for voriconazole (MTS MIC50 >32 mg/L), in contrast to 37%/74% for posaconazole (MTS MIC50 0.25 mg/L) and 69%/88% for isavuconazole (MTS MIC50 0.125 mg/L), possibly of clonal clade III (Spanish) isolates (15). In general, wide MIC ranges typically indicate heterogeneous populations, and thus, most of the C. auris isolates should be considered azole-resistant since fluconazole CLSI MICs correlated with CLSI MICs for all other azoles (Pearson r 0.29-0.62, P ≤ 0.003). This argues for the ineffectiveness of these agents, albeit clinical proof for a relevant MIC-outcome relation is currently lacking (45). If there is a WT population, this will most likely be at the lower end of the MIC distribution. As the MIC distributions of each clade are different, analyzing all clades together will result in wide MIC distributions and high WT-ULVs. However, those values are still higher than the MTS MICs of the first described C. auris in 2009 in Japan (0.03 mg/L for posaconazole, 0.004 mg/L for isavuconazole, 0.03 mg/L for voriconazole, and 0.125 mg/L for itraconazole).
Regarding 5-flucytosine, CLSI susceptibility data are consistent with those previously described (modal MIC/MIC50 values of 0.125/0.06 mg/L versus 0.06–0.125/0.06–0.125 mg/L, respectively) (26, 46). GDS-generated MIC data sets are scarce. Namely, 5-flucytosine susceptibility testing of 54 C. auris isolates using Etest demonstrated a narrow MIC range (0.03–0.125 mg/L, modal MIC 0.06 mg/L), with the exception of six strains demonstrating MIC values of 32 mg/L (35), as opposed to our findings (modal [range] MIC 0.25 [0.03–4] mg/L). Of note, the aforementioned strains (clinical, surveillance, and environmental) were obtained from different hospitals during the New York outbreak but were not genotyped to eliminate the presence of clonality, in contrast to our study design. To date, comparative evaluations of the GDS and BMD methods are lacking. Based on our findings, the CLSI-MTS agreement was weak (37% within ±1 log2 dilutions), as the MTS method generated higher MICs. A WT-ULV of 1 mg/L was determined in the present study for MTS and 5-flucytosine.
Results of GDS may be affected by a series of methodological issues, like the inoculation method and trailing effects. Although both manufacturers recommend double-dipping for plate inoculation (47), Arendrup et al. have recently shown that the Etest-generated amphotericin B MICs increased when double inoculation was followed compared with single inoculation (modal MIC of 2 versus 1 mg/L, respectively, and resistance rates of 45%–58% versus 25%–30%, respectively, after 24 h of plates’ incubation) (13). Whether this is also the case for the MTS remains unknown. Interestingly, provided that single swab inoculation is adopted, the authors concluded that considering isolates with GDS amphotericin B MIC ≤2 mg/L as WT is a valid option. Nevertheless, following double swabbing inoculation for the Etest method (corresponding data for the MTS were not available), an Etest amphotericin B MIC ≤4 mg/L could enable the discrimination between WT and mutated isolates (13), which is in line with the MTS-specific WT-ULV determined here. Further studies assessing the impact of single versus double inoculation of the agar on the GDS results for C. auris and various antifungals are required.
In conclusion, the MTS method enabled the correct categorization of fluconazole- and echinocandin-resistant isolates, detecting all FKS1 mutants. On the other hand, resistance to amphotericin B was overestimated, whereas the problem was alleviated using the MTS-specific WT-ULV of 4 mg/L. Notably, a key limitation of a study conducted entirely within a single laboratory, such as the present one, is the unknown reproducibility of its findings across other laboratories. Therefore, further multicenter assessments are warranted to corroborate our findings and to determine method-dependent ECVs to streamline the identification of non-WT isolates using GDS-generated MIC data. However, as ECVs are not clinical breakpoints and a WT isolate may or may not respond to therapy, clinical outcome data are needed to set clinical breakpoints.
MATERIALS AND METHODS
Isolates
A total of 100 C. auris isolates were tested. In particular, 17 bloodstream isolates were collected from individual patients hospitalized in 8 Greek tertiary care hospitals located within the Attica region from November 2020 to August 2022. They were identified to the species level using matrix-assisted laser desorption ionization-time of flight mass spectrometry (Bruker Daltonics, Bremen, Germany) and clustered in clade I (South Asian) (48). Moreover, 83 genetically distinct isolates belonging to five C. auris clades and being isolated from various geographical regions, namely n = 30 clade I (South Asian; Brazil, Kuwait, Iran, India, Oman, Pakistan), n = 3 clade II (East Asian; South Korea, Japan), n = 23 clade III (African; South Africa, Spain), n = 22 clade IV (South American; Venezuela, Colombia), and n = 5 clade V (Iranian; Iran), were included (48). The strain collection comprised 11 clade I FKS1 hotspot mutant isolates harboring non-synonymous or deletion mutations (S639F/P/T/Y, M690V, and ΔF635) that are associated with resistance/elevated MICs to echinocandins, detected as previously described (49).
All isolates were stored at −70°C in normal sterile saline with 10% glycerol (AppliChem, Darmstadt, Germany) until use. Prior to testing, they were revived by subculturing them twice onto in-house prepared antimicrobial-free Sabouraud dextrose agar (Oxoid, Athens, Greece) plates at 35°C ± 2°C for 24 h.
AFST
The BMD AFST was performed according to the CLSI M27A4 protocol guidelines using laboratory-grade pure powders of amphotericin B (Sigma-Aldrich, Athens, Greece), fluconazole (Sigma-Aldrich, Athens, Greece), voriconazole (Pfizer Ltd., Kent, UK), posaconazole (Sigma-Aldrich, Athens, Greece), itraconazole (Sigma-Aldrich, Athens, Greece), isavuconazole (Sigma-Aldrich, Athens, Greece), anidulafungin (Pfizer, CT, USA), micafungin (Astellas Pharma, Tokyo, Japan), caspofungin (Merck & Co., NJ, USA), and 5-flucytosine (Sigma-Aldrich, Athens, Greece). Briefly, twofold serial drug concentrations ranging from 8 to 0.06 mg/L for amphotericin B, 64 to 1 mg/L for fluconazole, 2 to 0.002 mg/L for isavuconazole and posaconazole, and 8 to 0.008 mg/L for the remaining antifungals were used. The microtiter plates were incubated at 35 ± 2°C for 24 h and the MICs, defined as the lowest drug concentration at which complete (for amphotericin B) or ≥50% (for the rest of antifungals) visual fungal growth inhibition compared to the drug-free control well was observed, were determined with the aid of a magnifying mirror (50).
The MTS AFST was performed strictly following the manufacturer’s (Liofilchem, Roseto degli Abruzzi, Italy) instructions. Briefly, each RPMI agar plate (Liofilchem) was inoculated by double-dipping a sterile swab in the standardized yeast suspension (double inoculation). After applying the MTS to the agar surface, the plate was incubated at 35°C ± 2°C for 24 h and the MIC was determined by visual observation as the lowest drug concentration at which the border of the elliptical inhibition intercepted the strip scale using a 100%, 90%, and 80% fungal growth inhibition endpoint for amphotericin B, 5-flucytosine, and azoles/echinocandins, respectively (47). To assess the potential variation in MTS MIC determination, a proportion of isolates (10/100) have been re-tested on different days so as to determine the method’s inter-day reproducibility.
A single lot of RPMI medium, MTS, and RPMI agar plates was used throughout the study. Each isolate was tested by both AFST methods at the same laboratory using a single fungal suspension, which was prepared in sterile saline solution and adjusted to the required concentration. Inoculum density and purity checks were performed on all isolates by spread plate counts on in-house prepared antimicrobial-free Sabouraud dextrose agar plates. The CLSI and MTS MICs were determined by two blinded observers; discordance was arbitrated by a third reader. Testing was repeated by both the BMD and the MTS method for the isolates displaying discordant results, and the repeat result was kept as the final. The recommended C. krusei ATCC 6258 and C. parapsilosis ATCC 22019 were used as quality control strains for both methods.
Comparison between the CLSI and the MTS MICs
A head-to-head comparison of the generated MIC data sets, using the CLSI BMD as the reference methodology, was performed. The MTS MICs that fell between the traditional twofold dilution series were rounded up to the next standard upper twofold value. In any case, high off-scale MIC results were converted to the next highest twofold concentration, whereas low off-scale MIC values were left unchanged. For the quantitative analysis, the results of the two AFST methods were analyzed with a paired Student’s t-test after log2 transformation of the MIC values. A two-tailed P value of < 0.05 was considered to reveal a statistically significant difference. In addition, the levels of CLSI-MTS agreement within ±1 and ±2 twofold dilutions were calculated. For the qualitative analysis, the CA was estimated following the CDC’s tentative resistance breakpoints for C. auris (where available), namely amphotericin B ≥2 mg/L, fluconazole ≥32 mg/L, anidulafungin/micafungin ≥4 mg/L, and caspofungin ≥2 mg/L (19), and its strength was assessed by calculating the κ. Discrepancies were considered as MaE when the CLSI classified an isolate as non-resistant and the MTS as resistant (false resistance), and VmE when the CLSI categorized a strain as resistant and the MTS as non-resistant (false non-resistance). Regarding the echinocandins, the ability of each method to detect FKS1 mutants was assessed. Data were analyzed using the statistics software package GraphPad Prism, version 9.0, for Windows (GraphPad Software, San Diego, CA, USA).
MTS WT-ULV determination
MTS MIC distributions were analyzed with the ECOFFinder program (available at https://www.eucast.org/mic_and_zone_distributions_and_ecoffs) and visually (eyeball method) (51), and the WT-ULV was defined as the upper MIC value where the WT distribution ends. Different endpoints were used (95%, 97.5%, 99%, 99.5%, and 99.9%) for the statistical WT-ULV determination.
ACKNOWLEDGMENTS
This study was supported by an investigator-sponsored research grant from Gilead Sciences.
Conception and design of the study, data analysis, supervision, J.M.; Identification and susceptibility testing of isolates, M.S., S.L., and I.P.; Sequencing and genotyping of isolates, B.S. and J.F.M.; Provision of isolates, J.F.M., S.P., G.V., and A.T.; Writing—original draft preparation, data analysis, M.S.; Writing—review and editing, all authors. All authors have read and agreed to the published version of the manuscript.
Contributor Information
Joseph Meletiadis, Email: jmeletiadis@med.uoa.gr.
Kimberly E. Hanson, University of Utah, Salt Lake City, Utah, USA
REFERENCES
- 1. Kim HY PhD, Nguyen TA MSc, Kidd S PhD, Chambers J MD, Alastruey-Izquierdo A PhD, Shin J-H MD, Dao A PhD, Forastiero A MD, Wahyuningsih R MD, Chakrabarti A MD, Beyer P, Gigante V PhD, Beardsley J PhD, Sati H PhD, Morrissey CO PhD, Alffenaar J-W PhD. 2024. Candida auris-a systematic review to inform the world health organization fungal priority pathogens list. Med Mycol 62:42. doi: 10.1093/mmy/myae042 [DOI] [PMC free article] [PubMed] [Google Scholar]
- 2. WHO . n.d. WHO fungal priority pathogens list to guide research, development and public health action
- 3. Lyman M, Forsberg K, Sexton DJ, Chow NA. 2023. Worsening spread of Candida auris in the United States. Ann Intern Med 176:489–495. doi: 10.7326/M22-3469 [DOI] [PMC free article] [PubMed] [Google Scholar]
- 4. Kohlenberg A, Monnet DL, Plachouras D, Willinger B, Lagrou K, Philipova I, Budimir A, Marcou M, Hadjihannas L, Barekova L. 2022. Increasing number of cases and outbreaks caused by Candida auris in the EU/EEA, 2020 to 2021. Euro Surveill 27:2200846. doi: 10.2807/1560-7917.ES.2022.27.46.2200846 [DOI] [PMC free article] [PubMed] [Google Scholar]
- 5. Ben Abid F, Salah H, Sundararaju S, Dalil L, Abdelwahab AH, Salameh S, Ibrahim EB, Almaslmani MA, Tang P, Perez-Lopez A, Tsui CKM. 2023. Molecular characterization of Candida auris outbreak isolates in Qatar from patients with COVID-19 reveals the emergence of isolates resistant to three classes of antifungal drugs. Clin Microbiol Infect 29:1083. doi: 10.1016/j.cmi.2023.04.025 [DOI] [PMC free article] [PubMed] [Google Scholar]
- 6. Jacobs SE, Jacobs JL, Dennis EK, Taimur S, Rana M, Patel D, Gitman M, Patel G, Schaefer S, Iyer K, Moon J, Adams V, Lerner P, Walsh TJ, Zhu YC, Anower MR, Vaidya MM, Chaturvedi S, Chaturvedi V. 2022. Candida auris pan-drug-resistant to four classes of antifungal agents. Antimicrob Agents Chemother 66:e0005322. doi: 10.1128/aac.00053-22 [DOI] [PMC free article] [PubMed] [Google Scholar]
- 7. Meletiadis J, Siopi M, Spruijtenburg B, Georgiou P-C, Kostoula M, Vourli S, Frantzeskaki F, Paramythiotou E, Meis JF, Tsangaris I, Pournaras S. 2024. Candida auris fungaemia outbreak in a tertiary care academic hospital and emergence of a pan-echinocandin resistant isolate, Greece, 2021 to 2023. Euro Surveill 29:2400128. doi: 10.2807/1560-7917.ES.2024.29.45.2400128 [DOI] [PMC free article] [PubMed] [Google Scholar]
- 8. Codda G, Willison E, Magnasco L, Morici P, Giacobbe DR, Mencacci A, Marini D, Mikulska M, Bassetti M, Marchese A, Di Pilato V. 2023. In vivo evolution to echinocandin resistance and increasing clonal heterogeneity in Candida auris during a difficult-to-control hospital outbreak, Italy, 2019 to 2022. Euro Surveill 28:2300161. doi: 10.2807/1560-7917.ES.2023.28.14.2300161 [DOI] [PMC free article] [PubMed] [Google Scholar]
- 9. Spruijtenburg B, Ahmad S, Asadzadeh M, Alfouzan W, Al-Obaid I, Mokaddas E, Meijer EFJ, Meis JF, de Groot T. 2023. Whole genome sequencing analysis demonstrates therapy-induced echinocandin resistance in Candida auris isolates. Mycoses 66:1079–1086. doi: 10.1111/myc.13655 [DOI] [PubMed] [Google Scholar]
- 10. Rybak JM, Barker KS, Muñoz JF, Parker JE, Ahmad S, Mokaddas E, Abdullah A, Elhagracy RS, Kelly SL, Cuomo CA, Rogers PD. 2022. In vivo emergence of high-level resistance during treatment reveals the first identified mechanism of amphotericin B resistance in Candida auris. Clin Microbiol Infect 28:838–843. doi: 10.1016/j.cmi.2021.11.024 [DOI] [PMC free article] [PubMed] [Google Scholar]
- 11. Dennis EK, Chaturvedi S, Chaturvedi V. 2021. So many diagnostic tests, so little time: review and preview of Candida auris testing in clinical and public health laboratories. Front Microbiol 12:757835. doi: 10.3389/fmicb.2021.757835 [DOI] [PMC free article] [PubMed] [Google Scholar]
- 12. Dannaoui E, Espinel-Ingroff A. 2019. Antifungal susceptibly testing by concentration gradient strip etest method for fungal isolates: a review. J Fungi (Basel) 5:108. doi: 10.3390/jof5040108 [DOI] [PMC free article] [PubMed] [Google Scholar]
- 13. Arendrup MC, Lockhart SR, Wiederhold N. 2025. Candida auris MIC testing by EUCAST and clinical and laboratory standards institute broth microdilution, and gradient diffusion strips; to be or not to be amphotericin B resistant? Clin Microbiol Infect 31:108–112. doi: 10.1016/j.cmi.2024.10.010 [DOI] [PMC free article] [PubMed] [Google Scholar]
- 14. Ceballos-Garzon A, Garcia-Effron G, Cordoba S, Rodriguez JY, Alvarez-Moreno C, Pape PL, Parra-Giraldo CM, Morales-López S. 2022. Head-to-head comparison of CLSI, EUCAST, Etest and VITEK2 results for Candida auris susceptibility testing. Int J Antimicrob Agents 59:106558. doi: 10.1016/j.ijantimicag.2022.106558 [DOI] [PubMed] [Google Scholar]
- 15. Ruiz-Gaitán AC, Cantón E, Fernández-Rivero ME, Ramírez P, Pemán J. 2019. Outbreak of Candida auris in Spain: a comparison of antifungal activity by three methods with published data. Int J Antimicrob Agents 53:541–546. doi: 10.1016/j.ijantimicag.2019.02.005 [DOI] [PubMed] [Google Scholar]
- 16. Kathuria S, Singh PK, Sharma C, Prakash A, Masih A, Kumar A, Meis JF, Chowdhary A. 2015. Multidrug-resistant candida auris misidentified as Candida haemulonii: characterization by matrix-assisted laser desorption ionization–time of flight mass spectrometry and dna sequencing and its antifungal susceptibility profile variability by vitek 2, clsi broth microdilution, and etest method. J Clin Microbiol 53:1823–1830. doi: 10.1128/JCM.00367-15 [DOI] [PMC free article] [PubMed] [Google Scholar]
- 17. Shin JH, Kim MN, Jang SJ, Ju MY, Kim SH, Shin MG, Suh SP, Ryang DW. 2012. Detection of amphotericin B resistance in Candida haemulonii and closely related species by use of the Etest, Vitek-2 yeast susceptibility system, and CLSI and EUCAST broth microdilution methods. J Clin Microbiol 50:1852–1855. doi: 10.1128/JCM.06440-11 [DOI] [PMC free article] [PubMed] [Google Scholar]
- 18. Espinel-Ingroff A, Dannaoui E. 2020. Should etest MICs for yeasts be categorized by reference (BPs/ECVs) or by etest (ECVs) cutoffs as determinants of emerging resistance? Curr Fungal Infect Rep 14:120–129. doi: 10.1007/s12281-020-00378-3 [DOI] [Google Scholar]
- 19. Antifungal Susceptibility Testing for C. auris | Candida auris (C. auris) | CDC. n.d.
- 20. Arendrup MC, Prakash A, Meletiadis J, Sharma C, Chowdhary A. 2017. Comparison of EUCAST and CLSI reference microdilution MICs of eight antifungal compounds for Candida auris and associated tentative epidemiological cutoff values. Antimicrob Agents Chemother 61:e00485-17. doi: 10.1128/AAC.00485-17 [DOI] [PMC free article] [PubMed] [Google Scholar]
- 21. 2022. M57SEd4 | Epidemiological Cutoff Values for Antifungal Susceptibility Testing. 4th ed [Google Scholar]
- 22. Siopi M, Peroukidou I, Beredaki M-I, Spruijtenburg B, de Groot T, Meis JF, Vrioni G, Tsakris A, Pournaras S, Meletiadis J. 2023. Overestimation of amphotericin B resistance in Candida auris with sensititre yeastone antifungal susceptibility testing: a need for adjustment for correct interpretation. Microbiol Spectr 11:e0443122. doi: 10.1128/spectrum.04431-22 [DOI] [PMC free article] [PubMed] [Google Scholar]
- 23. Siopi M, Pachoulis I, Leventaki S, Spruijtenburg B, Meis JF, Pournaras S, Vrioni G, Tsakris A, Meletiadis J. 2024. Evaluation of the Vitek 2 system for antifungal susceptibility testing of Candida auris using a representative international panel of clinical isolates: overestimation of amphotericin B resistance and underestimation of fluconazole resistance. J Clin Microbiol 62:e0152823. doi: 10.1128/jcm.01528-23 [DOI] [PMC free article] [PubMed] [Google Scholar]
- 24. Barough RE, Javidnia J, Davoodi A, Talebpour Amiri F, Moazeni M, Sarvi S, Valadan R, Siahposht-Khachaki A, Moosazadeh M, Nosratabadi M, Haghani I, Meis JF, Abastabar M, Badali H. 2024. Metabolic patterns of fluconazole resistant and susceptible Candida auris clade V and I. J Fungi (Basel) 10:518. doi: 10.3390/jof10080518 [DOI] [PMC free article] [PubMed] [Google Scholar]
- 25. Brandt P, Mirhakkak MH, Wagner L, Driesch D, Möslinger A, Fänder P, Schäuble S, Panagiotou G, Vylkova S. 2023. High-throughput profiling of Candida auris isolates reveals clade-specific metabolic differences. Microbiol Spectr 11:e0049823. doi: 10.1128/spectrum.00498-23 [DOI] [PMC free article] [PubMed] [Google Scholar]
- 26. Szekely A, Borman AM, Johnson EM. 2019. Candida auris isolates of the southern asian and south african lineages exhibit different phenotypic and antifungal susceptibility profiles in vitro. J Clin Microbiol 57:e02055-18. doi: 10.1128/JCM.02055-18 [DOI] [PMC free article] [PubMed] [Google Scholar]
- 27. N.d. Clinical Treatment of C. auris infections | Candida auris (C. auris) | CDC [Google Scholar]
- 28. Naicker SD, Maphanga TG, Chow NA, Allam M, Kwenda S, Ismail A, Govender NP. 2021. Clade distribution of Candida auris in South Africa using whole genome sequencing of clinical and environmental isolates. Emerg Microbes Infect 10:1300–1308. doi: 10.1080/22221751.2021.1944323 [DOI] [PMC free article] [PubMed] [Google Scholar]
- 29. Maphanga TG, Naicker SD, Kwenda S, Muñoz JF, van Schalkwyk E, Wadula J, Nana T, Ismail A, Coetzee J, Govind C, Mtshali PS, Mpembe RS, Govender NP, for GERMS-SA . 2021. In vitro antifungal resistance of candida auris isolates from bloodstream infections, South Africa. Antimicrob Agents Chemother 65:e0051721. doi: 10.1128/AAC.00517-21 [DOI] [PMC free article] [PubMed] [Google Scholar]
- 30. Pfaller MA, Messer SA, Bolmström A. 1998. Evaluation of etest for determining in vitro susceptibility of yeast isolates to amphotericin B. Diagn Microbiol Infect Dis 32:223–227. doi: 10.1016/S0732-8893(98)00120-5 [DOI] [PubMed] [Google Scholar]
- 31. Lozano-Chiu M, Nelson PW, Lancaster M, Pfaller MA, Rex JH. 1997. Lot-to-lot variability of antibiotic medium 3 used for testing susceptibility of Candida isolates to amphotericin B. J Clin Microbiol 35:270–272. doi: 10.1128/jcm.35.1.270-272.1997 [DOI] [PMC free article] [PubMed] [Google Scholar]
- 32. Lockhart SR. 2019. Candida auris and multidrug resistance: defining the new normal. Fungal Genet Biol 131:103243. doi: 10.1016/j.fgb.2019.103243 [DOI] [PMC free article] [PubMed] [Google Scholar]
- 33. Chen J, Tian S, Han X, Chu Y, Wang Q, Zhou B, Shang H. 2020. Is the superbug fungus really so scary? A systematic review and meta-analysis of global epidemiology and mortality of Candida auris. BMC Infect Dis 20:827. doi: 10.1186/s12879-020-05543-0 [DOI] [PMC free article] [PubMed] [Google Scholar]
- 34. Escandón P, Chow NA, Caceres DH, Gade L, Berkow EL, Armstrong P, Rivera S, Misas E, Duarte C, Moulton-Meissner H, Welsh RM, Parra C, Pescador LA, Villalobos N, Salcedo S, Berrio I, Varón C, Espinosa-Bode A, Lockhart SR, Jackson BR, Litvintseva AP, Beltran M, Chiller TM. 2019. Molecular epidemiology of Candida auris in Colombia reveals a highly related, countrywide colonization with regional patterns in amphotericin B resistance. Clin Infect Dis 68:15–21. doi: 10.1093/cid/ciy411 [DOI] [PubMed] [Google Scholar]
- 35. Zhu YC, Kilburn S, Kapoor M, Chaturvedi S, Shaw KJ, Chaturvedi V. 2020. In vitro activity of manogepix against multidrug-resistant and panresistant candida auris from the New York outbreak. Antimicrob Agents Chemother 64:e01124-20. doi: 10.1128/AAC.01124-20 [DOI] [PMC free article] [PubMed] [Google Scholar]
- 36. Ahmad S, Khan Z, Al-Sweih N, Alfouzan W, Joseph L. 2020. Candida auris in various hospitals across Kuwait and their susceptibility and molecular basis of resistance to antifungal drugs. Mycoses 63:104–112. doi: 10.1111/myc.13022 [DOI] [PubMed] [Google Scholar]
- 37. Asadzadeh M, Ahmad S, Alfouzan W, Al-Obaid I, Spruijtenburg B, Meijer EFJ, Meis JF, Mokaddas E. 2024. Evaluation of etest and MICRONAUT-AM assay for antifungal susceptibility testing of Candida auris: underestimation of fluconazole resistance by MICRONAUT-AM and overestimation of amphotericin B resistance by etest. Antibiotics (Basel) 13:840. doi: 10.3390/antibiotics13090840 [DOI] [PMC free article] [PubMed] [Google Scholar]
- 38. CLSI . 2022. AST News Update June 2022: hot topic Candida auris update: method variability with amphotericin B susceptibility testing. Available from: https://clsi.org/about/blog/ast-news-update-june-2022-hot-topic
- 39. EUCAST: warning against the use of AST devices for amphotericin B testing of Candida auris. 2024
- 40. Berkow EL, Lockhart SR, Ostrosky-Zeichner L. 2020. Antifungal susceptibility testing: current approaches. Clin Microbiol Rev 33:e00069-19. doi: 10.1128/CMR.00069-19 [DOI] [PMC free article] [PubMed] [Google Scholar]
- 41. Arendrup MC, Garcia-Effron G, Buzina W, Mortensen KL, Reiter N, Lundin C, Jensen HE, Lass-Flörl C, Perlin DS, Bruun B. 2009. Breakthrough Aspergillus fumigatus and Candida albicans double infection during caspofungin treatment: laboratory characteristics and implication for susceptibility testing. Antimicrob Agents Chemother 53:1185–1193. doi: 10.1128/AAC.01292-08 [DOI] [PMC free article] [PubMed] [Google Scholar]
- 42. Baixench MT, Aoun N, Desnos-Ollivier M, Garcia-Hermoso D, Bretagne S, Ramires S, Piketty C, Dannaoui E. 2007. Acquired resistance to echinocandins in Candida albicans: case report and review. J Antimicrob Chemother 59:1076–1083. doi: 10.1093/jac/dkm095 [DOI] [PubMed] [Google Scholar]
- 43. Sharma D, Paul RA, Rudramurthy SM, Kashyap N, Bhattacharya S, Soman R, Shankarnarayan SA, Chavan D, Singh S, Das P, Kaur H, Ghosh AK, Prasad R, Sanyal K, Chakrabarti A. 2022. Impact of FKS1 genotype on echinocandin in vitro susceptibility in Candida auris and in vivo response in a murine model of infection. Antimicrob Agents Chemother 66 [DOI] [PMC free article] [PubMed] [Google Scholar]
- 44. Lee WG, Shin JH, Uh Y, Kang MG, Kim SH, Park KH, Jang HC. 2011. First three reported cases of nosocomial fungemia caused by Candida auris. J Clin Microbiol 49:3139–3142. doi: 10.1128/JCM.00319-11 [DOI] [PMC free article] [PubMed] [Google Scholar]
- 45. Aldejohann AM, Wiese-Posselt M, Gastmeier P, Kurzai O. 2022. Expert recommendations for prevention and management of Candida auris transmission. Mycoses 65:590–598. doi: 10.1111/myc.13445 [DOI] [PubMed] [Google Scholar]
- 46. Chowdhary A, Prakash A, Sharma C, Kordalewska M, Kumar A, Sarma S, Tarai B, Singh A, Upadhyaya G, Upadhyay S, Yadav P, Singh PK, Khillan V, Sachdeva N, Perlin DS, Meis JF. 2018. A multicentre study of antifungal susceptibility patterns among 350 Candida auris isolates (2009-17) in India: role of the ERG11 and FKS1 genes in azole and echinocandin resistance. J Antimicrob Chemother 73:891–899. doi: 10.1093/jac/dkx480 [DOI] [PubMed] [Google Scholar]
- 47. Liofilchem . 2021. MIC test strip technical sheet yeast. Available from: https://www.liofilchem.net/login.area.mic/technical_sheets/MTS24.pdf
- 48. de Groot T, Puts Y, Berrio I, Chowdhary A, Meis JF. 2020. Development of Candida auris short tandem repeat typing and its application to a global collection of isolates. MBio 11:e02971-19. doi: 10.1128/mBio.02971-19 [DOI] [PMC free article] [PubMed] [Google Scholar]
- 49. Asadzadeh M, Mokaddas E, Ahmad S, Abdullah AA, de Groot T, Meis JF, Shetty SA. 2022. Molecular characterisation of Candida auris isolates from immunocompromised patients in a tertiary-care hospital in Kuwait reveals a novel mutation in FKS1 conferring reduced susceptibility to echinocandins. Mycoses 65:331–343. doi: 10.1111/myc.13419 [DOI] [PubMed] [Google Scholar]
- 50. 2017. Reference method for broth dilution antifungal susceptibility testing of yeasts. Clinical and Laboratory Standards Institute, Wayne, PA, USA. [Google Scholar]
- 51. Lockhart SR, Ghannoum MA, Alexander BD. 2017. Establishment and use of epidemiological cutoff values for molds and yeasts by use of the clinical and laboratory standards institute M57 standard. J Clin Microbiol 55:1262–1268. doi: 10.1128/JCM.02416-16 [DOI] [PMC free article] [PubMed] [Google Scholar]