

Abstract
Objective
This study explored the application of Intravoxel Incoherent Motion (IVIM) diffusion imaging combined with Ultrasound Renal Resistance Index (RRI) for monitoring the pathophysiological changes associated with early contrast-induced nephropathy (CIN).
Methods
In this study, forty-two male Sprague-Dawley (SD) rats were equally divided into two groups: a contrast media (CM) group and a control group, each containing 21 animals. The CM group was administered a tail vein injection of ioversol (370 mg I/ml, 1.5 ml/kg), while the control group received a saline solution in a similar volume. Assessments using IVIM-MRI and Doppler ultrasound were performed 24 h before and at 1, 24, 48, and 72 h post-injection. These assessments aimed to evaluate the true diffusion coefficient (D), pseudo-diffusion coefficient (D*), perfusion fraction (f), apparent diffusion coefficient (ADC), and RRI. Concurrently, three rats from each group were sacrificed at these time points for renal histopathology, hypoxia-inducible factor-1α (HIF-1α) expression analysis, and the quantification of serum creatinine (SCr) and blood urea nitrogen (BUN) levels. Receiver operating characteristic (ROC) curves were plotted, and the area under the curve (AUC) was analyzed to evaluate the diagnostic performance of IVIM and RRI in predicting CIN.
Results
Post-ioversol administration, significant declines were noted in the D, D*, f, ADC across the renal cortex (CO), outer medulla (OM), and inner medulla (IM) from 1 to 48 h (P < 0.05), with the lowest values observed at 48 h. These parameters began to recover after 72 h. Conversely, RRI values escalated from 1 to 48 h, peaking at 48 h (P < 0.05), and then diminished gradually after 72 h. The control group showed no significant changes in these parameters. Furthermore, a negative correlation was observed between RRI, histopathological grades, HIF-1α expression levels, and the levels of SCr and BUN. In contrast, RRI exhibited a positive correlation with these pathological scores and the levels of SCr and BUN. ROC curve analysis revealed that the combined predictive performance of IVIM and RRI was superior to that of individual parameters.
Conclusion
The synergistic application of IVIM and RRI techniques offers a non-invasive approach for early detection of renal damage after ioversol exposure and is a potent method for observing the pathophysiological shifts associated with early-stage CIN.
Keywords: Contrast-induced nephropathy, Intravoxel incoherent motion, Renal resistance index, Acute kidney injury
Introduction
CIN, also recognized as contrast-induced acute kidney injury (CI-AKI), is characterized by a swift decline in renal function that manifests within days after CM administration. It ranks as the third leading cause of hospital-acquired acute kidney injury (AKI), surpassed only by reduced renal perfusion and the impact of nephrotoxic agents [1, 2]. CIN is identified by a rise in SCr of 25% or an increase of 0.5 mg/dL within 1 to 3 days following iodine CM exposure [2, 3]. The underlying pathophysiological mechanisms of CIN are complex, involving altered renal hemodynamics, the production of oxygen free radicals, and direct cytotoxicity [4].
Despite CIN being typically reversible, the proliferation of interventional procedures has heightened its frequency, particularly among vulnerable groups such as individuals with diabetes, chronic kidney disease (CKD), the elderly, and those with cardiovascular conditions [5]. While CIN occurs in less than 5% of patients with intact renal function, its prevalence escalates to 12–27% among those with pre-existing renal impairments [6]. Traditional diagnostic approaches, predominantly based on SCr, are hindered by their delayed response and limited sensitivity and specificity [7], underscoring the need for more effective diagnostic methods such as the combined use of IVIM-MRI and RRI.
Traditional ADC, calculated using a mono-exponential model Sb/S0 = exp (-b×ADC), is a composite parameter that does not differentiate molecular diffusion from microvascular perfusion [8, 9]. In contrast, IVIM analysis employs a biexponential model to assess diffusion signal decay, effectively separating water molecular diffusion from blood microcirculation flow-related information. The calculation formula is expressed as:
Sb/S0 = (1– f) × exp(–b × D) + f × exp (–b × D*).
where S0 and Sb represent the signal intensities at b = 0 and a given b-value, respectively [8]. The b-value refers to the diffusion sensitivity coefficient, which is used in diffusion-weighted imaging (DWI) to quantify the degree of diffusion weighting, with its unit being s/mm². D reflects the restricted diffusion capacity of water molecules within and between cells. A reduction in D is closely associated with microstructural damage, such as cellular edema and fibrosis. D∗ characterizes capillary segment length and mean blood flow velocity. Changes in D∗ are sensitive indicators of vascular constriction or endothelial dysfunction. f represents the ratio of the total fluid volume in capillaries and renal tubules to the total fluid volume per unit of renal tissue. A decline in f suggests impaired microcirculatory perfusion [10]. IVIM enables non-contrast assessment of tissue microcirculation and water diffusion dynamics [11], offering a non-invasive method to evaluate renal blood flow, glomerular filtration rate, and cortical and medullary microcirculation [12].
Studies have shown that IVIM can detect early microenvironmental and tissue deterioration in CKD and monitor varying degrees of renal function during kidney transplant recovery [13–15]. Post-CM administration, IVIM has demonstrated the ability to precisely detail diffusion characteristics and microvascular flow-related changes in renal tissues, providing valuable insights into the pathophysiology of CIN [16].
RRI, a critical metric in ultrasound Doppler examinations, assesses changes in the blood flow patterns of renal arcuate or interlobar arteries, which is crucial for appraising renal blood flow dynamics. An increase in RRI typically indicates elevated renal vascular resistance and disrupted hemodynamics. Given its advantages—non-invasiveness, real-time capability, repeatability, and accuracy—RRI is essential in assessing renal perfusion [17] and predicting AKI [18] and mortality in critically ill patients [19].
In this study, HIF-1α is used as a primary immunohistochemical antibody to validate our findings. HIF-1α, a key oxygen-dependent nuclear transcription factor under hypoxic conditions, mediates diverse physiological processes, including erythropoiesis, iron metabolism, and energy homeostasis regulation. Under hypoxia, HIF-1α remains stable and translocates to the nucleus, facilitating prompt detection and management of hypoxia. It plays an integral role in modulating oxidative stress and inflammatory responses and is a significant biomarker in renal injury studies related to CM exposure [20].
This study utilizes IVIM imaging and RRI to non-invasively monitor water diffusion, microcirculation, and hemodynamic alterations in rat renal tissues post-CM injection at an early stage. By integrating histopathological examinations, HIF-1α expression levels, and serum biochemical markers, we aim to elucidate the diagnostic value of these techniques for early CIN diagnosis. We propose that IVIM parameters and RRI will provide comprehensive insights into renal diffusion, microcirculatory flow-related information, and hemodynamic shifts, advancing early detection and intervention for CIN.
Materials and methods
Forty-two male SD rats, aged 6–8 weeks and weighing 200–250 g, were obtained from the Animal Experiment Center of Beihua University. The rats were housed in a controlled environment at 22 ± 2 °C with 55 ± 5% relative humidity and a 12-hour light-dark cycle. They had unrestricted access to food and water. This study was approved by the Medical Research Ethics Committee of Beihua University (Approval No. 2024112604) and conducted in accordance with the Animals (Scientific Procedures) Act 1986(UK), EU Directive 2010/63/EU, and the Guide for the Care and Use of Laboratory Animals (NIH, 2011).
The 42 rats were randomly divided into two groups: the CM group and the control group, each consisting of 21 rats. In the CM group, a CIN model was induced by injecting ioversol (concentration: 370 mg I/ml, 1.5 mg I/kg) [21] via tail vein. Rats in the control group received an equivalent volume of physiological saline via tail vein injection. IVIM-MRI and Doppler ultrasound assessments were performed at baseline (24 h prior to CM administration), and at 1 h, 24 h, 48 h, and 72 h post-injection. A flowchart depicting the experimental procedure for the CM group is shown in Fig. 1.
Fig. 1.

Flowchart of the contrast media group
Magnetic resonance imaging
IVIM-MRI was conducted using a 3.0T whole-body scanner (uMR790, United Imaging Healthcare Co., Ltd., Shanghai). The rats were fasted for 12 h before the procedure and anesthetized with an intraperitoneal injection of 0.3% pentobarbital sodium (2 mL/kg). Once anesthetized, the rats were positioned prone in a dedicated rat coil with their heads placed first. To minimize motion artifacts due to respiration and gastrointestinal movements, gauze was used to stabilize the abdomen. A single-shot spin-echo diffusion-weighted echo-planar imaging sequence was applied with nine b-values: 0, 10, 30, 50, 100, 200, 400, 600, and 800 s/mm2. Coronal scanning was performed to capture images of the right kidney in the coronal plane with the following parameters: TR = 2808 ms, TE = 84 ms, number of slices = 5, slice thickness = 2.0 mm, interslice gap = 10 mm, FOV = 80 mm × 80 mm, and matrix size = 128 × 128. For IVIM modeling, we employed a biexponential model with a piecewise fitting approach. This method first fits the high b-values using a linear model to obtain the values of D and f. Subsequently, the obtained D and f values were fixed, and the nonlinear Levenberg-Marquardt fitting method was employed to solve for the D* value.
After scanning, the raw DICOM images were transferred to a post-processing workstation (uWS-MR, R005) for analysis. ROIs in the CO, OM, and IM were manually delineated by a senior radiologist using T2WI images for reference (Fig. 2). For cortical measurements, three ROIs were placed at the upper, middle, and lower poles of the kidney, and the average of these three values was used as the final result. The same methodology was applied to measure parameters in the inner and outer medulla.
Fig. 2.
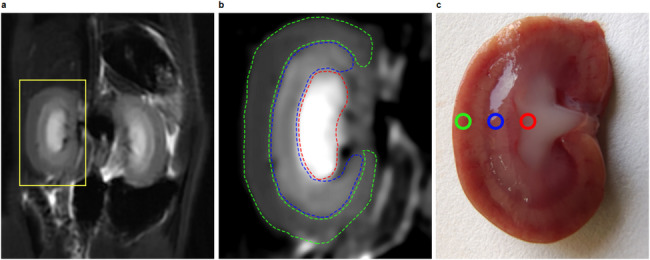
Regions of interest images of rat kidneys: (a) A representative T2-weighted image; (b) An enlarged view of the right kidney T2-weighted image, showing three regions of interest (ROIs): the green dashed line indicates the cortex region of interest (CO-ROI), the blue dashed line indicates the outer medulla region of interest (OM-ROI), and the red dashed line indicates the inner medulla region of interest (IM-ROI); (c) An anatomical diagram of the right kidney, showing the corresponding cortex, outer medulla, and inner medulla anatomical divisions
Doppler ultrasound examination
Ultrasound examinations were performed using the EPIQ7 high-resolution diagnostic system (Philips, USA) with a 12 MHz high-frequency linear array transducer, modulation depth of 3 cm, and a sampling volume of 2–4 mm, positioned at an angle of less than 60°. The rats were placed in a left lateral recumbent position under anesthesia, and the renal area was exposed and coated with coupling gel. The transducer was adjusted to capture longitudinal images of the kidneys. Peak systolic velocity (PSV) and end-diastolic velocity (EDV) of the arcuate and interlobar arteries were recorded. RRI was calculated using the formula: RRI = (PSV − EDV)/PSV. Each rat underwent three independent RI measurements at the upper, middle, and lower poles of the right kidney, with the final RRI value being the average of these measurements.
Histological analysis
After IVIM and ultrasound assessments, euthanasia was performed on three rats from each group at each time point via intraperitoneal overdose of 0.3% pentobarbital sodium (10 mL/kg). The kidneys were harvested, and the capsules were removed. Each kidney was longitudinally sectioned and immediately placed in 10% neutral formalin for fixation for 24 h. After fixation, the tissues were dehydrated, cleared, and paraffin-embedded using an automatic dehydrator following standard protocols. Continuous 4 μm thick sections were obtained using a microtome. The sections were stained with hematoxylin, treated with a bluing reagent, and then stained with eosin. The slides were dehydrated and mounted with neutral gum. A pathologist with over 10 years of clinical experience conducted the pathological assessment, evaluating the samples in a blinded manner. For each slide, five non-overlapping fields were randomly selected, and morphological changes in the renal tissues were observed under a light microscope at 200x magnification. Criteria for evaluation included vacuolar degeneration of renal tubular epithelial cells, tubular dilation, necrosis, cast formation, inflammatory cell infiltration, and interstitial fibrosis. Upon completion of the study, all remaining rats were euthanized with a lethal intraperitoneal dose of 0.3% pentobarbital sodium (10 mL/kg). Renal injury severity was classified on a scale from 0 to 4 based on the criteria established by Ulusoy et al. [22]: 0 (normal renal tissue), 1 (renal injury < 5%), 2 (renal injury 5–25%), 3 (renal injury 25–75%), and 4 (renal injury > 75%).
The sections were placed in an antigen retrieval buffer (Tris/EDTA pH 9) and heated at 97 °C for 30 min. After cooling to room temperature, FLEX Peroxidase Block blocking solution was added and incubated at 37 °C for 5 min. The primary antibody, HIF-1α monoclonal antibody (dilution 1:100) (JieHao Biotechnology, HM-0091, China), was applied at 150 µL per section and incubated for 35 min. After washing, a secondary antibody (FLEX/HRP horseradish peroxidase) was added at 150 µL per section and incubated at 37 °C for 20 min. DAB chromogen (300 µL) was then applied and incubated at 37 °C for 10 min. The sections were counterstained with hematoxylin, dehydrated, and mounted with neutral gum. The expression of HIF-1α was observed and recorded using an optical microscope.
Biochemical marker testing
Before euthanizing the rats, tail vein blood samples (0.5-1.0 mL) were collected and allowed to stand at room temperature for 30 min to facilitate coagulation. The samples were then centrifuged at 3000 rpm for 5 min to obtain serum, which was analyzed for SCr and BUN levels using a fully automated biochemical analyzer (BECKMAN AU5800). All tests were conducted according to the reagent kit instructions and standard operating procedures, with testing performed by trained technical personnel.
Statistical analysis
All data were analyzed using SPSS 27.0 software (SPSS Inc, Chicago, IL, USA). Continuous variables are expressed as mean ± standard deviation (mean ± SDs). Between-group comparisons were conducted using one-way analysis of variance (ANOVA), with post-hoc pairwise comparisons using the LSD test. Comparisons of different time points within groups were analyzed using repeated measures ANOVA. Correlation analyses were conducted using the Spearman rank correlation test to explore relationships between D, D*, f, and ADC with pathological injury scores and HIF-1α expression, as well as the correlation between RRI and pathological injury scores, HIF-1α expression, SCr, and BUN. ROC curves were plotted to assess the diagnostic efficacy of IVIM and RRI for CIN by analyzing the area under the curve. A p-value of < 0.05 was considered statistically significant.
Results
In this study, all rats successfully underwent IVIM and ultrasound examinations. The D, D*, f, and ADC parameter maps were obtained by fitting the acquired diffusion-weighted data to both the biexponential and monoexponential functions. The measured values for D, D*, f, and ADC were recorded in a standardized datasheet (Fig. 3; Table 1). Doppler ultrasound clearly captured longitudinal pulsed-wave spectral images of the kidneys, and RRI data were fully documented at all time points (Fig. 4; Table 2).
Fig. 3.

Coronal cross-sectional parameter images of renal IVIM in the contrast media group of rats at baseline and at 1 h, 24 h, 48 h, and 72 h after contrast media injection
Table 1.
Average values of D(x10− 3mm2/s)、D*(x10− 3mm2/s)、f(%)、ADC(x10− 3mm2/s) at different time points in the contrast media group
| Group | Baseline | 1 h | 24 h | 48 h | 72 h |
|---|---|---|---|---|---|
| D(x10− 3mm2/s) | |||||
| CO | 1.64 ± 0.02 | 1.58 ± 0.02* | 1.43 ± 0.04* | 1.34 ± 0.04* | 1.46 ± 0.03* |
| OM | 1.68 ± 0.05 | 1.59 ± 0.04* | 1.44 ± 0.05* | 1.36 ± 0.04* | 1.50 ± 0.03* |
| IM | 1.73 ± 0.04 | 1.67 ± 0.04* | 1.52 ± 0.04* | 1.42 ± 0.04* | 1.56 ± 0.05* |
| D*(x10− 3mm2/s) | |||||
| CO | 8.98 ± 0.52 | 7.10 ± 0.37* | 5.89 ± 0.50* | 4.44 ± 0.61* | 6.54 ± 0.42* |
| OM | 9.05 ± 0.50 | 6.87 ± 0.42* | 5.70 ± 0.40* | 4.27 ± 0.51* | 6.36 ± 0.45* |
| IM | 8.34 ± 0.23 | 7.18 ± 0.64* | 5.95 ± 0.58* | 4.60 ± 0.52* | 6.63 ± 0.70* |
| f(%) | |||||
| CO | 29.87 ± 0.72 | 25.67 ± 1.23* | 22.57 ± 0.52* | 19.34 ± 0.78* | 24.26 ± 0.48* |
| OM | 28.63 ± 0.73 | 25.37 ± 1.04* | 21.89 ± 1.56* | 19.43 ± 1.11* | 23.88 ± 0.93* |
| IM | 28.34 ± 0.88 | 25.47 ± 1.39* | 22.81 ± 0.91* | 20.02 ± 1.15* | 24.43 ± 0.90* |
| ADC(x10− 3mm2/s) | |||||
| CO | 1.68 ± 0.05 | 1.61 ± 0.04* | 1.50 ± 0.08* | 1.37 ± 0.07* | 1.53 ± 0.07* |
| OM | 1.72 ± 0.03 | 1.65 ± 0.03* | 1.50 ± 0.06* | 1.34 ± 0.05* | 1.55 ± 0.06* |
| IM | 1.66 ± 0.05 | 1.57 ± 0.06* | 1.44 ± 0.08* | 1.30 ± 0.05* | 1.51 ± 0.07* |
Note: CO = Cortex; OM = Outer medulla IM = Inner medulla
* Compared to baseline, P < 0.05
The inter-group and intra-group differences were analyzed using Analysis of Variance (ANOVA) and Repeated Measures ANOVA, respectively
Fig. 4.
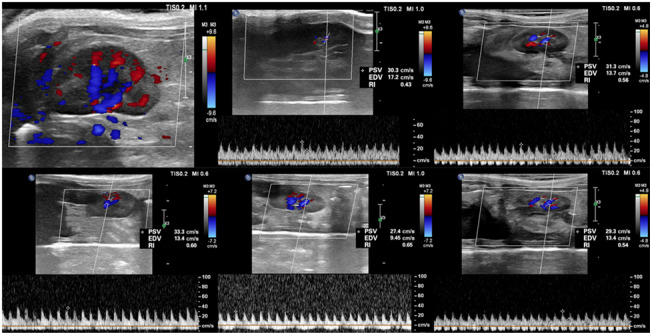
Doppler ultrasound images of blood flow signals in the contrast media group of rats, as well as renal resistance index value images at 1 h, 24 h, 48 h, and 72 h after contrast media injection. RRI =(peak-systolic velocity − end-diastolic velocity)/peak-systolic velocity
Table 2.
Average values of RRI at different time points in the contrast media group
| Group | Baseline | 1 h | 24 h | 48 h | 72 h |
|---|---|---|---|---|---|
| RRI | 0.45 ± 0.01 | 0.51 ± 0.02* | 0.58 ± 0.01* | 0.64 ± 0.01* | 0.55 ± 0.01* |
Note: Compared to baseline, P < 0.05
The inter-group and intra-group differences were analyzed using Analysis of Variance (ANOVA) and Repeated Measures ANOVA, respectively
Following CM administration, notable changes were observed in the IVIM parameters at various time points. Compared to baseline measurements, the values of D, D*, f, and ADC in the CO, OM, and IM showed significant reductions at 1, 24, and 48 h (P < 0.05), reaching their lowest levels at 48 h (Fig. 5). A slight recovery was detected at 72 h, though values remained lower than baseline and those recorded 1 h after contrast injection. In contrast, no significant changes were observed in the control group at any time point (P > 0.05).
Fig. 5.

D, D*, f and ADC values in the cortex, outer medulla, and inner medulla at each time point for the contrast media group and the control group. The changes in IVIM parameters in the CM group were most significant at 48 h. **P < 0.05
Ultrasound results demonstrated a gradual increase in RRI values following CM injection (P < 0.05), with a peak at 48 h (maximum value of 0.66, Fig. 6). At 72 h, RRI values decreased but remained above baseline levels (P < 0.05). No significant changes in RRI were noted in the control group (P > 0.05).
Fig. 6.
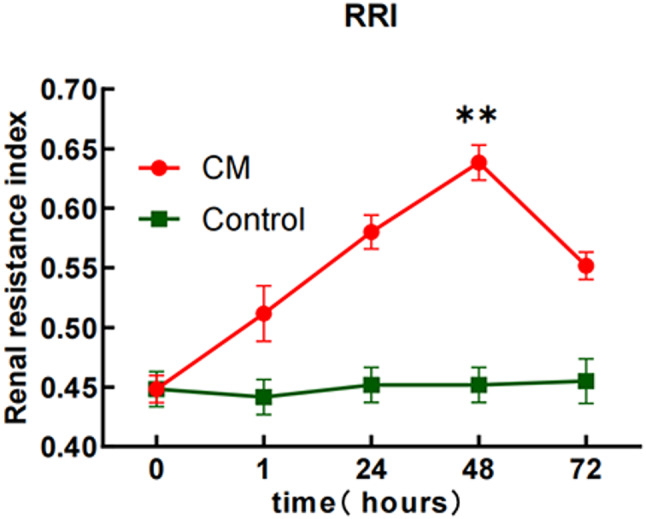
The RRI values at different time points for the contrast media group and the control group. The changes in RRI in the contrast media group were most significant at 48 h. **P < 0.05
Histological analysis
To confirm the accuracy of the imaging results, histological examinations were conducted. Hematoxylin and eosin staining revealed no significant pathological changes at 1 h post-CM injection. At 24 h, renal tubular epithelial cell swelling and vacuolar degeneration were observed, along with mild tubular dilation. The most pronounced renal injury occurred at 48 h, characterized by extensive dilation of renal tubular epithelial cells, some of which exhibited necrosis and sloughing. Inflammatory cell infiltration was observed in the interstitial tissue, accompanied by chronic hemorrhage and hemosiderin deposition. By 72 h, the tubular dilation and vacuolation had significantly reduced, although complete recovery to normal structure had not been achieved (Fig. 7). The control group exhibited normal kidney tissue structure throughout the study. According to the scoring system established by Ulusoy et al. [19], the CM group showed the highest renal injury score at 48 h (3.09 ± 0.18), which was statistically significant compared to baseline (P < 0.05) (Table 3).
Fig. 7.

Hematoxylin-eosin stain images of the renal cortex and medulla at different time points after contrast media injection. The main observations included vacuolar degeneration of tubular epithelial cells (black arrow), infiltration of inflammatory cells in the interstitium (green arrow), and proliferation of some capillary endothelial cells (blue arrow). The renal injury score was most pronounced at 48 h
Table 3.
Renal injury scores and HIF-1α expression scores at different time points before and after the injection of contrast media
| Baseline | 1 h | 24 h | 48 h | 72 h | |||
|---|---|---|---|---|---|---|---|
| Renal injury score | 0.00 ± 0.00 | 0.78 ± 0.21 | 2.04 ± 0.26 | 3.09 ± 0.18 | 1.58 ± 0.21 | ||
| HIF-1α expression score | 0.00 ± 0.00 | 1.00 ± 0.17 | 2.24 ± 0.19 | 3.20 ± 0.20 | 1.89 ± 0.23 | ||
Immunohistochemical staining revealed positive HIF-1α expression in the nuclei of renal tubular epithelial cells as early as 1 h post-injection. The most significant expression was observed at 48 h, where the staining intensity peaked (Fig. 8). By 72 h, staining intensity decreased but remained above baseline levels. No significant changes in HIF-1α expression were noted at any time point in the control group (P > 0.05) (Table 3).
Fig. 8.

After contrast media injection, the expression of HIF-1α in the cortex and medulla gradually increased, with the most significant nuclear staining observed at 48 h (black arrow)
Biochemical analysis
In the CM group, SCr levels peaked at 72 h post-CM injection (P < 0.05 compared to baseline), while no significant changes were observed at other time points (P > 0.05). BUN levels were significantly elevated at both 48 and 72 h (P < 0.05 compared to baseline), with a peak at 48 h and a slight reduction at 72 h compared to 48 h. No significant changes in SCr or BUN were detected at any time point in the control group (P > 0.05) (Table 4).
Table 4.
Average values of SCr (mol/L) and BUN (µmol/L) at different time points in the contrast media group
| Group | Baseline | 1 h | 24 h | 48 h | 72 h |
|---|---|---|---|---|---|
| SCr(mol/L) | 20.73 ± 0.96 | 21.27 ± 0.75 | 23.00 ± 0.39 | 24.82 ± 0.44 | 30.76 ± 0.98* |
| BUN(umol/L) | 3.94 ± 0.09 | 4.09 ± 0.13 | 4.32 ± 0.07 | 4.95 ± 0.07* | 4.72 ± 0.09* |
*Compared to baseline, P < 0.05
Correlation analysis of IVIM parameters with histopathology and HIF-1α expression
The values of D, D*, f, and ADC for the CO, OM, and IM exhibited significant negative correlations with histopathological scores and HIF-1α expression levels (Table 5). The correlation coefficients are as follows:
Table 5.
Correlation analysis of IVIM parameters with renal injury scores and HIF-1α expression scores、scr and BUN
| Renal injury score | HIF-1α expression score | SCr (umol/L) | BUN (mmol/L) | ||||||||||
|---|---|---|---|---|---|---|---|---|---|---|---|---|---|
| r | p | r | p | r | p | r | p | ||||||
| DCO | -0.755 | < 0.001 | -0.774 | < 0.001 | -0.674 | < 0.001 | -0.801 | < 0.001 | |||||
| D*CO | -0.628 | < 0.001 | -0.647 | < 0.001 | -0.679 | < 0.001 | -0.786 | < 0.001 | |||||
| fCO | -0.787 | < 0.001 | -0.786 | < 0.001 | -0.881 | < 0.001 | -0.702 | < 0.001 | |||||
| ADCCO | -0.804 | < 0.001 | -0.835 | < 0.001 | -0.600 | < 0.001 | -0.744 | < 0.001 | |||||
| DOM | -0.779 | < 0.001 | -0.778 | < 0.001 | -0.710 | < 0.001 | -0.656 | < 0.001 | |||||
| D*OM | -0.822 | < 0.001 | -0.818 | < 0.001 | -0.680 | < 0.001 | -0.657 | < 0.001 | |||||
| fOM | -0.644 | < 0.001 | -0.649 | < 0.001 | -0.669 | < 0.001 | -0.775 | < 0.001 | |||||
| ADCOM | -0.771 | < 0.001 | -0.754 | < 0.001 | -0.709 | < 0.001 | -0.729 | < 0.001 | |||||
| DIM | -0.734 | < 0.001 | -0.769 | < 0.001 | -0.520 | 0.003 | -0.744 | < 0.001 | |||||
| D*IM | -0.778 | < 0.001 | -0.731 | < 0.001 | -0.659 | < 0.001 | -0.929 | < 0.001 | |||||
| fIM | -0.804 | < 0.001 | -0.803 | < 0.001 | -0.630 | < 0.001 | -0.786 | < 0.001 | |||||
| ADCIM | -0.762 | < 0.001 | -0.722 | < 0.001 | -0.664 | < 0.001 | -0.650 | < 0.001 | |||||
Note: CO = Cortex; OM = Outer medulla IM = Inner medulla
For the CO, the correlations between D, D*, f, and ADC with histopathological scores were: (r = -0.755, -0.628, -0.787, -0.804, all p < 0.001). The correlation with HIF-1α scores was: (r = -0.774, -0.647, -0.786, -0.835, all p < 0.001).
For the OM, the correlations with histopathological scores were: (r = -0.779, -0.822, -0.644, -0.771, all p < 0.001), and with HIF-1α scores: (r = -0.778, -0.818, -0.649, -0.754, all p < 0.001).
For the IM, the correlations with histopathological scores were: (r = -0.734, -0.778, -0.804, -0.762, all p < 0.001), and with HIF-1α scores: (r = -0.769, -0.731, -0.803, -0.722, all p < 0.001).
Correlation analysis of IVIM parameters with RRI and blood biomarkers
The values of D, D*, f, and ADC for the CO, OM, and IM exhibited significant negative correlations with RRI (Fig. 9).The correlation coefficients are as follows:
Fig. 9.

The IVIM parameters are significantly negatively correlated with RRI
For the CO, the correlations between D, D*, f, and ADC with RRI were: (r = -0.729, -0.867, -0.816, -0.751, all p < 0.001).
For the OM, the correlations between D, D*, f, and ADC with RRI were: (r = -0.824, -0.825, -0.823, -0.717, all p < 0.001).
For the IM, the correlations between D, D*, f, and ADC with RRI were: (r = -0.778, -0.681, -0.744, -0.830, all p < 0.001).
Correlation analysis of RRI with histopathology, HIF-1α scores, and biochemical indicators
RRI demonstrated a strong positive correlation with histopathological scores, HIF-1α expression, SCr, and BUN, with correlation coefficients of (r = 0.739, p < 0.001), (r = 0.769, p < 0.001), (r = 0.665, p < 0.001), and (r = 0.646, p < 0.001), respectively (Fig. 10).
Fig. 10.

RRI is significantly positively correlated with renal injury scores, HIF-1α expression, SCr, and BUN
Predictive value of IVIM parameters and RRI for CIN
The ROC curve analysis revealed AUC values for IVIM and RRI of 0.820 and 0.825, respectively, in detecting CIN. The combined prediction model achieved an AUC of 0.915 (95% CI: 0.794–1.000), with a sensitivity of 90.00% and specificity of 90.00%, demonstrating superior diagnostic performance compared to individual parameters (Fig. 11).
Fig. 11.
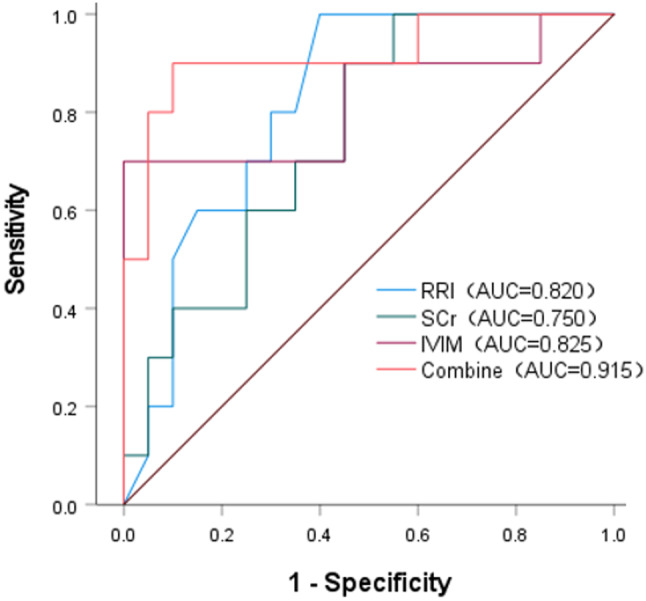
The ROC curves of IVIM, RRI, SCr, and the combined IVIM and RRI index. The combined index shows higher efficacy in predicting CIN than individual indicators
Discussion
This study systematically examined the changes in IVIM parameters and RRI at various time points following CM injection, alongside correlation analyses with histological and biochemical markers. The results show that IVIM parameters and RRI can sensitively reflect pathophysiological changes in the kidneys, often earlier than traditional biochemical markers. These findings have significant clinical implications, offering a multidimensional experimental foundation for the early detection and accurate diagnosis of CIN.
In this study, the IVIM parameters (D, D*, f) and ADC of the CO, OM, and IM in rats progressively decreased at different time points following CM injection, reaching their lowest values at 48 h. This pattern suggests significant suppression of renal microcirculation flow-related information and the diffusion capacity of water molecules. Although partial recovery was observed after 72 h, the parameters did not return to baseline, indicating that the tissue was in a partial repair phase but still showing potential damage. These results align with previous studies by Wang et al. [20] and Feng et al. [13]. The D parameter reflects the diffusion capacity of water molecules within tissue. In this study, D values in all anatomical regions began to decrease at 1 h, likely due to the high viscosity and osmotic pressure of CM, which restrict water molecule diffusion and may cause epithelial cell edema and renal tubular damage [16, 23]. Some studies have indicated that D is a reliable indicator for detecting AKI [24] and assessing CI-AKI [23].
D* and f represent quantitative parameters of tissue flow-related information. D* reflects the capillary segment length and average blood flow velocity within tissues, while f denotes the ratio of the total fluid volume in capillaries and renal tubules per unit volume to the total liquid content per unit volume of renal tissue. The reduction in D* and f values is associated with multiple pathophysiological cascades: (1) Hemodynamic impairment: The hyperosmolarity and viscous effects of CM induce renal tubular epithelial cell swelling and luminal dilation, reducing capillary blood flow velocity (manifested as decreased D* values) and causing regional hypoperfusion [13, 20]. Compensatory vasodilation is triggered, but CM’s direct cytotoxic effects through reactive oxygen species and apoptotic pathways [25] disrupt the balance of vasoactive mediators (endothelin, adenosine, and nitric oxide), leading to sustained renal vasoconstriction [16]. Although luminal dilation may transiently increase resting tubular fluid volume, the persistent vasoconstriction-induced reduction in effective blood flow is a critical factor in f value decline [13]. (2) Microstructural damage: Ischemia-reperfusion injury induces interstitial edema, compressing capillary beds, while tubular casts formed by necrotic debris obstruct fluid flow [23], further reducing the proportion of mobile fluid reflected by f values. The ischemic-hypoxic state activates the tubuloglomerular feedback mechanism, initiating a cycle of vasoconstriction → GFR reduction → aggravated ischemia → cellular damage [26], which exacerbates the decline in D* and f values. Our study confirmed significant reductions in D* and f values across all time points, corroborated by pathological findings.
This study observed that the ADC value reached its lowest point at 48 h post-contrast injection, which was closely related to reductions in D*, f, and D. As an imaging parameter reflecting both water molecular diffusion and microcirculatory flow-related information [9], the dynamic changes in ADC values suggest the following pathological mechanisms: (1) CM induces renal tubular epithelial cell edema and microstructural damage through its hyperosmolar properties and cytotoxicity, restricting water molecule diffusion. (2) Increased renal vascular resistance and hemodynamic disturbances, caused by afferent arteriole constriction and capillary blood flow deceleration, significantly reduce microcirculatory perfusion in the renal parenchyma [10, 27]. Our findings revealed significantly lower ADC values in the OM and IM compared to CO, likely due to the medulla’s inherent low-perfusion characteristics and increased susceptibility to ischemic-hypoxic injury [28]. Pathological examinations showed characteristic changes, including tubular cell edema and inflammatory infiltration, further validating the correlation between ADC reduction and cellular edema/microcirculatory dysfunction. These findings align with Le et al.‘s conclusions [9], which suggest that ADC dynamics reflect both cellular edema and ischemic injury severity, serving as biomarkers for renal injury progression and prognosis. Recent studies [29] also confirm that quantitative ADC analysis provides objective imaging evidence for evaluating renal tissue hypoxia and ischemia-reperfusion injury.
Doppler ultrasound provides a practical, effective, safe, and accurate method for assessing renal blood flow perfusion. The RRI has significant clinical value in the early diagnosis and prognostic assessment of various renal diseases, including diabetic nephropathy [30], CKD [31], and kidney transplantation [32]. A study by Xu et al. [33] identified RRI as an independent predictor of CIN in patients undergoing percutaneous coronary intervention. Interestingly, in this study, the CM group of rats showed an increase in RRI values at 1 h post-CM injection, peaking at 48 h before slightly declining, yet remaining above baseline levels. This indicates that CM induced an increase in renal vascular resistance. The elevation of RRI may be attributed to several factors: first, the high viscosity and hyperosmolarity of CM can cause tubular damage and endothelial dysfunction, leading to increased renal arterial resistance [16, 23, 34]. Second, CM-induced excessive stimulation of the tubule-glomerular feedback mechanism may increase adenosine secretion, causing constriction of afferent arterioles and further contributing to the rise in renal vascular resistance [27]. This finding aligns with the trends observed in D* and f values.
In our study, RRI showed a significant positive correlation with histopathological damage scores, HIF-1α expression levels, SCr, and BUN (r = 0.739, 0.769, 0.665, 0.646, p < 0.001). These results support the notion that RRI is an effective indicator for assessing hemodynamic changes in the kidneys following CM injection in rats. Wybraniec et al. [35] reported that the sensitivity of RRI for predicting CI-AKI at 48 h was 78%, with specificity of 81% in patients undergoing coronary angiography or percutaneous coronary intervention, in univariate analysis, both RRI and the pulsatility index were identified as predictors of CI-AKI; however, in multivariate models, only RRI remained an independent predictor of CI-AKI incidence. RRI is a highly sensitive parameter for kidney disease, providing valuable insights into the pathophysiology of native or transplanted kidneys. It serves as an important metric for evaluating renal function status and reflects the pathological process of renal functional decline in patients with AKI [36].
It is noteworthy that in this study, early changes in IVIM parameters and RRI occurred significantly earlier than changes in SCr and BUN. SCr levels in the CM group of rats showed a significant increase at 72 h post-CM injection, while BUN levels elevated significantly at 48 h. This indicates that SCr and BUN have insufficient sensitivity for the early diagnosis of CIN. As a key indicator of kidney function, SCr is influenced not only by the secretion from renal tubular epithelial cells but also by various factors, such as individual muscle metabolism, body weight, ethnicity, age, and gender [6]. To comprehensively validate the scientific rigor and reliability of this research, HIF-1α was selected as a critical immunohistochemical marker. This study elucidated the mechanisms by which CM induces tubular injury and localized hypoxia, leading to high expression of HIF-1α in the context of CIN [37]. A significant upregulation of HIF-1α expression was observed following CM injection, peaking at 48 h. This trend closely aligns with the dynamic changes observed in IVIM parameters and RRI, providing strong evidence for the scientific value of these imaging markers in accurately reflecting pathological changes in renal tissue.
This study conducted a longitudinal analysis of changes in critical IVIM parameters and RRI across various anatomical regions of the kidneys before and after CM injection, integrating histological and biochemical indicators to evaluate the diagnostic value of these methods in CIN. Compared to single indicators, the combined application of multiple indicators provides a more comprehensive and accurate reflection of renal function changes. IVIM offers quantitative information on microcirculatory flow-related information and water molecule diffusion, while RRI enables real-time observation of renal hemodynamic changes. The complementary advantages of these methods provide a multidimensional view of renal function changes and their potential pathophysiological mechanisms following CM injection. Histopathological damage and HIF-1α expression serve as gold standards, further validating the reliability of these imaging markers in monitoring the pathophysiological changes associated with CIN. This innovative research is expected to contribute to the development of a precise, non-invasive imaging diagnostic method for clinical assessment and prediction of CIN.
This study has certain limitations: Both IVIM and ultrasound images were susceptible to interference from rat respiratory movements. Although the abdomen was secured with gauze to minimize artifacts, residual effects still impacted image quality and parameter measurement accuracy. The experimental subjects were limited to rats, suggesting the need for future studies involving multiple species. Additionally, challenges such as low signal-to-noise ratio, insufficient low b-value acquisitions, and suboptimal fitting constraints may compromise the stability and reliability of IVIM parameter estimation and image quality.
Conclusion
The results of this study demonstrate that significant reductions in IVIM parameters and increases in RRI are observable as early as 1 h after CM injection in the early stages of CIN, reaching peak levels at 48 h. These changes are strongly correlated with histopathological damage, HIF-1α expression, and biochemical indicators. This suggests that IVIM and RRI are effective methods for monitoring the early pathophysiological changes associated with CIN.
Acknowledgements
The authors thank Dan Yu and Yuyin Man, the MRI scientists from United Imaging Healthcare, for providing the IVIM technical support.
Abbreviations
- IVIM
Intravoxel incoherent motion
- RRI
Renal resistance index
- CIN
Contrast-induced nephropathy
- DWI
Diffusion-weighted imaging
- SD
Sprague-Dawley
- CM
Contrast media
- CO
Cortex
- OM
Outer medulla
- IM
Inner medulla
- D
Diffusion coefficient
- D*
Pseudo-diffusion coefficien
- f
Perfusion fraction
- ADC
Apparent diffusion coefficient
- HIF-1α
Hypoxia-inducible factor-1α
- SCr
Serum creatinine
- BUN
Blood urea nitrogen
- AKI
Acute kidney injury
- CI-AKI
Contrast-induced acute kidney injury
- CKD
Chronic kidney disease
- ROI
Region of interest
- PSV
Peak systolic velocity
- EDV
End-diastolic velocity
- ROC
Receiver operating characteristic
- AUC
Area under the curve
Author contributions
JLC and ZQW contributed to the conceptualization and methodology. JLC and XYS contributed to the data collection. ZQW and ZW contributed to the statistical analysis. JLC wrote the main manuscript text. ZQW and ZW made the first revision of the manuscript. All authors reviewed the manuscript.
Funding
No funding.
Data availability
No datasets were generated or analysed during the current study.
Declarations
Ethics approval and consent to participate
No human samples or clinical data were included in this study, hence consent to participate is not applicable. All animal procedures were conducted according to the National Institute of Health Guide for the Care and Use of Laboratory Animals and approved by the University of Beihua Ethics Committee (approval number 2024112604).
Consent for publication
Not applicable.
Competing interests
The authors declare no competing interests.
Footnotes
Publisher’s note
Springer Nature remains neutral with regard to jurisdictional claims in published maps and institutional affiliations.
References
- 1.Ahmed K, McVeigh T, Cerneviciute R, et al. Effectiveness of contrast-associated acute kidney injury prevention methods; a systematic review and network meta-analysis. BMC Nephrol. 2018;19(1):323. [DOI] [PMC free article] [PubMed] [Google Scholar]
- 2.Wang Z, Liu H, Meng H, Zhang D. Application of diffusion tensor imaging and blood oxygenation level-dependent magnetic resonance imaging to assess bilateral renal function induced by Iohexol in rabbits. BMC Nephrol. 2020;21(1):210. [DOI] [PMC free article] [PubMed] [Google Scholar]
- 3.Nijssen EC, Rennenberg R, Nelemans P, van Ommen V, Wildberger JE. Post-Contrast acute kidney injury and intravenous prophylactic hydration: an update. Kontrastmittelinduzierte nephropathie: aktueller stand Präventiver Maßnahmen. Rofo. 2021;193(2):151–9. [DOI] [PubMed] [Google Scholar]
- 4.Mamoulakis C, Tsarouhas K, Fragkiadoulaki I, et al. Contrast-induced nephropathy: basic concepts, pathophysiological implications and prevention strategies. Pharmacol Ther. 2017;180:99–112. [DOI] [PubMed] [Google Scholar]
- 5.Boccalandro F, Shreyder K, Harmon L, Dhindsa M, Fahim T, Sheikh S. Five-Year Follow-Up of patients with Radio-Contrast-Induced acute renal injury: can intravenous sodium bicarbonate improve Long-Term outcomes?? Cardiovasc Revasc Med. 2021;31:61–8. [DOI] [PubMed] [Google Scholar]
- 6.Shams E, Mayrovitz HN. Contrast-Induced nephropathy: A review of mechanisms and risks. Cureus. 2021;13(5):e14842. [DOI] [PMC free article] [PubMed] [Google Scholar]
- 7.De Souza FM, De Carvalho AV, Ferraz IS, et al. Acute kidney injury in children undergoing cardiac surgery: predictive value of kidney arterial Doppler-based variables. Pediatr Nephrol. 2024;39(7):2235–43. [DOI] [PubMed] [Google Scholar]
- 8.Le Bihan D, Breton E, Lallemand D, Aubin ML, Vignaud J, Laval-Jeantet M. Separation of diffusion and perfusion in intravoxel incoherent motion MR imaging. Radiology. 1988;168(2):497–505. [DOI] [PubMed] [Google Scholar]
- 9.Le Bihan D. Apparent diffusion coefficient and beyond: what diffusion MR imaging can tell Us about tissue structure. Radiology. 2013;268(2):318–22. [DOI] [PubMed] [Google Scholar]
- 10.Sigmund EE, Vivier PH, Sui D, et al. Intravoxel incoherent motion and diffusion-tensor imaging in renal tissue under hydration and Furosemide flow challenges. Radiology. 2012;263(3):758–69. [DOI] [PubMed] [Google Scholar]
- 11.Federau C. Measuring perfusion: intravoxel incoherent motion MR imaging. Magn Reson Imaging Clin N Am. 2021;29(2):233–42. [DOI] [PubMed] [Google Scholar]
- 12.Liu J, Wang R, Qiu J, Su T. Investigation of renal perfusion and pathological changes in patients with acute kidney disease and tubulointerstitial nephritis using intravoxel incoherent motion and arterial spin labelling MRI: a prospective, observational study protocol. BMJ Open. 2024;14(3):e076488. [DOI] [PMC free article] [PubMed] [Google Scholar]
- 13.Feng YZ, Chen XQ, Cheng ZY, et al. Non-invasive investigation of early kidney damage in streptozotocin-induced diabetic rats by intravoxel incoherent motion diffusion-weighted (IVIM) MRI. BMC Nephrol. 2021;22(1):321. [DOI] [PMC free article] [PubMed] [Google Scholar]
- 14.Mao W, Zhou J, Zeng M, et al. Chronic kidney disease: pathological and functional evaluation with intravoxel incoherent motion diffusion-weighted imaging. J Magn Reson Imaging. 2018;47(5):1251–9. [DOI] [PubMed] [Google Scholar]
- 15.Ren Y, Chen L, Yuan Y, et al. Evaluation of renal cold ischemia-reperfusion injury with intravoxel incoherent motion diffusion-weighted imaging and blood oxygenation level-dependent MRI in a rat model. Front Physiol. 2023;14:1159741. [DOI] [PMC free article] [PubMed] [Google Scholar]
- 16.Dai H, Zhao C, Xiong Y, et al. Evaluation of contrast-induced acute kidney injury using IVIM and DKI MRI in a rat model of diabetic nephropathy. Insights Imaging. 2022;13(1):110. [DOI] [PMC free article] [PubMed] [Google Scholar]
- 17.Schnell D, Darmon M. Bedside doppler ultrasound for the assessment of renal perfusion in the ICU: advantages and limitations of the available techniques. Crit Ultrasound J. 2015;7(1):24. [DOI] [PMC free article] [PubMed] [Google Scholar]
- 18.Ninet S, Schnell D, Dewitte A, Zeni F, Meziani F, Darmon M. Doppler-based renal resistive index for prediction of renal dysfunction reversibility: A systematic review and meta-analysis. J Crit Care. 2015;30(3):629–35. [DOI] [PubMed] [Google Scholar]
- 19.Wybraniec MT, Bożentowicz-Wikarek M, Chudek J, Mizia-Stec K. Pre-procedural renal resistive index accurately predicts contrast-induced acute kidney injury in patients with preserved renal function submitted to coronary angiography. Int J Cardiovasc Imaging. 2017;33(5):595–604. [DOI] [PMC free article] [PubMed] [Google Scholar]
- 20.Wang Y, Zhang X, Hua Z, et al. Blood oxygen Level-Dependent imaging and intravoxel incoherent motion MRI of early Contrast-Induced acute kidney injury in a rabbit model. Kidney Blood Press Res. 2019;44(4):496–512. [DOI] [PubMed] [Google Scholar]
- 21.Liang L, Chen WB, Chan KW, et al. Using intravoxel incoherent motion MR imaging to study the renal pathophysiological process of contrast-induced acute kidney injury in rats: comparison with conventional DWI and arterial spin labelling. Eur Radiol. 2016;26(6):1597–605. [DOI] [PubMed] [Google Scholar]
- 22.Ulusoy S, Ozkan G, Mungan S, et al. GSPE is superior to NAC in the prevention of contrast-induced nephropathy: might this superiority be related to caspase 1 and Calpain 1? Life Sci. 2014;103(2):101–10. [DOI] [PubMed] [Google Scholar]
- 23.Li Y, Shi D, Zhang H, et al. The application of functional magnetic resonance imaging in type 2 diabetes rats with Contrast-Induced acute kidney injury and the associated innate immune response. Front Physiol. 2021;12:669581. [DOI] [PMC free article] [PubMed] [Google Scholar]
- 24.Cheng ZY, Gong SA, Chen PK, et al. Using intravoxel incoherent motion imaging to evaluate uric acid-induced renal injury and efficacy after treatment. Br J Radiol. 2024;97(1153):274–82. [DOI] [PMC free article] [PubMed] [Google Scholar]
- 25.Ward DB, Valentovic MA. Contrast induced acute kidney injury and direct cytotoxicity of iodinated Radiocontrast media on renal proximal tubule cells. J Pharmacol Exp Ther. 2019;370(2):160–71. [DOI] [PubMed] [Google Scholar]
- 26.Liu ZZ, Schmerbach K, Lu Y, et al. Iodinated contrast media cause direct tubular cell damage, leading to oxidative stress, low nitric oxide, and impairment of tubuloglomerular feedback. Am J Physiol Ren Physiol. 2014;306(8):F864–72. [DOI] [PMC free article] [PubMed] [Google Scholar]
- 27.Inoue T, Kozawa E, Okada H, et al. Noninvasive evaluation of kidney hypoxia and fibrosis using magnetic resonance imaging. J Am Soc Nephrol. 2011;22(8):1429–34. [DOI] [PMC free article] [PubMed] [Google Scholar]
- 28.Ko SF, Yip HK, Zhen YY, et al. Severe bilateral ischemic-reperfusion renal injury: hyperacute and acute changes in apparent diffusion coefficient, T1, and T2 mapping with immunohistochemical correlations. Sci Rep. 2017;7(1):1725. [DOI] [PMC free article] [PubMed] [Google Scholar]
- 29.Mukherjee S, Bhaduri S, Harwood R, et al. Multiparametric MRI based assessment of kidney injury in a mouse model of ischemia reperfusion injury. Sci Rep. 2024;14(1):19922. [DOI] [PMC free article] [PubMed] [Google Scholar]
- 30.Jinadu YO, Raji YR, Ajayi SO, Salako BL, Arije A, Kadiri S. Resistivity index in the diagnosis and assessment of loss of renal function in diabetic nephropathy. Cardiovasc J Afr. 2022;33(1):26–32. [DOI] [PMC free article] [PubMed] [Google Scholar]
- 31.Provenzano M, Rivoli L, Garofalo C, et al. Renal resistive index in chronic kidney disease patients: possible determinants and risk profile. PLoS ONE. 2020;15(4):e0230020. [DOI] [PMC free article] [PubMed] [Google Scholar]
- 32.Azzouz S, Chen A, Ekmekjian T, Cantarovich M, Baran D, Sandal S. The role of renal resistive index as a prognostic tool in kidney transplantation: a systematic review. Nephrol Dial Transpl. 2022;37(8):1552–65. [DOI] [PubMed] [Google Scholar]
- 33.Xu ZR, Chen J, Liu YH, Liu Y, Tan N. The predictive value of the renal resistive index for contrast-induced nephropathy in patients with acute coronary syndrome. BMC Cardiovasc Disord. 2019;19(1):36. [DOI] [PMC free article] [PubMed] [Google Scholar]
- 34.Sendeski M, Patzak A, Persson PB. Constriction of the Vasa recta, the vessels supplying the area at risk for acute kidney injury, by four different iodinated contrast media, evaluating ionic, nonionic, monomeric and dimeric agents. Invest Radiol. 2010;45(8):453–7. [DOI] [PubMed] [Google Scholar]
- 35.Wybraniec MT, Chudek J, Bożentowicz-Wikarek M, Mizia-Stec K. Prediction of contrast-induced acute kidney injury by early post-procedural analysis of urinary biomarkers and intra-renal doppler flow indices in patients undergoing coronary angiography. J Interv Cardiol. 2017;30(5):465–72. [DOI] [PubMed] [Google Scholar]
- 36.Wang L, Wang X. Diagnostic value of multi-parameter ultrasound evaluation in sepsis complicated by acute kidney injury. Ren Fail. 2024;46(1):2313861. [DOI] [PMC free article] [PubMed] [Google Scholar]
- 37.Wang Y, Zhang X, Wang B, et al. Evaluation of renal pathophysiological processes induced by an iodinated contrast agent in a diabetic rabbit model using intravoxel incoherent motion and blood oxygenation Level-Dependent magnetic resonance imaging. Korean J Radiol. 2019;20(5):830–43. [DOI] [PMC free article] [PubMed] [Google Scholar]
Associated Data
This section collects any data citations, data availability statements, or supplementary materials included in this article.
Data Availability Statement
No datasets were generated or analysed during the current study.