

ABSTRACT
Over 30 types of amacrine cells have been described in the primate retina, yet few are well characterized. Here, we investigated amacrine cells expressing the alpha subunit of calcium/calmodulin‐dependent protein kinase II (CaMKII) in the retinas of human, macaque (Macaca fascicularis, Macaca nemestrina), and marmoset (Callithrix jacchus) monkeys using immunohistochemistry and intracellular injections, with a focus on displaced amacrine cells (dACs) in the ganglion cell layer. The spatial density of CaMKII‐positive dACs decreases with the distance from the fovea, but in the peripheral temporal retina, the density of CaMKII‐positive dACs nevertheless exceeds the density of retinal ganglion cells. In all species, CaMKII‐positive dACs include cells expressing choline acetyltransferase (ChAT) cells, but in the human retina, only 60% of the ON ChAT population is CaMKII‐positive. Conversely, in the marmoset and the macaque, about 80% of ON ChAT cells co‐express CaMKII, but only 55% of ON ChAT cells in humans do so. Intracellular injections of CaMKII‐positive dACs with the lipophilic dye DiI revealed ON starburst and semilunar Type 3 cells in all three species, but in the human retina, at least three additional types were detected. In the inner nuclear layer, CaMKII is expressed by multiple populations of amacrine cells, which are distinguished based on their soma size and staining intensity, but OFF ChAT cells do not co‐express CaMKII. We conclude that ON‐ and OFF‐ChAT cells show distinct patterns of CaMKII expression and that the diversity of CaMKII‐expressing dACs in humans is greater than that in marmoset or macaque retina.
Keywords: amacrine cells, CaMKII, human, macaque, marmoset, primate retina, vision
The study shows that amacrine cells expressing the alpha subunit of calcium/calmodulin‐dependent protein kinase II (CaMKII) make up subpopulations of conventional and displaced amacrine cells. They include ON but not OFF starburst amacrine cells and multiple types of wide‐field presumed GABAergic amacrine cells.

1. Introduction
Amacrine cells are primarily inhibitory interneurons that show the highest diversity among cell classes in the mammalian retina. They exhibit a broad range of morphological features, neurotransmitters, and functional roles (reviewed in Grünert and Martin 2020; Vaney 1990; Masland 2012; Diamond 2017). Amacrine cells receive synaptic input from bipolar cells and other amacrine cells and relay information to bipolar, ganglion, and amacrine cells. In primates, amacrine cells have long been known to comprise at least 30 morphological types (Polyak 1941; Boycott and Dowling 1969; Kolb and Nelson 1981; Mariani 1990). Consistently, recent molecular studies using single‐cell RNA sequencing distinguished around 30 types of amacrine cells in human (Cowan et al. 2020; Yan, Peng, et al. 2020), macaque monkey (Peng et al. 2019), and marmoset (L. Zhang et al. 2024).
Molecular markers for specific amacrine cell types have enabled analysis of the spatial distribution of these cell types. For example, antibodies against the calcium‐binding protein calretinin were used to study AII amacrine cells in macaque (Wässle et al. 1995; Massey and Mills 1999; Kolb et al. 2002), marmoset (Jusuf et al. 2004), and human retinas (Lee et al. 2016). Other well‐established markers include choline acetylcholine transferase (ChAT), which is expressed by ON starburst cells in the ganglion cell layer and OFF starburst cells in the inner nuclear layer (Rodieck and Marshak 1992); and tyrosine hydroxylase (TH), which is expressed by dopaminergic amacrine cells (Mariani and Hokoç 1988; Dacey 1990; Wässle et al. 1995; Jusuf et al. 2004; Lee et al. 2016).
Combining immunofluorescence and intracellular injections enables the study of the fine dendritic morphology of specific molecular cell types (Kao and Sterling 2003) and has been applied to study various amacrine and ganglion cell types in primates (Majumdar et al. 2008; Weltzien et al. 2014; Lee et al. 2016; Nasir‐Ahmad et al. 2021; Baldicano et al. 2022; Nasir‐Ahmad et al. 2022; Lee et al. 2024). One marker used in our previous studies on retinal ganglion cells is the alpha subunit of calcium/calmodulin‐dependent protein kinase II (CaMKII) (Baldicano et al. 2022). Immunohistochemical studies have also shown CaMKII expression in amacrine cells in rat (Ochiishi et al. 1994; Terashima et al. 1994), mouse (Liu et al. 2000; Tetenborg et al. 2017), and primate retinas (Calkins et al. 2005; Baldicano et al. 2022). Consistently, studies using single‐cell RNA sequencing in mouse (Yan, Laboulaye, et al. 2020), macaque (Peng et al. 2019), and human (Cowan et al. 2020; Yan, Peng, et al. 2020) retinas identified multiple molecular clusters of amacrine cells expressing CaMKII.
Improved understanding of amacrine cells has therapeutic implications in diagnostic tests such as the electroretinogram (ERG), which reflects amacrine cell activity through oscillatory potentials (Korol et al. 1975; Wachtmeister 1998; Hood 2017; Midena et al. 2021), and optogenetic therapy involving cell‐type‐specific targeting for restoring vision loss (Busskamp et al. 2012; Sahel and Roska 2013; Simunovic et al. 2019). Here we investigated the spatial distribution and morphology of CaMKII‐expressing amacrine cells in the retinas of the human, the macaque, and the marmoset.
2. Materials and Methods
2.1. Tissue Preparation
2.1.1. Marmoset and Macaque Retinas
Eyes were obtained from male and female adult common marmosets (Callithrix jacchus) and adult male macaque monkeys (Macaca fascicularis and Macaca nemestrina) at the end of unrelated electrophysiological experiments carried out in Sydney at the University of Sydney or in Melbourne at Monash University. All procedures were conducted according to the provisions of the NHMRC code of practice for the care and use of animals and were approved by the University of Sydney Animal Care and Ethics Committee or the Monash University Animal Ethics Committee.
Tissue details are summarized in Table 1. Most retinas were also used in our previous study of retinal ganglion cells (Baldicano et al. 2022). Animals were perfused with saline or with artificial cerebrospinal fluid (aCSF). The eyes where the retinas were intended for intracellular injections were enucleated and cut open, the vitreous was removed, and the isolated retina was immersed and fixed in 4% PFA in 0.1 M phosphate buffer (PB) for 1 h at room temperature. In the cases where the retinas were intended for standard immunofluorescence, saline/aCSF perfusion was followed by 4% paraformaldehyde (PFA) in 0.1 M PB. The eyes were enucleated, the cornea and lens were dissected from the eyes, and the posterior eyecup was immersion fixed in 4% PFA in 0.1 M PB for 1 h at room temperature. After rinses in phosphate‐buffered saline (PBS), the retina was dissected and the vitreous removed.
TABLE 1.
Animal tissue.
| ID | Species | Eye | Sex | Age (years) | Perfusion medium | Immersion fixation medium | Fixation time (min) | Used for |
|---|---|---|---|---|---|---|---|---|
| FM42 | M. fascicularis | R | M | 13.4 | Saline/4% PFA | 4% PFA | 30 | Flat mount |
| * FM203 | M. fascicularis | L and R | M | 8.8 | aCSF | 4% PFA | 60 | Vibratome sections & flat mount |
| * FM62 | M. fascicularis | R | M | 11.4 | Saline/4% PFA | 4% PFA | 60 | DiI injections |
| * NM21 | M. nemestrina | L | M | 13.8 | aCSF | 4% PFA | 60 | DiI injections |
| * NM239 | M. nemestrina | L | M | 7.2 | aCSF | 4% PFA | 60 | DiI injections |
| * M1898 | C. jacchus | R | M | 4.6 | Saline/4% PFA | 4% PFA | 60 | Flat mount |
| * CJ197/F1508 | C. jacchus | L and R | F | 5.8 | aCSF | 4% PFA | 60 | DiI injections |
| * CJ199/M1872 | C. jacchus | L | M | 3.6 | aCSF | 4% PFA | 60 | DiI injections |
| * CJ204/M2018 | C. jacchus | R | M | 3.5 | Saline/4% PFA | 4% PFA | 60 | Vibratome sections |
| CJ212/F2110 | C. jacchus | R | F | 3.8 | Saline/4% PFA | 4% PFA | 60 | Vibratome sections |
| GM002/M2162 | C. jacchus | L | M | 3.7 | Saline/4% PFA | 4% PFA | 60 | Flat mount |
Abbreviations: ACSF, artificial cerebrospinal fluid; ID, animal identifier; PFA, paraformaldehyde in 0.1 M PB.
These retinas were also used in our previous study (Baldicano et al. 2022).
2.1.2. Human Retinas
Postmortem human donor eyes from adult male and female donors with no known history of eye disease were obtained from the Lions NSW Eye Bank (Sydney Eye Hospital) with consent and ethical approval from the University of Sydney Human Research Ethics Committee. Donor eye details are given in Table 2. All retinas except preparation #13587 were also used in our previous study (Baldicano et al. 2022). The posterior eyecup of retinas intended for standard immunofluorescence was immersion fixed in 2% PFA in 0.1 M PB. Eyes intended for intracellular injections were usually kept in CO2‐independent medium before dissection. The iris and lens were cut off, the vitreous removed, and the retina was dissected out and then fixed in 4% PFA in 0.1 M PB for 1 h at room temperature.
TABLE 2.
Human donor tissue.
| ID | Eye | Sex | Age (years) | Time for enucleation (h) | Time to CO2‐independent medium | Time to fixation (h) | Fixation time (h) | Used for |
|---|---|---|---|---|---|---|---|---|
| 13587 | L | F | 44 | 2 | N/A | 10 | 12 | Flat mount |
| * 13699 | L | M | 56 | 2 | N/A | 9 | 21 | Vibratome sections |
| * 15796 | L | M | 38 | 2 | N/A | 4 | 16 | Vibratome sections |
| * 16055 | R | M | 52 | 8 | 9 | 13 | 1 | DiI injections |
| * 16281 | L | M | 29 | 5 | 10 | 10 | 1 | DiI injections |
| * D19‐0885 | L | M | 52 | 4 | N/A | 6 | 1 | DiI injections |
| * D19‐0859 | L and R | F | 31 | 1 | N/A | 7 | 16 | Vibratome sections |
| * D20‐0129 | R | M | 36 | 1 | N/A | 8 | 3 | Flat mount |
Note: Times above are shown to the nearest hour.
Abbreviation: ID, donor identifier.
These retinas were also used in our previous study (Baldicano et al. 2022).
2.1.3. Antibodies
The antibodies used in the present study are summarized in Table 3.
TABLE 3.
Antibodies.
| Antibody | Immunogen | Source, catalogue number, RRID | Antibody type | Dilution |
|---|---|---|---|---|
| CaMKII (α subunit) | Partially purified full‐length native protein corresponding to rat CaMKII | Abcam, Cambridge, UK, #ab22609, clone 6G9, RRID: AB_447192 | Mouse, monoclonal | 1:1000 |
| CaMKII (α subunit) | Partially purified rat CaMKII, α‐subunit | Millipore, Darmstadt, Germany, #05‐532, clone 6G9, RRID: AB_309787 | Mouse, monoclonal | 1:1000 |
| Choline acetyltransferase (ChAT) | Purified human placental choline acetyltransferase enzyme | Merck Millipore, #AB144P, RRID: AB_2079751 | Goat, polyclonal | 1:200 (1:100 for DiI injections) |
| RNA‐binding protein with multiple splicing (RBPMS) | N‐terminal region of rat RNA binding protein with multiple splicing (RBPMS) sequence, conjugated to KLH | PhosphoSolutions, Aurora, CO (Lubio), #1832‐RBPMS, lot NB220o, RRID: AB_2492226 | Guinea pig, polyclonal | 1:500 |
| RNA‐binding protein with multiple splicing (RBPMS) | Recombinant protein encompassing a sequence within the center region of human RBPMS | Gene Tex, California, USA, #GTX118620, RRID: AB_10630076 | Rabbit, polyclonal | 1:250 |
The specificity of the mouse monoclonal antibodies (clone 6G9) against the alpha subunit of CaMKII was characterized by the manufacturers through immunoblot analysis of rat, mouse, and human brain tissue lysates, where they detected a band of approximately 50 kDa (predicted molecular weight: 56 kDa).
The goat antiserum against choline acetyltransferase (ChAT) enzyme has been characterized by the manufacturer in Western blots to detect a single band of about 70 kDa in mouse brain lysate. Antibodies against ChAT have been used as markers for cholinergic (starburst) amacrine cells in primate retina (Rodieck and Marshak 1992; Moritoh et al. 2013). Their dendritic processes stratify in Stratums 2 and 4 of the IPL and form two bands, which assisted in delineating the stratification of DiI‐injected cells.
The guinea pig antiserum against RNA‐binding protein with multiple splicing (RBPMS) was characterized by the manufacturer to detect a single band at about 24 kDa on Western blots of rat heart lysate. The rabbit antiserum against RBPMS was characterized by the manufacturer to detect a single band at about 26 kDa on Western blots of mouse heart lysate. Antibodies against RBPMS have previously been established as markers for retinal ganglion cells in a variety of vertebrates, including primates (Kwong et al. 2010; Rodriguez et al. 2014; Chandra et al. 2017; Haverkamp et al. 2021; Baldicano et al. 2022). In the present study, antibodies against RBPMS were used to distinguish CaMKII‐expressing ganglion cells from displaced amacrine cells (dACs).
2.1.4. Standard Immunofluorescence
Retinal tissue was processed as described previously (Weltzien et al. 2015; Masri et al. 2020; Baldicano et al. 2022). Briefly, pieces of retina (3 mm × 3 mm), including the fovea, were dissected out, embedded in agarose, and sectioned vertically at a thickness of 100 µm along the horizontal meridian using a vibratome (VT1200S, Leica Microsystems, Nussloch, Germany). The remaining retina was cut into sectors, which were processed as flat mounts. Flat mounts and sections were preincubated in 5% normal donkey serum (Jackson ImmunoResearch Laboratories Inc., PA) and 0.5% Triton X‐100 (BDH Chemicals, Kilsyth, Australia) in PBS overnight at 4°C. The tissue was rinsed in 0.1 M PBS and incubated in a mixture of primary antibodies diluted in PBS containing 3% normal donkey serum, 0.5% Triton X‐100, and 0.05% sodium azide for 7 days at 4°C. The tissue was rinsed in PB (flat mounts) or PBS (vibratome sections) and incubated in a mixture of secondary antibodies made in donkey, coupled to Alexa 488, Alexa 594, or Alexa 647 (Jackson ImmunoResearch) diluted in PBS containing 0.001% DAPI (4′,6‐diamidino‐2‐phenylindole dihydrochloride), 3% normal donkey serum, and 0.5% Triton X‐100, overnight at 4°C. The tissue was rinsed, mounted onto polylysine microscope slides, and coverslipped with Vectashield Antifade Mounting medium (Vector Laboratories Inc., Burlingame, CA). Vibratome sections were mounted within wells of adhesive spacers as described previously (Masri et al. 2020).
2.1.5. Prelabeling and DiI Injections
Immunolabeling and DiI injections were performed as described previously (Weltzien et al. 2014; Lee et al. 2016; Nasir‐Ahmad et al. 2021), applying a method developed by Kao and Sterling (2003). It should be noted that all injected cells derive from the same preparations used in our previous study (Baldicano et al. 2022), where CaMKII‐expressing ganglion cells were analyzed. Thus, our sample is biased against amacrine cells, most of which have smaller somas than the ganglion cells, which we targeted in our previous study.
Briefly, after fixation, retinal pieces were rinsed in 0.1 M PB and then incubated with a combination of anti‐mouse CaMKII (diluted 1:1000) and anti‐goat ChAT (diluted 1:100) antibodies for 3–4 days at 4°C. The tissue was rinsed in PB and incubated with a mixture of secondary antibodies made in donkey coupled to Alexa 488 or Alexa 647 diluted at 1:500 and 1:250, respectively, in PB for 2–4 h at room temperature. Glass electrodes (Harvard Apparatus Borosilicate glass capillary, made with Narishige glass puller Model #PC‐10) were filled with 1% DiI (Invitrogen) in 100% ethanol. Retinal pieces were put into a superfusion chamber, ganglion cell side up, and held in place with a grid of parallel nylon threads. Cells were viewed with a water immersion lens (40× Achroplan) using a GFP longpass filter set (No. 09; ZEISS). CaMKII‐positive cells (green fluorescence) were injected with DiI by applying a 10–20 nA positive current for 1–10 seconds, depositing a small DiI crystal inside the cell soma. Retinal pieces were incubated in a solution of 10 µg/mL DAPI in PBS at room temperature overnight. The tissue was rinsed in PBS, mounted onto a microscope slide, and coverslipped with Vectashield mounting medium. Retinas were imaged with a confocal microscope within 1 week.
2.1.6. Microscopy
Images were taken using a confocal microscope (Zeiss LSM 700 or Zeiss LSM 900) equipped with 405, 488, 555, and 639 nm lasers. Overview images were taken as tiled images with a 10×/0.45 Plan‐Apochromat objective. High‐resolution (1024 × 1024 or 2048 × 2048 pixels) tiled z‐stacks were taken of regions of interest (ROIs) with a 20× objective at ∼0.90 µm z‐plane intervals. The brightness and contrast of images were adjusted using Zen Blue software (Zeiss), Adobe Photoshop CS6, or Imaris software (Bitplane, Zurich, Switzerland).
2.1.7. Analysis
2.1.7.1. Eccentricity
Eccentricity measures the distance from the fovea in degrees or mm. The central retina is referred to as the first 12° of visual angle, up to 1.5 mm in marmosets, 2 mm in macaques, and 3 mm in humans. The mid‐peripheral retina is the region between 1.5 and 4 mm in marmosets, 2 and 6 mm in macaques, 3 and 6 mm in humans, whereas the far‐peripheral retina is the region greater than 4 mm in marmosets and 6 mm in macaques and humans, as established in previous studies (Curcio, Sloan, et al. 1990; Martin and Grünert 1992; Wilder et al. 1996). Eccentricity measurements were obtained from reconstructed confocal overview images of retinal pieces.
2.1.7.2. Spatial Density and Staining Intensity
The density of amacrine cells in the inner nuclear layer and in the ganglion cell layer was measured across the horizontal meridian from confocal image stacks of vibratome sections (central retina) and flat mounts (peripheral retina) using Zen or Imaris software. In vibratome sections, cells were counted in 200 µm wide bins in a minimum of 10–20 z‐slices, and a minimum of 20 immunolabeled cells were counted in each bin. Densities (cells/mm2) were calculated for ROIs using the formula D = n/(w × d), where D is cell density, n is the number of cells counted, w is the bin width, and d is the depth in the z‐plane. These values were chosen to give the best practical compromise between sample statistical power at each point and accurate estimates of cell density gradients (i.e., five density samples/linear mm) (Lee et al. 2019).
In flat mount preparations, a minimum of 20 immunolabeled cells was counted for each ROI (approximately 200 µm × 200 µm for RBPMS and 400 µm × 400 µm for CaMKII). Counts obtained with Zen software, and counts obtained using the spot detection tool in Imaris software, yielded comparable results.
The spot creation tool and pixel intensity threshold in Imaris software were used to quantify immunolabeled cells in the INL. Firstly, strongly CaMKII‐positive cells were detected by using the pixel‐intensity‐based automatic threshold function. Secondly, the total population of CaMKII‐positive amacrine cells was detected by manually setting a criterion pixel intensity. Thirdly, the number of weakly CaMKII‐positive cells was determined by subtracting the number of strongly labeled cells from the total population of CaMKII‐positive cells. Custom code in MATLAB (Mathworks, Natick, NJ, USA) was used to estimate the density and proportion of CaMKII‐positive amacrine cells across the retina.
The soma diameter and staining intensity of CaMKII‐positive amacrine somas were measured in 12 ROIs between 7 and 8 mm eccentricity for 40 cells per ROI from triple‐labeled preparations using Zen software. The soma diameter was determined by drawing a convex polygon around labeled somas and retrieving the intensity measurements of each channel (Alexa 488 and 594 for CaMKII and ChAT, respectively).
2.1.7.3. Morphology, Dendritic Field Diameter, and Soma Size of Injected Cells
Dendritic field diameter (DFD) and soma size of DiI‐injected cells were measured from confocal image stacks using ImageJ software (Schindelin et al. 2012) or Zen Blue software. A convex polygon was drawn by connecting the outermost dendritic tips of each cell, and the average of the minimum and maximum diameters was calculated for the DFD. Amacrine cells were initially classified on the basis of DFD (Mariani 1990; Kolb et al. 1992). Narrow‐field amacrine cells have a DFD less than 100 µm. Medium‐field amacrine cells have a DFD between 100 and 500 µm. Wide‐field amacrine cells have a DFD greater than 500 µm. The average diameter was calculated using the formula D = SQRT(A/π) × 2, where D is the diameter and A is the area. In some cases, the dye did not fill the entire cell, making it likely that some of the DFD in some wide‐field cells is underestimated.
The fine structure of the dendritic tree of each injected cell was reconstructed from confocal image stacks using the filament tracer tool in Imaris software. Cells were classified based on the level of stratification in the inner plexiform layer and the characteristics of their dendritic tree, including density or sparsity, straightness or curvature, and presence of dendritic thorns and/or varicosities. Cell stratification was determined with respect to the ChAT bands, where possible.
3. Results
3.1. CaMKII‐Expression in Marmoset, Macaque, and Human Retina
Consistent with our previous study (Baldicano et al. 2022), CaMKII immunofluorescence was present in subpopulations of amacrine cells in the inner nuclear layer, in subpopulations of ganglion cells, and in dACs in the ganglion cell layer (Figure 1). In the ganglion cell layer, CaMKII‐positive dACs were distinguished from CaMKII‐positive ganglion cells using antibodies against RBPMS (Figures 1 and 2). In the central retina, CaMKII‐positive dACs made up a low proportion of the cells in the ganglion cell layer and tended to lie close to the border with the inner plexiform layer (Figure 1, arrowheads). Three to four distinct bands of CaMKII immunofluorescence can be seen in the inner plexiform layer, one is close to the ganglion cell layer, one close to the inner nuclear layer: one located in the center, and one located in Stratum 4 (Figure 1a–d). (Figure 1a‐l)
FIGURE 1.

CaMKII expression in the central retina of marmoset (a–d), macaque (e–h), and human (i–l). Confocal images of vertical vibratome sections, which were processed with antibodies against CaMKII (magenta) and RNA‐binding protein with multiple splicing (RBPMS, green). Retina layers are visualized with Nomarski optics in (a), (e), and (i). DAPI labeling (white) is used to reveal the INL and GCL. The filled arrows point to double‐labeled cells (CaMKII‐expressing ganglion cells), and the arrowheads point to single‐labeled cells (CaMKII‐expressing amacrine cells). GCL, ganglion cell layer; INL, inner nuclear layer; IPL, inner plexiform layer. The scale bar shown in (d) = 50 µm applies to all.
FIGURE 2.

CaMKII expression in the ganglion cell layer. Confocal images of flat mount preparations from the temporal retina of marmoset (a–c), macaque (d–f), and human (g–i), which were processed with antibodies against CaMKII (magenta) and RNA‐binding protein with multiple splicing (RBPMS, green). The numbers shown on the bottom right in the right panels indicate the eccentricity in mm. The focus is on the ganglion cell layer. The filled arrows point to double‐labeled cells (CaMKII‐expressing ganglion cells). The arrowheads point to single labeled cells (CaMKII‐expressing displaced amacrine cells), with filled arrowheads indicating cells with small round somas and open arrowheads indicating cells with large somas. The scale bar shown in (a) = 50 µm applies to all.
3.2. Spatial Distribution of CaMKII‐Expressing dACs
Flat mount preparations of peripheral retina showed that in all species, many of the CaMKII‐positive dACs had small and round somas with a diameter of 8–9 µm (arrowheads in Figure 2). In addition, large and elongated somas with a diameter of 15–17 µm were seen (open arrowheads in Figure 2), indicating that there are at least two populations of dACs expressing CaMKII.
We quantified the density of the CaMKII‐positive dAC population in such double‐labeled preparations and compared it to the ganglion cell density obtained in our previous study of the same preparations (Baldicano et al. 2022). In all species, the density of CaMKII‐positive dACs decreased with the distance from the fovea (Figure 3a–c), but the CaMKII‐positive dACs nevertheless outnumbered ganglion cells in the peripheral retina (Figure 3d–f).
FIGURE 3.

Spatial density and proportion of CaMKII‐positive cells in the ganglion cell layer. The spatial density of RBPMS‐positive ganglion cells (RGC) and CaMKII‐positive displaced amacrine cells (dAC) in marmoset (a), macaque (b), and human (c) retinas plotted across the horizontal meridian. Each data point represents a sample calculated from a region of interest at various eccentricities for all CaMKII‐expressing displaced amacrine cells (magenta) and ganglion cells (RBPMS, green). Solid lines show best fit, and error bars show standard deviations. (d–f) The proportion of CaMKII‐expressing amacrine cells in marmoset (d), macaque (e), and human (f) retinas increases with distance from the fovea. Pooled data from vibratome sections and flat mount preparations. The RGC data are replotted from Baldicano et al. (2022) and pooled with the data from the triple‐labeled flat mount preparations. The data for CaMKII‐positive dACs were obtained from the same preparations.
In the marmoset, the first CaMKII‐expressing dACs are found at about 0.23 mm eccentricity, and the peak density of CaMKII dACs near 5000 cells/mm2 is at 0.74 mm eccentricity. In the peripheral retina (1.5–8 mm eccentricity), the average density of CaMKII‐positive dAC is near 700 cells/mm2, and above 7 mm eccentricity in the temporal retina, it exceeds the ganglion cell density (Figure 3a).
In the macaque, the first CaMKII‐positive dACs are found at 0.3 mm eccentricity, and their peak density is near 4000 cells/mm2 at 1.2 mm eccentricity. In the peripheral retina (2–9.4 mm eccentricity), the average density of CaMKII‐positive dAC is ∼500 cells/mm2, and above 9 mm in temporal retina, it exceeds the ganglion cell density (data not shown).
In humans, the first CaMKII‐positive dACs are found at 0.32 mm eccentricity with a peak density of ∼1,500 cells/mm2 at 1.8 mm eccentricity. The average CaMKII dAC density in the temporal retina (3–12 mm eccentricity) is ∼400 cells/mm2, and in the nasal retina (6.4–22 mm eccentricity), it is ∼200 cells/mm2. Beyond 10 mm temporally and 22 mm nasally, the CaMKII dAC density exceeds the ganglion cell density (Figure 3c).
3.3. CaMKII‐Expressing dACs Include ON ChAT Cells
As outlined above, in all species, many CaMKII‐expressing dACs have small and round somas approximately 8–9 µm in diameter, which is characteristic of starburst amacrine cells (Vaney 1990; Rodieck and Marshak 1992). To determine whether CaMKII‐positive amacrine cells include starburst cells, we double‐labeled sections through the central retina of the marmoset and the macaque with antibodies against CaMKII and ChAT. The two markers were co‐expressed in the GCL but not in the INL (Figure 4a–f). In marmoset retina (1.5–2 mm eccentricity), about 97% of the ON‐ChAT cells were CaMKII‐positive (236/244). In the macaque retina (eccentricities 0.3–2.4 mm), 99% of the ON‐ChAT cells co‐expressed CaMKII (264/266).
FIGURE 4.

CaMKII‐positive amacrine cells include ON ChAT cells. Confocal images of vertical vibratome sections through the central retina of marmoset (a–c) and macaque (d–f) retinas. Sections were processed with antibodies against CaMKII (magenta) and choline acetyltransferase (ChAT, green). Retina layers are visualized using Nomarski optics in (a, b, d, e). (g–l) Confocal images of flat mount preparations of marmoset (g, h), macaque (i, j), and human (k, l) retinas, which were triple labeled with antibodies against CaMKII (magenta), ChAT (green), and the ganglion cell marker RBPMS (white). The focus is on the ganglion cell layer. The white arrows point to double‐labeled cells (CaMKII‐positive/ChAT‐positive), white arrowheads point to single‐labeled CaMKII‐positive cells, and asterisks indicate CaMKII‐positive ganglion cells. Numbers shown on the bottom right in the right panel indicate eccentricity in mm. Scale bars = 50 µm. The scale bar in (c) applies to (a–f). The scale bar in (g) applies to (g–i).
To determine the proportion of ON‐ChAT cells within the population of CaMKII‐expressing dACs, we triple‐labeled flat mount preparations from the peripheral retina of marmosets, macaques, and humans with antibodies against CaMKII, ChAT, and RBPMS. Cells co‐expressing CaMKII and ChAT have small round nuclei (arrows in Figure 4g–l) in all species. However, in the human retina, we also noticed ChAT cells that do not co‐express CaMKII (open arrowheads in Figure 4k,l). All species have additional CaMKII‐positive dACs (CaMKII‐positive/RBPMS‐negative cells), which usually have a large and strongly stained soma (arrowheads in Figure 4g–l).
Using these flat mount preparations, we quantified (i) CaMKII‐expressing dACs (CaMKII‐positive/RBPMS‐negative cells), (ii) ON‐ChAT cells, and (iii) double‐labeled cells (CaMKII‐positive/ChAT‐positive). The data are plotted in Figure 5 together with the data from the double‐labeled vibratome sections from the central retina. As expected, in marmosets and macaques, the population of double‐labeled cells largely overlaps with the ON ChAT cells, making up a small percentage of the total CaMKII‐positive dACs. In the human retina, double‐labeled cells make up a lower proportion of the total CaMKII‐positive dACs. In the following, the data for the three species are presented in more detail.
FIGURE 5.

Spatial density of CaMKII‐expressing displaced amacrine cells (magenta), ON ChAT cells (cyan), and cells expressing both markers (yellow) in marmoset (a), macaque (b), and human (c) retinas. Each data point represents a sample calculated from a region of interest at various eccentricities. Pooled data from vibratome sections and flat mount preparations. Data from the central retina were obtained from double‐labeled vibratome sections (CaMKII and ChAT). Data in the peripheral retina were obtained from triple‐labeled flat mount preparations (CaMKII, ChAT, RBPMS).
In the marmoset retina, the density of ON‐ChAT cells (average 480 cells/mm2, peak density 990 cells/mm2) is comparable to previously reported densities (Moritoh et al. 2013). At eccentricities beyond 2 mm, 90% of the ON‐ChAT cells (1608/1778) co‐express CaMKII (Figure 5a). The double‐labeled cells make up around 80% (1608/2022) of the CaMKII‐positive dACs.
In the macaque retina, the density of ON starburst cells (Figure 5b) is comparable to the densities reported previously (Mariani and Hersh 1988; Rodieck and Marshak 1992), with a peak density close to 1000 cells/mm2. At eccentricities beyond 2 mm, all ON‐ChAT cells (1373/1374) co‐express CaMKII (Figure 5b). The double‐labeled cells make up about 74% (1373/1864) of the CaMKII‐expressing dACs.
In humans, the average density of ON ChAT cells (Figure 5c) in the peripheral temporal retina (∼150 cells/mm2) is comparable to that in previous reports (Rodieck and Marshak 1992). Only 58% of ON‐ChAT cells co‐express CaMKII (752/1300, Figure 5c), indicating that in humans there are two populations of ON‐ChAT cells. Conversely, ChAT cells co‐expressing CaMKII make up about 55% (752/1364) of the CaMKII‐expressing dACs. In summary, our findings provide further support for the idea that CaMKII‐positive dACs include ON‐starburst cells as well as additional amacrine cell types.
3.4. Morphology of CaMKII‐Expressing dACs
DiI‐injected CaMKII‐positive dACs were distinguished from ganglion cells based on soma size and shape and the lack of an axon directed toward the optic disk. The DFD, dendritic tree patterns, and depth of dendritic stratification were taken into account to classify these cells into morphological types. The terminology we use here is based on that proposed by Mariani (1991) and Kolb et al. (1992). Of note, most wide‐field cells were underfilled, and therefore, most of our DFD measurements are underestimates. As outlined in the methods, the DiI‐injected cells derive from our previous study, where we mainly targeted large somas for retinal ganglion cell injections (Baldicano et al. 2022). The sample of cells presented here thus is biased; that is, ON starburst cells (which have small somas) are underrepresented.
3.4.1. Marmoset
In the marmoset retina, a total of eighteen CaMKII‐positive cells (16 wide‐field and two starburst cells) were injected. A total of 11 cells were classified as semilunar Type 3 cells (Figure 6a,b). They are characterized by two to three primary dendrites and an oval soma (Figure 6a inset) with a relatively large diameter (average 18.9 µm, SD 1.7 µm, range 16–22 µm, 11 cells). The DFD ranged from 500 µm to at least 760 µm. The dendritic tree is sparse with few branching points and small varicosities. It stratifies narrowly in Stratum 5 of the IPL (Figure 6a, lower panel). The cells have fine axon‐like processes (arrows in Figure 6a,b) that arise from either the soma or the primary dendrite and branch off at a distance of about 50 µm. The axon‐like processes stratify in S5.
FIGURE 6.

Morphology of DiI‐injected CaMKII‐positive displaced amacrine cells in marmoset retina. Confocal images and reconstructions of DiI (red) injected CaMKII‐positive displaced amacrine cells. The eccentricity in mm for each cell is indicated in the lower right corner. (a) confocal image and (b) drawing of a semilunar Type 3 cell. The inset shows the CaMKII‐positive soma. A thin axon‐like process is seen emerging from the soma (arrows). The lower panel shows an orthogonal projection revealing the dendritic stratification (red) and DAPI labeling (blue). The dendrites of the cell sit flush against the GCL. (c–d) Confocal images of two CaMKII‐positive semilunar Type 3 cells with thorny dendrites. The upper left panels show the CaMKII‐positive somas, and the upper right panels show close‐ups of the boxed region. Numerous thorny processes can be seen emerging from the dendrites. The arrow points to a fine axon‐like process. Lower panels show the dendritic stratification close to the GCL. (e) ON‐starburst cell. Top: Confocal images of the soma of a DiI‐injected (red) CaMKII‐positive (green) ON starburst cell. The soma co‐expressed CaMKII (green) and ChAT (cyan). Middle: Drawing of the injected cell. The lower panel shows the dendritic stratification. INL, inner nuclear layer; IPL, inner plexiform layer; GCL, ganglion cell layer. The scale bar shown in (a) = 100 µm applies to (a, b, and the middle panels of c, d, and e). The scale bar shown in the inset (a) = 10 µm and applies to all soma images. The scale bar shown in the lower panel (a) = 50 µm applies to all lower panels. The scale bar shown in the top right panel (c) = 20 µm applies to (top right panels in c and d).
Five cells have a similar morphology and stratification to semilunar Type 3 cells, but their dendrites bear fine (sometimes long) thorns (Figure 6c,d). The somas of these cells have smaller diameters (average 12.1 µm, SD 1.6 µm) and smaller DFDs (range 380–500 µm). Cells with this morphology have not been described previously; we have tentatively named them thorny semilunar Type 3 cells.
The two ON‐starburst cells found here have wavy dendrites with a few thorns (Figure 6e). Their dendrites stratify in Stratum 4, in line with the inner ChAT band. The somas of both cells express ChAT in addition to CaMKII, are round, and have an average diameter of 9.8 µm (Figure 6f–h). The DFD of the starburst cells is ∼150 µm. We conclude that in the marmoset retina, CaMKII is expressed in semilunar Type 3 cells (including thorny semilunar Type 3) and ON starburst cells.
3.4.2. Macaque
In the macaque retina, five CaMKII‐positive dACs were injected, four cells were classified as semilunar Type 3 cells, and one as an ON‐starburst cell. The semilunar Type 3 cells resembled their counterparts in the marmoset retina described above with respect to their morphology and dendritic stratification (Figure 7a,b). The cell shown in Figure 7a,b has a soma diameter of 12.1 µm and a DFD of about 612 µm. A few small thorns and varicosities are seen on the sparse dendrites. The fine axon‐like process originates at the soma, branches several times, and stratifies in S5 together with the dendrites of the cell.
FIGURE 7.

Morphology of CaMKII‐positive displaced amacrine cells in macaque retina. Confocal images and reconstructions of DiI (red) injected CaMKII‐positive cells. Eccentricity in mm for each cell is indicated in the lower right corner. (a) Confocal image of a semilunar Type 3 cell. The inset shows the soma of the injected cell. (b) Drawing of the cell shown in (a). The arrow points to the fine axon‐like process of the cell. Bottom panel: orthogonal projection of a stack of images revealing dendritic stratification (red) and DAPI labeling (blue). (c) Drawing of a CaMKII‐positive ON starburst cell. The soma of the DiI‐injected ON starburst cell shown on the left co‐expresses CaMKII (green) and ChAT (cyan). INL, inner nuclear layer; GCL, ganglion cell layer; IPL, inner plexiform layer. The scale bar shown in (a) = 100 µm applies to (a, b, and c). The scale bar shown in soma images = 10 µm. The scale bar shown in the bottom panels (orthogonal views) = 50 µm.
The starburst cell has sparse wavy dendrites with small varicosities that distally end in hooks (Figure 7c). The DFD of this cell is 225 µm, and the small soma is 9.7 µm in diameter and is immunoreactive to CaMKII and ChAT (Figure 7c, right panels). The dendrites stratify in Stratum 4 (Figure 7c, lower right panel).
3.4.3. Human
In the human retina, we analyzed 25 CaMKII‐expressing amacrine cells. Most cells had stellate morphology characterized by three to four primary dendrites that branch close to the soma with fine radiating dendrites (Figure 8). In addition, we found examples of semilunar cells (Figure 9a,b) and a thorny Type 2 cell (Figure 9c).
FIGURE 8.
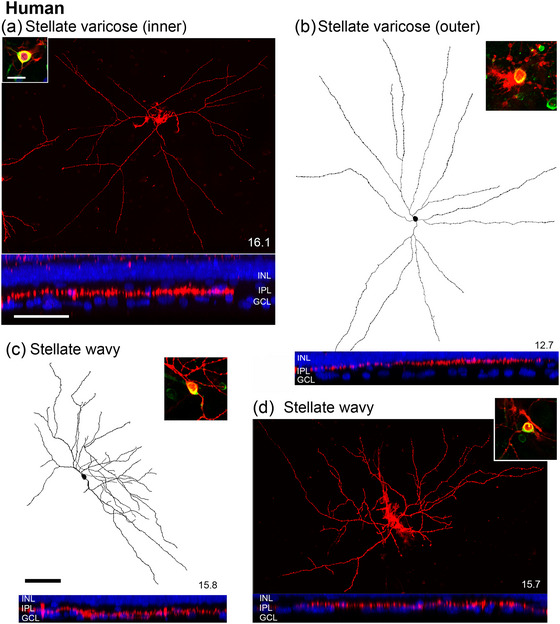
Morphology of CaMKII‐positive displaced amacrine cells in human retina. Confocal images and reconstructions of DiI (red) injected cells. Insets show somas of CaMKII (green) injected cells. The eccentricity in mm of each cell is in the lower right corner. The lower panels show orthogonal projections revealing dendritic stratification (red) and DAPI labeling (blue). (a) Confocal image of an inner stratifying stellate varicose cell. (b) Reconstruction of an outer stratifying stellate varicose. (c) Reconstruction of a stellate wavy cell. (d) Micrograph of a stellate wavy cell. The inset scale bar = 20 µm applies to all soma images. The scale bar shown in the lower panel (a) = 50 µm applies to all lower panels. The scale bar shown in (c) = 100 µm applies to (a–d).
FIGURE 9.

Morphology of CaMKII‐positive displaced amacrine cells in human retina. Confocal images and reconstructions of DiI (red) injected cells. Insets show somas of CaMKII (green) injected cells. Eccentricity in mm of each cell is shown in the lower right corner. (a–c lower panels) Orthogonal projections revealing dendritic stratification (red) and DAPI labeling (blue). (a) Semilunar Type 3 cell. The cell stratifies close to the ganglion cell layer in S5. (b) Semilunar Type 1 cell. The cell stratifies in S1. (c) Thorny Type 2 cell. The cell stratifies in the middle of the IPL. The boxed region indicates the inset shown on the bottom right. Arrows point to axons. The scale bar shown in (a) = 100 µm applies to (a, j, and all drawings). The inset scale bar = 20 µm applies to all soma insets. The scale bar shown in (a) lower panel = 50 µm applies to all orthogonal projections. The scale bar shown in the inset (d) = 20 µm.
Nine cells were classified as stellate varicose cells (Figure 8a,b). The dendrites of stellate varicose cells originate from the soma, branch radially, and are characterized by prominent varicosities. The DFD ranges from ∼500 to 800 µm. The somas of these cells are usually oval‐shaped (Figure 8a,b, insets). Three cells stratify narrowly in S2 near the outer ChAT band (Figure 8b, lower panel, outer stratifying) and are comparable to their counterparts described in Golgi preparations (Mariani 1990; Kolb et al. 1992). Six stellate varicose cells stratify near the border of S4 and S5 (Figure 8a, lower panel, inner stratifying). Inner stratifying stellate varicose cells have not been reported previously. The average soma diameter of outer stellate varicose cells is 14.3 µm, SD 1.2 µm (n = 3), and that of inner stellate varicose cells is 13.9 µm, SD 1.5 µm (n = 6).
Eight cells were classified as stellate wavy cells (Figure 8c, d). The dendritic tree of these cells (diameter about 500 µm) is usually asymmetric, with the major dendrites oriented towards one direction. The dendrites are wavy with few thorns and varicosities and stratify broadly across S3 and S4 (Figure 8c,d, lower panels). The somas are oval‐shaped (Figure 8c,d, insets) with an average soma diameter of 13.3 µm, SD 1.6 µm (n = 8).
Four cells were classified as semilunar cells (Types 1 or 3). Three cells were classified as semilunar Type 3 cells based on their stratification in S5 (Figure 9a, lower panel). In common with their counterparts in marmosets and macaques (see above), these cells have two primary dendrites, which emerge from the soma and branch in opposite directions (Figure 9a,b). The DFD of the most completely filled cell is ∼800 µm. The dendritic tree is very sparse with a few small varicosities. One cell has long, fine, thorny processes (not shown) and appeared comparable to the thorny semilunar cells injected in the marmoset retina (Figure 6c,d). The fine axon‐like processes were usually underfilled but appeared to be stratifying together with the dendrites in S5 of the IPL. The somas of a semilunar Type 3 cell are large and oval (Figure 9a inset) with an average soma diameter of 17.7 µm, SD 2.8 µm, n = 3. One cell was classified as a semilunar cell Type 1 cell based on its stratification in S1 of the IPL (Figure 9b, lower panel). The soma diameter of this cell is 18.2 µm, and its DFD is ∼600 µm, although this cell is likely underfilled.
One cell was classified as a thorny Type 2 cell (Figure 9c). The cell has two thick primary dendrites emerging from the soma. The dendrites all have thick varicosities and many long thorny dendritic processes stratifying in the middle of the IPL (Figure 9c, lower panel). The DFD is ∼600 µm, and the soma is 13.7 µm in diameter (Figure 9c, upper inset). This cell also has thin, long axon‐like processes that branch and stratify in S3 and S5 of the IPL.
In summary, in the human retina, CaMKII is expressed by a variety of dAC types, including stellate varicose, stellate wavy, semilunar Types 1 and 3, thorny Type 2, and starburst cells.
3.5. Soma Characteristics of CaMKII‐Expressing dACs in Humans
We asked whether the somas of CaMKII‐expressing dACs in the human retina can be distinguished by morphological characteristics. Figure 10 shows examples of somas from DiI‐injected CaMKII‐expressing dACs in the human retina. While there were similarities in the shape and soma size, they were not consistent, and subtle differences can also be observed. Stellate varicose cells have oval or triangular‐shaped somas with a roundish nucleus (Figure 10a–c). Stellate wavy cells have oval somas with an ovoid‐shaped nucleus (Figure 10d–f). Semilunar cells have the largest somas of the three types (see above), which are oval‐shaped and usually give rise to two thick dendrites (Figure 10g–i).
FIGURE 10.

CaMKII‐positive amacrine somas in the ganglion cell layer in the human retina. Confocal images of DiI‐injected CaMKII‐positive amacrine cell somas (green). The blue channel shows DAPI‐labeled cell nuclei. SL1, semilunar Type 1; SL3, semilunar Type 3; StV inner, inner stratifying stellate varicose cell; StW, stellate wavy cell. The scale bar = 10 µm, applies to all.
We further asked whether different soma types can be distinguished based on their staining intensity (Figure 11). There is an overlap of CaMKII‐positive cells and ChAT‐positive cells at a soma size of 8–10 µm, which is in line with our findings that CaMKII‐expressing ChAT cells have small somas. The graphs further show that there are differences in the soma sizes between the three species, with marmosets having the smallest and humans the largest diameters. CaMKII‐positive cells with somas > 10 µm are present in all species and tend to have higher staining intensity. We suggest that in the human retina, the strongly labeled cells with a soma size of > 15 µm might be the semilunar Type 3 cells, and cells with a soma size > 11 µm and < 15 µm include stellate and thorny Type 2 cells.
FIGURE 11.

Staining intensity and soma sizes of CaMKII‐positive displaced amacrine cells of marmoset (a), macaque (b), and human (c) retina. Overlapping soma sizes represent starburst cells co‐expressing both markers.
3.6. CaMKII‐Expressing Amacrine Cells in the INL
CaMKII‐expressing amacrine cells in the INL were studied in the same triple‐labeled (CaMKII, ChAT, RBPMS) flat mount preparations that were used for studying the dACs (see above). We observed three populations of cells: (i) strongly CaMKII‐positive cells, (ii) weakly CaMKII‐positive cells, and (iii) ChAT‐positive cells (Figure 12). Double‐labeled cells were not encountered. In marmosets and humans, but not in macaques, we further noticed that there are differences within the population of ChAT cells with respect to their staining intensity (open arrowheads in Figure 12).
FIGURE 12.

OFF ChAT cells do not express CaMKII. Confocal images of flat mount preparations from marmoset (a), macaque (b), and human (c) retinas processed for CaMKII (magenta) and ChAT (green) immunofluorescence. The focus is on the inner nuclear layer (INL). CaMKII is not colocalized with ChAT. The white arrows point to large, strongly labeled CaMKII‐positive cells; the open arrows point to weakly labeled CaMKII‐positive cells. The white arrowheads point to strongly labeled ChAT cells, and the open arrowheads point to weakly labeled ChAT cells. The eccentricity in mm is indicated in the lower right corner. Scale bar in (a) = 50 µm, applies to (a–c).
The spatial distribution of the three populations of cells is plotted in Figure 13. In the marmoset retina (Figure 13a), the average density of OFF ChAT cells (1148 cells/mm2) is comparable to that previously reported (Moritoh et al. 2013). Thus, consistent with these previous findings, in marmosets OFF ChAT cells have a higher density than ON ChAT cells (average 480 cells/mm2, see above). The density of OFF ChAT cells is also higher than that of the two populations (strongly plus weakly labeled) of CaMKII‐expressing amacrine cells (average 271 cells/mm2). The strongly CaMKII‐expressing cells have an average density of 65 cells/mm2, and the average density of the weakly CaMKII‐expressing cells is 206 cells/mm2.
FIGURE 13.

Spatial density of CaMKII‐expressing amacrine cells and OFF starburst cells in the inner nuclear layer (INL) of marmoset (a), macaque (b), and human (c) retinas. Each data point represents a sample calculated from a region of interest at various eccentricities of strongly CaMKII‐expressing (magenta circles), weakly CaMKII‐expressing (light pink squares), and OFF starburst cells (ChAT, cyan diamonds).
In the macaque retina (Figure 13b), OFF ChAT cells have an average density of 11 cells/mm2, which is somewhat lower than in previous reports of around 50 cells/mm2 (Rodieck and Marshak 1992). Thus, as reported previously and consistent with findings in Golgi preparations (Rodieck 1989), in the macaque retina, ON ChAT cells outnumber OFF ChAT cells. The average density of the weakly CaMKII‐positive cells (198 cells/mm2) is comparable to that of the strongly labeled CaMKII‐positive cells (166 cells/mm2), and both populations outnumber OFF ChAT cells (average 364 cells/mm2).
In the human retina (Figure 13c), the average density of OFF ChAT cells was 703 cells/mm2. This number includes weakly as well as strongly ChAT‐positive cells (Figure 12c) and thus is considerably higher than that in previous reports (Rodieck and Marshak 1992), which probably only counted strongly labeled cells. Whether both strongly and weakly labeled ChAT cells represent OFF starburst amacrine cells remains to be determined. The average density of all CaMKII‐expressing amacrine cells in the INL of humans was 598 cells/mm2, that of strongly CaMKII‐expressing cells was 155 cells/mm2, and that of weakly CaMKII‐expressing cells was 444 cells/mm2. Thus, in humans, as in the marmoset retina, OFF ChAT cells outnumber CaMKII‐expressing amacrine cells in the INL, with the strong CaMKII‐expressing cells forming the lowest proportion.
3.7. Morphology of CaMKII‐Expressing Amacrine Cells in the INL
As outlined above, for the DiI injections, the ganglion cell layer was targeted, but we also injected a few cells in the INL. In the macaque retina, a single CaMKII‐positive cell located in the INL was injected. The cell has a small round soma with a diameter of 9 µm and a DFD of 106.5 µm and is thus a narrow‐field amacrine cell. The cell is bistratified with varicose, wavy, overlapping dendrites bearing some thorns (Figure 14). It has an extensive inner dendritic tree, which stratifies broadly near the GCL in S4/5, and a smaller outer dendritic tree, which stratifies narrowly close to the INL in S1/2. The cell was classified as a knotty bistratified Type 2 cell as described by Mariani (1990). Based on the soma characteristics of this cell, it is likely that the small and strongly CaMKII‐positive cells are narrow‐field knotty bistratified cells.
FIGURE 14.

Morphology of a CaMKII‐positive amacrine cell in the INL of macaque retina. (a–c) Confocal images of a DiI‐injected knotty bistratified amacrine cell at 6.1 mm eccentricity. (b) Outer dendrites. (c) Inner dendrites. (d–e) Soma of the CaMKII injected cells (green). (f) Orthogonal projection revealing dendritic stratification (red) and DAPI labeling (blue). (g) and (h) 3d reconstruction of the cell shown in (a‐c). The scale bar shown in (a) = 50 µm applies to (a–c, g). The scale bar shown in (d) = 10 µm applies to (d) and (e). Scale bar in (f) = 50 µm. The scale bar in (h) = 10 µm.
In the human retina, one of the cells classified as outer stellate varicose has a soma (diameter 12.6 µm) located in the INL (Figure 15a), and one inner stellate varicose cell has its soma (diameter 14 µm) located in the IPL (Figure 15b). These cells otherwise resemble their displaced counterparts (Figure 8) with a DFD of close to 600 µm, indicating that stellate cells can be located either in the INL, IPL, or GCL.
FIGURE 15.

Morphology of two CaMKII‐positive amacrine cells in the human retina, located in the inner nuclear layer (INL) and inner plexiform layer (IPL), respectively. The scale bar shown in a = 100 µm applies to all.
3.8. Soma Characteristics of CaMKII‐Expressing Amacrine Cells in the INL
The strongly and weakly labeled cells were further investigated using triple‐labeled preparations (Figure 12). We measured the staining intensity of CaMKII‐positive amacrine cells and compared it to their soma size (Figure 16). Consistent with the finding outlined above that CaMKII and ChAT are not co‐expressed in the INL, there is no overlap of ChAT‐positive with CaMKII‐positive cells. ChAT‐positive cells have the smallest soma diameter of approximately 7–9 µm in all species. Weakly CaMKII‐positive cells have a soma diameter of 7–10 µm in marmosets, and between 8 and 12 µm in macaque and human retinas. Strongly CaMKII‐positive cells have larger soma diameters of 9–11 µm (marmoset), 8–17 µm (macaque), and 9–15 µm (human). On average, the strongly CaMKII‐expressing cells in the INL have larger somas than the weakly CaMKII‐expressing cells; however, the specific cell types have yet to be identified.
FIGURE 16.

Staining intensity and soma sizes of CaMKII‐positive amacrine cells in the inner nuclear layer of marmoset (a), macaque (b), and human (c) retina. Strongly CaMKII‐positive (purple circles), weakly CaMKII‐positive (brown squares), and ChAT‐positive (green diamonds) cells can be distinguished by soma size.
4. Discussion
The present study is an extension of our previous investigation of CaMKII‐expressing retinal ganglion cells in marmoset, macaque, and human retina (Baldicano et al. 2022). Here, we mostly analyzed the same preparations to study CaMKII‐expressing amacrine cells with the aim of characterizing dACs. Our finding that CaMKII‐expressing dACs outnumber ganglion cells in the peripheral retina is in line with previous studies showing that in the far peripheral retina of macaque (Wässle et al. 1989), human (Curcio and Allen 1990), and marmoset (Haverkamp et al. 2021), there is a high proportion of dACs in the ganglion cell layer. The question of which fraction of the total dAC population is made up by CaMKII‐expressing dACs will need to be addressed in future studies.
4.1. Comparison of Morphological and Molecular Types of Amacrine Cells Expressing CaMKII
We found that in all three primate species, the somas of the CaMKII‐positive dACs varied in size and staining intensity (Figures 11 and 16), suggesting that CaMKII‐positive cells include a variety of amacrine cell types. Our findings are supported by single‐cell RNA sequencing studies reporting multiple clusters of CaMKII‐expressing amacrine cells (Peng et al. 2019; Cowan et al. 2020; Yan, Peng, et al. 2020). Figure 17 shows clusters of CaMKII‐expressing amacrine cells obtained in macaque (Peng et al. 2019) and human retinas (Yan, Peng, et al. 2020). The data are plotted together with markers for known amacrine types: SLC18A3 for starburst (SAC) cells, GJD2 for AII amacrine cells, TH for dopaminergic amacrine cells, and CALB2 for calretinin‐expressing amacrine cells. While there are consistencies between the molecular and the transcriptomic data, there are also some discrepancies. For example, our immunofluorescence and cell injection data (summarized in Figure 18) show that in all species, the CaMKII‐expressing dACs include ChAT‐expressing ON starburst cells. This finding matches the transcriptomics data in macaque retina but not in human retina, where the CAMK2A clusters do not include starburst cells (Figure 17).
FIGURE 17.

Dot plots showing the relative expression of CaMKII (CAMK2A) and other genetic markers in amacrine cell clusters of human and macaque retina. The size of the circle indicates the percentage of cells expressing the gene, and the color indicates the relative expression level. Human data are from Yan, Peng, et al. (2020), macaque data are from Peng et al. (2019). The purple highlight represents clusters with CaMKII expression. AII, AII amacrine cell; SAC, starburst amacrine cell.
FIGURE 18.

Schematic summary diagram showing the soma location and stratification of CaMKII‐expressing amacrine cells in marmoset, macaque, and human retinas. The grey bands represent the stratification of ChAT‐positive starburst cells, which delineate the five strata (S1–S5) of the IPL. Axon stratification is indicated in dark blue. GCL, ganglion cell layer; INL, inner nuclear layer; IPL, inner plexiform layer.
The transcriptomics data shown in Figure 17 further indicate that CaMKII‐expressing amacrine cells include multiple types of wide‐field (presumed GABAergic) dACs. In the macaque retina, the number of genetic clusters is greater than the number of morphological types detected in the present study. However, we only injected a very small sample (n = 5) of dACs in macaque, and thus the number of morphological types is most likely an underestimate. It is noteworthy that in macaque, we identified one narrow‐field (presumed glycinergic) cell located in the INL, and one of the glycinergic transcriptomic clusters (pGl4, Figure 17b) expresses CaMKII. The injected cell was classified as a knotty bistratified Type 2 and thus is morphologically and transcriptomically different from previously identified glycinergic cells by Peng et al. (2019).
As outlined in the result section, most wide‐field CaMKII‐positive amacrine types identified in the present study resemble previously described morphological cell types (Kolb et al. 1992; Mariani 1990). All cell types identified here most likely express additional neuroactive substances. CaMKII‐expressing semilunar Type 1 cells in the present study had their soma in the ganglion cell layer, whereas previous Golgi studies report that the soma of semilunar Type 1 cells is usually located in the inner nuclear layer (Mariani 1990; Kolb et al. 1992). A more recent immunofluorescence study of neuropeptide Y (NPY) expression in the human retina, however, identified semilunar Type 1 cells with somas in the inner nuclear as well as the ganglion cell layer (Christiansen et al. 2018). This latter study also reported that semilunar Type 1 cells co‐express NPY and calretinin. Thus, it is possible that semilunar Type 1 cells express all three markers (NPY, calretinin, and CaMKII) and thus might be represented by genetic clusters Gaba10 or Gaba11 in humans (Figure 17).
All (Mariani 1990; Kolb et al. 1992) CaMKII‐expressing semilunar Type 3 cells found in the present study had their soma in the ganglion cell layer, and their dendrites and fine axon‐like processes were found in S5 close to the ganglion cell layer. Cells with similar morphology and soma location were found in CaMKII‐immunolabeled preparations of macaque retina but were classified as ganglion cells (Calkins et al. 2005). Here we noticed a variety of the semilunar Type 3 cells, which were characterized by multiple dendritic thorns and a slightly smaller soma size. It is possible that the thorny semilunar Type 3 cells form a different functional type, but it should be noted that the semilunar Type 3 cell drawn from Golgi preparations in the human retina also displays some thorns (Kolb et al. 1992), whereas its counterpart in macaque appears to be smooth (Mariani 1990). Further studies, including EM reconstructions, will be needed to see whether these are different cell types and if there are differences in the connectivity of these cells.
Additional CaMKII‐expressing wide‐field dAC types identified in the human retina are stellate varicose and stellate wavy cells, and an example of a thorny Type 2 cell. In previous Golgi studies the stellate cells were reported to have their soma in the INL, whereas thorny Type 2 cells are found in the IPL and/or the GCL (Mariani 1990; Kolb et al. 1992), suggesting that the soma position of these cell types does not influence their morphology. Whether these types are equally distributed in INL and GCL needs further investigation.
Semilunar, stellate, wavy, and stellate varicose cells in human and marmoset retinas were previously reported to express calretinin (Kántor et al. 2016; Lee et al. 2016; Chandra et al. 2017), suggesting that CaMKII and calretinin (CALB2) are co‐expressed in these cells. Thus, these cell types may be represented in one of the transcriptomic clusters co‐expressing the two markers (Gaba9, Gaba10, and Gaba15; Figure 17). One of these clusters (Gaba15), however, is thought to represent dopaminergic amacrine cells (Yan, Peng, et al. 2020), which clearly have a different morphology from stellate cells.
Taken together, our results show that transcriptomic and immunofluorescence data can be matched reasonably well, but they also support the judgment that comparing protein and gene expression needs to be treated with caution (Fortelny et al. 2017; Buccitelli and Selbach 2020). Moreover, it is important to keep in mind that the single‐cell RNAseq data include conventionally placed amacrine cells as well as dACs, whereas our data mainly derive from dACs. Future studies involving spatial transcriptomics to investigate the molecular expression of dACs and INL amacrine cells separately would be required for a more accurate representation.
4.2. Molecular Properties of ON‐ChAT and OFF‐ChAT Cells
We found that ON‐ChAT but not OFF‐ChAT cells co‐express CaMKII suggesting some molecular differences between ON and OFF cholinergic cells in primates. Differences between the ON‐ChAT and the OFF‐ChAT populations have also been reported with respect to calbindin expression in primates, including humans (Chandra et al. 2019; C. Zhang et al. 2019; Sánchez‐Sáez et al. 2023) and ground squirrel retinas (Cuenca et al. 2003), but in rodent retinas, both ON and OFF ChAT cells co‐express CaMKII (Ochiishi et al. 1994; Tetenborg et al. 2017) and also share some other transcription factors (Galli‐Resta et al. 1997; Whitney et al. 2014). Further evidence for differences within ChAT cells in primates comes from the finding in the present study that in humans (see also Sánchez‐Sáez et al. 2023) and in marmosets, but not in macaques, OFF ChAT cells comprise weakly and strongly labeled populations.
Transcriptomics studies of primates and mice to date have only reported a single molecular cluster of starburst cells: macaque (Peng et al. 2019), human (Cowan et al. 2020; Yan, Peng, et al. 2020), marmoset (Zhang et al. 2024), and mouse (Yan, Laboulaye, et al. 2020; J. Li, Choi, et al. 2024). On the other hand, there is evidence for molecular differences between ON and OFF ChAT cells during the development of the mouse retina (C. Zhang et al. 2019; Peng et al. 2020). Moreover, recent studies report functional differences between ON and OFF ChAT cells in mouse retina (Gangi et al. 2024), and in zebrafish retina, two types of GABAergic/cholinergic amacrine cells, which differ genetically, morphologically, and functionally, are distinguished (Y. Li, Yu, et al. 2024). In summary, it remains to be seen whether ON and OFF ChAT cells in primates can be functionally subdivided.
4.3. Conclusions and Functional Considerations
Here we show that in primates the population of dACs expressing CaMKII includes ON ChAT cells and multiple types of wide‐field amacrine cells. The functional role of ON starburst in direction selectivity is well established for mouse and rabbit (see review by Vaney et al. 2012), and more recently, their involvement in direction selectivity in macaque retina has been reported (Kim et al. 2022; Wang et al. 2023).
The functional roles of the other amacrine types found here are much less understood. The semilunar cells and the thorny Type 2 belong to the population of axon‐bearing or polyaxonal amacrine cells. Multi‐array recordings from macaque retina suggested that an electrically coupled polyaxonal cell could inhibit the activity of ON‐parasol cells (Greschner et al. 2016). Cells with semilunar Type 3 morphology were found to be tracer‐coupled to ON‐parasol cells (Dacey and Brace 1992; Jacoby et al. 1996), whereas an EM study recently showed that semilunar cells make conventional synapses onto ON‐parasol cells (Patterson et al. 2020). Bordt et al. (2021) report that stellate wavy cells provide some of the amacrine input to broad thorny cells, but apart from these fragments of knowledge, nothing is known about their synaptic connectivity and function.
In the central nervous system, CaMKII is best known for its role in synaptic plasticity, learning, and memory (see review by Yasuda et al. 2022). Studies in rabbit retina suggest that CaMKII mediates the regulation of gap junction coupling in the network of AII amacrine cells (Kothmann et al. 2012). In mouse retina, CaMKII plays a neuroprotective role in retinal ganglion cell survival after excitotoxic and axonal injuries (Guo et al. 2021), but it has also been found to suppress optic nerve axon regeneration (Xia et al. 2024). In the marmoset retina, we recently found that CaMKII‐expressing wide‐field retinal ganglion cells showed a higher survival rate compared to midget ganglion cells after transsynaptic degeneration following cortical lesions (Sepehrisadr et al. 2024). These findings underscore the need for further investigation into CaMKII signaling pathways as therapeutic targets for optic neuropathies.
Conflicts of Interest
Dr. Grünert is an editorial board member of The Journal of Comparative Neurology and the corresponding author of this article. To minimize bias, they were excluded from all editorial decision‐making related to the acceptance of this article for publication.
Ethics Statement
The experiments described here have been approved by the Monash University Animal Ethics Committee, Melbourne, and the University of Sydney Human Research Ethics Committee.
Peer Review
The peer review history for this article is available at https://publons.com/publon/10.1002/cne.70078
Acknowledgments
We thank Marcello Rosa, Yan Wong, Katrina Worthy, and Farshad Mansouri at Monash University, Melbourne, for providing marmoset and macaque retinas. We also thank Sammy Lee for cell injections, Arzu Demir, Subha Nasir‐Ahmad, and Mario Novelli for excellent technical assistance, and Ling Zhu for helpful discussions.
Open access publishing facilitated by The University of Sydney, as part of the Wiley ‐ The University of Sydney agreement via the Council of Australian University Librarians.
Funding: This study was supported by the Australian Research Council Centre of Excellence for Integrative Brain Function (CE140100007 to U.G. and P.R.M.).
Data Availability Statement
The data that support the findings of this study are available from the corresponding author upon reasonable request.
References
- Baldicano, A. K. , Nasir‐Ahmad S., Novelli M., et al. 2022. “Retinal Ganglion Cells Expressing CaM Kinase II in Human and Nonhuman Primates.” Journal of Comparative Neurology 530: 1470–1493. [DOI] [PMC free article] [PubMed] [Google Scholar]
- Bordt, A. S. , Patterson S. S., Girresch R. J., et al. 2021. “Synaptic Inputs to Broad Thorny Ganglion Cells in Macaque Retina.” Journal of Comparative Neurology 529: 3098–3111. [DOI] [PMC free article] [PubMed] [Google Scholar]
- Boycott, B. B. , and Dowling J. E.. 1969. “Organization of the Primate Retina: Light Microscopy.” Philosophical Transactions of the Royal Society of London Series B‐Biological Sciences 255: 109–176. [DOI] [PubMed] [Google Scholar]
- Buccitelli, C. , and Selbach M.. 2020. “mRNAs, Proteins and the Emerging Principles of Gene Expression Control.” Nature Reviews Genetics 21: 630–644. [DOI] [PubMed] [Google Scholar]
- Busskamp, V. , Picaud S., Sahel J. A., and Roska B.. 2012. “Optogenetic Therapy for Retinitis Pigmentosa.” Gene Therapy 19: 169–175. [DOI] [PubMed] [Google Scholar]
- Calkins, D. J. , Sappington R. M., and Hendry S. H.. 2005. “Morphological Identification of Ganglion Cells Expressing the Alpha Subunit of Type II Calmodulin‐Dependent Protein Kinase in the Macaque Retina.” Journal of Comparative Neurology 481: 194–209. [DOI] [PubMed] [Google Scholar]
- Chandra, A. J. , Lee S. C. S., and Grünert U.. 2017. “Thorny Ganglion Cells in Marmoset Retina: Morphological and Neurochemical Characterization With Antibodies Against Calretinin.” Journal of Comparative Neurology 525: 3962–3974. [DOI] [PubMed] [Google Scholar]
- Chandra, A. J. , Lee S. C. S., and Grünert U.. 2019. “Melanopsin and Calbindin Immunoreactivity in the Inner Retina of Humans and Marmosets.” Visual Neuroscience 36: E009. [DOI] [PubMed] [Google Scholar]
- Christiansen, A. T. , Sørensen N. B., Haanes K. A., et al. 2018. “Neuropeptide Y Treatment Induces Retinal Vasoconstriction and Causes Functional and Histological Retinal Damage in a Porcine Ischaemia Model.” Acta Ophthalmologica 96: 812–820. [DOI] [PubMed] [Google Scholar]
- Cowan, C. S. , Renner M., De Gennaro M., et al. 2020. “Cell Types of the Human Retina and Its Organoids at Single‐Cell Resolution.” Cell 182: 1623–1640.e34. [DOI] [PMC free article] [PubMed] [Google Scholar]
- Cuenca, N. , Deng P., Linberg K. A., Fisher S. K., and Kolb H.. 2003. “Choline Acetyltransferase Is Expressed by Non‐Starburst Amacrine Cells in the Ground Squirrel Retina.” Brain Research 964: 21–30. [DOI] [PubMed] [Google Scholar]
- Curcio, C. A. , and Allen K. A.. 1990. “Topography of Ganglion Cells in Human Retina.” Journal of Comparative Neurology 300: 5–25. [DOI] [PubMed] [Google Scholar]
- Curcio, C. A. , Sloan K. R., Kalina R. E., and Hendrickson A. E.. 1990. “Human Photoreceptor Topography.” Journal of Comparative Neurology 292: 497–523. [DOI] [PubMed] [Google Scholar]
- Dacey, D. M. 1990. “The Dopaminergic Amacrine Cell.” Journal of Comparative Neurology 301: 461–489. [DOI] [PubMed] [Google Scholar]
- Dacey, D. M. , and Brace S.. 1992. “A Coupled Network for Parasol but Not Midget Ganglion Cells in the Primate Retina.” Visual Neuroscience 9: 279–290. [DOI] [PubMed] [Google Scholar]
- Diamond, J. S. 2017. “Inhibitory Interneurons in the Retina: Types, Circuitry, and Function.” Annual Review of Vision Science 3: 1–24. [DOI] [PubMed] [Google Scholar]
- Fortelny, N. , Overall C. M., Pavlidis P., and Freue G. V. C.. 2017. “Can We Predict Protein From mRNA Levels?” Nature 547: E19–E20. [DOI] [PubMed] [Google Scholar]
- Galli‐Resta, L. , Resta G., Tan S.‐S., and Reese B. E.. 1997. “Mosaics of Islet‐1‐Expressing Amacrine Cells Assembled by Short‐Range Cellular Interactions.” Journal of Neuroscience 17: 7831–7838. [DOI] [PMC free article] [PubMed] [Google Scholar]
- Gangi, M. , Maruyama T., Ishii T., and Kaneda M.. 2024. “ON and OFF Starburst Amacrine Cells Are Controlled by Distinct Cholinergic Pathways.” Journal of General Physiology 156: e202413550. [DOI] [PMC free article] [PubMed] [Google Scholar]
- Greschner, M. , Heitman A. K., Field G. D., et al. 2016. “Identification of a Retinal Circuit for Recurrent Suppression Using Indirect Electrical Imaging.” Current Biology 26: 1935–1942. [DOI] [PMC free article] [PubMed] [Google Scholar]
- Grünert, U. , and Martin P. R.. 2020. “Cell Types and Cell Circuits in Human and Non Human Primate Retina.” Progress in Retinal and Eye Research 78: 100844. [DOI] [PubMed] [Google Scholar]
- Guo, X. , Zhou J., Starr C., et al. 2021. “Preservation of Vision After CaMKII‐Mediated Protection of Retinal Ganglion Cells.” Cell 184: 4299–4314.e12. [DOI] [PMC free article] [PubMed] [Google Scholar]
- Haverkamp, S. , Albert L., Balaji V., Němec P., and Dedek K.. 2021. “Expression of Cell Markers and Transcription Factors in the Avian Retina Compared With That in the Marmoset Retina.” Journal of Comparative Neurology 529: 3171–3193. [DOI] [PubMed] [Google Scholar]
- Hood, D. C. 2017. “Improving Our Understanding, and Detection, of Glaucomatous Damage: An Approach Based Upon Optical Coherence Tomography (OCT).” Progress in Retinal and Eye Research 57: 46–75. [DOI] [PMC free article] [PubMed] [Google Scholar]
- Jacoby, R. , Stafford D., Kouyama N., and Marshak D.. 1996. “Synaptic Inputs to ON Parasol Ganglion Cells in the Primate Retina.” Journal of Neuroscience 16: 8041–8056. [DOI] [PMC free article] [PubMed] [Google Scholar]
- Jusuf, P. R. , Lee S. C. S., and Grünert U.. 2004. “Synaptic Connectivity of the Diffuse Bipolar Cell Type DB6 in the Inner Plexiform Layer of Primate Retina.” Journal of Comparative Neurology 469: 494–506. [DOI] [PubMed] [Google Scholar]
- Kántor, O. , Mezey S., Adeghate J., et al. 2016. “Calcium Buffer Proteins Are Specific Markers of Human Retinal Neurons.” Cell and Tissue Research 365: 29–50. [DOI] [PubMed] [Google Scholar]
- Kao, Y. H. , and Sterling P.. 2003. “Matching Neural Morphology to Molecular Expression: Single Cell Injection Following Immunostaining.” Journal of Neurocytology 32: 245–251. [DOI] [PubMed] [Google Scholar]
- Kim, Y. J. , Peterson B. B., Crook J. D., et al. 2022. “Origins of Direction Selectivity in the Primate Retina.” Nature Communications 13: 2862. [DOI] [PMC free article] [PubMed] [Google Scholar]
- Kolb, H. , Linberg K. A., and Fisher S. K.. 1992. “Neurons of the Human Retina: A Golgi Study.” Journal of Comparative Neurology 318: 146–187. [DOI] [PubMed] [Google Scholar]
- Kolb, H. , and Nelson R.. 1981. “Amacrine Cells of the Cat Retina.” Vision Research 21: 1625–1633. [DOI] [PubMed] [Google Scholar]
- Kolb, H. , Zhang L., Dekorver L., and Cuenca N.. 2002. “A New Look at Calretinin‐Immunoreactive Amacrine Cell Types in the Monkey Retina.” Journal of Comparative Neurology 453: 168–184. [DOI] [PubMed] [Google Scholar]
- Korol, S. , Leuenberger P. M., Englert U., and Babel J.. 1975. “In Vivo Effects of Glycine on Retinal Ultrastructure and Averaged Electroretinogram.” Brain Research 97: 235–251. [DOI] [PubMed] [Google Scholar]
- Kothmann, W. W. , Trexler E. B., Whitaker C. M., Li W., Massey S. C., and O'Brien J.. 2012. “Nonsynaptic NMDA Receptors Mediate Activity‐Dependent Plasticity of Gap Junctional Coupling in the AII Amacrine Cell Network.” Journal of Neuroscience 32: 6747–6759. [DOI] [PMC free article] [PubMed] [Google Scholar]
- Kwong, J. M. , Caprioli J., and Piri N.. 2010. “RNA Binding Protein With Multiple Splicing: A New Marker for Retinal Ganglion Cells.” Investigative Ophthalmology & Visual Science 51: 1052–1058. [DOI] [PMC free article] [PubMed] [Google Scholar]
- Lee, S. C. S. , Martin P. R., and Grünert U.. 2019. “Topography of Neurons in the Rod Pathway of Human Retina.” Investigative Ophthalmology and Visual Science 60: 2848–2859. [DOI] [PubMed] [Google Scholar]
- Lee, S. C. S. , Wei A. J., Martin P. R., and Grünert U.. 2024. “Thorny and Tufted Retinal Ganglion Cells Express the Transcription Factor Forkhead Proteins Foxp1 and Foxp2 in Marmoset (Callithrix jacchus).” Journal of Comparative Neurology 532: e25663. [DOI] [PubMed] [Google Scholar]
- Lee, S. C. S. , Weltzien F., Madigan M. C., Martin P. R., and Grünert U.. 2016. “Identification of AII Amacrine, Displaced Amacrine and Bistratified Ganglion Cell Types in human Retina With Antibodies Against Calretinin.” Journal of Comparative Neurology 524: 39–53. [DOI] [PubMed] [Google Scholar]
- Li, J. , Choi J., Cheng X., et al. 2024. “Comprehensive Single‐Cell Atlas of the Mouse Retina.” iScience 27: 109916. [DOI] [PMC free article] [PubMed] [Google Scholar]
- Li, Y. , Yu S., Jia X., Qiu X., and He J.. 2024. “Defining Morphologically and Genetically Distinct GABAergic/Cholinergic Amacrine Cell Subtypes in the Vertebrate Retina.” Plos Biology 22: e3002506. [DOI] [PMC free article] [PubMed] [Google Scholar]
- Liu, L. O. , Li G., McCall M. A., and Cooper N. G.. 2000. “Photoreceptor Regulated Expression of Ca2+/Calmodulin‐Dependent Protein Kinase II in the Mouse Retina.” Molecular Brain Research 82: 150–166. [DOI] [PubMed] [Google Scholar]
- Majumdar, S. , Wässle H., Jusuf P. R., and Haverkamp S.. 2008. “Mirror‐Symmetrical Populations of Wide‐Field Amacrine Cells of the Macaque Monkey Retina.” Journal of Comparative Neurology 508: 13–27. [DOI] [PubMed] [Google Scholar]
- Mariani, A. P. 1990. “Amacrine Cells of the Rhesus Monkey Retina.” Journal of Comparative Neurology 301: 382–400. [DOI] [PubMed] [Google Scholar]
- Mariani, A. P. 1991. “Synaptic Organization of Type 2 Catecholamine Amacrine Cells in the Rhesus Monkey Retina.” Journal of Neurocytology 20: 332–342. [DOI] [PubMed] [Google Scholar]
- Mariani, A. P. , and Hersh L. B.. 1988. “Synaptic Organization of Cholinergic Amacrine Cells in the Rhesus Monkey Retina.” Journal of Comparative Neurology 267: 269–280. [DOI] [PubMed] [Google Scholar]
- Mariani, A. P. , and Hokoç J. N.. 1988. “Two Types of Tyrosine Hydroxylase‐Immunoreactive Amacrine Cell in the rhesus monkey Retina.” Journal of Comparative Neurology 276: 81–91. [DOI] [PubMed] [Google Scholar]
- Martin, P. R. , and Grünert U.. 1992. “Spatial Density and Immunoreactivity of Bipolar Cells in the Macaque Monkey Retina.” Journal of Comparative Neurology 323: 269–287. [DOI] [PubMed] [Google Scholar]
- Masland, R. H. 2012. “The Tasks of Amacrine Cells.” Visual Neuroscience 29: 3–9. [DOI] [PMC free article] [PubMed] [Google Scholar]
- Masri, R. A. , Grünert U., and Martin P. R.. 2020. “Analysis of Parvocellular and Magnocellular Visual Pathways in Human Retina.” Journal of Neuroscience 40: 8132–8148. [DOI] [PMC free article] [PubMed] [Google Scholar]
- Massey, S. C. , and Mills S. L.. 1999. “Antibody to Calretinin Stains AII Amacrine Cells in the Rabbit Retina: Double‐Label and Confocal Analyses.” Journal of Comparative Neurology 411: 3–18. [PubMed] [Google Scholar]
- Midena, E. , Torresin T., Longhin E., Midena G., Pilotto E., and Frizziero L.. 2021. “Early Microvascular and Oscillatory Potentials Changes in Human Diabetic Retina: Amacrine Cells and the Intraretinal Neurovascular Crosstalk.” Journal of Clinical Medicine 10: 4035. [DOI] [PMC free article] [PubMed] [Google Scholar]
- Moritoh, S. , Komatsu Y., Yamamori T., and Koizumi A.. 2013. “Diversity of Retinal Ganglion Cells Identified by Transient GFP Transfection in Organotypic Tissue Culture of Adult Marmoset Monkey Retina.” PLoS One 8: e54667. [DOI] [PMC free article] [PubMed] [Google Scholar]
- Nasir‐Ahmad, S. , Lee S. C. S., Martin P. R., and Grünert U.. 2021. “Identification of Retinal Ganglion Cell Types Expressing the Transcription Factor Satb2 in Three Primate Species.” Journal of Comparative Neurology 529: 2727–2749. [DOI] [PubMed] [Google Scholar]
- Nasir‐Ahmad, S. , Vanstone K. A., Novelli M., et al. 2022. “Satb1 Expression in Retinal Ganglion Cells of Marmosets, Macaques and Humans.” Journal of Comparative Neurology 530: 923–940. [DOI] [PMC free article] [PubMed] [Google Scholar]
- Ochiishi, T. , Terashima T., Sugiura H., and Yamauchi T.. 1994. “Immunohistochemical Localization of Ca2+/Calmodulin‐Dependent Protein Kinase II in the Rat Retina.” Brain Research 634: 257–265. [DOI] [PubMed] [Google Scholar]
- Patterson, S. S. , Bordt A. S., Girresch R. J., et al. 2020. “Wide‐Field Amacrine Cell Inputs to ON Parasol Ganglion Cells in Macaque Retina.” Journal of Comparative Neurology 528: 1588–1598. [DOI] [PMC free article] [PubMed] [Google Scholar]
- Peng, Y. R. , James R. E., Yan W., Kay J. N., Kolodkin A. L., and Sanes J. R.. 2020. “Binary Fate Choice Between Closely Related Interneuronal Types Is Determined by a Fezf1‐Dependent Postmitotic Transcriptional Switch.” Neuron 105: 464–474.e6. [DOI] [PMC free article] [PubMed] [Google Scholar]
- Peng, Y. R. , Shekhar K., Yan W., et al. 2019. “Molecular Classification and Comparative Taxonomics of Foveal and Peripheral Cells in Primate Retina.” Cell 176: 1222–1237. [DOI] [PMC free article] [PubMed] [Google Scholar]
- Polyak, S. L. 1941. The Retina. The University of Chicago Press. [Google Scholar]
- Rodieck, R. W. 1989. “Starburst Amacrine Cells in the Primate Retina.” Journal of Comparative Neurology 285: 18–37. [DOI] [PubMed] [Google Scholar]
- Rodieck, R. W. , and Marshak D. W.. 1992. “Spatial Density and Distribution of Choline Acetyltransferase Immunoreactive Cells in Human, Macaque, and Baboon Retinas.” Journal of Comparative Neurology 321: 46–64. [DOI] [PubMed] [Google Scholar]
- Rodriguez, A. R. , Pérez de Sevilla Müller L., and Brecha N. C.. 2014. “The RNA Binding Protein RBPMS Is a Selective Marker of Ganglion Cells in the Mammalian Retina.” Journal of Comparative Neurology 522: 1411–1443. [DOI] [PMC free article] [PubMed] [Google Scholar]
- Sahel, J. A. , and Roska B.. 2013. “Gene Therapy for Blindness.” Annual Review of Neuroscience 36: 467–488. [DOI] [PubMed] [Google Scholar]
- Sánchez‐Sáez, X. , Ortuño‐Lizarán I., Sánchez‐Castillo C., Lax P., and Cuenca N.. 2023. “Starburst Amacrine Cells, Involved in Visual Motion Perception, Loose Their Synaptic Input From Dopaminergic Amacrine Cells and Degenerate in Parkinson's disease Patients.” Translational Neurodegeneration 12: 17. [DOI] [PMC free article] [PubMed] [Google Scholar]
- Schindelin, J. , Arganda‐Carreras I., Frise E., et al. 2012. “Fiji: An Open‐Source Platform for Biological‐Image Analysis.” Nature Methods 9: 676–682. [DOI] [PMC free article] [PubMed] [Google Scholar]
- Sepehrisadr, T. , Atapour N., Baldicano A. K., Rosa M. G. P., Grünert U., and Martin P. R.. 2024. “Transsynaptic Degeneration of Retinal Ganglion Cells Following Lesions to Primary Visual Cortex in Marmosets.” Investigative Ophthalmology & Visual Science 65: 4. [DOI] [PMC free article] [PubMed] [Google Scholar]
- Simunovic, M. P. , Shen W., Lin J. Y., Protti D. A., Lisowski L., and Gillies M. C.. 2019. “Optogenetic Approaches to Vision Restoration.” Experimental Eye Research 178: 15–26. [DOI] [PubMed] [Google Scholar]
- Terashima, T. , Ochiishi T., and Yamauchi T.. 1994. “Immunocytochemical Localization of Calcium/Calmodulin‐Dependent Protein Kinase II Isoforms in the Ganglion Cells of the Rat Retina: Immunofluorescence Histochemistry Combined With a Fluorescent Retrograde Tracer.” Brain Research 650: 133–139. [DOI] [PubMed] [Google Scholar]
- Tetenborg, S. , Yadav S. C., Hormuzdi S. G., Monyer H., Janssen‐Bienhold U., and Dedek K.. 2017. “Differential Distribution of Retinal Ca2+/Calmodulin‐Dependent Kinase II (CaMKII) Isoforms Indicates CaMKII‐β and ‐δ as Specific Elements of Electrical Synapses Made of Connexin36 (Cx36).” Frontiers in Molecular Neuroscience 10: 425. [DOI] [PMC free article] [PubMed] [Google Scholar]
- Vaney, D. I. 1990. “The Mosaic of Amacrine Cells in the Mammalian Retina.” Progress in Retinal Research 9: 49–100. [Google Scholar]
- Vaney, D. I. , Sivyer B., and Taylor W. R.. 2012. “Direction Selectivity in the Retina: Symmetry and Asymmetry in Structure and Function.” Nature Reviews Neuroscience 13: 194–208. [DOI] [PubMed] [Google Scholar]
- Wachtmeister, L. 1998. “Oscillatory Potentials in the Retina: What Do They Reveal.” Progress in Retinal and Eye Research 17: 485–521. [DOI] [PubMed] [Google Scholar]
- Wang, A. Y. M. , Kulkarni M. M., McLaughlin A. J., et al. 2023. “An ON‐Type Direction‐Selective Ganglion Cell in Primate Retina.” Nature 623: 381–386. [DOI] [PMC free article] [PubMed] [Google Scholar]
- Wässle, H. , Grünert U., Chun M.‐H., and Boycott B. B.. 1995. “The Rod Pathway of the macaque Monkey Retina: Identification of AII‐Amacrine Cells With Antibodies Against Calretinin.” Journal of Comparative Neurology 361: 537–551. [DOI] [PubMed] [Google Scholar]
- Wässle, H. , Grünert U., Röhrenbeck J., and Boycott B. B.. 1989. “Cortical Magnification Factor and the Ganglion Cell Density of the Primate Retina.” Nature 341: 643–646. [DOI] [PubMed] [Google Scholar]
- Weltzien, F. , Dimarco S., Protti D. A., Daraio T., Martin P. R., and Grünert U.. 2014. “Characterization of Secretagogin Immunoreactive Amacrine Cells in Marmoset Retina.” Journal of Comparative Neurology 522: 435–455. [DOI] [PubMed] [Google Scholar]
- Weltzien, F. , Percival K. A., Martin P. R., and Grünert U.. 2015. “Analysis of Bipolar and Amacrine Populations in Marmoset Retina.” Journal of Comparative Neurology 523: 313–334. [DOI] [PubMed] [Google Scholar]
- Whitney, I. E. , Keeley P. W., St John A. J., Kautzman A. G., Kay J. N., and Reese B. E.. 2014. “Sox2 Regulates Cholinergic Amacrine Cell Positioning and Dendritic Stratification in the Retina.” Journal of Neuroscience 34: 10109–10121. [DOI] [PMC free article] [PubMed] [Google Scholar]
- Wilder, H. D. , Grünert U., Lee B. B., and Martin P. R.. 1996. “Topography of Ganglion Cells and Photoreceptors in the Retina of a New World Monkey: The Marmoset Callithrix jacchus .” Visual Neuroscience 13: 335–352. [DOI] [PubMed] [Google Scholar]
- Xia, X. , Shi C., Tsien C., et al. 2024. “Ca2+/Calmodulin‐Dependent Protein Kinase II Enhances Retinal Ganglion Cell Survival but Suppresses Axon Regeneration After Optic Nerve Injury.” eNeuro 11: 1–12. [DOI] [PMC free article] [PubMed] [Google Scholar]
- Yan, W. , Laboulaye M. A., Tran N. M., Whitney I. E., Benhar I., and Sanes J. R.. 2020. “Mouse Retinal Cell Atlas: Molecular Identification of Over Sixty Amacrine Cell Types.” Journal of Neuroscience 40: 5177–5195. [DOI] [PMC free article] [PubMed] [Google Scholar]
- Yan, W. , Peng Y. R., van Zyl T., et al. 2020. “Cell Atlas of the Human Fovea and Peripheral Retina.” Scientific Reports 10: 9802. [DOI] [PMC free article] [PubMed] [Google Scholar]
- Yasuda, R. , Hayashi Y., and Hell J. W.. 2022. “CaMKII: A Central Molecular Organizer of Synaptic Plasticity, Learning and Memory.” Nature Reviews Neuroscience 23: 666–682. [DOI] [PubMed] [Google Scholar]
- Zhang, C. , Yu W. Q., Hoshino A., et al. 2019. “Development of ON and OFF Cholinergic Amacrine Cells in the Human Fetal Retina.” Journal of Comparative Neurology 527: 174–186. [DOI] [PMC free article] [PubMed] [Google Scholar]
- Zhang, L. , Cavallini M., Wang J., et al. 2024. “Evolutionary and Developmental Specialization of Foveal Cell Types in the Marmoset.” PNAS 121: e2313820121. [DOI] [PMC free article] [PubMed] [Google Scholar]
Associated Data
This section collects any data citations, data availability statements, or supplementary materials included in this article.
Data Availability Statement
The data that support the findings of this study are available from the corresponding author upon reasonable request.