

Abstract
Background
Endemic levels of community firearm violence in United States cities disproportionately burden certain sociodemographic groups. Nonfatal injuries are an understudied aspect of firearm violence. Police data in a large and heterogenous place like New York City (NYC) provide the unique opportunity to use a single data source to measure fatal and nonfatal community firearm violence.
Methods
The study analyzed epidemiologic trends in fatal and nonfatal community firearm violence using the publicly available New York Police Department (NYPD) Shooting Incident Dataset from 2019 to 2023. The analyses tabulated shooting victims by sociodemographic variables (age group, race and ethnicity, and sex) and case fatality rates, mapped shootings by census tract, and described social determinants of health (SDOH)—poverty, educational attainment, unemployment—in the census tracts where shootings occurred.
Results
From 2019 to 2023, the annual average number of shooting victims in NYC was 1,578. Shootings doubled from 2019 to 2020 though trended downward from 2021 to 2022 to 2023. Four out of five shootings were nonfatal. Males, people ages 18-24, and non-Hispanic Black people in NYC experienced the greatest proportion of shootings. Shootings coincided with census tracts also experiencing above median percentages of adverse SDOH (i.e., highest levels of unemployment, poverty, and low educational attainment).
Discussion
Nonfatal injuries are an important component of community firearm violence to monitor. The findings identify inequities in community firearm violence by sex, age group, and race and ethnicity in NYC. One contributor to racial inequities in violence is the impact of place-based SDOH in certain NYC neighborhoods.
Conclusions
This study leverages NYPD data to estimate the full magnitude of violence by tracking nonfatal in addition to fatal injuries. The study emphasizes the need for researchers to go beyond individual demography and better understand the place-based social determinants of firearm violence.
Keywords: Community firearm violence, Epidemiology, Social determinants of health, GIS, Mapping
Introduction
Firearm violence is a pressing public health concern in the United States (U.S.) [1]. As the COVID-19 pandemic exacerbated many social ills, firearm violence also worsened to record high levels in the U.S., unseen since 1994 [2–4]. Comparing 2023 to 2019, firearm homicides increased 24% [3–5]. Though recent data suggest firearm violence may be trending downward, it is not down to pre-pandemic levels [4, 6]. Even so, U.S. cities face endemic community firearm violence, defined here as the intentional, interpersonal use of a firearm that results in death or nonfatal injury [7–10]. Given the high prevalence of community firearm violence, improved surveillance is necessary to monitor inequities in who is affected by this important public health problem.
Existing epidemiological evidence on firearm violence highlights at least two important considerations. First, many data sources are limited in their ability to accurately measure the full scope of firearm violence. Particularly, nonfatal firearm injuries are captured poorly, despite studies indicating there are many more nonfatal than fatal firearm injuries [11–18]. For instance, the Centers for Disease Control and Prevention’s (CDC) National Violent Death Reporting System (NVDRS) includes only fatal firearm injuries. Even the available NVDRS data are about two years behind because NVDRS is a secondary surveillance system that relies on state-level data on deaths from a combination of sources including death certificates, medical examiner and coroner records, and law enforcement reports [19, 20]. The CDC Web-based Injury Statistics Query and Reporting System (WISQARS) only reports nonfatal injuries at the national level; however, the CDC does not currently recommend the WISQARS data that come from the National Electronic Injury Surveillance System All Injury Program to be used for national nonfatal firearm injury prevalence estimates because of small sample of hospitals and wide confidence intervals [18, 19, 21, 22]. Additionally, emergency department (ED) datasets, often used to measure nonfatal firearm violence, are flawed. Datasets based on ED visits alone rely on International Classification of Diseases coding practices that often lead to misclassification of assaults as unintentional injuries and can have reporting lags of one to three years [18, 19, 23]. Second, current evidence reveals that firearm violence disproportionately burdens specific groups. Community firearm violence tends to impact non-Hispanic Black and Hispanic/Latino communities and disproportionately involves teen boys and young adult men, where small networks of people can be caught in cycles of violence perpetration, victimization, and trauma [3, 4, 10, 24–34]. In 2023, non-Hispanic Black Americans were 14 times more likely to die by firearm homicide than non-Hispanic White Americans [5]. Young non-Hispanic Black boys and men are heavily impacted—while non-Hispanic Black males ages 15 to 34 years made up 4% of the U.S. population, they represented 37% of firearm homicides in 2023 [5]. Further, the broader community is affected by the cycle of firearm violence; even if community members (e.g., families, loved ones, and neighbors) are not directly involved in violence, they can be indirect victims because witnessing firearm violence and hearing gunshots leads to lower community safety and perception of safety, and harms physical and mental health (e.g., stress and trauma) [10, 35–38].
There is an opportunity to explore police data to monitor the epidemiology of firearm violence in NYC. Although an imperfect data source, past studies have relied on local police data on shootings to study interpersonal firearm violence [8, 29, 39–49]. These studies on large U.S. cities regarded police data as useful because they are comprehensive (i.e., they capture both fatal and nonfatal shootings), timely, routinely collected for public dissemination, and uniquely record geographic location and some circumstances of shootings [19]. In the absence of an integrated hospital and police database of firearm injuries to capture the full scope of firearm violence, the New York Police Department (NYPD) Shooting Incident Dataset can elucidate epidemiologic trends of both fatal and nonfatal injuries [50]. This study will leverage police data to tabulate firearm violence to identify subpopulations affected by violence. The problem of community firearm violence is complex and by describing who is involved and impacted, the intent is not to criminalize nor stigmatize people nor communities of color who are disproportionately harmed [26, 29, 51]. Instead, the community firearm violence risks are place-based, going beyond the individual level to the broader social context including the effects of structural racism that leads to concentrated disadvantage [40, 44, 52]. This study contextualizes why racial inequities exist by exploring how select social determinants of health (SDOH) influence community firearm violence.
Methods
Overview
This descriptive, cross-sectional study used the NYPD Shooting Incident Dataset from 2019 to 2023 to investigate inequities in community firearm violence by sociodemographic factors, social determinants of health (SDOH), and place (i.e., census tracts), in New York City (NYC).
Data sources
This paper utilized the NYPD Shooting Incident Dataset. These data are de-identified and publicly available on NYC’s Open Data portal [50]. Each row in the dataset represents a single person who was shot in NYC and contains details of the shooting (e.g., date, time, location, and fatal versus nonfatal) and victim demography (i.e., age group, race and ethnicity, and sex). Data for selected SDOH (employment, poverty, and educational attainment) at the census tract level (proxies for neighborhoods; between 1,200 and 8,000 people) and were derived from the U.S. Census Bureau’s American Community Survey (ACS), five-year estimates (2019–2023).
Measures
The primary outcome of community firearm violence was determined using the NYPD Shooting Incident Dataset to measure interpersonal fatal and nonfatal shootings (hereafter, called shootings). The NYPD dataset excludes shootings caused by firearm suicide and attempt and unintentional firearm injury and death. The NYPD classified the race and ethnicity of people who were shot. The available race and ethnicity categories are American Indian/Alaskan Native, Asian/Pacific Islander, Black, Black Hispanic, White, and White Hispanic. The NYPD categorizes age as < 18, 18–24, 25–44, 45–64, and 65+ and sex as female and male.
The World Health Organization (WHO) defines social determinants of health as “the conditions in which people are born, grow, work, live and age, and the wider forces that shape the conditions of daily life” [53]. Guided by the WHO Social Determinants of Health and Health Inequity Framework, we focused on social determinants of health inequities in three domains—employment, income, and education—that reflect individual- and community-level socioeconomic position that stratifies people into different levels of advantage and thus shapes their access to resources and ultimately their health and well-being [10, 53–55]. The three ACS SDOH variables for NYC census tracts were unemployment, poverty, and low educational attainment, operationalized as follows [56]. The unemployment variable was defined as the percent of the census tract that is unemployed in the civilian labor force population ages ≥ 16. The poverty variable was the percentage of people of all ages with income below 150% of the federal poverty level in the census tract. The low educational attainment variable was the percent of adults ages ≥ 25 years without a high school diploma in the census tract. There are 2,327 census tracts in NYC according to the 2020 Decennial Census boundaries.
Statistical analysis
The analysis tabulated demography—age group, race and ethnicity, and sex—for shooting victims from 2019 to 2023. Because counts of shooting victims from the NYPD were meant to capture all fatal and nonfatal firearm injuries in New York City rather than a sample drawn from a population, inferential statistical tests were not performed on the count data [33]. Shootings were aggregated by year and fatal versus nonfatal for 2019–2023. We did a spatial join using the point-level shooting coordinates to aggregate them to the census tract where they occurred; all shootings in the NYPD Shooting Incident Dataset from 2019 to 2023 were assigned to a NYC census tract. The NYC census tracts were divided into quartiles based on lowest to highest percent for each SDOH variable (unemployment, poverty, low educational attainment). The number of shootings and relative percent of total shootings that happened in a census tract experiencing varying burdens of the selected SDOH was analyzed for each year, 2019–2023. We generated (1) a map of shootings using natural breaks and (2) three bivariate choropleth maps—based on median cut point for the SDOH and mean cut point for shootings—that explored the geographic relationship between shootings and SDOH variables. Bivariate mapping uses combined color schemes to display two variables on a single map, allowing for the simultaneous visualization of their spatial relationship and patterns. Analyses were conducted in R v4.2.3 and maps were created in ArcGIS Pro v3.5.0. This study was reviewed and determined to exempt from human subjects research by the Johns Hopkins Bloomberg School of Public Health Institutional Review Board.
Results
In 2023, 88.3% of shooting victims were males (Table 1). Adults ages 25–44 represented the highest percentage of total shootings victims (55.4%) in 2023, followed by ages 18–24 (23.8%) (Table 1). Non-Hispanic Black people represented the largest percentage (63.7%) of shooting victims, followed by Hispanic people (30.6%) (Table 1). Annually, from 2019 to 2023, the pattens of shooting victims by sex, age group, and race and ethnicity were relatively consistent whereby males, people ages 25–44 followed by ages 18–24, and non-Hispanic people represented the greatest proportion of shooting victims (Table 1).
Table 1.
Number and percent of people who were shot in NYC, by sex, age group, and race and ethnicity 2019–2023
| 2019 (n = 967) |
2020 (n = 1,948) |
2021 (n = 2,011) |
2022 (n = 1,716) |
2023 (n = 1,250) |
|
|---|---|---|---|---|---|
| Variable | n (%) | n (%) | n (%) | n (%) | n (%) |
| Sex | |||||
| Female | 102 (10.5) | 201 (10.3) | 199 (9.9) | 212 (12.4) | 145 (11.6) |
| Male | 865 (89.5) | 1,747 (89.7) | 1,812 (90.1) | 1,504 (87.6) | 1,104 (88.3) |
| Unknown | - | - | - | - | 1 (0.1) |
| Age group | |||||
| 0–17 | 67 (6.9) | 133 (6.8) | 156 (7.8) | 158 (9.2) | 115 (9.2) |
| 18–24 | 272 (28.1) | 576 (29.6) | 601 (29.9) | 482 (28.1) | 298 (23.8) |
| 25–44 | 520 (53.8) | 1,069 (54.9) | 1,083 (53.9) | 895 (52.2) | 692 (55.4) |
| 45–64 | 97 (10.0) | 157 (8.1) | 157 (7.8) | 165 (9.6) | 118 (9.4) |
| 65+ | 7 (0.7) | 12 (0.6) | 13 (0.6) | 14 (0.8) | 24 (1.9) |
| Unknown | 4 (0.4) | 1 (0.1) | 1 (0.0) | 2 (0.1) | 3 (0.2) |
| Race and ethnicity | |||||
| American Indian/Alaskan Native (NH) | - | - | - | 1 (0.1) | 1 (0.1) |
| Asian/Pacific Islander (NH) | 20 (2.1) | 38 (2.0) | 27 (1.3) | 50 (2.9) | 36 (2.9) |
| Black (NH) | 676 (69.9) | 1,380 (70.8) | 1,412 (70.2) | 1,158 (67.5) | 796 (63.7) |
| Hispanic | 242 (25.0) | 491 (25.2) | 532 (26.5) | 468 (27.3) | 383 (30.6) |
| Black Hispanic | 76 (7.9) | 157 (8.1) | 240 (11.9) | 161 (9.4) | 149 (11.9) |
| White Hispanic | 166 (17.2) | 334 (17.1) | 292 (14.5) | 307 (17.9) | 234 (18.7) |
| White (NH) | 28 (2.9) | 39 (2.0) | 40 (2.0) | 38 (2.2) | 30 (2.4) |
| Unknown | 1 (0.1) | - | - | 1 (0.1) | 4 (0.3) |
Within variable percentages do not always total to 100% due to rounding
NH = Non-Hispanic
Data source: NYPD Shooting Incident Dataset [50]
Annual trends and case fatality
In 2023, there were a total of 1,250 shooting victims in NYC, 260 fatal and 990 nonfatal (Fig. 1). Comparing 2020 to 2019, shootings in NYC doubled (Fig. 1). The number of firearm shootings decreased about 27.2% from 2022 to 2023 and decreased 37.8% from 2021 to 2023 (Fig. 1). The mean annual case fatality rate (i.e., number of fatal shootings divided by total shootings) from 2019 to 2023 was 19.9% (data not shown). There were far more nonfatal than fatal shootings in NYC; annually, on average, over 80% of shootings were nonfatal from 2019 to 2023 (data not shown).
Fig. 1.
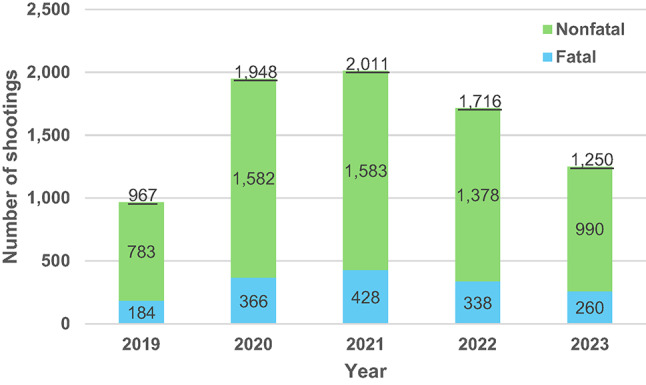
Annual number of fatal and nonfatal shootings in NYC, 2019–2023 Data source: NYPD Shooting Incident Dataset [50]
Geographic distribution
Table 2 shows the number of people shot in census tracts stratified by the quartiles of each social determinant of health. In 2023, 45% of people were shot in census tracts with the highest quartile of unemployment (Table 2). 56% of people were shot in census tracts with the highest quartile of poverty in 2023 (Table 2). 44% of people were shot in census tracts with the highest quartile of low educational attainment in 2023 (Table 2). These patterns were consistent each year, 2019–2023. On average, from 2019 to 2023, 44% of people were shot in census tracts with the highest quartile of unemployment, 52% in census tracts with the highest quartile of poverty, and 40% with the highest quartile of low educational attainment. Nearly one quarter of people were shot in census tracts with the highest quartile of all three SDOH (i.e., the census tract was in quartile four for all three SDOH) in 2023 (data not shown).
Table 2.
Number and percent of people shot in census tracts with the selected social determinants, by quartile, 2019–2023
| 2019 (n = 967) |
2020 (n = 1,948) |
2021 (n = 2,011) |
2022 (n = 1,716) |
2023 (n = 1,250) |
|
|---|---|---|---|---|---|
| Variable | n (%) | n (%) | n (%) | n (%) | n (%) |
| Unemployment1 | |||||
| Quartile 1 (lowest unemployment) | 133 (13.8) | 248 (12.7) | 207 (10.3) | 253 (14.7) | 151 (12.1) |
| Quartile 2 | 171 (17.7) | 339 (17.4) | 373 (18.5) | 272 (15.9) | 175 (14.0) |
| Quartile 3 | 260 (26.9) | 451 (23.2) | 529 (26.3) | 440 (25.6) | 351 (28.1) |
| Quartile 4 (highest unemployment) | 396 (41.0) | 892 (45.8) | 867 (43.1) | 734 (42.8) | 568 (45.4) |
| No data | 7 (0.7) | 18 (0.9) | 35 (1.7) | 17 (0.9) | 5 (0.4) |
| Poverty2 | |||||
| Quartile 1 (lowest poverty) | 88 (9.1) | 121 (6.2) | 154 (7.7) | 157 (9.1) | 92 (7.4) |
| Quartile 2 | 124 (12.8) | 278 (14.3) | 307 (15.3) | 225 (13.1) | 171 (13.7) |
| Quartile 3 | 252 (26.1) | 501 (25.7) | 508 (25.3) | 419 (24.4) | 288 (23.0) |
| Quartile 4 (highest poverty) | 496 (51.3) | 1,032 (53.0) | 1,008 (50.1) | 898 (52.3) | 694 (55.5) |
| No data | 7 (0.7) | 16 (0.8) | 34 (1.7) | 17 (0.9) | 5 (0.4) |
| Low educational attainment3 | |||||
| Quartile 1 (highest educational attainment) | 80 (8.3) | 167 (8.6) | 182 (9.1) | 177 (10.3) | 93 (7.4) |
| Quartile 2 | 243 (25.1) | 401 (20.6) | 391 (19.4) | 336 (19.6) | 243 (19.4) |
| Quartile 3 | 292 (30.2) | 580 (29.8) | 568 (28.2) | 489 (28.5) | 361 (28.9) |
| Quartile 4 (lowest educational attainment) | 345 (35.7) | 785 (40.3) | 838 (41.7) | 699 (40.7) | 548 (43.8) |
| No data | 7 (0.7) | 15 (0.8) | 32 (1.6) | 15 (0.9) | 5 (0.4) |
1Unemployment quartile (Q) ranges: Q1 0– ≤4.1%; Q2 > 4.1– ≤6.8%; Q3 > 6.8– ≤7.90%; Q4 > 7.9–100%
2Poverty quartile ranges: Q1 0– ≤13.3%; Q2 > 13.3–22.1%; Q3 > 22.1– ≤34.2%; Q4 > 34.2–100%
3Low educational attainment quartile ranges: Q1 0– ≤8.4%; Q2 > 8.4–14.7%; Q3 > 14.7– ≤23.7%; Q4 > 23.7–70.2%
Within variable percentages do not always total to 100% due to rounding
Data sources: Shootings - NYPD Shooting Incident Dataset [50]. Social determinants of health - U.S. Census Bureau American Community Survey, 5-year estimates (2019-2023) [57]
There were census tracts in each borough with higher violence represented by the darkest purple color on the map (Fig. 2).
Fig. 2.

Number of fatal and nonfatal shooting victims in NYC, by census tract, 2019-2023. This figure illustrates the combined number of fatal and nonfatal shooting victims in NYC by census tract. The cut points in the legend are determined by jenks (natural breaks) classification scheme. Data source: NYPD Shooting Incident Dataset [50]
Bivariate choropleth maps in Figs. 3, 4 and 5 show the geographic relationship between firearm violence and each social determinant. Hereafter, “low” shootings refer to below mean number of shootings per census tract while “high” shootings refer to above mean shootings. In the bivariate legend (Figs. 3, 4 and 5), the light gray indicates where there were both low shootings and low percentage of the social determinant in the given census tract, while the purple indicates high shootings and high percentage of the social determinant. In all three maps (Figs. 3, 4 and 5), most census tracts were shaded light gray (low shootings and low percentage of the SDOH in the given census tract) or shaded purple (high number of shootings and high percentage of the SDOH), suggesting there is a geographic relationship between shootings and each social determinant. The percentage of census tracts with concordant levels of shootings and social determinant (i.e., low/low (gray census tracts) and high/high (purple census tracts) was as follows for each map: (1) shootings and unemployment—62.6%, (2) shootings and poverty—67.2%, and (3) shootings and low educational attainment—62.1%.
Fig. 3.

Relationship between number of shootings and percentage unemployed in NYC, by census tract, 2019-2023. Bivariate choropleth map. Data sources: (1) Shootings: NYPD Shooting Incident Dataset, 2019-2023 [50], (2) Unemployment status (Unemployed population ages ≥ 16 years in the civilian labor force): U.S. Census Bureau American Community Survey, 5-year estimates (2019-2023) [57]. Mean shootings = 4; median unemployment = 6.8%. Census tracts with missing data (n=89) are white on the map
Fig. 4.

Relationship between number of shootings and percentage living below poverty level in NYC, by census tract, 2019-2023. Bivariate choropleth map. Data sources: (1) Shootings: NYPD Shooting Incident Dataset, 2019-2023 [50], (2) Poverty (people of all ages living below 150% the federal poverty level: U.S. Census Bureau American Community Survey, 5-year estimates (2019-2023) [57]. Mean shootings = 4; median poverty = 22.1%. Census tracts with missing data (n=88) are white on the map
Fig. 5.

Relationship between number of shootings and percentage without diploma in NYC, by census tract, 2019-2023. Bivariate choropleth map. Data sources: (1) Shootings: NYPD Shooting Incident Dataset, 2019-2023 [50], (2) Low educational attainment (No high school diploma among adults ages ≥ 25 years): U.S. Census Bureau American Community Survey, 5-year estimates (2019-2023) [57]. Mean shootings = 4; median low educational attainment = 14.7%. Census tracts with missing data (n=84) are white on the map
Discussion
In NYC between 2019 and 2023, there were nearly 1,600 shootings each year. More than three-quarters of these incidents were nonfatal shootings, highlighting the importance of examining both fatal and nonfatal incidents to best understand the burden of community firearm violence. Our study found a geographic relationship between shootings and select SDOH. Generally, census tracts that had a high number of shootings also had a high percentage of unemployment, poverty, and low educational attainment (only one bivariate spatial relationship was observed at a time). This underscores the importance of studying community firearm violence more granularly than citywide, in addition to investigating social underpinning of violence.
In the U.S., there is no single administrative data source that provides a comprehensive account of community firearm violence [8, 14, 19, 23, 42, 47, 49, 58, 59]. There are two primary types of data sources on community firearm violence—police and hospital data. The main drawback of hospital data is that they are coded primarily for medical record and billing purposes—not public health surveillance—and shooting intent (i.e., unintentional, undetermined, self-harm, assault, and legal intervention) is often misclassified and inaccurate [19, 23]. Police data are much timelier, which aids with the near real-time study of community firearm violence.
Three studies highlight reasons for potential missingness in the two types of data sources. In a Philadelphia study that compared hospital trauma registry data and police data, researchers found that over a ten-year period, the police data contained twice the number of firearm assaults than the trauma registry [42]. Trauma registry data are expected to be incomplete because they exclude more minor firearm injuries treated at non-trauma center hospitals; whereas police data might capture minor firearm injuries not treated in a medical setting and firearm deaths pronounced at the scene of the shooting. In nearly all states, healthcare providers must report gunshot wounds to police which is another reason the Philadelphia police data might have captured more assaults [42, 60, 61]. A study in Louisville that integrated and overlapped hospital and police data found that the police database was significantly more successful in capturing 93% of fatal firearm injuries compared to the hospital data that captured about 60% of fatal firearm injuries. The law enforcement versus hospital database missed 20% versus 6% of nonfatal injuries, respectively. One key caveat is that reporting of firearm injuries by healthcare providers to police is not required in Kentucky, so this might partially explain why the police data missed more nonfatal injuries and the findings in another setting might be different than the Louisville study. An Indianapolis study that also linked police and clinical records for nonfatal firearm assaults similarly found that both types of data are imperfect alone and likely would be best integrated [14]. However, unlike the Louisville study, they found police data might have a more complete record of nonfatal firearm assaults; clinical data alone captured less than half. They also importantly note that clinical records often lack the location of the injury, which is one of the main reasons this study used NYPD data for fatal and nonfatal injuries in NYC [14, 62].
Due to challenges with community firearm violence data sources, estimating the epidemiology of both fatal and nonfatal firearm injuries can be challenging in many studies. There tends to be a focus on fatal firearm injuries despite studies, including the present study, finding many more nonfatal than fatal injuries [11–19]. One nationwide study combined fatal firearm injury data from the CDC with nonfatal injury data from the Healthcare Cost and Utilization Project - Nationwide Emergency Department Sample [13]. They found over two times more nonfatal than fatal shootings [13]. This study found that in NYC, in 2023, there were four times more nonfatal than fatal shootings. The directionality of these findings is the same—more nonfatal shootings but the current findings might be more complete since the NYPD has a dedicated database of shootings, including nonfatal shootings [16]. The Louisville study created a combined dataset of overlapping and non-overlapping firearm injuries from hospital (inpatient and ED) and police data. Their combined dataset estimated 20.4% fatality among the interpersonal firearm injuries. This is consistent with the current study that also found on average, 19.3% of interpersonal shootings were fatal.
While it is important to look at the demography of people injured by firearms, this study also highlights the link between community firearm violence and social determinants of health in NYC census tracts. The differences in the burden of firearm violence by race and ethnicity are inequitable because they represent injustice in the social, political, and economic environments to which Black people are exposed. Existing literature emphasizes the association of a myriad of place-based social and structural determinants of firearm violence in Black communities including but not limited to racial residential segregation, concentrated neighborhood disadvantage, and blighted built environment [26, 44, 45, 52, 63–71]. Future work should further explore other SDOH, especially by capturing how multiple facets of structural racism produce violence over safety [10, 40, 72–75].
Limitations
The results of our study should be interpreted considering several limitations. First, the NYPD Shooting Incident Dataset is imperfect. While it provides a recent and comprehensive account of fatal and nonfatal interpersonal shootings, it lacks motive and victim-perpetrator relationship data. Stricter community firearm violence definitions include shootings causing harm to an acquaintance or stranger but exclude shootings of an intimate partner or family member [9]. This dataset cannot measure community firearm violence exclusive of gender-based and domestic violence. The NYPD also excludes shooting intent categories like unintentional and self-harm shootings, which aligns to the community firearm violence definition. Officer-involved shootings are excluded. All these shooting intents are important, especially to compare to burden and inequities of community firearm violence but were beyond the scope of this paper. The NYPD might not know if a person ultimately dies from a shooting injury that was initially nonfatal. To that point, we were unable to explore severity of injury nor experience of long-term, firearm-related physical injuries. There are shootings unknown to police and missing in the dataset. The demographic and spatial patterns and NYC could somewhat differ if the NYPD dataset had the universe of all community firearm violence; there might be variability in these patterns by other data sources (e.g., hospital data in NYC) [49]. In the NYPD Shooting Incident Dataset, police classify race and ethnicity. This is a potential threat to internal validity, in a study interested in racial inequities. This further motivated us to go beyond using race alone and look at place-based social determinants that help explain observed racial inequities in community firearm violence. Next, it is unclear whether and how the NYPD data collection and reporting methodology has changed over time. Another limitation is modifiable areal unit problem; simply aggregating to different spatial units can modify the findings because the units are somewhat arbitrary [76, 77]. However, it is well established that community firearm violence happens in hyperlocal areas of cities [3, 8, 29, 33, 52, 78]. This justifies analyses at the census tract level, though census tract is not the only level of geography appropriate to understand community firearm violence and its social and structural antecedents. Future work can explore other and more granular geographies [79]. Finally, because of the availability of a police dataset for fatal and nonfatal firearm injuries in NYC, this study focused on one city and might not be generalizable to other metropolitan areas.
Implications
Health departments have traditionally relied on hospital data for nonfatal shootings and other sources like vital statistics for fatal shootings [80, 81]. This study demonstrates that police data can be used to monitor community firearm violence in NYC and potentially in other U.S cities. Community firearm violence is a public health problem, and efforts are being made to improve public health data infrastructure for community firearm violence [19, 23, 82, 83]. A possible outcome of this study is health departments, police departments, and other violence prevention partners can foster new data sharing relationships and collaborate on public health approaches to community firearm violence. This could include matching or combining police and public health/hospital data to create a more comprehensive and higher quality database of shooting victims to prioritize community firearm violence research and intervention efforts [13, 14, 46–49]. The goal is not to rely on law enforcement-only approaches to violence nor ignore historic and present-day harmful effects of policing and mass incarceration; instead, the goal is to promote multi-sector approaches to violence prevention and public safety. Future research should recognize that police data are potentially underutilized and study the utility of police data compared to non-police data sources, in NYC and other cities [8, 14, 23, 42]. Finally, future work can explore other spatial patterns in community firearm violence to inform place-based interventions (e.g., elucidate how case fatality rates differ spatially, patterns within census tracts or at smaller geographies, and spatial cluster analysis) [79].
Conclusion
The findings identify stark inequities in community firearm violence by race and ethnicity, age, and sex in NYC. Importantly, they also shift our attention to social and structural drivers of community firearm violence. Overall, violence interventions need to tackle root causes of violence and injustices in social environments where violence persists. We need to address the impacts of social determinants of health, at every level of society—structural, community, interpersonal, and individual. This research highlights the need for violence interventions beyond individual behavior change. Public health approaches to prevent community firearm violence at the population-level must advance health equity, dismantle structural racism, and direct resources to communities most harmed. These interventions must be developed in collaboration with the most impacted communities and tailored to their unique needs and lived experiences to promote safety, health, and well-being.
Acknowledgements
Not applicable.
Abbreviations
- NYC
New York City
- SDOH
Social determinants of health
- CDC
Centers for Disease Control and Prevention
- NVDRS
National Violent Death Reporting System
- ED
Emergency department
- ACS
American Community Survey
- WISQARS
Web–based Injury Statistics Query and Reporting System
- NYPD
New York Police Department
- WHO
World Health Organization
Author contributions
LLA, CKC, VJ, DWW conceptualized the study and methodology. LLA retrieved and processed the data. LLA analyzed the data and wrote the original draft. MRD and LLA created the maps. LLA, CKC, VJ, DWW, MRD reviewed and edited multiple drafts.
Funding
This research was supported, in part, by a grant from the Robert Wood Johnson Foundation.
Data availability
The New York Police Department Shooting Incident dataset analyzed in the current study are available at https://data.cityofnewyork.us/Public-Safety/NYPD-Shooting-Incident-Data-Historic-/833y-fsy8/about_data The 2019-2023 U.S. Census Bureau American Community Survey 5-Year estimates analyzed during the current study are available at https://www.census.gov/data/developers/data-sets/acs-5year.html.
Declarations
Ethics approval and consent to participate
This study was reviewed and determined to be not human subjects research by the Johns Hopkins Bloomberg School of Public Health Institutional Review Board. The approval form is available upon request. All methods were performed in accordance with the ethical standards as laid down in the Declaration of Helsinki and its later amendments or comparable ethical standards.
Consent for publication
Not applicable, although see ethical approval and consent to participate above.
Competing interests
The authors declare no competing interests.
Footnotes
Publisher’s note
Springer Nature remains neutral with regard to jurisdictional claims in published maps and institutional affiliations.
References
- 1.Office of the Surgeon General (OSG). Firearm Violence: A Public Health Crisis in America: The U.S. Surgeon General’s Advisory [Internet]. Washington (DC): US Department of Health and Human Services (US); 2024. About This Advisory. Available from: https://www.ncbi.nlm.nih.gov/books/NBK605163/ [PubMed]
- 2.Simon TR, Kegler SR, Zwald ML, et al. Notes from the field: increases in firearm homicide and suicide rates — United States, 2020–2021. Morb Mortal Wkly Rep. 2022;71(40):1286. 10.15585/MMWR.MM7140A4. [DOI] [PMC free article] [PubMed] [Google Scholar]
- 3.Davis A, Kim R, Crifasi C. A Year in Review: 2021 Gun Deaths in the U.S.; 2021. Accessed June 17, 2023. https://publichealth.jhu.edu/sites/default/files/2023-06/2023-june-cgvs-u-s-gun-violence-in-2021.pdf
- 4.Villarreal S, Kim R, Wagner E, Somayaji N, Davis A, Crifasi C. Gun Violence in the United States 2022: Examining the Burden Among Children and Teens. Johns Hopkins Center for Gun Violence Solutions. Johns Hopkins Bloomberg School of Public Health; 2024. Accessed October 28, 2024. https://publichealth.jhu.edu/sites/default/files/2024-09/2022-cgvs-gun-violence-in-the-united-states.pdf
- 5.Centers for Disease Control and Prevention National Center for Health Statistics. National Vital Statistics, System. Mortality 2018–2023 on CDC WONDER Online Database, released in 2024. Accessed February 19, 2025. Data are from the Multiple Cause of Death Files, 2018–2023, as compiled from data provided by the 57 vital statistics jurisdictions through the Vital Statistics Cooperative Program. Accessed at http://wonder.cdc.gov/ucd-icd10-expanded.html
- 6.Brownlee C. Gun Violence by the Numbers in 2023. The Trace. December 31, 2023. Accessed January 29, 2024. https://www.thetrace.org/2023/12/data-gun-violence-deaths-america/
- 7.Buggs S, Zeoli AM. Gun homicide research: what we know and where we need to go. Homicide Stud. 2022;26(1):11–26. 10.1177/10887679211048495. [Google Scholar]
- 8.Gobaud AN, Mehranbod CA, Kaufman E, et al. Assessing the Gun Violence Archive as an epidemiologic data source for community firearm violence in 4 US cities. JAMA Netw Open. 2023;6(6):e2316545. 10.1001/JAMANETWORKOPEN.2023.16545. [DOI] [PMC free article] [PubMed] [Google Scholar]
- 9.Betz ME, Harkavy-Friedman J, Dreier FL, Pincus R, Ranney ML. Talking about firearm injury and gun violence: words matter. Am J Public Health. 2021;111(12):2105–10. 10.2105/AJPH.2021.306525. [DOI] [PMC free article] [PubMed] [Google Scholar]
- 10.Buggs SAL, Kravitz-Wirtz ND, Lund JJ. Social and structural determinants of community firearm violence and community trauma. Ann Am Acad Polit Soc Sci. 2022;704(1):224–41. 10.1177/00027162231173324. [Google Scholar]
- 11.Annest JL, Mercy JA, Gibson DR, Ryan GW. National estimates of nonfatal firearm-related injuries: beyond the tip of the iceberg. JAMA. 1995;273(22):1749–54. Accessed January 19, 2024. https://jamanetwork.com/journals/jama/article-abstract/388811. [PubMed]
- 12.Fowler KA, Dahlberg LL, Haileyesus T, Annest JL. Firearm injuries in the United States. Prev Med. 2015;79:5–14. 10.1016/j.ypmed.2015.06.002. [DOI] [PMC free article] [PubMed] [Google Scholar]
- 13.Kaufman EJ, Wiebe DJ, Xiong RA, Morrison CN, Seamon MJ, Delgado MK. Epidemiologic trends in fatal and nonfatal firearm injuries in the US, 2009–2017. JAMA Intern Med. 2021;181(2):237–44. 10.1001/JAMAINTERNMED.2020.6696. [DOI] [PMC free article] [PubMed] [Google Scholar]
- 14.Magee LA, Ranney ML, Fortenberry JD, Rosenman M, Gharbi S, Wiehe SE. Identifying nonfatal firearm assault incidents through linking police data and clinical records: cohort study in Indianapolis, Indiana, 2007–2016. Prev Med (Baltim). 2021;149:106605. 10.1016/J.YPMED.2021.106605. [DOI] [PMC free article] [PubMed] [Google Scholar]
- 15.Hipple NK. Towards a National definition and database for nonfatal shooting incidents. J Urban Health. 2022;99(3):361. 10.1007/S11524-022-00638-2. [DOI] [PMC free article] [PubMed] [Google Scholar]
- 16.Hipple NK, Huebner BM, Lentz TS, McGarrell EF, O’Brien M. The case for studying criminal nonfatal shootings: evidence from four Midwest cities. Justice Evaluation J. 2020;3(1):94–113. 10.1080/24751979.2019.1689152. [Google Scholar]
- 17.Hipple NK, Magee LA. The Difference Between Living and Dying: Victim Characteristics and Motive Among Nonfatal Shootings and Gun Homicides. Violence Vict. 2017;32(6):977-997. 10.1891/0886-6708.VV-D-16-00150. [DOI] [PubMed]
- 18.Barber C, Cook PJ, Parker ST. The emerging infrastructure of US firearms injury data. Prev Med (Baltim). 2022;165:107129. 10.1016/J.YPMED.2022.107129. [DOI] [PubMed] [Google Scholar]
- 19.Roman JK, Cook P. Improving Data Infrastructure to Reduce Firearms Violence.; 2021. Accessed June 14, 2023. https://www.norc.org/content/dam/norc-org/pdfs/Improving%20Data%20Infrastructure%20to%20Reduce%20Firearms%20Violence_Final%20Report.pdf
- 20.Nguyen B, Lyons BH, Forsberg K, et al. Surveillance for violent deaths — National Violent Death Reporting System, 48 states, the District of Columbia, and Puerto Rico, 2021. Volume 73. Centers for Disease Control and Prevention (CDC); 2024. 10.15585/MMWR.SS7305A1. [DOI] [PMC free article] [PubMed]
- 21.Centers for Disease Control and Prevention. WISQARS Fatal and Nonfatal Injury Infographics. Accessed February 19, 2025. https://wisqars.cdc.gov/infographics/
- 22.Centers for Disease Control and Prevention, Accessed WISQARS. February 20, 2025. https://wisqars.cdc.gov/about/nonfatal-injury-data/
- 23.Miller M, Azrael D, Yenduri R, et al. Assessment of the accuracy of firearm injury intent coding at 3 US hospitals. JAMA Netw Open. 2022;5(12):e2246429. 10.1001/JAMANETWORKOPEN.2022.46429. [DOI] [PMC free article] [PubMed] [Google Scholar]
- 24.John Jay College Research Advisory Group on Preventing and Reducing Community Violence. Reducing Violence Without Police: A Review of Research Evidence. 2020. Accessed June 22, 2024. https://academicworks.cuny.edu/jj_pubs/349/
- 25.Marineau LA, Uzzi M, Buggs SA, Ihenacho N, Campbell JC. Risk and protective factors for firearm assault injuries among Black men: A scoping review of research. Trauma Violence Abuse. 2024;35(3):2468–88. 10.1177/15248380231217042. [DOI] [PMC free article] [PubMed] [Google Scholar]
- 26.Branas CC, Jacoby S, Andreyeva E. Firearm violence as a Disease—Hot people or hot spots?? JAMA Intern Med. 2017;177(3):333–4. 10.1001/JAMAINTERNMED.2016.8273. [DOI] [PubMed] [Google Scholar]
- 27.Murphy SL, Kochanek KD, Xu J, Arias E. National Vital Statistics Reports Volume 73, 2024 Deaths: Final Data for 2021. Vol 73.; 2024. https://www.cdc.gov/nchs/products/index.htm [DOI] [PMC free article] [PubMed]
- 28.Development Services Group Inc. Gun Violence and Youth/Young Adults, Literature Review: A product of the Model Programs Guide. 2023. Accessed February 13, 2025. https://ojjdp.ojp.gov/model-programs-guide/literature-reviews/gun-violence-and-youth-young-adults#0-0
- 29.Beard JH, Morrison CN, Jacoby SF, et al. Quantifying disparities in urban firearm violence by race and place in Philadelphia, Pennsylvania: A cartographic study. Am J Public Health. 2017;107(3):371–3. 10.2105/AJPH.2016.303620. [DOI] [PMC free article] [PubMed] [Google Scholar]
- 30.Braga AA. Gun Violence Among Serious Young Offenders| ASU Center for Problem-Oriented Policing| ASU.; 2003. Accessed February 19, 2025. https://popcenter.asu.edu/content/gun-violence-among-serious-young-offenders-0
- 31.Falk Ö, Wallinius M, Lundström S, Frisell T, Anckarsäter H, Kerekes N. The 1% of the population accountable for 63% of all violent crime convictions. Soc Psychiatry Psychiatr Epidemiol. 2013;49(4):559. 10.1007/S00127-013-0783-Y. [DOI] [PMC free article] [PubMed] [Google Scholar]
- 32.Berthelot ER. Person or Place? A Contextual, Event History Analysis of Homicide Victimization Risk.; 2019. Accessed February 19, 2025. https://www.ojp.gov/pdffiles1/nij/grants/252940.pdf
- 33.Rees CA, Monuteaux MC, Steidley I, et al. Trends and disparities in firearm fatalities in the United States, 1990–2021. JAMA Netw Open. 2022;5(11):e2244221–2244221. 10.1001/JAMANETWORKOPEN.2022.44221. [DOI] [PMC free article] [PubMed] [Google Scholar]
- 34.Papachristos AV, Murphy JP, Braga A, Turchan B. The importance of neighborhood offending networks for gun violence and firearm availability. Soc Forces. 2024;103(2):780–801. 10.1093/SF/SOAE099. [Google Scholar]
- 35.Mitchell KJ, Jones LM, Turner HA, Beseler CL, Hamby S, Wade R. Understanding the impact of seeing gun violence and hearing gunshots in public places: findings from the youth firearm risk and safety study. J Interpers Violence. 2019;36(17–18):8835–51. 10.1177/0886260519853393. [DOI] [PubMed] [Google Scholar]
- 36.Harper CR, Li J, Sheats K et al. Witnessing Community Violence, Gun Carrying, and Associations with Substance Use and Suicide Risk Among High School Students-Youth Risk Behavior Survey, United States, 2021. Published online 2021. Accessed June 23, 2023. https://www.cdc.gov/mmwr/volumes/72/su/su7201a3.htm [DOI] [PMC free article] [PubMed]
- 37.Pinderhughes H, Davise RA, Williams M. Adverse Community Experiences and Resilience: A Framework for Addressing and Preventing Community Trauma.; 2015. Accessed June 10, 2024. https://www.preventioninstitute.org/sites/default/files/publications/Adverse%20Community%20Experiences%20and%20Resilience.pdf
- 38.Opara I, Lardier DT, Metzger I, et al. Bullets have no names: A qualitative exploration of community trauma among Black and Latinx youth. J Child Fam Stud. 2020;29(8):2117. 10.1007/S10826-020-01764-8. [DOI] [PMC free article] [PubMed] [Google Scholar]
- 39.Jay J, Martin R, Patel M, Xie K, Shareef F, Simes JT. Analyzing child firearm assault injuries by race and ethnicity during the COVID-19 pandemic in 4 major US cities. JAMA Netw Open. 2023;6(3):e233125–233125. 10.1001/JAMANETWORKOPEN.2023.3125. [DOI] [PMC free article] [PubMed] [Google Scholar]
- 40.Uzzi M, Aune KT, Marineau L, et al. An intersectional analysis of historical and contemporary structural racism on non-fatal shootings in Baltimore, Maryland. Inj Prev. 2023;29:85–90. 10.1136/ip-2022-044700. [DOI] [PMC free article] [PubMed] [Google Scholar]
- 41.Afif IN, Gobaud AN, Morrison CN, et al. The changing epidemiology of interpersonal firearm violence during the COVID-19 pandemic in Philadelphia, PA. Prev Med (Baltim). 2022;158. 10.1016/J.YPMED.2022.107020. [DOI] [PMC free article] [PubMed]
- 42.Kaufman E, Holena DN, Yang WP, et al. Firearm assault in Philadelphia, 2005–2014: a comparison of police and trauma registry data. Trauma Surg Acute Care Open. 2019;4(1):e000316. 10.1136/tsaco-2019-000316. [DOI] [PMC free article] [PubMed] [Google Scholar]
- 43.Branas CC, Culhane D, Richmond TS, Wiebe DJ. Novel linkage of individual and geographic data to study firearm violence. Homicide Stud. 2008;12(3):298. 10.1177/1088767908319756. [DOI] [PMC free article] [PubMed] [Google Scholar]
- 44.Jacoby SF, Dong B, Beard JH, Wiebe DJ, Morrison CN. The enduring impact of historical and structural racism on urban violence in Philadelphia. Soc Sci Med. 2018;199:87. 10.1016/J.SOCSCIMED.2017.05.038. [DOI] [PMC free article] [PubMed] [Google Scholar]
- 45.Poulson M, Neufeld MY, Dechert T, Allee L, Kenzik KM. Historic redlining, structural racism, and firearm violence: A structural equation modeling approach. Lancet Reg Health - Americas. 2021;3. 10.1016/J.LANA.2021.100052. [DOI] [PMC free article] [PubMed]
- 46.Hullenaar KL, Lyons VH, Shepherd JP, Rowhani-Rahbar A, Vavilala MS, Rivara FP. Assault-related injuries reported to police and treated by healthcare providers in the United States. Prev Med (Baltim). 2022;159:107060. 10.1016/J.YPMED.2022.107060. [DOI] [PubMed] [Google Scholar]
- 47.Miller KR, Egger ME, Pike A, et al. The limitations of hospital and law enforcement databases in characterizing the epidemiology of firearm injury. J Trauma Acute Care Surg. 2022;92(1):82–7. 10.1097/TA.0000000000003367. [DOI] [PubMed] [Google Scholar]
- 48.Mueller KL, Trolard A, Moran V, Landman JM, Foraker R. Positioning public health surveillance for observational studies and clinical trials: the St. Louis region-wide hospital-based violence intervention program data repository. Contemp Clin Trials Commun. 2021;21:100683. 10.1016/J.CONCTC.2020.100683. [DOI] [PMC free article] [PubMed] [Google Scholar]
- 49.Magee LA, Ortiz D, Adams ZW, et al. Linking data on nonfatal firearm injuries in youths to assess disease burden. JAMA Netw Open. 2024;7(9):e2436640. 10.1001/JAMANETWORKOPEN.2024.36640. [DOI] [PMC free article] [PubMed] [Google Scholar]
- 50.NYPD Shooting Incident Data (Historic)| NYC Open Data. Accessed June 19, 2023. https://data.cityofnewyork.us/Public-Safety/NYPD-Shooting-Incident-Data-Historic-/833y-fsy8
- 51.Jacoby SF, Smith RN, Beard JH. Rethinking recidivism in firearm injury research and prevention. Prev Med (Baltim). 2022;165. 10.1016/j.ypmed.2022.107221. [DOI] [PubMed]
- 52.Mehranbod CA, Gobaud AN, Jacoby SF, Uzzi M, Bushover BR, Morrison CN. Historical redlining and the epidemiology of present-day firearm violence in the United States: A multi-city analysis. Prev Med (Baltim). 2022;165. 10.1016/J.YPMED.2022.107207. [DOI] [PMC free article] [PubMed]
- 53.World Health Organization. Social determinants of health. 2025. Accessed May 16, 2025. https://www.who.int/news-room/fact-sheets/detail/social-determinants-of-health
- 54.Solar O, Irwin A. A Conceptual Framework for Action on the Social Determinants of Health: Social Determinants of Health Discussion Paper 2 (Policy and Practice).; 2010. Accessed July 25, 2024. https://www.who.int/publications/i/item/9789241500852
- 55.Diderichsen F, Evans T, Whitehead M. Chapter 2: The Social Basis of Disparities. In: Challenging Inequities in Health: From Ethics to Action. Oxford University Press; 2001:12–23. Accessed July 25, 2024. https://www.researchgate.net/publication/280296334_The_Social_Basis_of_Disparities
- 56.Centers for Disease Control. Social Determinants of Health| CDC. Accessed January 3, 2024. https://www.cdc.gov/places/measure-definitions/social-determinants-of-health.html?CDC_AAref_Val=https://www.cdc.gov/places/measure-definitions/social-determinants-of-health/index.html
- 57.U.S. Census Bureau, “American Community Survey 5-Year Estimates,” 2023, accessed on June 18, 2023. http://api.census.gov/data/2023/acs/acs5
- 58.Naik-Mathuria B, Levine Ned Levine N, Cain C, Oluyomi AO, Henson-Garcia M. Comprehensive local injury surveillance for pediatric fatal and nonfatal firearm injury prevention planning. J Appl Res Children: Informing Policy J Appl Res Child. 2021;12(2). 10.58464/2155-5834.1495.
- 59.Post LA, Balsen Z, Spano R, Vaca FE. Bolstering gun injury surveillance accuracy using capture–recapture methods. J Behav Med. 2019;42(4):674–80. 10.1007/s10865-019-00017-4. [DOI] [PubMed] [Google Scholar]
- 60.Victims Rights Law Center. Mandatory Reporting of Non-Accidental Injuries: A State-by-State Guide. 2014. Accessed June 18, 2024. https://4e5ae7d17e.nxcli.net/wp-content/uploads/2021/01/Mandatory-Reporting-of-Non-Accidental-Injury-Statutes-by-State.pdf
- 61.Houry D, Sachs CJ, Feldhaus KM, Linden J. Violence-inflicted injuries: reporting laws in the Fifty States. Ann Emerg Med. 2002;39(1):56–60. 10.1067/MEM.2002.117759. [DOI] [PubMed] [Google Scholar]
- 62.Parker ST. Estimating nonfatal gunshot injury locations with natural language processing and machine learning models. JAMA Netw Open. 2020;3(10):e2020664. 10.1001/JAMANETWORKOPEN.2020.20664. [DOI] [PMC free article] [PubMed] [Google Scholar]
- 63.Armstead TL, Wilkins N, Doreson A. Indicators for Evaluating Community- and Societal-Level Risk and Protective Factors for Violence Prevention: Findings From a Review of the Literature. J Public Health Manag Pract. 2018;24(Suppl 1 INJURY AND VIOLENCE PREVENTION):S42. 10.1097/PHH.0000000000000681 [DOI] [PMC free article] [PubMed]
- 64.Burrell M, White AM, Frerichs L, et al. Depicting the system: how structural racism and disenfranchisement in the United States can cause dynamics in community violence among males in urban Black communities. Soc Sci Med. 2021;272:113469. 10.1016/J.SOCSCIMED.2020.113469. [DOI] [PubMed] [Google Scholar]
- 65.Decker MR, Wilcox HC, Holliday CN, Webster DW. An integrated public health approach to interpersonal violence and suicide prevention and response. Public Health Rep. 2018;133:65–79. 10.1177/0033354918800019. [DOI] [PMC free article] [PubMed] [Google Scholar]
- 66.Barrett JT, Lee LK, Monuteaux MC, Farrell CA, Hoffmann JA, Fleegler EW. Association of county-level poverty and inequities with firearm-related mortality in US youth. JAMA Pediatr. 2022;176(2):E214822. 10.1001/JAMAPEDIATRICS.2021.4822. [DOI] [PMC free article] [PubMed] [Google Scholar]
- 67.Johnson BT, Sisti A, Bernstein M, et al. Community-level factors and incidence of gun violence in the United States, 2014–2017. Soc Sci Med. 2021;280:113969. 10.1016/j.socscimed.2021.113969. [DOI] [PubMed] [Google Scholar]
- 68.Schmidt CJ, Rupp L, Pizarro JM, Lee DB, Branas CC, Zimmerman MA. Risk and protective factors related to youth firearm violence: A scoping review and directions for future research. J Behav Med. 2019;42(4):706. 10.1007/S10865-019-00076-7. [DOI] [PMC free article] [PubMed] [Google Scholar]
- 69.Branas CC, South E, Kondo MC, et al. Citywide cluster randomized trial to restore blighted vacant land and its effects on violence, crime, and fear. Proc Natl Acad Sci U S A. 2018;115(12):2946–51. 10.1073/pnas.1718503115. [DOI] [PMC free article] [PubMed] [Google Scholar]
- 70.Jay J, Kondo MC, Lyons VH, Gause E, South EC. Neighborhood segregation, tree cover and firearm violence in 6 U.S. Cities, 2015–2020. Prev Med (Baltim). 2022;165(Pt A). 10.1016/J.YPMED.2022.107256. [DOI] [PMC free article] [PubMed]
- 71.Branas CC, Han S, Wiebe DJ. Alcohol use and firearm violence. Epidemiol Rev. 2016;38(1):32–45. 10.1093/EPIREV/MXV010. [DOI] [PMC free article] [PubMed] [Google Scholar]
- 72.Gobaud AN, Morrison CN, Branas CC, Jacoby S, Kramer M, Adkins-Jackson PB. Measuring the effect of historical structural racism on community firearm violence in US cities. Soc Sci Med. 2024;361:117355. 10.1016/J.SOCSCIMED.2024.117355. [DOI] [PMC free article] [PubMed] [Google Scholar]
- 73.Bailey ZD, Krieger N, Agénor M, Graves J, Linos N, Bassett MT. Structural racism and health inequities in the USA: evidence and interventions. Lancet. 2017;389(10077):1453–63. 10.1016/S0140-6736(17)30569-X. [DOI] [PubMed] [Google Scholar]
- 74.Siegel M, Rieders M, Rieders H et al. Measuring structural racism and its association with racial disparities in firearm homicide. J Racial Ethn Health Disparities. Published online 2022. 10.1007/s40615-022-01485-2 [DOI] [PMC free article] [PubMed]
- 75.Armstead TL, Wilkins N, Nation M. Structural and social determinants of inequities in violence risk: A review of indicators. J Community Psychol. 2021;49(4):878–906. 10.1002/JCOP.22232. [DOI] [PMC free article] [PubMed] [Google Scholar]
- 76.Wong DW. Modifiable areal unit problem. International encyclopedia of human geography. Published Online January. 2009;1:169–74. 10.1016/B978-008044910-4.00475-2. [Google Scholar]
- 77.Su MD, Lin MC, Wen TH. Spatial mapping and environmental risk identification. Encyclopedia of environmental health. Published Online January 1, 2011:228–35. 10.1016/B978-0-444-52272-6.00636-X
- 78.Dalve K, Gause E, Mills B, Floyd AS, Rivara FP, Rowhani-Rahbar A. Neighborhood disadvantage and firearm injury: does shooting location matter? Inj Epidemiol. 2021;8(1):1–9. 10.1186/s40621-021-00304-2. [DOI] [PMC free article] [PubMed] [Google Scholar]
- 79.Uding CV, Porter LC, Dong B, Moon HR. Violence, place, and health: A review of the literature. Aggress Violent Behav. 2024;78:101983. 10.1016/J.AVB.2024.101983. [Google Scholar]
- 80.Stayton C, Yau R, Seil K et al. Firearm Deaths and Injuries in New York City.; 2013. Accessed June 17, 2023. https://www.nyc.gov/html/om/pdf/2013/firearms_report.pdf
- 81.New York City Department of Health and Mental Hygiene. Why violence is a public health issue. February 8, 2021. Accessed April 17, 2024. https://a816-dohbesp.nyc.gov/IndicatorPublic/data-stories/violence/
- 82.Department of Health and Human Services Centers for Disease Control. Advancing Violence Epidemiology in Real-Time (AVERT). February 23, 2023. Accessed January 29, 2024. https://www.grants.gov/search-results-detail/342933
- 83.Centers for Disease Control and Prevention. Firearm Injury and Death Prevention | Funded Data Projects | Firearm Injury Surveillance Through Emergency Rooms (FASTER) program. July 5, 2024. Accessed June 1, 2025. https://www.cdc.gov/firearm-violence/php/funded-surveillance/index.html
Associated Data
This section collects any data citations, data availability statements, or supplementary materials included in this article.
Data Availability Statement
The New York Police Department Shooting Incident dataset analyzed in the current study are available at https://data.cityofnewyork.us/Public-Safety/NYPD-Shooting-Incident-Data-Historic-/833y-fsy8/about_data The 2019-2023 U.S. Census Bureau American Community Survey 5-Year estimates analyzed during the current study are available at https://www.census.gov/data/developers/data-sets/acs-5year.html.