

Abstract
This study combines experimental and computational approaches to investigate the molecular geometry and physicochemical properties of vildagliptin (VILD). Using methods such as UV-Vis, spectrofluorimetry, FTIR/Raman, and circular dichroism alongside DFT, molecular docking, and dynamics simulations, a reliable molecular model was obtained that aligns closely with X-ray crystallographic data. This model enabled accurate predictions of vibrational frequencies and systematic assignments of vibrational modes. Analyses, including Hirshfeld surface mapping, molecular electrostatic potential, HOMO-LUMO energetics, Fukui indices, and natural population analysis, provided clear insights into VILD’s reactivity, while NBO and TD-DFT studies elucidated key stabilizing interactions and high-energy electronic transitions. NTO visualization further clarified orbital dynamics, and circular dichroism measurements explained the molecular basis of the Cotton effect. Additionally, molecular docking and molecular dynamics simulations confirmed the formation of stable complexes with EGFR, VEGFR2, and HER2 receptor proteins, suggesting potential anticancer activity. The main purpose of this publication is to fill existing gaps in our understanding of VILD’s molecular behavior and offer a robust foundation for rational drug design and improved therapeutic strategies.
Supplementary Information
The online version contains supplementary material available at 10.1007/s10822-025-00646-9.
Keywords: Vildagliptin, Spectroscopy, DFT, FTIR, Raman
Introduction
Gliptins, including the representative agent vildagliptin, represent a relatively recent class of oral antihyperglycemic agents used in the management of type 2 diabetes mellitus. Their therapeutic effect primarily stems from the inhibition of the dipeptidyl peptidase-4 (DPP-4) enzyme, which physiologically inactivates incretin hormones such as glucagon-like peptide-1 (GLP-1) and glucose-dependent insulinotropic polypeptide (GIP). By attenuating DPP-4 activity, these agents modulate glucose homeostasis through multiple pathways: enhancing glucose-dependent insulin secretion, delaying gastric emptying, reducing postprandial glucose excursions, and suppressing appetite [1]. The modest elevation in endogenous GLP-1 levels observed with gliptin therapy may explain their limited impact on weight reduction, contrasting with GLP-1 receptor agonists that sustain supraphysiological incretin concentrations, leading to more pronounced weight loss [2].
The ubiquitous expression of DPP-4 in human tissues raises potential concerns regarding off-target effects. Nevertheless, gliptins are generally well-tolerated, with a low incidence of class-specific adverse events. Reported complications include gastrointestinal disturbances (nausea, vomiting), instances of ketoacidosis following insulin discontinuation [3], debated associations with pancreatitis risk [4–7], and hypersensitivity reactions [8, 9]. Notably, vildagliptin has not received FDA approval due to unresolved safety signals related to arthralgia [10, 11], though it remains authorized by the EMA.
Vildagliptin (2S)-1-[2-[(3-hydroxy-1-adamantyl)amino]acetyl]pyrrolidine-2-carbonitrile (VILD) is a cyanopyrrolidine derivative that incorporates a distinctive adamantane scaffold. The nitrile moiety is relatively prone to oxidation, first yielding an amide and subsequently a carboxylic acid, and it may also undergo cyclization with an amino group - processes that contribute to some of the main impurities in the active pharmaceutical ingredient [12].
The first therapeutic agent featuring an adamantane motif was amantadine, which was initially employed for its antiviral properties and later recognized for its efficacy in treating Parkinson’s disease. Two additional compounds with antiviral activity include rimantadine and tromantadine [13]. Memantine is used as an anti-dementia agent in Alzheimer’s disease, while adapalene, applied topically, serves as an anti-inflammatory drug. Saxagliptin and vildagliptin belong to the class of antidiabetic medications [14].
In recent years, the adamantane framework has attracted considerable interest among medicinal chemists due to its presence in compounds with diverse pharmacodynamic profiles. The literature includes hundreds of studies exploring the biological potential of various adamantane derivatives. Structurally, adamantane is a rigid, symmetrical tricyclic hydrocarbon (point group Td), which enables precise three-dimensional positioning of substituents. This spatial arrangement facilitates the optimization of binding affinity and selectivity toward biological targets. The incorporation of adamantane into drug structures is often employed as a strategy to “escape from flatland” [15]. Introducing large lipophilic groups such as adamantane (sometimes referred to as the “lipophilic bullet”) can transform highly hydrophilic molecules (logP ≪ 0) into more lipophilic and clinically useful compounds [13, 16]. This modification enhances blood-brain barrier (BBB) permeability, improves membrane solubility, and prolongs plasma half-life, as the rigid cage structure protects the pharmacophoric moiety from metabolic degradation [17–19].
Numerous studies have been dedicated to designing novel adamantane-containing derivatives for potential use in the treatment of neurodegenerative diseases [20] as well as for their antibacterial and antiviral [21–25], antimalarial [26, 27], anti-inflammatory [28, 29], and anticancer activities [30–36].
Despite recent reports indicating that vildagliptin may exert antiproliferative effects in various cancer cell lines [37, 38], the molecular basis of this activity remains poorly understood. Existing spectroscopic investigations of vildagliptin, particularly FTIR and Raman studies, have been limited to superficial band assignments and often omit key vibrational modes associated with its cyano and adamantane moieties. Similarly, computational efforts to date have focused on isolated electronic transitions, without incorporating detailed density functional theory (DFT) analyses of reactivity descriptors in conjunction with molecular docking and molecular dynamics (MD) simulations. Consequently, there is a need for an integrated computational-experimental approach that fully assigns vibrational modes, elucidates the electronic structure and reactivity of vildagliptin, and evaluates the stability and dynamics of its complexes with key anticancer kinases (EGFR, HER2, VEGFR2). By combining FTIR, FT-Raman, UV-Vis, three-dimensional spectrofluorimetry, and circular dichroism measurements with DFT-based vibrational, NBO, NLO, and MEP analyses, alongside blind docking and MD simulations, the present study addresses this gap and provides a robust molecular rationale for repurposing vildagliptin in anticancer drug design. A thorough characterization of the physicochemical properties of vildagliptin is essential to facilitate the discovery of compounds with fewer adverse effects, improved storage stability, and to support the rational design of new therapeutic agents with analogous chemical frameworks.
Materials and methods
Materials
Vildagliptin (purity ≥ 98%) and spectroscopic-grade solvents were purchased from Sigma-Aldrich (USA).
Experimental methods
The FTIR transmission spectrum was recorded using a Nicolet 6700 spectrometer (Thermo Scientific, USA). The sample was mixed with anhydrous KBr in a 1:300 ratio, and the resulting mixture was pressed into a pellet. Spectral data were collected over the range 4000–400 cm−1. The FT-Raman spectrum, acquired over 3700–150 cm−1, was obtained with a Nicolet 8700 A spectrometer equipped with a neodymium Nd: YVO4 laser (2 W, 1064 nm) and a germanium detector (NXR Genie). The UV-Vis spectrum of a methanolic solution (0.0005% concentration) was measured using a U-2001 spectrophotometer (Hitachi, Japan) in the 200–400 nm range. Three-dimensional fluorescence spectra were collected on the same solution using an RF-6000 spectrofluorimeter (Shimadzu, Japan) with excitation wavelengths spanning 200–500 nm and emission wavelengths from 200 to 600 nm. Finally, the circular dichroism spectrum of the methanolic solution was recorded in the range of 195–400 nm using a J-815 spectropolarimeter (Jasco, Japan).
Molecular modeling
The molecular structure of vildagliptin was investigated theoretically using density functional theory (DFT) calculations performed in Gaussian 16 Rev. B.01 [39]. Initial geometry was derived from crystallographic data [40]. Gas-phase geometry optimization was executed at the B3LYP/6-311++G(2d, p) level, incorporating Grimme’s D3 dispersion correction with Becke-Johnson damping (D3BJ) [41]. The optimized structure was subsequently used for vibrational frequency and thermodynamic calculations, employing the same functional, basis set, and dispersion correction. The absence of imaginary frequencies confirmed the stability of the minimized geometry. Scaled harmonic vibrational frequencies (scaling factor: 0.965) were analyzed using VEDA 4 [42] to assign atomic group vibrations and quantify potential energy distribution (PED).
Natural bond orbital (NBO) analysis [43] and Fukui function calculations [44] were conducted on the same model. Preliminary studies revealed that the CAM-B3LYP functional [45], combined with the 6-311++G(2d, p) basis set, provided superior agreement with experimental electronic excitation data. Therefore geometry optimization in solvent (using the IEFPCM solvation model [46] in methanol) was performed also incorporating D3BJ correction. Time-dependent DFT (TD-DFT) simulations on the CAM-B3LYP-optimized structure were performed to model electronic transition spectra and electronic circular dichroism. Additionally, geometry optimization of the first excited state was carried out using TD-CAM-B3LYP to simulate emission spectra.
Docking and molecular dynamics
The vacuum-optimized geometry of vildagliptin was employed for molecular docking and dynamics simulations. Crystal structures of tyrosine kinase domain of epidermal growth factor receptor (EGFR, PDB: 1M17) [47], kinase domain of human epidermal growth factor receptor 2 (HER2, PDB: 3PP0) [48] and kinase domain of vascular endothelial growth factor receptor 2 (VEGFR2, PDB: 4AG8) [49] were retrieved from Protein Data Bank. Protein and ligand preparation - including ligand rotatable bond assignment, hydrogen atom addition, and charge assignment - was performed using AutoDockTools [50]. Blind docking was implemented by generating grid boxes encompassing the entire protein structures to exhaustively sample potential binding poses. Docking simulations in AutoDock Vina [51] identified the highest-affinity ligand conformations, with protein-ligand interactions visualized via LigPlot+ [52] and Discovery Studio.
To validate docking-derived complexes, molecular dynamics (MD) simulations were conducted for three protein-ligand systems using GROMACS 2025.1 [53] with the CHARMM36 force field [54]. Ligand topology was generated via the SwissParam server [55]. Each system was solvated in a dodecahedral box with a 1.0 nm spacing between the protein and box edges, followed by TIP3P water molecule addition at 1 g/cm2 density. Ionization (Cl⁻/Na⁺) neutralized the system charge. Energy minimization was performed via steepest descent (50000 steps), followed by equilibration in NVT (100 ps, 300 K, Berendsen thermostat) and NPT (100 ps, 1 bar, C-rescale barostat) ensembles. Production MD runs were executed for 100 ns under constant temperature and pressure (300 K, 1 bar).
Results and discussion
Geometric parameters
The vacuum-optimized geometry of vildagliptin (Fig. 1) closely aligns with its X-ray diffraction (XRD)-derived crystal structure. Selected geometric parameters are summarized in Table 1, with complete data provided in Table S1. The RMSD for interatomic distances between experimental and calculated values is 0.09 Å, indicating a strong correlation. As shown in Figure S1, the deviations primarily involve distances between hydrogen atoms and heavier atoms, which can be attributed to the nature of the XRD method, where the positions of lighter atoms are associated with greater uncertainty. The RMSD for bond angles between individual atoms is 1.11 degrees, indicating good agreement between the calculated and experimental data (Figure S2). The strong agreement between computationally derived and experimental structures underscores the robustness of the theoretical model, enabling detailed analysis of the compound’s geometric features. Minor discrepancies between DFT-optimized and XRD-determined geometries primarily involve bond lengths (e.g., O2-H23) and bond angles within non-cyclic amino, methylene, and carbonyl groups. These variations likely arise from structural relaxation in vacuum conditions and the absence of intermolecular interactions present in the crystalline environment.
Fig. 1.

Optimized structure of vildagliptin and atom numbering
Table 1.
Selected geometrical parameters of vildagliptin optimized in vacuum
| Bond length [Å] | DFT | XRD | Bond angle [o] | DFT | XRD | Bond dihedral [o] | DFT | XRD |
|---|---|---|---|---|---|---|---|---|
| O1–C5 | 1.2216 | 1.2257 | C9–C18–C15 | 110.82 | 109.81 | O1–C5–C13–N4 | 11.16 | 13.46 |
| O2–C9 | 1.4328 | 1.4339 | O2–C9–C11 | 111.39 | 110.19 | C16–N3–C10–C19 | − 6.31 | − 4.58 |
| O2–H23 | 0.9645 | 0.82 | O2–C9–C7 | 111.18 | 110.53 | C10–N3–C16–C20 | − 17.26 | − 20.24 |
| N3–C5 | 1.3622 | 1.3538 | O2–C9–C18 | 106.33 | 107.85 | N3–C10–C19–C20 | 27.44 | 27.65 |
| N3–C10 | 1.4696 | 1.4791 | C13–N4–C15 | 117.79 | 117.09 | C5–N3 -C16–C21 | − 87.19 | − 95.54 |
| N3–C16 | 1.4627 | 1.4619 | O1–C5–C13 | 122.34 | 121.73 | |||
| N4–C13 | 1.445 | 1.4585 | N3–C5–C13 | 115.98 | 115.82 | |||
| N4–C15 | 1.4641 | 1.4775 | C10–N3–C16 | 112.51 | 111.65 | |||
| N4–H24 | 1.0166 | 0.9277 | N6–C21–C16 | 178.20 | 177.84 | |||
| C5–C13 | 1.5218 | 1.5215 | ||||||
| N6–C21 | 1.1498 | 1.1453 | ||||||
| C16–C20 | 1.539 | 1.5292 | ||||||
| C16–C21 | 1.4746 | 1.479 |
The carbon-carbon bond lengths within the adamantane scaffold align with literature-reported values for such bonds, averaging approximately 1.54 Å. Similarly, carbon-hydrogen bond lengths (≈ 1.09 Å) closely match theoretical predictions, though they exhibit a ~ 10% elongation compared to experimental data - a well-documented discrepancy in XRD studies.
The C16–C20 bond in the pyrrolidine ring is elongated relative to other C–C bonds in the system, likely due to steric and electronic effects arising from the substitution of a hydrogen atom at C16 with a nitrile moiety. Conversely, the C16–C21 bond length is shorter than typical single C–C bonds, attributed to electron density redistribution influenced by the adjacent nitrogen atom connected to C21.
Oxygen-carbon bond lengths further highlight structural specificity: the C9–O2 bond measures 1.433 Å, consistent with a single bond, while the C5-O1 bond (1.222 Å) reflects its double-bond character within the carbonyl group. The O2–H23 bond length (0.965 Å) aligns with standard values for hydroxyl-group interactions, corroborating the integrity of the hydrogen-bonding network in the optimized structure.
Most of the bonds connecting carbon and nitrogen atoms in the VILD molecule measure around 1.46 Å, with two notable exceptions: the C21–N6 and C5–N3 bonds. The former is a triple bond with an interatomic distance of 1.15 Å, while the latter is a single bond measuring 1.362 Å. The unusually short length of the C5–N3 bond can be attributed to an electron density shift from the carbon atom, induced by its adjacent double bond to a highly electronegative oxygen atom, thereby imparting a partial double-bond character.
Within the adamantane scaffold, most bond angles between carbon atoms are close to 109°, consistent with sp2 hybridization. An outlier is the angle defined by atoms C15-C18-C9, which measures 110.8°. The terminal atoms in this angle (C15 and C9) are bonded to heteroatoms - nitrogen and oxygen, respectively, whose lone pairs slightly perturb the ideal tetrahedral geometry of the neighboring carbon atoms. Furthermore, the C11–C9–O2 and C7–C9–O2 angles are approximately 111°, whereas the C18–C9–O2 angle is reduced to 106°.
The C13–N4–C15 bond angle (117.8°) deviates markedly from the idealized tetrahedral geometry, suggesting localized electronic perturbations. In contrast, angles within the amide functional group - C13–C5–O1 (≈ 122°), N3–C5–O1 (≈ 122°), and C13–C5–N3 (116°) - align with literature-reported values for amide-bonded systems, confirming the structural integrity of this motif.
Within the pyrrolidine ring, bond angles generally conform to literature values, with the exception of the C10–N3–C16 angle (112°), which exhibits slight expansion likely attributable to steric strain from adjacent substituents. Atoms C16, C21, and N6 are almost collinear, forming an angle of 178.2°, while the carbonyl and amino groups display near-coplanar alignment (N4–C13–C5–O1 dihedral angle: 11°).
Non-planarity of the pyrrolidine ring is evident: atoms C16–N3–C10–C19 lie nearly coplanar (dihedral angle: 6.3°), whereas C20 resides out-of-plane. Dihedral angles for C10–N3–C16–C20 (17.3°) and N3–C10–C19–C20 (27.4°) further underscore the ring’s puckered conformation. The nitrile group adopts a near-perpendicular orientation relative to the carbonyl moiety (C5–N3–C16–C21 dihedral angle: 87.2°), reflecting steric and electronic constraints imposed by the adamantane scaffold.
Vibrational frequency analysis
Vildagliptin’s vibrational wavenumbers were analyzed by comparing experimental FTIR and FT-Raman spectra with DFT-simulated spectra. Theoretical spectra were scaled by a factor of 0.965 to improve alignment with experimental data, a standard correction to account for phase discrepancies (gas-phase calculations vs. solid-state measurements) [56]. Figure S3 presents the RMSD dependence of experimentally and computationally obtained peak wavenumbers on the scaling factor, varied from 1.000 to 0.900. The absence of imaginary frequencies in the computational output confirms the optimized geometry resides at a true potential energy minimum.
The FTIR spectra are partially discussed in the study [57], however, that manuscript provides only a superficial interpretation of the VILD FTIR spectrum and contains some rather obvious errors. The spectra are also addressed in the paper [58], but this work also omits most of the vibrational modes, such as those originating from the cyano group.
The molecule, exhibiting C1 symmetry, comprises 47 atoms and 135 fundamental vibrational modes. Each mode was optimized using algorithms in the VEDA 4 software, and its potential energy distribution (PED) was determined accordingly. Experimental and simulated FTIR spectra are presented in Fig. 2, while normalized Raman spectra are shown in Fig. 3. The spectra were not subjected to baseline correction. A comprehensive vibrational assignment, correlating observed wavenumbers with theoretical modes, is detailed in Table 2.
Fig. 2.

Experimental A and theoretical, B FTIR spectra of vildagliptin
Fig. 3.

Experimental A and theoretical, B Raman spectra of vildagliptin
Table 2.
Experimental and calculated vibrational frequencies (cm− 1) with respective assignments and PED values
| FTIR | Raman | Calc | Scal | IR int. | Raman int. | Assignments with PED(%) |
|---|---|---|---|---|---|---|
| 3385(s) | – | 3807 | 3674 | 12.83 | 174.67 | νOH(100) |
| 3293(s) | 3293(m) | 3494 | 3372 | 39.86 | 83.28 | νNH(100) |
| 3012(w) | 3013(m) | 3125 | 3016 | 13.94 | 97.94 | νasCH2PR(77)+νasCH2PR(11) |
| 2994(w) | 2993(m) | 3111 | 3002 | 20.44 | 124.36 | νasCH2PR(79) |
| 2971(w) | 2973(m) | 3092 | 2984 | 4.46 | 82.94 | νCHPR(98) |
| – | – | 3077 | 2969 | 23.35 | 89.30 | νasCH2PR(78)+νasCH2PR(10) |
| 2957(w) | – | 3070 | 2963 | 45.76 | 84.06 | νasCH2AR(88) |
| – | – | 3067 | 2959 | 62.14 | 111.22 | νasCH2AR(69) |
| 2951(w) | 2950(m) | 3061 | 2954 | 12.10 | 35.09 | νssCH2PR(78)+νasCH2MG(10) |
| – | – | 3060 | 2952 | 30.78 | 117.41 | νasCH2AR(79) |
| – | – | 3059 | 2952 | 17.82 | 73.53 | νasCH2AR(68) |
| – | 2947(s) | 3054 | 2947 | 11.03 | 139.08 | νssCH2PR(84) |
| – | – | 3054 | 2947 | 35.50 | 38.06 | νasCH2AR(69)+νssCH2AR(10) |
| – | – | 3051 | 2944 | 17.19 | 42.91 | νasCH2AR(79) |
| – | 2934(s) | 3041 | 2935 | 51.59 | 541.85 | νssCHAR(83) |
| 2932 | – | 3035 | 2929 | 92.31 | 107.11 | νssCHAR(82) |
| – | – | 3030 | 2924 | 58.60 | 55.77 | νssCH2AR(87) |
| – | 2917(s) | 3020 | 2914 | 21.81 | 120.51 | νssCH2PR(79) |
| 2915(s) | – | 3018 | 2913 | 74.20 | 23.58 | νssCH2PR(74) |
| – | – | 3015 | 2910 | 17.29 | 49.55 | νssCH2AR(80) |
| – | – | 3014 | 2908 | 14.08 | 101.84 | νssCH2AR(92) |
| – | – | 3012 | 2906 | 12.07 | 32.92 | νasCH2AC(78) |
| 2882(m) | 2882(s) | 3009 | 2904 | 65.76 | 111.25 | νssCH2AR(85) |
| – | – | 3003 | 2898 | 9.08 | 24.21 | νssCH2AR(11)+νssCH2AR(75) |
| 2849(s) | 2848(s) | 2950 | 2847 | 30.26 | 75.41 | νssCH2MG(98) |
| 2239(w) | 2238(s) | 2341 | 2259 | 3.91 | 116.43 | νCNNG(92) |
| 1659(s) | 1656(s) | 1719 | 1659 | 258.54 | 16.88 | νCO(84) |
| 1478(w) | 1482(w) | 1530 | 1476 | 4.02 | 3.44 | βscCH2PR(73)+βscCH2PR(10) |
| 1463(w) | 1465(w) | 1525 | 1471 | 3.00 | 1.88 | βscCH2MG(65)+βscCNH(12) |
| 1453(m) | 1455(w) | 1521 | 1468 | 13.82 | 3.58 | βscCH2MG(15)+βscCNH(41) |
| – | – | 1504 | 1451 | 3.88 | 5.86 | βscCH2PR(11)+βscCH2PR(72) |
| 1449(w) | – | 1500 | 1448 | 5.92 | 0.16 | βscCH2AR(82) |
| – | 1441(w) | 1497 | 1445 | 6.71 | 1.66 | βscCH2AR(79) |
| 1440(m) | – | 1496 | 1444 | 12.08 | 0.11 | βscCH2AR(83) |
| 1437(w) | 1434(m) | 1494 | 1442 | 6.16 | 8.56 | βscCH2PR(84) |
| – | – | 1489 | 1437 | 7.90 | 2.21 | βscCNH(12)+βscCH2MG(70) |
| – | – | 1484 | 1432 | 0.78 | 14.16 | βscCH2AR(82) |
| – | – | 1482 | 1431 | 0.23 | 14.24 | βscCH2AR(86) |
| 1406(s) | 1405(w) | 1423 | 1373 | 336.54 | 2.79 | νNCAB(38) |
| 1363(w) | – | 1408 | 1359 | 58.49 | 0.57 | βwagCH2AR(32)+βscCOH(40) |
| 1354(s) | 1353(w) | 1394 | 1345 | 17.69 | 0.87 | βwagCH2AR(33)+βscCOH(14)+τHCCC(10) |
| 1342(w) | 1342(w) | 1389 | 1340 | 23.89 | 1.60 | βwagCH2AR(39) |
| – | – | 1388 | 1339 | 34.77 | 1.23 | βwagCH2AR(31)+τHCCC(13) |
| 1328(m) | – | 1383 | 1334 | 6.21 | 1.92 | βscHCCPR(51) |
| – | – | 1376 | 1328 | 3.84 | 0.05 | βwagCH2AR(55)+τHCCC(16) |
| 1321(w) | 1321(w) | 1373 | 1325 | 6.61 | 2.84 | βwagCH2PR(50) |
| – | – | 1358 | 1310 | 1.81 | 0.46 | βwagCH2PR(53) |
| 1309(m) | 1308(w) | 1355 | 1308 | 14.70 | 3.43 | βwagCH2AR(13) |
| – | – | 1353 | 1305 | 16.58 | 2.43 | βwagCH2AR(19)+τHCCC(12)+τHCCC(16) |
| 1291(w) | 1293(w) | 1338 | 1291 | 80.98 | 5.02 | βwagCH2MG(18) |
| 1280(w) | 1279(m) | 1336 | 1289 | 41.24 | 2.26 | βwagCH2MG(40)+βwagCH2AR(14) |
| – | – | 1335 | 1288 | 5.20 | 1.39 | τHCNCPR(10)+τHCCC(54)+τHCCC(14) |
| – | – | 1315 | 1269 | 2.24 | 1.74 | τHCCC(11)+βtwCH2(23)+τHCCC(20) |
| – | – | 1309 | 1263 | 0.71 | 0.59 | τHCCC(13)+βtwCH2(25)+νCC(14) |
| – | 1264(w) | 1309 | 1263 | 1.45 | 3.73 | βtwCH2(27) |
| 1254(m) | 1255(m) | 1305 | 1259 | 1.85 | 5.14 | βtwCH2(34) |
| 1248(m) | 1248(m) | 1294 | 1248 | 45.65 | 5.30 | τHCCC(16)+νNCPR(25)+βwagCNCPR(11) |
| – | – | 1277 | 1232 | 1.88 | 9.53 | βHCC(15)+τHCCC(22) |
| – | – | 1274 | 1229 | 0.63 | 3.76 | βHCC(51)+βtwCH2(11) |
| 1224(w) | 1225(w) | 1265 | 1221 | 4.07 | 8.81 | βHCC(50)+τHCCN(14)+βtwCH2(13) |
| 1217(w) | 1216(w) | 1263 | 1219 | 5.80 | 6.41 | τHCCC(10) |
| 1189(m) | 1187(w) | 1215 | 1173 | 16.60 | 9.42 | βHCC(27)+βHOC(18)+βtwCH2(10) |
| 1174(w) | 1173(m) | 1214 | 1171 | 47.33 | 5.35 | βHCC(33)+βHCC(10)+νNCPR(11) |
| 1165(w) | – | 1199 | 1157 | 5.96 | 2.62 | τHCCC(15) |
| – | – | 1194 | 1153 | 11.33 | 9.89 | βHCC(10)+βHCC(16)+βtwCH2(12) |
| 1151(m) | 1151(m) | 1191 | 1149 | 48.80 | 4.56 | νNCAN(31) |
| – | 1135(w) | 1182 | 1141 | 4.84 | 4.82 | βHCC(10)+νNCAN(17) |
| 1120(m) | 1117(w) | 1156 | 1115 | 5.99 | 6.21 | νNCAN(19) |
| 1102(w) | 1105(w) | 1146 | 1106 | 29.65 | 6.42 | νNCAN(13)+βHOC(16) |
| 1054(m) | 1055(m) | 1132 | 1092 | 7.30 | 1.50 | τHCCC(24)+βHCC(10) |
| – | – | 1129 | 1089 | 3.81 | 1.84 | βHCC(25) |
| – | – | 1127 | 1088 | 0.65 | 0.21 | βHCC(52)+βtwCH2(21) |
| – | – | 1126 | 1087 | 0.51 | 1.16 | τHCCCPR(13) |
| 1032(m) | 1029(m) | 1071 | 1033 | 50.94 | 8.12 | νOCAO(19) |
| – | – | 1052 | 1015 | 13.14 | 2.09 | νCCAR(15) |
| – | – | 1050 | 1013 | 1.64 | 1.41 | βHCC(19)+νCCAR(29)+βtwCH2(17) |
| 1007(w) | 1006(w) | 1047 | 1011 | 3.44 | 8.49 | νCCAR(11)+νCCPR(17) |
| 998(w) | – | 1041 | 1004 | 17.56 | 1.75 | νCCAR(21)+βtwCH2(15) |
| 984(w) | 985(w) | 1018 | 982 | 10.67 | 4.45 | τHCCNAB(20)+τCONCAB(10)+βrockCH2MG(10) |
| 974(w) | 973(w) | 1013 | 977 | 3.16 | 2.41 | νCCAC(15)+βrockCH2(10) |
| – | – | 1007 | 971 | 1.37 | 1.77 | τHCCNAB(20)+νCCAC(10)+βrockCH2(10) |
| 964(w) | 963(w) | 996 | 961 | 2.08 | 4.34 | νCCAR(13)+τHCCC(16) |
| – | – | 983 | 948 | 1.87 | 1.13 | νCCAR(17) |
| 950(w) | 955(m) | 977 | 943 | 6.64 | 3.82 | βCCNPR(12)+νCCPR(14) |
| 921(w) | 922(w) | 961 | 927 | 3.54 | 3.67 | νCCAR(32)+βrockCH2(19) |
| – | – | 959 | 925 | 2.08 | 2.78 | νCCAR(36) |
| – | 897(w) | 932 | 900 | 10.43 | 2.68 | νCCAR(11)+νCCPR(13)+βrockCH2(11) |
| 888(w) | 889(w) | 924 | 891 | 15.10 | 4.35 | νCCPR(30)+βrockCH2(12) |
| 882(w) | – | 922 | 889 | 9.22 | 0.91 | νCOAO(10)+νCCPR(11)+βrockCH2(10) |
| – | – | 906 | 875 | 0.16 | 0.14 | βHCCPR(10)+τHCCC(39) |
| – | – | 904 | 872 | 0.04 | 0.26 | βHCCAR(10)+τHCCC(38) |
| – | – | 903 | 871 | 0.74 | 0.13 | νCCAR(11)+τHCCC(39) |
| 865(w) | 865(w) | 884 | 853 | 2.88 | 3.84 | βHCCAR(10)+νCCAR(12)+τHCCC(27) |
| 837(w) | 838(m) | 857 | 827 | 6.80 | 11.43 | νCNPR(13) |
| 812(w) | – | 842 | 813 | 2.72 | 2.07 | νCCAR(23) |
| 796(w) | 805(w) | 829 | 800 | 14.67 | 0.41 | τHCCC(12)+νCCPR(20) |
| 775(w) | 775(w) | 809 | 781 | 6.71 | 3.70 | νCCAR(10) |
| – | 741(m) | 785 | 757 | 8.52 | 6.85 | νCCAR(22) |
| 737(w) | – | 778 | 751 | 31.95 | 2.24 | νCCAR(26)+ γHNCC(12) |
| 699(w) | 699(m) | 737 | 711 | 26.60 | 6.74 | γHNCC(25)+βCCOAB(15)+βCCNAN(10) |
| – | 683(w) | 706 | 682 | 0.82 | 11.90 | νCCAR(13)+βCCCAR(22) |
| 644(w) | 644(w) | 658 | 635 | 0.59 | 1.98 | βCCCAR(14)+τCCCCAR(15) |
| 635(w) | 635(w) | 642 | 620 | 1.89 | 1.92 | τHCCCPR(11)+βCCCPR(32) |
| 603(w) | 603(w) | 612 | 591 | 7.34 | 1.12 | τCONCAB(21)+βCNCPR(11) |
| 586(w) | 585(w) | 594 | 573 | 5.10 | 0.75 | βCCCPR(10)+τCONCAB(11) |
| 551(w) | 552(w) | 560 | 540 | 3.26 | 1.13 | βCCCPR(10)+τCONCAB(22) |
| 515(w) | 515(w) | 552 | 532 | 2.89 | 4.24 | νOCAO(11)+βCCCAR(14) |
| – | 495(w) | 522 | 504 | 4.22 | 2.88 | βCNCAB(20)+βCNCNG(10) |
| 480(w) | 480(w) | 494 | 477 | 3.72 | 1.44 | βCNCAB(15)+βCNCAN(13) |
| 463(w) | 461(w) | 482 | 465 | 3.12 | 0.64 | τHCCCAR(13)+τCCCCAR(10)+τCCNCAB(14)+βCCOAO(11) |
| 452(w) | – | 467 | 451 | 2.88 | 0.69 | τHCCCAR(21)+τCOCCAO(19) |
| 432(w) | 431(w) | 458 | 441 | 1.99 | 0.21 | βCNCAB(11)+βCNCAN(12) |
| 422(w) | 421(w) | 435 | 420 | 1.46 | 1.35 | τCCNCAN(10)+τCCOCAO(12) |
| 404(w) | 405(w) | 423 | 408 | 1.37 | 0.92 | βCCCAR(10)+τHCCCAR(17)+βCCCAR(20) |
| – | – | 411 | 396 | 0.51 | 0.92 | βCCCAR(31)+βCCCAR(10) |
| – | 394(w) | 409 | 395 | 0.29 | 1.01 | βCCCAR(11)+βCCCAR(47) |
| – | 373(w) | 396 | 382 | 5.63 | 0.28 | τCCOCAO(23) |
| – | 346(w) | 347 | 335 | 8.26 | 0.99 | τCCCCAR(23)+βCCOAB(11) |
| – | 307(w) | 316 | 305 | 7.39 | 0.78 | βCCOAB(10)+βCCOAO(12)+βCCNAN(17) |
| – | 281(w) | 297 | 286 | 2.40 | 1.35 | τHCCNPR(20)+βCCNNG(24) |
| – | 272(w) | 283 | 274 | 34.88 | 0.80 | βCCCAR(10)+τHCCCAR(12)+τHOCCAO(22) |
| – | – | 273 | 264 | 12.72 | 0.60 | τCCCCAR(22) |
| – | – | 272 | 262 | 6.37 | 0.18 | τCCCCAR(22)+βCCOAO(39) |
| – | 236(w) | 252 | 243 | 50.84 | 1.37 | τHOCCAO(74) |
| – | – | 233 | 224 | 3.87 | 0.43 | τHCNCPR(14)+τHCCNNG(18) |
| – | 197(w) | 195 | 188 | 0.53 | 1.38 | νNCAN(11)+βCCNAN(20) |
| – | 165(w) | 175 | 168 | 4.42 | 0.35 | βCCNAN(34) |
| – | – | 160 | 154 | 0.45 | 0.50 | βCCNAB(31) |
| – | – | 134 | 129 | 1.16 | 0.53 | βCCNNG(16)+βCNCAB(18)+βCCCPR(12) |
| – | – | 121 | 117 | 1.66 | 0.58 | τCNCCAB(45) |
| – | – | 74 | 72 | 3.67 | 1.75 | τCNCCAB(15)+τCNCCAB(23)+τNCCN(10) |
| – | – | 58 | 56 | 1.13 | 1.15 | βCCNAN(14)+τCCCNPR(41) |
| – | – | 40 | 39 | 2.96 | 0.60 | βCCNAN(10)βCCNAB(14)+τCNCCPR(48) |
| – | – | 24 | 24 | 3.53 | 0.19 | τCNCCPR(13)+τNCCN(58) |
| – | – | 13 | 13 | 0.39 | 0.20 | τCCNCAN(83) |
ν , stretching; ss, symmetrical; as, asymmetrical; β, bending; wag, wagging; sc, scissoring; tw, twisting; rock, rocking; γ, out of plane bending; τ, torsion; AR, adamantane ring; PR, pirrolidyne ring; AN, amine nitrogen; AB, amide group; AO, alcohol oxygen; AC, amide carbon; NG, nitrile group; MG, methylene group
The O–H stretching vibration of the hydroxyl group appears as a broad band in the FTIR spectrum, centered at 3385 cm−1. In the Raman spectrum, this mode manifests as a faint, low-intensity signal near the noise threshold. The broadening of the IR band likely arises from intermolecular hydrogen bonding within the crystalline lattice. The DFT-calculated wavenumber for this mode (3673 cm−1) exhibits a significant redshift compared to experimental data, a discrepancy attributable to the harmonic approximation used in simulations and the exclusion of crystal packing effects. In the literature, one can find interpretations of FTIR spectra for the core structure of vildagliptin (3-amino-1-adamantanol), where a characteristic broad band from the hydroxyl group can be observed around 3350 cm−1 [59]. This band partially masks the N–H stretching vibration, which appears as a sharp peak around 3300 cm−1 [60].
The COH bending vibration is observed as a broad IR band overlapping with HCCC torsional modes. In the Raman spectrum, this feature appears as a weak signal at 1354 cm−1. The OHC bending vibration also contributes to a combination band at 1102 cm−1 (PED: 16%). At 1055 cm−1, both FTIR and Raman spectra exhibit a broad band that lacks a corresponding feature in the computational model; this band likely arises from a combination vibration incorporating a COH bending component and is notably red-shifted due to intermolecular forces in the solid phase.
HOCC torsional vibrations lie beyond the FTIR detection range but were identified via Raman spectroscopy and computational analysis at 272 cm−1 (calculated: 273 cm−1) and 236 cm−1 (calculated: 246 cm−1).
The O–C stretching vibration of the hydroxyl group is observed as intense bands at 1032 cm−1 in both IR and Raman spectra. This mode also contributes to combination bands at 882 cm−1 (PED 10%) and 515 cm−1 (PED 11%). Bending and torsional modes involving OCC and OCCC moieties appear as components of multiple combination bands below 460 cm−1.
The prominent IR and Raman band at 1659 cm−1 is unambiguously assigned to the carbonyl (C = O) stretching vibration. OCC bending modes contribute to combination bands observed at 699 cm−1 (PED 15%) and 346 cm−1 (PED 11%). Torsional OCNC vibrations manifest as composite bands, likely corresponding to features at 984 cm−1 (PED 10%), 603 cm−1 (PED 21%), 586 cm−1 (PED 11%), and 551 cm−1 (PED 22%).
A medium-intensity, sharp IR band at 3293 cm−1, accompanied by a moderately intense Raman feature, is assigned to the N–H stretching vibration of the secondary aliphatic amine group, consistent with the characteristic spectral profile of such moieties. The HNC bending vibration of the amine group is confidently identified as the medium-intensity IR/Raman band at 1453 cm−1, while the HNCC out-of-plane bending modes appears as a distinct bands at 737 and 699 cm−1.
The N–C stretching vibration of the amine group manifests as a broad band at 1151 cm−1 and contributes to a combination mode at 1102 cm−1 (PED 13%). CNC bending vibrations are observed as low-frequency combination modes at 699, 480, and 432 cm−1. Torsional NCCC vibrations are tentatively attributed to features near 435, 24, and 13 cm−1.
The sharp, high-intensity IR and Raman band at 2239 cm−1 is assigned to the C≡N stretching vibration of the nitrile group - a feature seldom reported in organic compounds. Bending modes of this group contribute to low-frequency combination bands, tentatively identified at 495 cm−1 (calculated: 521 cm−1, PED 10%), 281 cm−1 (PED 24%), and 129 cm−1 (PED 16%). Torsional NCCH vibrations, lying beyond the instrumental detection range, are hypothesized near 224 cm−1 (PED 18%).
The N-C stretching vibration of the amide group appears as an intense IR band and weak Raman feature at 1406 cm−1. HCCN torsional modes correlate with a medium-intensity IR band at 984 cm−1, while low-intensity CCNC torsional vibrations manifest as components of combination bands below 500 cm−1. Bands at 1248 and 1174 cm−1 are partially attributed to N-C stretching involving pyrrolidine ring carbons. A weak IR band at 950 cm−1 is tentatively linked to the CNC bending vibration of the amide nitrogen atom within the pyrrolidine scaffold.
The C–H stretching vibrations generate overlapping medium-intensity IR bands and stronger Raman features within the 3012–2849 cm−1 range. Notably, the bands at 3012 and 2994 cm−1 are distinct, corresponding to CH stretching within the pyrrolidine ring, while those at 2957, 2952, 2932, and 2882 cm−1 are attributed to adamantane-associated C-H bonds. A band at 2848 cm−1 likely corresponds to methylene group C-H stretching.
Bending vibrations of HCH initiate near 1478 cm−1, with Raman spectra displaying a composite band spanning 1478–1373 cm−1, encompassing symmetric HCH bending modes of the methylene group, pyrrolidine ring, and adamantane scaffold. Overlapping bands at 1263–1280 cm−1 reflect HCH wagging vibrations, predominantly manifesting as combination modes. Raman bands at 1189, 1173, and 1054 cm−1 are linked to combination modes involving HCH bending contributions. In the ranges of 1269–998 cm−1 and 984–882 cm−1, bending vibrations of the twisting and rocking types, respectively, are observed as components of combination vibrations with a relatively low percentage of Potential Energy Distribution (PED). This is consistent with literature data obtained for similar compounds [61].
Computational modeling indicates torsional HCCC vibrations contribute to combination bands across a broad spectral range (1354–281 cm−1). However, their low potential energy distribution (PED) values and weak intensities suggest minimal energetic contributions to the overall vibrational profile.
The C-C stretching vibrations are observed in both the IR and Raman spectra with low intensity, beginning at 1263 cm−1 according to the computational model. However, in the experimental spectra these vibrations are assigned to a wavenumber of 1006 cm−1, and at lower wavenumbers they contribute to combination bands. CCC bending vibrations appear as components of combination bands, for example at 683, 635, and 585 cm−1. Additionally, CCCC twisting vibrations, which exhibit low intensity, have been detected experimentally only at 644, 461, and 346 cm−1. The remaining wavenumbers attributed to these modes through computational analysis are listed in Table 2.
Hirshfeld surface and 2D fingerprint plot
To analyze the intermolecular interactions among vildagliptin atoms within the crystal lattice, a Hirshfeld surface analysis and 2D fingerprint plots were performed. Figure 4 displays the Hirshfeld surface using dnorm (normalized contact distance [62]), where the minimum contact distance (red) and the maximum contact distance (blue) are − 0.3669 and 1.6169, respectively. It is evident that the intermolecular interactions predominantly occur between nitrogen and oxygen atoms, as well as the hydrogen atom of the hydroxyl group.
Fig. 4.
Hirshfeld surface of VILD mapped over dnorm
The 2D fingerprint histogram (Fig. 5) provides a more detailed breakdown of various intra- and intermolecular interactions along with their estimated percentage contributions. For example, interactions between the carbon atom of the nitro group and hydrogen atoms of neighboring molecules account for 4.9% of the total interactions. Interactions involving nitrogen atoms from the nitro and amino groups with hydrogen atoms comprise 17.8%, while those between oxygen atoms and hydrogen atoms account for 13.8%. The majority of the intermolecular interactions (60.8%) result from mutual interactions between hydrogen atoms. The remaining calculated parameters, such as distance to external atom, distance to internal atom, shape index, curvedness, and fragment patch, are presented in Table 3.
Fig. 5.

2D finger plot graphs representing the number of molecular interactions of VILD. A– O H interactions, B– H–H interactions, C– N–H interactions, D– C–H interactions
Table 3.
Hirshfeld surface properties of VILD
| Mode | Minimum interaction | Maximum interaction |
|---|---|---|
| dnorm | −0.3669 | 1.6169 |
| di | 0.9369 | 2.5997 |
| de | 0.9365 | 2.6483 |
| Shape index | −0.9983 | 0.998 |
| Curvedness | −3.899 | 0.2201 |
| Fragment patch | 0 | 13 |
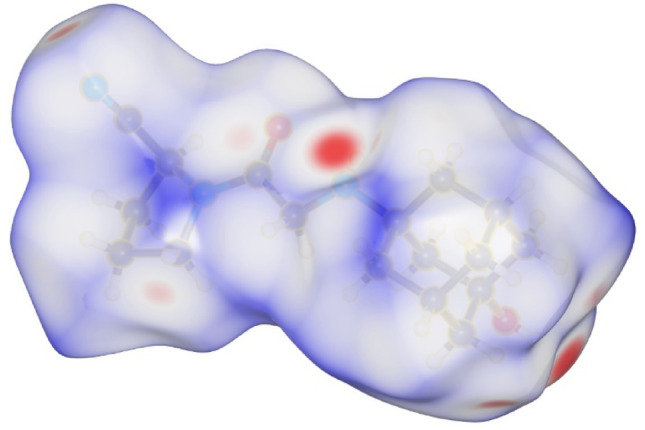
Molecular electrostatic potential (MEP) surface analysis
The ESP surface analysis provides a visual representation and interpretation of the charge distribution around a molecule. This technique is instrumental in predicting how the molecule may interact with ions, reactive species, or solvents by highlighting regions predisposed to electrophilic or nucleophilic attacks. It also offers insights into the binding affinity of drug molecules toward proteins and their preference for polar or nonpolar solvents. The MEP map is constructed on a molecular surface defined by a specific electron density value [63].
For this study, the electrostatic potential was calculated using a molecular model optimized at the B3LYP-D3BJ/6-311++G(2d, p) level. The map indicates the most negative potential in red (−5.456 × 10− 2, −1.485 eV) and the most positive in blue (4.556 × 10− 2, 1.24 eV), with the color scale progressing from red to orange, yellow, green, and blue (Fig. 6). The N6 atom of the nitrile group, due to its lone electron pair, exhibits the most negative potential. Likewise, the oxygen atoms O1 and O2, each carrying two lone pairs, display high electron density and appear in red. These regions are key contributors to the electrophilic reactivity of vildagliptin with less electronegative species.
Fig. 6.

Molecular electrostatic potential surface (MEP) of vildagliptin
Conversely, the highest positive potential is located on the outer part of the pyrrolidine ring, particularly around the C10-C19-C20 region. This area, depicted in light blue on the MEP map, is susceptible to nucleophilic attack due to the electron density being drawn toward nearby electronegative oxygen and nitrogen atoms. The adamantane ring shows a uniformly high potential, represented in green, except for the region with the attached hydroxyl group O2-H23, which creates localized areas of strong negative potential near the oxygen and strong positive potential near the hydrogen.
Nonlinear optical (NLO) properties
The exploration of non-linear optical (NLO) characteristics is a critical element in contemporary photonics and optoelectronics, driving the development of materials with specific optical functionalities. These properties arise from the non-linear response of a material’s electron density to high-intensity electromagnetic fields, diverging from the linear response described by classical optics. Density functional theory (DFT) offers a robust framework for predicting and analyzing NLO phenomena, yielding insights into the structure-property relationships essential for material design [64].
To assess the NLO potential of vildagliptin, dipole moment (µ), polarizability (α), and first hyperpolarizability (β) were computed using its vacuum-optimized geometry. The computed polarizability and hyperpolarizability of VILD were determined to be 31.8 × 10− 24 esu and 1.16 × 10− 30 esu, respectively, representing a considerable enhancement over urea - the prototypical NLO material (Table 4). These results suggest that the compound under investigation may be a promising candidate for further research into optically active materials.
Table 4.
Calculated values of dipole moment, polarizability and hyperpolarizability for VILD
| Dipole moment | Polarizability | Hiperpolarizability | |||
|---|---|---|---|---|---|
| Parameter | DFT (Debye) | Parameter | DFT (esu x10− 24) | Parameter | DFT (esu x10− 30) |
| µ x | − 2.29 | α xx | 38.00 | β xxx | − 0.08 |
| µ y | 5.54 | α xy | − 0.12 | β xxy | 0.60 |
| µ z | 1.99 | α yy | 29.74 | β xyy | − 0.11 |
| µ | 6.31 | α xz | 0.33 | β yyy | 0.53 |
| α yz | 0.47 | β xxz | − 0.62 | ||
| α zz | 27.59 | β xyz | 0.20 | ||
| α | 31.78 | β yyz | 0.49 | ||
| β xzz | − 0.06 | ||||
| β yzz | − 0.07 | ||||
| β zzz | 0.12 | ||||
| β tot | − 1.16 | ||||
Natural bond orbital (NBO) analysis
NBO analysis offers valuable insights into the electronic structure and bonding features of molecules, detailing charge distribution, hybridization states, and donor-acceptor interactions that influence molecular stability and reactivity. By quantifying second-order perturbation energies (E(2)), this method identifies key hyperconjugative interactions and lone pair contributions, which are essential for understanding intramolecular charge transfer and non-covalent forces involved in ligand-receptor binding [65].
NBO calculations were performed on the gas-phase optimized structure using the same functional and basis set with dispersion correction. Data concerning the types of donor and acceptor orbitals, along with second-order perturbation energies exceeding 4 kcal/mol, are summarized in Table 5. High E(2) values indicate strong conjugation between donor and acceptor components.
Table 5.
Second order perturbation theory analysis of Fock matrix in NBO for vildagliptin molecule
| Type | Donor NBO(i) | ED | Type | Acceptor NBO(j) | ED | E(2) [kcal/mol] | E(j)-E(i) a.u. | F(i, j) a.u. |
|---|---|---|---|---|---|---|---|---|
| σ | C5-C13 | 1.97540 | σ* | N3-C16 | 0.26392 | 4.55 | 0.95 | 0.059 |
| σ | N6-C21 | 1.99547 | σ* | C16-C21 | 0.02481 | 5.17 | 1.47 | 0.079 |
| π | N6-C21 | 1.98348 | σ* | N3-C16 | 0.26392 | 4.15 | 0.66 | 0.047 |
| σ | C16-C21 | 1.98305 | σ* | N6-C21 | 0.02481 | 5.73 | 1.67 | 0.087 |
| LP | O1 | 1.86428 | σ* | N3-C5 | 0.29639 | 25.30 | 0.72 | 0.123 |
| LP | O1 | σ* | C5-C13 | 0.02142 | 19.76 | 0.63 | 0.102 | |
| LP | O2 | 1.95842 | σ* | C7-C9 | 0.01302 | 6.23 | 0.68 | 0.058 |
| LP | O2 | σ* | C9-C11 | 0.01897 | 5.75 | 0.68 | 0.056 | |
| LP | N3 | 1.69726 | π* | O1-C5 | 0.02024 | 60.66 | 0.29 | 0.119 |
| LP | N3 | σ* | C10-H28 | 0.02142 | 4.93 | 0.66 | 0.055 | |
| LP | N3 | σ* | C10-H29 | 0.03328 | 5.57 | 0.65 | 0.058 | |
| LP | N3 | σ* | C16-C21 | 0.02481 | 6.75 | 0.68 | 0.065 | |
| LP | N4 | 1.90831 | σ* | C13-H33 | 0.10773 | 6.10 | 0.66 | 0.057 |
| LP | N4 | σ* | C13-H34 | 0.26392 | 6.70 | 0.64 | 0.059 | |
| LP | N6 | 1.96999 | σ* | C16-C21 | 0.02481 | 10.70 | 0.92 | 0.089 |
LP, lone pair
Given that the VILD molecule contains relatively few multiple bonds, no significant π→π* interactions were observed, with these interactions exhibiting stabilization energies below 5 kcal/mol. Instead, the molecule is characterized by the presence of five heteroatoms possessing lone pairs, all of which contribute notably to its stability through interactions with neighboring antibonding orbitals. The most substantial stabilization energy (60.7 kcal/mol) originates from the interaction between the lone pair on the N3 atom and the π-antibonding orbital of the O1–C5 carbonyl group.
Furthermore, strong hyperconjugative interactions were identified between the lone pair on the O1 atom and the σ-antibonding orbitals of both the N3-C5 bond in the amide group and the C5–C13 bond. An additional interaction, between the nonbonding electrons of the N6 atom and the σ-antibonding orbital of the C16-C21 bond, contributes over 10 kcal/mol to the stabilization of the molecule.
Natural population analysis (NPA)
Natural Population Analysis (NPA), a fundamental component of the NBO methodology, offers a chemically intuitive approach for quantifying atomic charge distributions in molecules. By partitioning electron density into natural atomic orbitals (NAOs), NPA assigns atomic charges that reflect localized bonding patterns, hybridization, and resonance effects, providing a coherent picture of the electronic structure that aligns with classical chemical concepts. This approach rigorously accounts for electron delocalization, including hyperconjugation and lone pair interactions, which is essential for understanding charge-transfer phenomena in bioactive compounds. Developed as an alternative to conventional Mulliken population analysis, NPA exhibits enhanced numerical stability and more accurately describes electron distribution in complex molecules [66].
In the vildagliptin molecule, the atomic partial charges show significant variation (Table 6). The most positive charge (0.7099) is found on the carbon atom C5, which forms part of the carbonyl group. Conversely, the most negative charge (−0.7530) is located on oxygen atom O2, a constituent of the alcohol group attached to the adamantane ring. This markedly negative value is attributed to the substantial electronegativity difference between oxygen and its neighboring atoms. All heteroatoms carry negative partial charges, ranging from − 0.3223 to −0.7530, suggesting that these sites are likely to undergo electrophilic attack.
Table 6.
Natural charges of vildagliptin atoms
| No | Atom | Charge | No | Atom | Charge |
|---|---|---|---|---|---|
| 1 | O | − 0.63999 | 25 | H | 0.19511 |
| 2 | O | − 0.75298 | 26 | H | 0.20564 |
| 3 | N | − 0.51188 | 27 | H | 0.20101 |
| 4 | N | − 0.69742 | 28 | H | 0.20325 |
| 5 | C | 0.70988 | 29 | H | 0.18992 |
| 6 | N | − 0.32229 | 30 | H | 0.20907 |
| 7 | C | − 0.39655 | 31 | H | 0.19359 |
| 8 | C | − 0.22076 | 32 | H | 0.19879 |
| 9 | C | 0.27199 | 33 | H | 0.19826 |
| 10 | C | − 0.16425 | 34 | H | 0.19166 |
| 11 | C | − 0.39693 | 35 | H | 0.19580 |
| 12 | C | − 0.21999 | 36 | H | 0.21051 |
| 13 | C | − 0.25368 | 37 | H | 0.26284 |
| 14 | C | − 0.38500 | 38 | H | 0.21276 |
| 15 | C | 0.14244 | 39 | H | 0.20105 |
| 16 | C | − 0.11287 | 40 | H | 0.20212 |
| 17 | C | − 0.37717 | 41 | H | 0.21228 |
| 18 | C | − 0.41048 | 42 | H | 0.21488 |
| 19 | C | − 0.39312 | 43 | H | 0.21008 |
| 20 | C | − 0.36684 | 44 | H | 0.22397 |
| 21 | C | 0.29170 | 45 | H | 0.20663 |
| 22 | C | − 0.37120 | 46 | H | 0.19760 |
| 23 | H | 0.45705 | 47 | H | 0.20158 |
| 24 | H | 0.38191 |
Most carbon atoms in VILD possess a negative partial charge, with the exceptions of atoms C5, C9, C15, and C21. Notably, C5 exhibits the highest positive charge (0.7099), indicating its susceptibility to nucleophilic attack. This elevated positive charge arises from its double bond with a highly electronegative oxygen atom, as well as its linkage to a nitrogen atom. The nitrogen atoms display partial charges of −0.5119 for N3, −0.6974 for N4, and − 0.3223 for N6. The higher negative charge on N4 is consistent with its single bond to carbon atoms, while N3, which is involved in an amide bond that partially attains double bond character, shows a bit lower negative charge. The lowest negative atomic charge is observed on N6, due to its triple bond with carbon C21.
For hydrogen atoms bonded to carbon, the majority of partial charges lie between 0.19 and 0.22, with the lowest value (0.1899) recorded for hydrogen H29, a member of the pyrrolidine ring. In contrast, other hydrogen atoms exhibit higher charges, such as H23 (0.4571) in the alcohol group, H37 (0.2626) located near the nitrogen atoms of the amide and nitrile groups, and H24 (0.3819) which is directly bonded to nitrogen N4.
Local reactivity descriptors
Fukui functions serve as critical descriptors for identifying the most reactive atomic sites within a molecule. By analyzing the electron density distributions of the neutral species as well as its forms with added and removed electron, it is possible to determine whether a given fragment exhibits electrophilic or nucleophilic character. These functions quantify changes in electron density induced by variations in electron count and are mathematically defined as:
 |
1 |
where ρ(r) represents electron density, N denotes the total number of electrons, and v(r) corresponds to the external nuclear potential.
The function describing electron acquisition (nucleophilic reactivity), denoted as f+(r), is expressed as:
 |
2 |
Conversely, the function for electron donation (electrophilic reactivity), f−(r), is defined as:
 |
3 |
Here, r specifies the atomic site, N is the electron count in the neutral state, while ρN+1(r) and ρN−1(r) represent electron densities for the species with added and removed electron, respectively [67].
A refined extension of the Fukui functions is the dual descriptor, which offers better efficiency in characterizing atomic site reactivity. This index is formulated as the difference between f+(r) and f−(r). Positive values of the dual descriptor highlight regions susceptible to nucleophilic attack, whereas negative values indicate sites prone to electrophilic interactions [68].
The Fukui functions were calculated based on natural population analysis, and the values are shown in Table 7. The analysis of the computed Fukui functions for the vildagliptin molecule suggests that a nucleophilic attack is most likely at atom C21, the carbon of the nitrile group. In contrast, markedly lower function values are observed for atom C15 (the adamantane carbon connected to the amino-group nitrogen) and for atom N3, the nitrogen of the amide group within the pyrrolidine ring. Additionally, atoms C17 and C5 exhibit positive f+ values.
Table 7.
Values of the Fukui indices calculated from natural population analysis
| No | Atom | f+ | f− | f0 | dual |
|---|---|---|---|---|---|
| 1 | O | − 0.01509 | − 0.03819 | − 0.02664 | 0.02310 |
| 2 | O | − 0.00615 | − 0.02307 | − 0.01461 | 0.01692 |
| 3 | N | 0.00324 | − 0.07326 | − 0.03501 | 0.07650 |
| 4 | N | − 0.00043 | − 0.45465 | − 0.22754 | 0.45422 |
| 5 | C | 0.00169 | 0.02357 | 0.01263 | − 0.02188 |
| 6 | N | − 0.03594 | − 0.05562 | − 0.04578 | 0.01968 |
| 7 | C | − 0.00995 | 0.00408 | − 0.00294 | − 0.01403 |
| 8 | C | − 0.00496 | 0.00147 | − 0.00175 | − 0.00643 |
| 9 | C | − 0.00455 | − 0.00881 | − 0.00668 | 0.00426 |
| 10 | C | − 0.02684 | 0.01469 | − 0.00608 | − 0.04153 |
| 11 | C | − 0.00535 | 0.00531 | − 0.00002 | − 0.01066 |
| 12 | C | − 0.00848 | 0.00172 | − 0.00338 | − 0.01020 |
| 13 | C | − 0.01091 | 0.05740 | 0.02325 | − 0.06831 |
| 14 | C | − 0.00613 | 0.00543 | − 0.00035 | − 0.01156 |
| 15 | C | 0.00374 | 0.02151 | 0.01263 | − 0.01777 |
| 16 | C | − 0.00330 | 0.00116 | − 0.00107 | − 0.00446 |
| 17 | C | 0.00199 | 0.00828 | 0.00514 | − 0.00630 |
| 18 | C | − 0.00315 | − 0.02892 | − 0.01604 | 0.02577 |
| 19 | C | − 0.01960 | 0.00150 | − 0.00905 | − 0.02110 |
| 20 | C | − 0.01856 | 0.00207 | − 0.00825 | − 0.02063 |
| 21 | C | 0.02378 | 0.02622 | 0.02500 | − 0.00244 |
| 22 | C | − 0.00574 | 0.00551 | − 0.00012 | − 0.01125 |
All carbon atoms display a propensity for electrophilic attack, except for atom C18, which is situated near an alcohol group. The highest f− values are found at carbon atom C13 of the glycine fragment bonded to an amino group. Moreover, both atom C5 of the amide group and atom C21 of the nitrile group show elevated Fukui function values, while atoms C15 and C10 exhibit a somewhat reduced susceptibility to electrophilic attack.
For radical attacks, atoms C21 and C13 appear to be the most favorable sites, with lower f0 values calculated for atoms C5 and C15. Meanwhile, the dual descriptor highlights atom N4 (a secondary amine) as preferentially prone to nucleophilic attack, likely due to the nearby amide group - a potent electron-withdrawing system. Conversely, the carbon atom C13 bonded to N4 shows the highest tendency toward electrophilic attack.
Global reactivity
An evaluation of frontier orbitals (HOMO - Highest Occupied Molecular Orbital and LUMO - Lowest Unoccupied Molecular Orbital) together with reactivity parameters is fundamental in contemporary computational chemistry, enabling the prediction of reaction mechanisms and the assessment of molecular stability. Density functional theory (DFT) methods offer a quantitative framework for characterizing these properties. In particular, they allow the determination of parameters such as hardness (η) and chemical softness (S), which reflect a molecule’s susceptibility to structural deformation under external charge perturbations. Molecules that are more reactive in interactions driven by polarization are classified as soft, while those resisting charge-induced distortion are regarded as hard. Notably, molecular hardness is enhanced by higher electronegativity, a measure of an atom’s tendency to attract electrons, and by an increased HOMO-LUMO energy gap. Electronegativity (χ) measures an atom’s attraction to electrons, while chemical potential (µ) reflects the likelihood of an electron leaving its orbital. The electrophilicity index (ω) indicates a molecule’s tendency to accept electrons in reactions [69, 70].
The HOMO-LUMO energy gap (ΔE = ELUMO - EHOMO) for the vildagliptin molecule, optimized in vacuum, was determined to be 5.4691 eV (Table 8). This value indicates moderate chemical stability, which is typical for many organic compounds. For context, compounds with significantly higher energy gaps, such as 9.848 eV [71], are generally considered more chemically stable, while those with lower gaps, for example 3.573 eV [72], tend to be more reactive. The high ionization potential (IP = 6.21 eV), representing the energy required to remove an electron from the molecule, points to a low propensity for ionization and, consequently, high chemical robustness. Although the electron affinity is relatively low (0.74 eV), suggesting that only a modest amount of energy is released upon the theoretical formation of an anion, the fact that it remains positive, together with the negative chemical potential (-3.4 eV) and a comparatively high electrophilicity index (2.2), implies a notable tendency for electron acceptance, thereby classifying the molecule as a good electrophile. This characterization is further reinforced by the electronegativity value (3.47), which reflects the molecule’s ability to attract electrons.
Table 8.
Calculated global reactivity descriptors of VILD
| Descriptor | Value |
|---|---|
| HOMO [eV] | − 6.2065 |
| LUMO [eV] | − 0.7374 |
| IP [eV] | 6.2065 |
| EA [eV] | 0.7374 |
| χ | 3.4720 |
| η | 2.7345 |
| S | 0.3657 |
| µ | − 3.4720 |
| ω | 2.2041 |
Vildagliptin is characterized by a high chemical hardness (2.73) and low chemical softness (0.37), suggesting that it is more predisposed to engage in ion-forming reactions rather than in processes that lead to the formation of covalent bonds.
The molecular orbital model for the HOMO and LUMO is presented in Fig. 7. It can be observed that the electron density in the highest occupied molecular orbital is predominantly localized on the nitrogen atom of the amino group, with partial extension onto carbon atom C13 of the glycine fragment and the carbons C15 and C18 of the adamantane moiety. Conversely, the lowest unoccupied molecular orbital is primarily distributed over the pyrrolidine ring, with a lesser contribution from the nitrile group.
Fig. 7.

Frontier molecular orbitals of VILD calculated with DFT
UV-Vis spectroscopic analysis
The UV-Vis spectrum of vildagliptin was acquired in methanol (Fig. 8) using a 0.001% w/v solution. Experimental results demonstrated strong alignment with computational predictions derived from time-dependent density functional theory (TD-DFT) simulations employing the CAM-B3LYP functional, 6-311++G(2d, p) basis set, and Grimme’s D3BJ dispersion correction. Geometrical optimization and spectral modeling were conducted using the integral equation formalism polarizable continuum model (IEF-PCM) to account for solvation effects in methanol.
Fig. 8.

Experimental and theoretical UV-Vis spectra of vildagliptin solution in methanol
Excitation energies and oscillator strengths, calculated via TD-DFT, were processed using GaussSum [73], enabling systematic assignment of electronic transitions to specific molecular orbital interactions with quantified percentage contributions. The first ten excited states of VILD are summarized in Table 9. For mixed-character excitations, natural transition orbital (NTO) analysis was employed to visualize dominant electron-hole pair interactions. This method diagonalizes the transition density matrix, distilling complex excitations into spatially localized charge transfer pathways, thereby clarifying the primary contributors to each transition [74].
Table 9.
Calculated absorption wavelength, oscillator and rotatory strength and major contributions to excitation
| No. | Wavelength | Osc. strength | Rotatory strength | Major contributions |
|---|---|---|---|---|
| 1 | 206.77 | 0.007 | 14.87 | HOMO->LUMO (51%), HOMO->L+5 (14%) |
| 2 | 205.77 | 0.0029 | − 7.79 | H-3->L+9 (34%), H-3->L+10 (23%), H-3->L+16 (10%) |
| 3 | 197.84 | 0.0395 | − 15.79 | HOMO->L+7 (14%), HOMO->L+9 (33%), HOMO->L+10 (15%), HOMO->L+16 (10%) |
| 4 | 191.05 | 0.0153 | − 0.34 | HOMO->L+2 (34%), HOMO->L+3 (20%) |
| 5 | 187.59 | 0.0315 | 1.51 | HOMO->L+1 (10%), HOMO->L+2 (28%), HOMO->L+3 (21%), HOMO->L+7 (10%) |
| 6 | 185.23 | 0.0016 | − 5.29 | H-2->LUMO (15%), HOMO->L+1 (31%), HOMO->L+3 (11%) |
| 7 | 181.51 | 0.005 | − 9.32 | H-2->LUMO (30%), H-2->L+1 (13%), HOMO->L+1 (21%) |
| 8 | 180.86 | 0.0192 | 7.16 | H-1->LUMO (24%), H-1->L+1 (19%), H-1->L+3 (13%) |
| 9 | 176.77 | 0.2057 | − 18.71 | H-2->L+9 (31%), H-2->L+10 (15%), H-2->L+12 (14%) |
| 10 | 172.80 | 0.0258 | − 14.81 | H-3->LUMO (24%), HOMO->L+7 (14%) |
The vildagliptin molecule does not contain chromophores with strong light-absorbing capabilities, necessitating the input of relatively high energy to achieve electronic excitation. The primary chromophores are the lone pairs on the nitrogen and oxygen atoms, along with the π bonds in the carbonyl and nitrile groups. In the first electronic transition, electron transfer from the HOMO to the LUMO dominates, accounting for 51% of the transition, although the oscillator strength for this process is low. This is reflected in the experimental spectrum, which shows only a subtle inflection at approximately 209 nm. It is also important to note that UV-Vis spectra recorded in solution typically exhibit broadened absorption bands. This broadening arises from solute-solvent interactions (hydrogen bonds, van der Waals forces), which can perturb the energy levels of the solute molecules and lead to loss of fine spectral structure.
The hole NTO is predominantly localized near the lone pair of the amine nitrogen in VILD (Fig. 9), whereas the particle NTO is mainly associated with the π* orbital of the carbonyl group. Subsequent transitions in the computational model are closely spaced. Transitions No. 3 and No. 5, occurring at 197.84 nm and 187.59 nm respectively, display high oscillator strengths and involve the HOMO and higher-lying LUMO orbitals. In the experimental spectrum, these wavelengths correspond to a very intense peak, arising from the overlap of multiple electronic transitions.
Fig. 9.

Representation of natural transition orbitals (NTO) of the “particle” and “hole” pairs for the VILD excitations
For these transitions, the hole NTOs exhibit a distribution similar to that of the first transition, which is consistent with the dominant involvement of the HOMO. In transition No. 3, the particle NTO is primarily localized within the amide group, with a lesser contribution from the nitrile group. Conversely, the particle NTO for transition No. 5 extends over the central region of VILD, encompassing the amine and amide nitrogens as well as the carbonyl group. Transition No. 9, observed at 176.77 nm, exhibits the highest oscillator strength; however, this region falls outside the measurable range of the available instrumentation.
Analysis of the density of states (DOS) for molecular orbitals provides valuable insights into the energy-dependent distribution of electronic states and enables the determination of the contributions from specific orbitals to the overall electronic characteristics of the system [75]. In Fig. 10, occupied states are depicted in green while unoccupied states are shown in red. A significant energy gap is evident between the ground and excited states, and the states around 6–7 eV are observed to be very closely spaced.
Fig. 10.

Density of state spectrum of VILD
Circular dichroism analysis
Circular dichroism (CD) is a UV-Vis spectroscopic technique that elucidates the structure of compounds by measuring the differential absorption of right- and left-circularly polarized light. This method is particularly effective for molecules featuring chiral groups adjacent to their chromophores. Enhanced absorption of left-circularly polarized light results in positive Cotton effects, whereas predominance in right-circularly polarized absorption gives rise to negative bands [76]. Experimental CD spectra were obtained using the same methanolic solution (0.001% w/v) as for the UV-Vis analysis. In parallel, theoretical data were generated via time-dependent DFT (TD-DFT) on a geometry optimized in methanol using the CAM-B3LYP/6-311++G(2d, p) basis set with D3BJ dispersion corrections.
Figure 11 displays the CD spectra, where a low-intensity positive band is observed with maxima at 224 nm (experimental) and 213 nm (computational), alongside a more intense negative band with peaks at 204 nm (experimental) and 195 nm (theoretical). The ordering of the positive and negative Cotton effects is consistent across both datasets, although the theoretical model overestimates the excitation wavelength by approximately 11 nm. This shift may result from not accounting for all specific interactions between the solute and solvent molecules (the IEF-PCM approximation was used). Analysis of the rotatory strengths indicates that the positive Cotton effect arises from two overlapping electronic transitions near 206 and 205 nm, one contributing positively and the other negatively. The second prominent CD feature is attributed to transition No. 3, which exhibits a relatively high negative rotatory strength (see Table 9). Overall, the presence of distinct Cotton effects in VILD confirms that the molecular orbitals involved in the initial electronic transitions have a high electron density in the vicinity of the chiral center (carbon C16).
Fig. 11.

Experimental and theoretical circular dichroism spectra of VILD
Fluorescence analysis
A spectrofluorimetric measurement was performed on a 0.001% methanolic solution of vildagliptin, capturing the interrelation among excitation wavelength, emission wavelength, and emission intensity (3D fluorescence). Figure 12 illustrates the spectrum, where (in addition to the Rayleigh scattering line detected at a 45° angle) a region of relatively intense emission is observed upon excitation with radiation in the 200–210 nm range. The emission maximum occurs around 240 nm.
Fig. 12.

3D fluorimetric spectrum of vildagliptin solution in methanol
In contrast, the computational spectrum (TD-DFT/CAM-B3LYPD3BJ/6-311++G(2d, p)) predicts an emission maximum at 437 nm upon excitation at 206 nm, a value that is clearly overestimated. The pronounced emission intensity between 200 and 240 nm may be attributed to the small energy differences among the higher occupied orbitals. Consequently, via internal conversion, the observed emission likely results from overlapping emissions from transitions involving S5-S1 to S0.
Thermodynamic properties analysis
Thermodynamic parameters of vildagliptin were derived from density functional theory (DFT) frequency calculations performed on the gas-phase optimized molecular structure. Standard thermodynamic functions - heat capacity ( ), entropy (S0), and enthalpy (H0) - were computed across a temperature range of 100–1000 K at constant pressure. Vibrational frequencies were scaled by a factor of 0.965 to enhance accuracy (Table S2). The temperature-dependent data were fitted to quadratic functions Eqs. (2)–(5), achieving correlation coefficients (R2) exceeding 0.9996.
 |
4 |
 |
5 |
 |
6 |
As the temperature increases, the VILD molecule behaves as anticipated. Its enthalpy, heat capacity, and entropy all rise with temperature; entropy increases in an almost linear fashion, heat capacity shows a diminishing rate of increase at higher temperatures, and the enthalpy growth accelerates with temperature (see Fig. 13).
Fig. 13.

Entropy, enthalpy and heat capacity curves calculated for vildagliptin
Molecular Docking
Molecular docking has become a cornerstone in analyzing interactions between substances and protein structures, enabling fast and virtually cost-free preliminary testing of potential ligand-protein interactions. It allows atomic-level examination of intermolecular forces, which facilitates the exploration of new mechanisms of action or rational changes to the core structure for better ligand binding. Three proteins, commonly considered as potential targets for anticancer drugs, were selected in this study. They were analyzed using molecular docking and molecular dynamics simulations to assess the stability of the possible complexes with VILD and to determine the types of interactions preferred in protein-ligand binding.
Tyrosine kinases are enzymes that catalyze the phosphorylation of tyrosine residues within proteins, thereby initiating signaling cascades essential for cellular processes such as proliferation, differentiation, migration, metabolism, and apoptosis. Genetic alterations, including mutations or overexpression of these enzymes, have been implicated in oncogenic transformation. The EGFR, a prominent member of the tyrosine kinase family, is frequently overexpressed in various types of cancer, including non-small cell lung cancer, breast, esophageal, cervical cancer, as well as head and neck tumors [77]. Given these observations, targeting EGFR activity represents a rational and promising approach in the development of anticancer therapies [78, 79].
Under pathological conditions, the activation of EGFR leads to upregulation of VEGF expression. Subsequent binding of VEGF to its receptor, particularly VEGFR2, initiates the process of angiogenesis. VEGFR, itself a member of the tyrosine kinase receptor family, plays a pivotal role in tumor progression by mediating angiogenic pathways. Consequently, VEGFR has emerged as an attractive molecular target for anticancer drug development [79, 80].
HER2, a transmembrane receptor belonging to the tyrosine kinase family, plays a crucial role in modulating cellular proliferation and division. This protein is capable of forming both homodimers and heterodimers with other members of the EGFR family, through mechanisms that may depend on the presence or absence of specific ligands [81]. The amplification and overexpression of HER2 are key factors underlying the aggressive behavior observed in certain cancers, highlighting the urgent necessity for precision-targeted therapies. Small-molecule inhibitors targeting the tyrosine kinase activity of HER2 have been developed, providing a selective means to disrupt aberrant signaling pathways in HER2-driven tumors [82].
The interactions between VILD and 1M17 are predominantly hydrophobic. Amino acids located in close proximity to the ligand and participating in these interactions include Val702, Ala719, Lys721, Met742, Thr766, and Leu820, which interact with the adamantane moiety, as well as Arg817 and Asn818, which interact with the pyrrolidine ring. In addition, two hydrogen bonds can be observed: one formed between Lys720 or Asp831 (or both, as indicated by the molecular dynamics simulation) and the hydrogen atom of the amino group, and another between Thr830 and the hydrogen atom of the hydroxyl group (Fig. 14). The calculated binding energy for this complex is -7.612 kcal/mol. The amino acids in the vicinity of VILD are very similar to those identified as interacting with various anticancer ligands [79, 83–86].
Fig. 14.

Docking results of VILD and three analyzed proteins with specified, nearest amino acids interacting with the ligand
Vildagliptin binds to the tyrosine kinase inhibitor site of VEGFR2 (4AG8) at nearly the same location as ligands reported in the literature [79, 83, 87]. However, in contrast to these ligands, the interactions between VILD and 4AG8 are predominantly hydrophobic. Amino acids in close proximity to the adamantane scaffold of the ligand include Cys817, Ala881, Glu885, Ile888, and Arg1027. Leu889, Leu1019, Cys1024, His1026, Ile1025, Ile1044, and Asp1046 interact hydrophobically with the pyrrolidine ring. Only one hydrogen bond was identified in this complex, formed between the hydrogen atom of the hydroxyl group and Ser884. The binding energy determined for this complex is -6.996 kcal/mol.
In the 3PP0 complex with vildagliptin, a single hydrogen bond is observed between the hydroxyl hydrogen of VILD and Ser783. The remaining interactions are hydrophobic in nature and occur between Leu726, Gly727, Ser728, Val734, Arg849, and Leu852 and the pyrrolidine ring, as well as between Lys753, Leu785, Leu796, Thr798, Thr862, and Asp863 and the adamantane moiety. The docking algorithm estimated the binding energy for this interaction at -8.587 kcal/mol. In this case, these amino acids can also be identified as interacting with other compounds exhibiting anticancer activity [88, 89].
Molecular dynamics simulations
Molecular dynamics simulations were employed enable real-time observation of interactions between proteins and ligands, allowing for the assessment of complex stability and understanding the mechanism of interaction between the respective structures. For each of the three docked protein-vildagliptin systems 100 ns MD simulations were conducted at a temperature of 300 K. The stability of the complexes was confirmed by monitoring parameters over time, including root mean square deviation (RMSD), radius of gyration (Rg), root mean square fluctuation (RMSF) and hydrogen bond count (Fig. 15). Binding free energy was calculated using the Poisson-Boltzmann method with the gmx_MMPBSA package [90], based on van der Waals, electrostatic interactions, and solvation energy terms.
Fig. 15.

RMSD, RMSF curves, radius of gyration and a number of hydrogen bonds formed between VILD and three analyzed proteins
For the 1M17 system, the RMSD ranged between 0.15 and 0.35 nm over the course of the simulation for both the isolated protein and its ligand-bound complex. However, following ligand binding, the fluctuation amplitude decreased significantly, and the average RMSD of the complex was reduced by approximately 0.5 nm compared to the unbound protein, reaching a plateau after around 40 ns. For the last 50 ns, the average RMSD values were 0.27 ± 0.02 nm, with the slope of the curve being 0.0002 nm/ns. The RMSF values showed only minor differences between the protein and the complex, and they did not exceed 0.3 nm. A decrease in values can be observed for amino acids located in close proximity to the ligand. The radius of gyration stayed below 2.07 nm during the entire simulation, with a slightly lower value observed for the 1M17-VILD complex (for the last 50 ns, the average RMSD values were 1.98 ± 0.03 nm). The number of hydrogen bonds fluctuated between 0 and 4, averaging around 1 for most of the trajectory. During the last 50 ns of the simulation, the ligand is observed to be in contact with the amino acids Thr830 and Asp831 for most of the time (Fig. 16). For approximately half of the production simulation, VILD remains in the vicinity of the amino acids Val718, Ala719, Met742, Ala743, Ser744, Arg817, and Leu820. Notably, interaction with the gatekeeper residue Thr766 is also observed, which is consistent with the results obtained from molecular docking as well as with literature data describing ligand-binding sites in EGFR [91, 92]. The calculated binding free energy (ΔGtotal) was − 5.3 kcal/mol (Fig. 17), indicating a moderate stability of the interaction between the enzyme and vildagliptin.
Fig. 16.

The occupancy plot of the amino acid residues of proteins in contact with VILD (the number of simulation frames from the last 50 ns of MD production run)
Fig. 17.

Binding energies with energy components of VILD complexes with 1M17, 4AG8 and 3PP0 proteins
Similarly, in the vildagliptin-VEGF receptor complex, minor RMSD fluctuations were observed during the simulation, stabilizing around 40 ns within the range of 0.15–0.25 nm (with an average of 0.19 ± 0.03 nm and a slope of -0.0004 nm/ns for the last 50 ns). The unbound protein exhibited slightly higher amplitude, suggesting system stabilization upon ligand binding. RMSF analysis revealed minimal differences between the complex and the unbound protein, with stabilization observed in residues interacting with the adamantane moiety and marginally elevated RMSF values for amino acids near the pyrrolidine ring. The radius of gyration for both the complex and the unbound protein remained nearly identical, fluctuating within a narrow range (2.00–2.05 nm), with marginally lower values for the complex (for the last 50 ns, the average RMSD was 2.02 ± 0.02 nm). A single hydrogen bond remained stable throughout the simulation, likely involving Ser884 or Asp1046, as suggested by the contact analysis (Fig. 16), which is consistent with literature data for other compounds interacting with the enzyme [93–95]. VILD also spends a noticeable amount of time in the vicinity of the amino acids Cys817, Glu885, Cys919, Cys1024, Ile1025, and His1026. The calculated binding free energy ΔGtotal was − 5.2 kcal/mol, also indicating a moderate stability of the interaction between the receptor and vildagliptin.
The vildagliptin-3PP0 protein complex exhibited slightly reduced stability under the tested conditions. Minor variations in RMSD values were observed between the isolated protein and the 3PP0-VILD complex. Specifically, RMSD values peaked at 0.4 nm twice during the simulation (approximately 50 ns and 90 ns), but remained within 0.2–0.3 nm for the majority of the trajectory, indicating system stabilization. For the last 40 ns of the simulation, the average RMSD values were 0.26 ± 0.05 nm, with a slope of 0.0003 nm/ns. RMSF analysis revealed higher fluctuations in the complex compared to the unbound protein for residues interacting with the cyanopyrrolidine moiety, while lower fluctuations were observed for amino acids near the adamantane scaffold. Overall, fluctuations were minimal, with most residues exhibiting RMSF values in the 0.05–0.2 nm range. The radius of gyration analysis showed no significant differences between the complex and unbound protein, fluctuating within 1.97–2.07 nm for both systems. However, minor transient spikes (still below 2.07 nm) were detected in the complex (the average Rg was 2.03 ± 0.04 nm, for the last 40 ns of the simulation). Hydrogen bonding in the 3PP0-VILD complex varied between 0 and 3 throughout the simulation, with two bonds being the most frequently observed configuration. Compared to previously described kinases, VILD remains in the vicinity of several amino acids for most of the production simulation (the last 50 ns). These include, in particular, Lys753, Ser783, Leu785, Leu796, Thr798, Thr862, and Asp863, which were also identified in the docking analysis and are commonly reported in the literature as residues frequently interacting with various ligands [96–98]. The computed total binding free energies (ΔGtotal) were − 23.3 kcal/mol for the 3PP0-VILD indicating a high stability of the interaction between the receptor and vildagliptin. Detailed ΔG values for the three protein systems are provided in Table 10.
Table 10.
Interaction energy components calculated with gmx_mmpbsa method
| Energy component [kcal/mol] | 1M17 | 4AG8 | 3PP0 |
|---|---|---|---|
| van der Waals contribution | − 10.2 | − 18.6 | − 41.9 |
| electrostatic contribution | − 5.6 | − 27.3 | − 16.7 |
| polar contribution to the solvation free energy | 11.9 | 43.6 | 39.1 |
| non-polar contribution to the solvation free energy | − 1.4 | − 2.9 | − 3.9 |
| ΔGgas | − 15.8 | − 45.8 | − 58.6 |
| ΔGsolv | 10.5 | 40.7 | 35.3 |
| ΔGtotal | − 5.3 | − 5.2 | − 23.3 |
Conclusions
This study undertook a comprehensive examination of the geometry and physicochemical properties of vildagliptin (VILD) through an integrated approach combining experimental techniques (UV-Vis spectroscopy, spectrofluorimetry, FTIR/Raman spectrometry, circular dichroism spectroscopy) and computational strategies (DFT, molecular docking, molecular dynamics simulations). The computationally derived geometric model of the molecule aligns with crystallographic data reported in the literature. The accuracy of this structural framework enabled the acquisition of vibrational frequency data, which demonstrated a strong correlation with experimental results, thereby facilitating the assignment of wavenumbers to specific vibrational modes.
Hirshfeld surface analysis and molecular electrostatic potential mapping provided a visual assessment of VILD’s reactivity, while quantitative descriptors such as HOMO-LUMO energies, Fukui functions, and natural population analysis yielded quantifiable numerical values for local and global reactivity parameters. In addition, NBO analysis revealed substantial hyperconjugative interactions that contribute to the stabilization of the molecule. The combined use of UV–Vis spectrophotometry and TD-DFT computations clarified the details of the electronic transitions, indicating that relatively high energy (corresponding to wavelengths below 209 nm) is required to trigger these processes. NTO visualization further clarified the spatial characteristics of “hole” and “particle” orbitals. Moreover, both experimental and computational circular dichroism assessments provided insights into the origins of the Cotton effect observed in vildagliptin. Spectrofluorimetric studies, however, suggested that this technique may not be the most effective for detecting VILD.
Based on literature data regarding the potential anticancer activity of VILD, three proteins were selected as possible targets for vildagliptin. Molecular docking provided detailed insights into these interactions, while molecular dynamics simulations revealed that the most stable complexes are formed between VILD and targets 1M17 and 4AG8, whereas slightly less stable associations occur with 3PP0 protein. These findings collectively enhance the understanding of VILD’s molecular behavior and its interactions with biological targets, providing a foundation for further pharmacological exploration as a potential therapeutic agent in anticancer treatment.
Supplementary Information
Below is the link to the electronic supplementary material.
Author contributions
The author confirms sole responsibility for the following: study conception and design, data collection, analysis and interpretation of results, and manuscript preparation.
Funding
No funding was received to assist with the preparation of this manuscript.
Data availability
No datasets were generated or analysed during the current study.
Declarations
Conflict of interest
The author declare no competing interests.
Footnotes
Publisher’s note
Springer Nature remains neutral with regard to jurisdictional claims in published maps and institutional affiliations.
References
- 1.Makrilakis K (2019) The role of DPP-4 inhibitors in the treatment algorithm of type 2 diabetes mellitus: when to select, what to expect. Int J Environ Res Public Health 16:2720. 10.3390/ijerph16152720 [DOI] [PMC free article] [PubMed] [Google Scholar]
- 2.Koliaki C, Doupis J (2011) Incretin-based therapy: a powerful and promising weapon in the treatment of type 2 diabetes mellitus. Diabetes Therapy 2:101–121. 10.1007/s13300-011-0002-3 [DOI] [PMC free article] [PubMed] [Google Scholar]
- 3.Brown E, Heerspink HJL, Cuthbertson DJ, Wilding JPH (2021) SGLT2 inhibitors and GLP-1 receptor agonists: established and emerging indications. Lancet 398:262–276. 10.1016/S0140-6736(21)00536-5 [DOI] [PubMed] [Google Scholar]
- 4.Knapen LM, de Jong RGPJ, Driessen JHM, Keulemans YC, van Erp NP, De Bruin ML, Leufkens HGM, Croes S, de Vries F (2017) Use of incretin agents and risk of acute and chronic pancreatitis: A population-based cohort study. Diabetes Obes Metab 19:401–411. 10.1111/dom.12833 [DOI] [PubMed] [Google Scholar]
- 5.Egan AG, Blind E, Dunder K, de Graeff PA, Hummer BT, Bourcier T, Rosebraugh C (2014) Pancreatic safety of Incretin-Based Drugs — FDA and EMA assessment. N Engl J Med 370:794–797. 10.1056/NEJMp1314078 [DOI] [PubMed] [Google Scholar]
- 6.Cohen D (2013) European drugs agency clashes with scientists over safety of GLP-1 drugs. BMJ 347:f4838–f4838. 10.1136/bmj.f4838 [DOI] [PubMed] [Google Scholar]
- 7.Butler AE, Campbell-Thompson M, Gurlo T, Dawson DW, Atkinson M, Butler PC (2013) Marked expansion of exocrine and endocrine pancreas with incretin therapy in humans with increased exocrine pancreas dysplasia and the potential for Glucagon-Producing neuroendocrine tumors. Diabetes 62:2595–2604. 10.2337/db12-1686 [DOI] [PMC free article] [PubMed] [Google Scholar]
- 8.Dicker D (2011) DPP-4 inhibitors. Diabetes Care 34:S276–S278. 10.2337/dc11-s229 [DOI] [PMC free article] [PubMed] [Google Scholar]
- 9.Byrd JS, Minor DS, Elsayed R, Marshall GD (2011) DPP-4 inhibitors and angioedema: a cause for concern? Annals of allergy. Asthma Immunol 106:436–438. 10.1016/j.anai.2011.02.012 [DOI] [PubMed] [Google Scholar]
- 10.FDA (2015) FDA Drug Safety Communication: FDA warns that DPP-4 inhibitors for type 2 diabetes may cause severe joint pain
- 11.Tarapués M, Cereza G, Figueras A (2013) Association of musculoskeletal complaints and gliptin use: review of spontaneous reports. Pharmacoepidemiol Drug Saf 22:1115–1118. 10.1002/pds.3503 [DOI] [PubMed] [Google Scholar]
- 12.Polyakova EB, Sabirzyanov DR, Prozorova NA, Foteeva AV (2022) Physicochemical properties and methods of analysis of vildagliptin (Review). Pharm Chem J 56:110–117. 10.1007/s11094-022-02606-1 [DOI] [PMC free article] [PubMed] [Google Scholar]
- 13.Liu J, Obando D, Liao V, Lifa T, Codd R (2011) The many faces of the Adamantyl group in drug design. Eur J Med Chem 46:1949–1963. 10.1016/j.ejmech.2011.01.047 [DOI] [PubMed] [Google Scholar]
- 14.Lis-Cieplak A (2012) Pochodne adamantanu - różnorodność Działań biologicznych. Przegląd substancji Dopuszczonych do Lecznictwa w Polsce Oraz Potencjalnych Leków. Prospects Pharm Sci 10:18–25. 10.56782/pps.88 [Google Scholar]
- 15.Dane C, Montgomery AP, Kassiou M (2025) The Adamantane scaffold: beyond a lipophilic moiety. Eur J Med Chem 291:117592. 10.1016/j.ejmech.2025.117592 [DOI] [PubMed] [Google Scholar]
- 16.Štimac A, Šekutor M, Mlinarić-Majerski K, Frkanec L, Frkanec R (2017) Adamantane in drug delivery systems and surface recognition. Molecules 22:297. 10.3390/molecules22020297 [DOI] [PMC free article] [PubMed] [Google Scholar]
- 17.Wanka L, Iqbal K, Schreiner PR (2013) The lipophilic bullet hits the targets: medicinal chemistry of Adamantane derivatives. Chem Rev 113:3516–3604. 10.1021/cr100264t [DOI] [PMC free article] [PubMed] [Google Scholar]
- 18.Dane C, Cumbers GA, Allen B, Montgomery AP, Danon JJ, Kassiou M (2024) Unlocking therapeutic potential: the role of Adamantane in drug discovery. Aust J Chem 77. 10.1071/CH24075
- 19.Lamoureux G, Artavia G (2010) Use of the Adamantane structure in medicinal chemistry. Curr Med Chem 17:2967–2978. 10.2174/092986710792065027 [DOI] [PubMed] [Google Scholar]
- 20.Dembitsky VM, Gloriozova TA, Poroikov VV (2020) Pharmacological profile of natural and synthetic compounds with rigid adamantane-based scaffolds as potential agents for the treatment of neurodegenerative diseases. Biochem Biophys Res Commun 529:1225–1241. 10.1016/j.bbrc.2020.06.123 [DOI] [PubMed] [Google Scholar]
- 21.Popiołek Ł, Janas W, Hordyjewska A, Biernasiuk A (2024) Novel Adamantane derivatives: synthesis, cytotoxicity and antimicrobial properties. Appl Sci 14:3700. 10.3390/app14093700 [Google Scholar]
- 22.Warda ET, El-Ashmawy MB, Habib E-SE, Abdelbaky MSM, Garcia-Granda S, Thamotharan S, El-Emam AA (2022) Synthesis and in vitro antibacterial, antifungal, anti-proliferative activities of novel adamantane-containing thiazole compounds. Sci Rep 12:21058. 10.1038/s41598-022-25390-0 [DOI] [PMC free article] [PubMed] [Google Scholar]
- 23.Stankova I, Chuchkov K, Chayrov R, Mukova L, Galabov A, Marinkova D, Danalev D (2020) Adamantane derivatives containing thiazole moiety: synthesis, antiviral and antibacterial activity. Int J Pept Res Ther 26:1781–1787. 10.1007/s10989-019-09983-4 [Google Scholar]
- 24.Suslov EV, Mozhaytsev ES, Korchagina DV, Bormotov NI, Yarovaya OI, Volcho KP, Serova OA, Agafonov AP, Maksyutov RA, Shishkina LN, Salakhutdinov NF (2020) New chemical agents based on adamantane–monoterpene conjugates against orthopoxvirus infections. RSC Med Chem 11:1185–1195. 10.1039/D0MD00108B [DOI] [PMC free article] [PubMed] [Google Scholar]
- 25.Chayrov R, Parisis NA, Chatziathanasiadou MV, Vrontaki E, Moschovou K, Melagraki G, Sbirkova-Dimitrova H, Shivachev B, Schmidtke M, Mitrev Y, Sticha M, Mavromoustakos T, Tzakos AG, Stankova I (2020) Synthetic analogues of Aminoadamantane as influenza viral inhibitors—In vitro, in Silico and QSAR studies. Molecules 25:3989. 10.3390/molecules25173989 [DOI] [PMC free article] [PubMed] [Google Scholar]
- 26.Yvette OM, Malan SF, Taylor D, Kapp E, Joubert J (2018) Adamantane amine-linked chloroquinoline derivatives as chloroquine resistance modulating agents in plasmodium falciparum. Bioorg Med Chem Lett 28:1287–1291. 10.1016/j.bmcl.2018.03.026 [DOI] [PubMed] [Google Scholar]
- 27.Singh C, Kanchan R, Sharma U, Puri SK (2007) New Adamantane-Based Spiro 1,2,4-Trioxanes orally effective against rodent and Simian malaria. J Med Chem 50:521–527. 10.1021/jm0610043 [DOI] [PubMed] [Google Scholar]
- 28.Ragshaniya A, Kumar V, Tittal RK, Lal K (2024) Nascent Pharmacological advancement in Adamantane derivatives. Arch Pharm (Weinheim) 357. 10.1002/ardp.202300595 [DOI] [PubMed]
- 29.Mugnaini C, Rabbito A, Brizzi A, Palombi N, Petrosino S, Verde R, Di Marzo V, Ligresti A, Corelli F (2019) Synthesis of novel 2-(1-adamantanylcarboxamido)thiophene derivatives. Selective cannabinoid type 2 (CB2) receptor agonists as potential agents for the treatment of skin inflammatory disease. Eur J Med Chem 161:239–251. 10.1016/j.ejmech.2018.09.070 [DOI] [PubMed] [Google Scholar]
- 30.Yu H, Li Y, Ge Y, Song Z, Wang C, Huang S, Jin Y, Han X, Zhen Y, Liu K, Zhou Y, Ma X (2016) Novel 4-anilinoquinazoline derivatives featuring an 1-adamantyl moiety as potent EGFR inhibitors with enhanced activity against NSCLC cell lines. Eur J Med Chem 110:195–203. 10.1016/j.ejmech.2016.01.045 [DOI] [PubMed] [Google Scholar]
- 31.Lorenzo P, Alvarez R, Ortiz MA, Alvarez S, Piedrafita FJ, de Lera ÁR (2008) Inhibition of IκB Kinase-β and anticancer activities of novel chalcone Adamantyl arotinoids. J Med Chem 51:5431–5440. 10.1021/jm800285f [DOI] [PubMed] [Google Scholar]
- 32.Wassel MMS, Ammar YA, Elhag Ali GAM, Belal A, Mehany ABM, Ragab A (2021) Development of Adamantane scaffold containing 1,3,4-thiadiazole derivatives: design, synthesis, anti-proliferative activity and molecular Docking study targeting EGFR. Bioorg Chem 110:104794. 10.1016/j.bioorg.2021.104794 [DOI] [PubMed] [Google Scholar]
- 33.Mozhaitsev ES, Zakharenko AL, Suslov EV, Korchagina DV, Zakharova OD, Vasil’eva IA, Chepanova AA, Black E, Patel J, Chand R, Reynisson J, Leung IKH, Volcho KP, Salakhutdinov NF, Lavrik OI (2019) Novel inhibitors of DNA repair enzyme TDP1 combining monoterpenoid and Adamantane fragments. Anticancer Agents Med Chem 19:463–472. 10.2174/1871520619666181207094243 [DOI] [PubMed] [Google Scholar]
- 34.Hu H, Wen F, Zhen T, Zhang M, Qin J, Huang J, Chen Z, Yu M, Hu S, Fang M, Zeng J-Z (2025) Design, synthesis, and biological evaluation of N1-(2-(adamantan-1-yl)-1H-indol-5-yl)-N2-(substituent)-1,2-dicarboxamides as anticancer agents targeting Nur77-mediated Endoplasmic reticulum stress. Bioorg Chem 155:108113. 10.1016/j.bioorg.2024.108113 [DOI] [PubMed] [Google Scholar]
- 35.Kalita U, Kaping S, Nongkynrih R, Sunn M, Boiss I, Singha LI, Vishwakarma JN (2015) Synthesis, structure elucidation, and anti-inflammatory/anti-cancer/anti-bacterial activities of novel (Z)-3-. Med Chem Res 24:32–50. adamantyl-1-aryl-prop/but-2-en-1-ones 10.1007/s00044-014-1086-x [Google Scholar]
- 36.Jaber AM, Al-Mahadeen MM, Al-Qawasmeh RA, Taha MO (2023) Synthesis, anticancer evaluation and Docking studies of novel adamantanyl-1,3,4-oxadiazol hybrid compounds as Aurora-A kinase inhibitors. Med Chem Res 32:2394–2404. 10.1007/s00044-023-03145-4 [Google Scholar]
- 37.Jaiswal P, Tripathi V, Assaiya A, Kashyap D, Dubey R, Singh A, Kumar J, Chandra Jha H, Sharma R, Kumar Dixit A, Singh Parmar H (2022) Anti-cancer effects of sitagliptin, vildagliptin, and exendin-4 on triple-negative breast cancer cells via mitochondrial modulation. BIOCELL 46:2645–2657. 10.32604/biocell.2022.021754 [Google Scholar]
- 38.Nath M, Bhattacharjee K, Choudhury Y (2021) Vildagliptin, a dipeptidyl peptidase-4 inhibitor, reduces betel-nut induced carcinogenesis in female mice. Life Sci 266:118870. 10.1016/j.lfs.2020.118870 [DOI] [PubMed] [Google Scholar]
- 39.Frisch MJ, Trucks GW, Schlegel HB, Scuseria GE, Robb MA, Cheeseman JR, Scalmani G, Barone V, Petersson GA, Nakatsuji H, Li X, Caricato M, Marenich AV, Bloino J, Janesko BG, Gomperts R, Mennucci B, Hratchian HP, Ortiz JV, Izmaylov AF, Sonnenberg JL, Williams-Young D, Ding F, Lipparini F, Egidi F, Goings J, Peng B, Petrone A, Henderson T, Ranasinghe D, Zakrzewski VG, Gao J, Rega N, Zheng G, Liang W, Hada M, Ehara M, Toyota K, Fukuda R, Hasegawa J, Ishida M, Nakajima T, Honda Y, Kitao O, Nakai H, Vreven T, Throssell K, Montgomery JA Jr, Peralta JE, Ogliaro F, Bearpark MJ, Heyd JJ, Brothers EN, Kudin KN, Staroverov VN, Keith TA, Kobayashi R, Normand J, Raghavachari K, Rendell AP, Burant JC, Iyengar SS, Tomasi J, Cossi M, Millam JM, Klene M, Adamo C, Cammi R, Ochterski JW, Martin RL, Morokuma K, Farkas O, Foresman JB, Fox DJ (2016) Gaussian 16 rev B.01
- 40.Ou X, Li X, Rong H, Yu L, Lu M (2020) A general method for cultivating single crystals from melt microdroplets. Chem Commun 56:9950–9953. 10.1039/D0CC03157G [DOI] [PubMed] [Google Scholar]
- 41.Grimme S, Ehrlich S, Goerigk L (2011) Effect of the damping function in dispersion corrected density functional theory. J Comput Chem 32:1456–1465. 10.1002/jcc.21759 [DOI] [PubMed] [Google Scholar]
- 42.Jamróz Michal H (2004) Vibrational Energy Distribution Analysis VEDA 4 [DOI] [PubMed]
- 43.Glendening ED, Reed AE, Carpenter JE, Weinhold F (1998) NBO Version 3.1
- 44.Yang Weitao, Mortier WJ (1986) The use of global and local molecular parameters for the analysis of the gas-phase basicity of amines. J Am Chem Soc 108:5708–5711. 10.1021/ja00279a008 [DOI] [PubMed] [Google Scholar]
- 45.Yanai T, Tew DP, Handy NC (2004) A new hybrid exchange–correlation functional using the Coulomb-attenuating method (CAM-B3LYP). Chem Phys Lett 393:51–57. 10.1016/j.cplett.2004.06.011 [Google Scholar]
- 46.Cancès E, Mennucci B, Tomasi J (1997) A new integral equation formalism for the polarizable continuum model: theoretical background and applications to isotropic and anisotropic dielectrics. J Chem Phys 107:3032–3041. 10.1063/1.474659 [Google Scholar]
- 47.Stamos J, Sliwkowski MX, Eigenbrot C (2002) Structure of the epidermal growth factor receptor kinase domain alone and in complex with a 4-Anilinoquinazoline inhibitor. J Biol Chem 277:46265–46272. 10.1074/jbc.M207135200 [DOI] [PubMed] [Google Scholar]
- 48.Aertgeerts K, Skene R, Yano J, Sang B-C, Zou H, Snell G, Jennings A, Iwamoto K, Habuka N, Hirokawa A, Ishikawa T, Tanaka T, Miki H, Ohta Y, Sogabe S (2011) Structural analysis of the mechanism of Inhibition and allosteric activation of the kinase domain of HER2 protein. J Biol Chem 286:18756–18765. 10.1074/jbc.M110.206193 [DOI] [PMC free article] [PubMed] [Google Scholar]
- 49.McTigue M, Murray BW, Chen JH, Deng Y-L, Solowiej J, Kania RS (2012) Molecular conformations, interactions, and properties associated with drug efficiency and clinical performance among VEGFR TK inhibitors. Proceedings of the National Academy of Sciences 109:18281–18289. 10.1073/pnas.1207759109 [DOI] [PMC free article] [PubMed]
- 50.Morris GM, Huey R, Lindstrom W, Sanner MF, Belew RK, Goodsell DS, Olson AJ (2009) AutoDock4 and AutoDockTools4: automated Docking with selective receptor flexibility. J Comput Chem 30:2785–2791. 10.1002/jcc.21256 [DOI] [PMC free article] [PubMed] [Google Scholar]
- 51.Trott O, Olson AJ (2010) AutoDock vina: improving the speed and accuracy of Docking with a new scoring function, efficient optimization, and multithreading. J Comput Chem 31:455–461. 10.1002/jcc.21334 [DOI] [PMC free article] [PubMed] [Google Scholar]
- 52.Wallace AC, Laskowski RA, Thornton JM (1995) LIGPLOT: a program to generate schematic diagrams of protein-ligand interactions. Protein Eng Des Selection 8:127–134. 10.1093/protein/8.2.127 [DOI] [PubMed] [Google Scholar]
- 53.Abraham MJ, Murtola T, Schulz R, Páll S, Smith JC, Hess B, Lindahl E (2015) GROMACS: high performance molecular simulations through multi-level parallelism from laptops to supercomputers. SoftwareX 1–2:19–25. 10.1016/j.softx.2015.06.001 [Google Scholar]
- 54.Huang J, MacKerell AD (2013) CHARMM36 all-atom additive protein force field: validation based on comparison to NMR data. J Comput Chem 34:2135–2145. 10.1002/jcc.23354 [DOI] [PMC free article] [PubMed] [Google Scholar]
- 55.Bugnon M, Goullieux M, Röhrig UF, Perez MAS, Daina A, Michielin O, Zoete V (2023) SwissParam 2023: A modern Web-Based tool for efficient small molecule parametrization. J Chem Inf Model 63:6469–6475. 10.1021/acs.jcim.3c01053 [DOI] [PMC free article] [PubMed] [Google Scholar]
- 56.Palafox MA (2018) DFT computations on vibrational spectra: scaling procedures to improve the wavenumbers. Phys Sci Reviews 3. 10.1515/psr-2017-0184
- 57.Mane SS, Khan MA (2023) Development of UV-Visible spectrophotometric method for the Estimation of vildagliptin in different medium. J Pharm Biol Sci 10:83–87. 10.18231/j.jpbs.2022.016 [Google Scholar]
- 58.Gumieniczek A, Berecka-Rycerz A, Fornal E, Żyżyńska-Granica B, Granica S (2021) Comprehensive insight into chemical stability of important antidiabetic drug vildagliptin using chromatography (LC-UV and UHPLC-DAD-MS) and spectroscopy (Mid-IR and NIR with PCA). Molecules 26:5632. 10.3390/molecules26185632 [DOI] [PMC free article] [PubMed] [Google Scholar]
- 59.Bai J, Liu Z, Zhang J, Zhong F (2019) Synthesis and characterization of novel high transparency polymer films bearing adamantanol groups. Colloids Surf Physicochem Eng Asp 578:123594. 10.1016/j.colsurfa.2019.123594 [Google Scholar]
- 60.Jesionek P, Hachuła B, Tarnacka M, Jurkiewicz K, Kamiński K, Kamińska E (2024) Comparative studies on the nature and kinetics of phase transitions in plastic crystals: Hydrogen-bonded Adamantane derivatives. J Mol Liq 413:125907. 10.1016/j.molliq.2024.125907 [Google Scholar]
- 61.Garcia JC, Justo JF, Machado WVM, Assali LVC (2010) Structural, electronic, and vibrational properties of Amino-adamantane and Rimantadine isomers. J Phys Chem A 114:11977–11983. 10.1021/jp107496b [DOI] [PubMed] [Google Scholar]
- 62.Spackman MA, Jayatilaka D (2009) Hirshfeld surface analysis. CrystEngComm 11:19–32. 10.1039/B818330A [Google Scholar]
- 63.Politzer P, Murray JS (2021) Molecular electrostatic potentials: significance and applications. Chemical reactivity in confined systems. Wiley, pp 113–134
- 64.Boyd RW (2020) The nonlinear optical susceptibility. Nonlinear optics. Elsevier, pp 1–64
- 65.Al-Shehri MM, Al-Majed A-RA, Aljohar HI, El-Emam AA, Pathak SK, Sachan AK, Prasad O, Sinha L (2017) First principle study of a potential bioactive molecule with tetrahydroisoquinoline, carbothiomide and Adamantane scaffolds. J Mol Struct 1143:204–216. 10.1016/j.molstruc.2017.04.070 [Google Scholar]
- 66.Reed AE, Weinstock RB, Weinhold F (1985) Natural population analysis. J Chem Phys 83:735–746. 10.1063/1.449486 [Google Scholar]
- 67.Fuentealba P, Cardenas C, Pino-Rios R, Tiznado W (2016) Topological Analysis of the Fukui Function. pp 227–241
- 68.Martínez-Araya JI (2015) Why is the dual descriptor a more accurate local reactivity descriptor than Fukui functions? J Math Chem 53:451–465. 10.1007/s10910-014-0437-7 [Google Scholar]
- 69.Domingo L, Ríos-Gutiérrez M, Pérez P (2016) Applications of the conceptual density functional theory indices to organic chemistry reactivity. Molecules 21:748. 10.3390/molecules21060748 [DOI] [PMC free article] [PubMed] [Google Scholar]
- 70.Geerlings P, De Proft F, Langenaeker W (2003) Conceptual density functional theory. Chem Rev 103:1793–1874. 10.1021/cr990029p [DOI] [PubMed] [Google Scholar]
- 71.Oktemer TS, Celik S, Ozel AE, Akyuz S, Er A (2025) Vibrational spectroscopic characterization, quantum chemical, molecular Docking and molecular dynamics investigations of cyclo(L-phenylalanyl-L-proline), an anticancer agent. Spectrosc Lett 58:241–259. 10.1080/00387010.2024.2432331 [Google Scholar]
- 72.Celik S, Yilmaz G, Akyuz S, Ozel AE (2024) Shedding light into the biological activity of aminopterin, via molecular structural, docking, and molecular dynamics analyses. J Biomol Struct Dyn 42:7773–7794. 10.1080/07391102.2023.2245493 [DOI] [PubMed] [Google Scholar]
- 73.O’boyle NM, Tenderholt AL, Langner KM (2008) Cclib: A library for package-independent computational chemistry algorithms. J Comput Chem 29:839–845. 10.1002/jcc.20823 [DOI] [PubMed] [Google Scholar]
- 74.Martin RL (2003) Natural transition orbitals. J Chem Phys 118:4775–4777. 10.1063/1.1558471 [Google Scholar]
- 75.Sholl DS, Steckel JA (2009) Density functional theory. Wiley
- 76.Kobayashi N, Muranaka A, Mack J (2011) Circular dichroism and magnetic circular dichroism spectroscopy for organic chemists. The Royal Society of Chemistry
- 77.Harari PM (2004) Epidermal growth factor receptor Inhibition strategies in oncology. Endocr Relat Cancer 11:689–708. 10.1677/erc.1.00600 [DOI] [PubMed] [Google Scholar]
- 78.Seshacharyulu P, Ponnusamy MP, Haridas D, Jain M, Ganti AK, Batra SK (2012) Targeting the EGFR signaling pathway in cancer therapy. Expert Opin Ther Targets 16:15–31. 10.1517/14728222.2011.648617 [DOI] [PMC free article] [PubMed] [Google Scholar]
- 79.Sangande F, Julianti E, Tjahjono DH (2020) Ligand-Based pharmacophore modeling, molecular docking, and molecular dynamic studies of dual tyrosine kinase inhibitor of EGFR and VEGFR2. Int J Mol Sci 21:7779. 10.3390/ijms21207779 [DOI] [PMC free article] [PubMed] [Google Scholar]
- 80.Pennell NA, Lynch TJ (2009) Combined Inhibition of the VEGFR and EGFR signaling pathways in the treatment of NSCLC. Oncologist 14:399–411. 10.1634/theoncologist.2008-0276 [DOI] [PubMed] [Google Scholar]
- 81.Tirumalasetty MCB, Aluru R, Baki VB, Devi S, Gunasekar D, Rajendra W (2016) Development of novel HER2 inhibitors against gastric cancer derived from flavonoid source of < em > syzygium alternifolium through molecular dynamics and pharmacophore-based screening. Drug Des Devel Ther Volume 10:3611–3632. 10.2147/DDDT.S111914 [DOI] [PMC free article] [PubMed] [Google Scholar]
- 82.Liu H-N, Zhu Y, Chi Y, Zhang Y, Li X, Wen W, Shan L-S, Wang Y-T, Dai B (2024) Synthetic routes and clinical application of Small-Molecule HER2 inhibitors for cancer therapy. Bioorg Chem 151:107653. 10.1016/j.bioorg.2024.107653 [DOI] [PubMed] [Google Scholar]
- 83.Yang H, Zhang Z, Liu Q, Yu J, Liu C, Lu W (2023) Identification of Dual-Target inhibitors for epidermal growth factor receptor and AKT: virtual screening based on structure and molecular dynamics study. Molecules 28:7607. 10.3390/molecules28227607 [DOI] [PMC free article] [PubMed] [Google Scholar]
- 84.Khan MN, Farooq U, Khushal A, Wani TA, Zargar S, Khan S (2025) Unraveling potential EGFR kinase inhibitors: computational screening, molecular dynamics insights, and MMPBSA analysis for targeted cancer therapy development. PLoS ONE 20:e0321500. 10.1371/journal.pone.0321500 [DOI] [PMC free article] [PubMed] [Google Scholar]
- 85.Sun J, Wang X-Y, Lv P-C, Zhu H-L (2015) Discovery of a series of novel Phenylpiperazine derivatives as EGFR TK inhibitors. Sci Rep 5:13934. 10.1038/srep13934 [DOI] [PMC free article] [PubMed] [Google Scholar]
- 86.Singh P, Bast F (2014) In Silico molecular Docking study of natural compounds on wild and mutated epidermal growth factor receptor. Med Chem Res 23:5074–5085. 10.1007/s00044-014-1090-1 [Google Scholar]
- 87.Rampogu S, Baek A, Zeb A, Lee KW (2018) Exploration for novel inhibitors showing back-to-front approach against VEGFR-2 kinase domain (4AG8) employing molecular Docking mechanism and molecular dynamics simulations. BMC Cancer 18:264. 10.1186/s12885-018-4050-1 [DOI] [PMC free article] [PubMed] [Google Scholar]
- 88.Paul D, Mahanta S, Tag H, Das SK, Das Gupta D, Tanti B, Ananthan R, Das R, Jambhulkar S, Hui PK (2022) Identification of tyrosine kinase inhibitors from Panax bipinnatifidus and Panax Pseudoginseng for RTK—HER2 and VEGFR2 receptors, by in Silico approach. Mol Divers 26:1933–1955. 10.1007/s11030-021-10304-5 [DOI] [PubMed] [Google Scholar]
- 89.Millan-Casarrubias EJ, García-Tejeda YV, González-De la Rosa CH, Ruiz-Mazón L, Hernández-Rodríguez YM, Cigarroa-Mayorga OE (2025) Molecular Docking and Pharmacological in Silico evaluation of camptothecin and related ligands as promising HER2-Targeted therapies for breast cancer. Curr Issues Mol Biol 47:193. 10.3390/cimb47030193 [DOI] [PMC free article] [PubMed] [Google Scholar]
- 90.Valdés-Tresanco MS, Valdés-Tresanco ME, Valiente PA, Moreno E (2021) gmx_MMPBSA: A new tool to perform End-State free energy calculations with GROMACS. J Chem Theory Comput 17:6281–6291. 10.1021/acs.jctc.1c00645 [DOI] [PubMed] [Google Scholar]
- 91.Alvarado-Lozano JE, Hernández-Valencia JA, Ávila-Avilés RD, Bello M (2025) Insight into the inhibitory activity of mangiferin and Silybin against HER2 and EGFR using theoretical and experimental approaches. Sci Rep 15:8658. 10.1038/s41598-025-93612-2 [DOI] [PMC free article] [PubMed] [Google Scholar]
- 92.El-Sayed NA, Nour MS, Salem MA, Arafa RK (2019) New oxadiazoles with selective-COX-2 and EGFR dual inhibitory activity: design, synthesis, cytotoxicity evaluation and in Silico studies. Eur J Med Chem 183:111693. 10.1016/j.ejmech.2019.111693 [DOI] [PubMed] [Google Scholar]
- 93.Elrazaz EZ, Serya RAT, Ismail NSM, Albohy A, Abou El Ella DA, Abouzid KAM (2021) Discovery of potent thieno[2,3-d]pyrimidine VEGFR-2 inhibitors: design, synthesis and enzyme inhibitory evaluation supported by molecular dynamics simulations. Bioorg Chem 113:105019. 10.1016/j.bioorg.2021.105019 [DOI] [PubMed] [Google Scholar]
- 94.Shaldam MA, Almahli H, Angeli A, Badi RM, Khaleel EF, Zain-Alabdeen AI, Elsayed ZM, Elkaeed EB, Salem R, Supuran CT, Eldehna WM, Tawfik HO (2023) Discovery of sulfonamide-tethered Isatin derivatives as novel anticancer agents and VEGFR-2 inhibitors. J Enzyme Inhib Med Chem 38. 10.1080/14756366.2023.2203389 [DOI] [PMC free article] [PubMed]
- 95.Elsayed NMY, Serya RAT, Tolba MF, Ahmed M, Barakat K, Abou El Ella DA, Abouzid KAM (2019) Design, synthesis, biological evaluation and dynamics simulation of Indazole derivatives with antiangiogenic and antiproliferative anticancer activity. Bioorg Chem 82:340–359. 10.1016/j.bioorg.2018.10.071 [DOI] [PubMed] [Google Scholar]
- 96.Bello M, Guadarrama-García C, Rodriguez-Fonseca RA (2020) Dissecting the molecular recognition of dual lapatinib derivatives for EGFR/HER2. J Comput Aided Mol Des 34:293–303. 10.1007/s10822-019-00270-4 [DOI] [PubMed] [Google Scholar]
- 97.Prabhavathi H, Dasegowda KR, Renukananda KH, Karunakar P, Lingaraju K, Raja Naika H (2022) Molecular Docking and dynamic simulation to identify potential phytocompound inhibitors for EGFR and HER2 as anti-breast cancer agents. J Biomol Struct Dyn 40:4713–4724. 10.1080/07391102.2020.1861982 [DOI] [PubMed] [Google Scholar]
- 98.Yim-im W, Sawatdichaikul O, Semsri S, Horata N, Mokmak W, Tongsima S, Suksamrarn A, Choowongkomon K (2014) Computational analyses of curcuminoid analogs against kinase domain of HER2. BMC Bioinformatics 15:261. 10.1186/1471-2105-15-261 [DOI] [PMC free article] [PubMed] [Google Scholar]
Associated Data
This section collects any data citations, data availability statements, or supplementary materials included in this article.
Supplementary Materials
Data Availability Statement
No datasets were generated or analysed during the current study.