Abstract
Background/Objectives: Vitamin D supplementation has shown promise in managing type 2 diabetes mellitus (T2DM), while the simultaneous impact on glycemic control and inflammation in T2DM remains poorly understood. This study aimed to investigate the potential role of vitamin D supplementation in managing T2DM using fasting plasma glucose (FPG), insulin levels, HOMA-IR, HOMA-B, HbA1c, and Hs-CRP as the biomarkers. Methods: Original articles from Scopus, Pubmed, Cochrane Library, Epistemonikos, and ScienceDirect published between 2014 and 2024 were the sources. Inclusion criteria included studies conducted as clinical trials or randomized controlled trials involving adult patients diagnosed with T2DM undergoing treatment with vitamin D. The risk of bias was evaluated using the ROB-2 tool and meta-analysis was conducted to quantitatively synthesize the results across the studies using pooled effect sizes and confidence intervals. Results: Nine studies were included in the meta-analysis. Significant differences were found at 12-week follow-up in insulin level (MD(−3.59) [95% CI: −6.93, −0.25]), HOMA-B (MD(−50.35) [95% CI: −92.29, −8.41]), hs-CRP (−2.51 [95% CI: −3.45, −1.57]), and HbA1c level (MD(−0.30) [95% CI: −0.54, −0.06]) and at 24-week follow-up in HOMA-IR (MD(−0.38) [CI: −0.53, −0.24]). The quality of the included studies was generally moderate, with three showing a potential risk of bias. Conclusions: The observed trends in FPG, insulin levels, HOMA-IR, HOMA-B, HbA1c, and hs-CRP indicate that vitamin D may influence glycemic control, insulin sensitivity, and inflammation, but these effects are often modest and may diminish over time. Future studies should explore longer duration randomized trials with standardized dosing and baseline vitamin D status stratification.
Keywords: biomarkers, fasting plasma glucose, hs-CRP, insulin sensitivity, type 2 diabetes mellitus, vitamin D
1. Introduction
Vitamin D is an essential micronutrient that influences human health by modulating immunity, cell growth, inflammation, and genomic processes affecting cell death, differentiation, and proliferation [1,2]. Calcitriol (1,25(OH)2D3), the active form of vitamin D, is formed by the conversion of ergocalciferol (vitamin D2) and cholecalciferol (vitamin D3), which undergoes hepatic and renal metabolism [2]. Vitamin D deficiency is linked to metabolic syndrome, obesity, and type 2 diabetes. It plays a role in regulating insulin secretion and sensitivity, which are vital for metabolic health [3]. In a cross-sectional study of 89 overweight and obese adults, vitamin D deficiency was highly prevalent (93.2%) and a significant positive correlation was observed between vitamin D levels and fasting blood sugar [4]. In an observational study of 110 elderly Caucasian patients (>60 years), vitamin D deficiency was highly prevalent (84.5%) and significantly associated with visceral obesity, suggesting a potential role of vitamin D in managing obesity in the elderly [5].
Type 2 diabetes mellitus (T2DM) prevalence is increasing globally, reaching 10.5% in the last three decades [6]. T2DM is a chronic metabolic disorder marked by persistently high blood sugar levels brought on by insulin resistance, impaired insulin secretion, or both [7,8]. It has long been known that glucose intolerance is linked to hypovitaminosis D [9]. Individuals who were at risk for diabetes had lower levels of 25(OH)D than those who were not. Hypovitaminosis D has been linked to decreased insulin secretion in a diabetic population [10]. In older males with hypovitaminosis D, insulin secretion is hyperresponsive to a glucose challenge. Thus, throughout the development of T2DM, vitamin D may have an impact on insulin sensitivity and beta cell function, as well as on both [11].
Vitamin D corrects vitamin D deficiency in T2DM by supporting and modulating insulin production and secretion through several mechanisms. One of them is by the binding of the active form of vitamin D, 1,25(OH)D with VDR. This binding will induce glucose transport and insulin secretion through the cellular growth in β cells [12,13]. Vitamin D may also have the potential to regulate insulin creation in an indirect way by affecting the concentrations of intracellular calcium. Calcium triggers the release of insulin. 1,25(OH)2D can depolarize cytoplasmic membranes in β cells, which will open Ca2+ channels and increase intracellular Ca2+ levels [14,15]. This action may be triggered by activating PKA, enhancing the channel function by phosphorylating L-type voltage-dependent Ca2+ channel-related proteins, and by regulating the expression of voltage-gated calcium channels to increase the release of insulin [16,17]. Additionally, vitamin D promotes phospholipase C synthesis and activates inositol triphosphate that releases Ca2+ from the endoplasmic reticulum [18].
A number of meta-analyses have demonstrated significant positive outcomes of vitamin D supplementation on blood glucose. One study showed that vitamin D supplementation can significantly reduce serum fasting plasma glucose, HbA1c, HOMA-IR, and insulin levels in T2DM patients. However, that study did not investigate the durations and dosages of vitamin D supplements in the inflammation marker outcome in T2DM [19]. One study showed that vitamin D may reduce chronic low-grade inflammation in patients with T2DM, but did not consider the differences in outcomes based on the duration of supplementation [20].
Although a number of meta-analyses have demonstrated significant positive outcomes of vitamin D supplementation in T2DM, few have simultaneously assessed both glycemic and inflammatory markers within a single comprehensive evaluation, nor have they systematically explored the effects of intervention duration and dosage, particularly for inflammation outcomes. The novelty of the current study lies in its approach to analyzing both metabolic and inflammatory effects of vitamin D supplementation, while also incorporating a detailed risk of bias assessment and subgroup analyses based on intervention duration. This review aims to provide the most current and detailed qualitative summary of the evidence. Therefore, the aim of this systematic review and meta-analysis was to evaluate the impacts of vitamin D on both glycemic control and inflammation in adults with T2DM focusing on key biomarkers including fasting plasma glucose (FPG), insulin levels, HOMA-IR, HOMA-B, HbA1c, TNF-alpha, and Hs-CRP.
2. Materials and Methods
2.1. Study Design and Registration
This review complies with the Cochraine Handbook and the Preferred Reporting Items for Systematic Reviews and Meta-Analyses (PRISMA) statement [21,22]. The PRISMA checklist as used for our guidance is available in Supplementary File S1. This systematic review and meta-analysis were registered in OSF with registry at https://doi.org/10.17605/OSF.IO/4NFMH (accessed on 22 July 2024).
2.2. Eligibility Criteria
The following standards were used in the selection of the featured studies: (1) studies involving patients of adults diagnosed with T2DM undergoing treatment with vitamin D3; (2) comparisons of the treatment indicated as placebo; (3) availability of data on the primary outcome that consist of FPG, insulin level, HOMA-IR, HOMA-B, HbA1C, and Hs-CRP; and (4) studies conducted as a clinical trial or randomized control trials (RCTs). Conversely, we excluded studies that involved patients with metabolic diseases other than T2DM. Exclusion criteria included non-full text, scientific posters, study protocols, conference abstracts, non-English articles, irrelevant articles, other technical reports, systematic reviews, non-comparative research, narrative reviews, meta-analyses, editor answers, and in silico, in vitro, and in vivo studies.
2.3. Data Search and Selection
A selection of keywords was used to capture all pertinent studies for each database, as listed in below Table 1. The search was conducted from each database’s inception until 20 June 2025. The National Institutes of Health (NIH) National Library of Medicine browser’s definition of Medical Subject Headings (MeSH) keywords was subjected to the Boolean operator. Mendeley Group Reference Manager was used to arrange the references in the author’s library to organize full text screening and remove journal duplication. Three authors (EP, KCT, DA), who managed the literature search independently, performed the entire article selection process. Articles were first sorted by title and abstract. Duplicates were removed utilizing Mendeley Group Reference Manager. The remaining articles were thoroughly reviewed in full text by two authors (KCT and EP) to ascertain the eligibility based on our criteria for inclusion and exclusion. Any disagreements were resolved through discussions with the other authors (TIW, HN, HWS, BR, SFM), who provided a final assessment on the eligibility of studies for the synthesis. Furthermore, the manual screening through the reference list of all the included studies was also performed to help minimize the risk of missing studies.
Table 1.
Database search keywords.
| Database | Combined Keywords with Boolean Operators | Filter Applies |
|---|---|---|
| PubMed | (“Vitamin D” OR Calcitriol) AND (adult OR obesity) AND “Diabetes Mellitus Type 2” | - Publication date: Last 10 years - Article type: Randomized Controlled Trial (RCT) and Clinical Trial (CT) |
| Scopus | TITLE-ABS-KEY (“Vitamin D” OR Calcitriol) AND (adult OR obesity) AND “Diabetes Mellitus Type 2” | - Publication date: Last 10 years - Document type: Article (Research Article) |
| Cochrane Library | (“Vitamin D” OR Calcitriol) AND (adult OR obesity) AND “Diabetes Mellitus Type 2”: ti, ab, kw | - Publication date: Last 10 years - Study type: Randomized Controlled Trial (RCT) and Clinical Trial (CT) |
| Epistemonikos | (“Vitamin D” OR Calcitriol) AND (adult OR obesity) AND “Diabetes Mellitus Type 2” | - Publication date: Last 10 years - Study type: Randomized Controlled Trial (RCT) and Clinical Trial (CT) |
| ScienceDirect | TITLE-ABSTR-KEY (“Vitamin D” OR Calcitriol) AND (adult OR obesity) AND “Diabetes Mellitus Type 2”) | - Publication date: Last 10 years - Document type: Research Article |
2.4. Data Extraction
The first author’s last name, publication year, country, study design, sample size, baseline characteristics of participants (including mean age and sex distribution), follow-up duration, number of participants, and outcomes of interest were all retrieved for analytical purposes. Eight independent authors (E.P., T.I.W., H.N., H.W.S., B.R., S.F.M., K.C.T., D.A.) were responsible for extracting these data, which were then organized in Microsoft Excel 2019.
Only primary outcomes were considered in this study, which were fasting plasma glucose (FPG), insulin level, HOMA-IR, HOMA-B, HbA1C, TNF-alpha, TNF-alpha, and Hs-CRP, while our secondary outcome was the comparison level of vitamin D before and after intervention.
2.5. Risk of Bias Assessment
Five independent authors (EP, TIW, SFM, KCT, DA) used validated and firmly established tools to assess the risk of bias. This study utilized the Cochrane Collaboration’s Risk of Bias version 2 (RoB-2 tool) to evaluate five methodological domains in randomized controlled trials in this study: (a) the randomization procedure, (b) variations from the planned interventions, (c) absent data pertaining to outcomes, (d) outcome measurement, and (e) choosing the findings reported [23]. The results of this evaluation is shown in Supplementary File S3, which were classified as “low risk”, “high risk”, or having “some concerns” of bias. Disagreements during the assessment process were settled by discussion. The conclusion was determined by EP if no agreement could be reached.
2.6. Statistical Analysis
The inverse variance technique was utilized to collect the results of continuous variables using the standardized mean difference (SMD) with 95% confidence intervals (95% CIs). Because of the expected significant variability resulting from variations in follow-up times and demographics in the population, we chose to employ random-effect designs for this review [24].
The I-squared (I2) statistic was used to evaluate heterogeneity between studies. The heterogeneity value is classified as 0–30% not important, 30–50% moderate, 50–75% substantial, and >75% considerable [25]. Using an incorporated equation by Luo D et al. and Wan X et al., we turned values acknowledged as median and interquartile range (IQR) or median, minimum, and maximum to means and standard deviations (SDs) for pooled analysis.
The intervention and control groups were compared within follow-up period segments in our early analysis. In general, the findings indicated that the intervention group achieved greater functional results. Subgroup analyses and other studies, however, produced conflicting results, which led to a distinct analysis of prior to and after the procedure values. In order to compare the pooled means between the groups, this supplementary analysis sought to identify the mean difference for each evaluation irrespectively for both groups.
For any given result, provided there were more than ten studies, publication bias was examined. In cases where funnel plot asymmetry was observed, we examined the PICO and outcome elements to see if the problem was caused by publication bias or methodological differences between studies. The Cochrane Collaboration’s Review Manager 5.4 was used for all statistical analysis, with sensitivity meta-analysis assessing the robustness of outcomes through studies with a low risk of bias.
The certainty of evidence for each outcome was assessed using the Grading of Recommendations, Assessment, Development, and Evaluation (GRADE) approach. We evaluated five domains that could potentially downgrade the quality of evidence—risk of bias, inconsistency, indirectness, imprecision, and publication bias. Each domain was scored as having no limitation (0), serious limitation (−1), or very serious limitation (−2). The overall certainty of evidence was then classified as high, moderate, low, or very low based on the cumulative score. Since all the included studies were randomized controlled trials, each outcome initially started as high-quality evidence and was downgraded as necessary according to domain assessments. The scoring process was conducted independently by two reviewers, and any discrepancies were resolved through discussion. A summary table of the GRADE scoring is provided in the results section.
To assess the robustness of the pooled estimates and identify potential sources of heterogeneity, a leave-one-out sensitivity analysis was conducted. This method involves sequentially removing one study at a time from the meta-analysis and recalculating the overall effect estimate for each iteration. By observing the extent to which the pooled results change with the exclusion of individual studies, we were able to evaluate the influence of each study on the overall findings. Significant shifts in the effect size or confidence intervals upon exclusion of a particular study were interpreted as indicators of potential outlier influence or study-level bias. This analysis was performed using the “metainf” function from the meta package in R Studio Version 2024.12.1+563.
3. Results
3.1. Study Selection
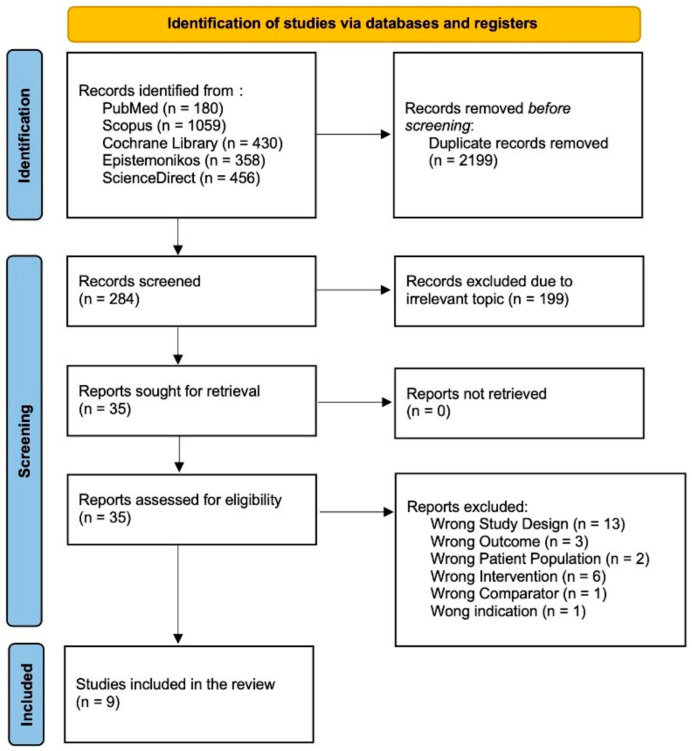
A literature search conducted across PubMed, Scopus, Cochrane Library, Epistemonikos, and Science Direct initially yielded 1892 papers. Automation tools across each database were employed to filter out non-randomized controlled trial and non-clinical trial studies, resulting in the removal of 1658 articles. Subsequently, the authors manually screened the remaining articles for relevance and duplication, starting with titles and abstracts. This screening process led to the exclusion of 13 studies due to incorrect study design, 3 studies due to incorrect outcomes, 2 studies due to incorrect patient populations, 6 studies due to incorrect interventions, 1 study due to an incorrect comparator, and 1 study due to incorrect indications. After this rigorous selection process, the authors determined that nine studies met the inclusion criteria. Consequently, this systematic review and meta-analysis includes nine studies. The study screening report is available in Supplementary File S2, while Figure 1 shows the PRISMA diagram that represents our study selection process.
Figure 1.
Flow diagram for PRISMA 2020.
3.2. Risk of Bias in Studies
The quality of each clinical trial and randomized controlled trial included in this review was rigorously evaluated using the ROB-2 risk-of-bias tool. This method provides a comprehensive assessment of potential biases in several critical areas of study design. Notably, among the nine investigations analyzed, three studies raised concerns due to ambiguity in the randomization process, particularly in how participants were allocated to the intervention and control groups. This uncertainty may introduce a risk of bias, as the lack of clear randomization can affect the study’s internal validity. A detailed summary of the risk-of-bias assessment for all the included studies is presented in Supplementary File S3.
3.3. Study Result Summaries
The table presents the overview of nine randomized controlled trials (RCTs) conducted across several countries (Iran, India, Serbia, Iran, Netherlands, Australia, Mexico, and China), examining the effects of different vitamin D supplementation regimens on patient outcomes. The studies involved diverse populations, with sample sizes ranging from 30 to 261 participants, and supplementation doses varying from 1000 IU/day to 100,000 IU bolus followed by daily doses. Follow-up periods spanned from 12 weeks to 78 weeks, reflecting a broad spectrum of intervention durations. Most studies reported the mean ages of participants in both the supplementation and placebo groups, indicating comparable baseline characteristics across groups. Despite the geographical and dosage variations, these studies collectively contribute valuable insights into the potential benefits of vitamin D supplementation in different clinical contexts. The characteristics are shown in Table 2.
Table 2.
Study characteristics.
| Author; Year |
Country/ Place |
Study Design | Vitamin D Level Before Treatment (Intervention/Control) | Vitamin D Level Before Treatment (Intervention/Control) |
Supplementation | Population | Functional Outcome (Intervention/Control) (Mean ± SD) |
|||||||||
|---|---|---|---|---|---|---|---|---|---|---|---|---|---|---|---|---|
| Sample Size (n) | Supplementation/Placebo | Mean Age (Years) (Mean ± SD) | Follow-Up (Weeks) |
FPG | Insulin | HOMA-IR | HOMA-B | HbA1c | Hs-CRP | TNF-a | ||||||
| Muñoz, et al.; 2014 [26] | Mexico | Randomized Clinical Trial | Not Reported | Not Reported | vit D3 4000 IU/day | 104 | 52/52 | Supplementation: 56.1 ± 5.1; Placebo: 57.4 ± 5.0 | 24 weeks | 146 ± 40/154 ± 42 | 19.0 ± 9.0/20.8 ± 11.0 | 6.7 ± 3.7/7.5 ± 4.0 | No Result | 9.0 ± 1.6/9.0 ± 1.8 | No Result | No Result |
| Jafari., et al.; 2015 [27] | Iran | Randomized Clinical Trial | 62.23 ± 4.52/62.72 ± 4.27 | 86.83 ± 4.87/56.13 ± 2.89 | 2000 IU vitamin D3 in 100 g/day | 59 | 30/29 | Supplementation: 57.8 ± 5.5; Placebo: 56.8 ± 5.7 | 12 | No Result | 5.17 ± 0.46/11.20 ± 1.04 | 2.13 ± 0.20/4.72 ± 0.44 | 64.27 ± 5.98/135.02 ± 13.08 | 7.24 ± 0.22/7.58 ± 0.23 | 9.8 ± 0.4/12.1 ± 1.0 | No Result |
| Krul., et al.; 2015 [28] | Netherlands | Randomized Clinical Trial | 60.6 ± 23.3/59.1 ± 23.2 | 90.3 ± 22.2/48.4 ± 26.2 | vit D3 50,000 IU/month | 261 | 129/132 | Supplementation: 67 ± 8; Placebo: 67 ± 9 | 24 | 8.1 ± 1.4/7.8 ± 1.2 | 16.3 (11.1)/16.3 (9.8) | 4.99 (3.29–6.98)/4.83 (3.37–7.24) | 64.8 (46.1–93.8)/67.4 (42.5–102.7) | 6.86 (0.6)/6.86 (0.6) | No Result | No Result |
| Asemi., et al.; 2016 [29] | Iran | Randomized Clinical Trial | Not Reported | Not Reported | 5 μg vit D3, 90 μg vit K plus 500 mg Ca | 66 | 33/33 | Supplementation: 65.9 (11.4); Placebo: 65.0 (11.1) | 12 | 140.7 (56.2)/145·5 (70.4) | 12.7 (7.2)/20.1 (10.5) | 4.0 (2.4)/6.0 (3.9) | 36.6 (30.1)/64.5 (47.2) | No Result | 2.7 (2.3)/6.3 (5.8) | No Result |
| Mousa., et al.; 2017 [30] | Australia | Randomized Clinical Trial | 31.4 ± 12.6/34.2 ± 10.0 | 88.4 ± 21.0/36.1 ± 10.0 | vit D3 100,000 IU bolus followed by 4000 IU/day | 54 | 28/26 | Supplementation: 30.5 (25–35); Placebo: 29.5 (25–41) | 16 | 4.6 ± 0.5/4.7 ± 0.3 | 10.2 (6.9–18.2)/7.9 (5.8–13.6) | No Result | No Result | No Result | No Result | No Result |
| Bhatt., et al.; 2020 [31] | India | Randomized Clinical Trial | 29.9 ± 5.9/32.1 ± 5.2 | 56.6 ± 12.6/49.1 ± 12.1 | vit D3 60,000 IU/week | 121 | 61/60 | Not stated | 26 | 110.9 ± 8.5/111.8 ± 7.9 | 12.3 ± 7.3/11.5 ± 8.7 | 1.39 ± 0.08/1.81 ± 0.09 | No Result | No Result | No Result | No Result |
| 52 | 108.4 ± 21.0/105.5 ± 17.5 | 10.7 ± 5.6/10.3 ± 4.8 | 1.42 ± 0.09/1.38 ± 0.07 | No Result | No Result | No Result | No Result | |||||||||
| 78 | 101.8 ± 11.9/106.9 ± 26.9 | 10.6 ± 4.8/10.1 ± 4.7 | 1.20 ± 0.06/1.24 ± 0.04 | No Result | No Result | No Result | No Result | |||||||||
| Hajj., et al.; 2020 [20] | Lebanon | Randomized Clinical Trial | 14.8 ± 4.5/15.02 ± 4.2 | 34.9 ± 4.7/14.5 ± 3.9 | vit D3 30,000 IU/week | 88 | 45/43 | Supplementation: 66.9 ± 4.1; Placebo: 65.7 ± 4.5 | 24 | No Result | No Result | 2.51 ± 2.46/2.41± 1.92 | No Result | 6.53 ± 0.63/6.64 ± 1.31 | 5.3 ± 2.31/5.19 ± 2.23 | 2.61 ± 1.04/3.01 ± 0.83 |
| Cojic., et al.; 2021 [32] | Serbia | Randomized Clinical Trial | 48.79 ± 31.63/58.02 ± 32.32 | 92.24 ± 20.25/51.77 ± 23.99 | vit D3 14,000 IU/week | 130 | 65/65 | Supplementation: 60.41 (8.5); Placebo: 63.65 (8.2) | 12 | 7.28 (1.16)/7.97 (1.74) | 9.81 (7.04)/12.62 (8.30) | 3.63 (3.02)/3.42 (2.64) | No Result | 6.32 (0.69)/6.66 (0.85) | No Result | No Result |
| 24 | 7.23 (1.26)/7.74 (1.49) | 11.26 (6.68)/11.92 (7.86) | 3.44 (2.89)/3.39 (3.37) | No Result | 6.48 (0.70)/6.87 (0.92) | No Result | No Result | |||||||||
| Sun., et al.; 2023 [33] | China | Randomized Clinical Trial | Not Reported | Not Reported | Vit D3 1000 IU/day | 30 | 15/15 | Not stated | 12 | 6.5 ± 0.8/7.1 ± 1.3 | 11.0 ± 8.9/15.1 ± 11.0 | 3.2 ± 2.7/5.1 ± 4.9 | No Result | 6.6 ± 0.8/6.7 ± 0.8 | No Result | No Result |
3.4. Fasting Plasma Glucose (FPG)
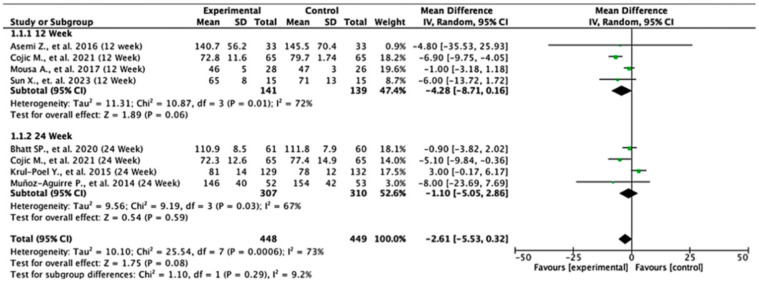
Across the studies reporting fasting plasma glucose (FPG) outcomes, the overall effects and subgroup results were not statistically significant. At 12 weeks, the pooled mean difference was −4.28 (95% CI: −8.71 to 0.16; p = 0.06), and at 24 weeks, it was −1.10 (95% CI: −5.05 to 2.86; p = 0.59). When all the studies were combined, the overall pooled mean difference was −2.61 (95% CI: −5.53 to 0.32; p = 0.08), indicating no significant difference in FPG levels between the experimental and control groups. Heterogeneity across the studies was substantial (I2 = 73%), suggesting notable variability in effect estimates. The test for subgroup differences by follow-up duration was not statistically significant (p = 0.29), indicating that the length of follow-up did not significantly influence the treatment effect (Figure 2).
Figure 2.
Forest plot for the FPG outcome. All studies shown are referenced as: Asemi Z., et al., (2016), Cojic M., et al., (2021), Mousa A., et al., (2017), Sun X., et al., (2023), Bhatt SP., et al., (2020), Krul-Poel Y., et al., (2015), Muñoz-Aguirre P., et al., (2014) [26,28,29,30,31,32,33].
3.5. Insulin Level
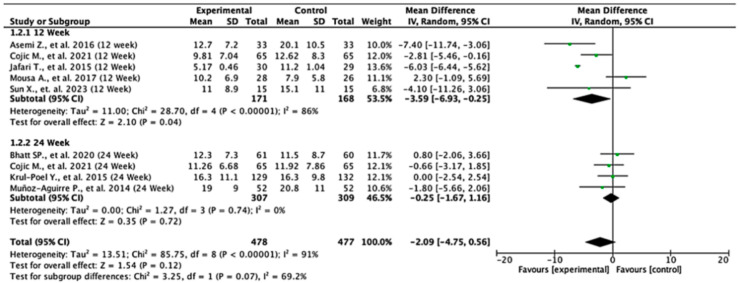
In the 12-week follow-up subgroup, the pooled mean difference was −3.59 units (95% CI: −6.93 to −0.25; p = 0.04), indicating a statistically significant reduction in insulin levels favoring the experimental intervention. This suggests a modest short-term benefit. However, no significant effect was observed in the 24-week subgroup, with a pooled mean difference of −0.25 units (95% CI: −1.67 to 1.16; p = 0.72). The overall pooled analysis across all the studies yielded a mean difference of −2.09 units (95% CI: −4.75 to 0.56; p = 0.12), showing no statistically significant difference between the intervention and control groups. Substantial heterogeneity was present (I2 = 91%), likely due to differences in study design, populations, or intervention protocols. The test for subgroup differences between the 12-week and 24-week groups was not statistically significant (p = 0.07), suggesting that follow-up duration alone does not explain the observed variability in treatment effect. These findings indicate potential early benefits that may not be sustained over time, highlighting the need for further high-quality studies to clarify the long-term effects of the intervention on insulin levels (Figure 3).
Figure 3.
Forest plot for insulin level outcome. All studies shown are referenced as: Asemi Z., et al., (2016), Cojic M., et al., (2021), Jafari T., et al., (2015), Mousa A., et al., (2017), Sun X., et al., (2023), Bhatt SP., et al., (2020), Krul-Poel Y., et al., (2015), Muñoz-Aguirre P., et al., (2014) [26,27,28,29,30,31,32,33].
3.6. HOMA-IR
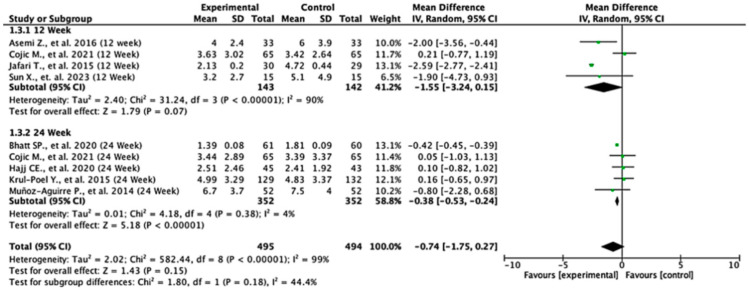
Among the studies reporting HOMA-IR outcomes, the treatment effects varied across follow-up durations. At 12 weeks, the pooled mean difference was −1.55 (95% CI: −3.24 to 0.15; p = 0.07), indicating no statistically significant difference between the groups. In contrast, at 24 weeks, the pooled mean difference was −0.38 (95% CI: −0.53 to −0.24; p < 0.00001), demonstrating a significant reduction in HOMA-IR in favor of the experimental group. When all the studies were combined, the overall pooled mean difference was −0.74 (95% CI: −1.75 to 0.27; p = 0.15), suggesting no statistically significant difference overall. Moderate heterogeneity was observed (I2 = 59%), indicating variability between study results. The test for subgroup differences between 12- and 24-week follow-ups was not statistically significant (p = 0.18), suggesting that follow-up duration did not significantly modify the treatment effect (Figure 4).
Figure 4.
Forest plot for HOMA-IR outcome. All studies shown are referenced as: Asemi Z., et al., (2016), Cojic M., et al., (2021), Jafari T., et al., (2015), Sun X., et al., (2023), Bhatt SP., et al., (2020), Hajj CE., et al., (2020), Krul-Poel Y., et al., (2015), Muñoz-Aguirre P., et al., (2014) [20,26,27,28,29,31,32,33].
3.7. HOMA-B
Across the studies reporting HOMA-B outcomes, the effects varied between follow-up durations. At 12 weeks, the pooled mean difference was −50.35 (95% CI: −92.29 to −8.41; p = 0.02), indicating a statistically significant difference favoring the control group. At 24 weeks, the pooled mean difference was −2.60 (95% CI: −13.36 to 8.16; p = 0.64), showing no significant difference between the experimental and control groups. When all the studies were combined, the overall mean difference was −33.97 (95% CI: −83.42 to 15.48; p = 0.18), suggesting no statistically significant effect. Heterogeneity was extremely high (I2 = 99%), reflecting substantial variation across the studies. The test for subgroup differences was statistically significant (p = 0.03), indicating that follow-up duration significantly influenced the treatment effect (Figure 5).
Figure 5.
Forest plot for HOMA-B outcome. All studies shown are referenced as: Asemi Z., et al., (2016), Jafari T., et al., (2015), Krul-Poel Y., et al., (2015) [27,28,29].
3.8. HbA1c Level
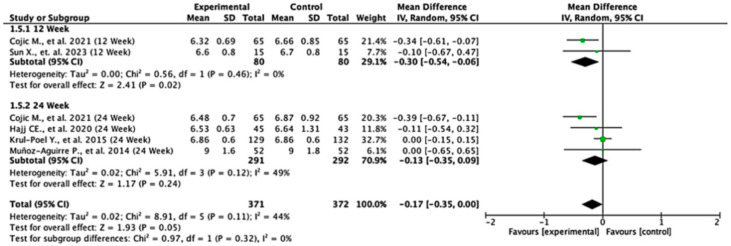
Among the studies reporting HbA1c outcomes, the treatment effects varied between follow-up durations. At 12 weeks, the pooled mean difference was −0.30 (95% CI: −0.54 to −0.06; p = 0.02), indicating a statistically significant reduction in HbA1c favoring the experimental group. At 24 weeks, the pooled mean difference was −0.13 (95% CI: −0.35 to 0.09; p = 0.24), showing no significant difference between the groups. When all the studies were combined, the overall pooled mean difference was −0.17 (95% CI: −0.35 to 0.00; p = 0.05), suggesting a borderline effect favoring the experimental treatment. Moderate heterogeneity was observed (I2 = 44%), indicating some variability across the studies. The test for subgroup differences by follow-up duration was not statistically significant (p = 0.32), suggesting that treatment effect was not dependent on follow-up time (Figure 6).
Figure 6.
Forest plot for HbA1C outcome. All studies shown are referenced as: Cojic M., et al., (2021), Sun X., et al., (2023), Hajj CE., et al., (2020), Krul-Poel Y., et al., (2015), Muñoz-Aguirre P., et al., (2014) [20,26,28,32,33].
3.9. Hs-CRP
Among the studies reporting hs-CRP outcomes, the treatment effects differed across follow-up durations. At 12 weeks, the pooled mean difference was −2.51 (95% CI: −3.45 to −1.57; p < 0.00001), indicating a statistically significant reduction in hs-CRP levels favoring the experimental group. At 24 weeks, the pooled mean difference was 0.11 (95% CI: −0.84 to 1.06; p = 0.82), showing no significant difference between the two groups. The overall pooled mean difference across all the studies was −1.79 (95% CI: −3.70 to 0.13; p = 0.07), suggesting a trend toward significance in favor of the experimental treatment. Heterogeneity was high (I2 = 91%), indicating considerable variability among studies. The test for subgroup differences was statistically significant (p = 0.0001), suggesting that the follow-up duration significantly influenced the treatment effects (Figure 7).
Figure 7.
Forest plot for Hs-CRP outcome. All studies shown are referenced as: Asemi Z., et al., (2016), Jafari T., et al., (2015), Hajj CE., et al., (2020) [20,27,29].
3.10. Level Change in Serum Vitamin D from Baseline
Across the included studies, the pooled mean difference in serum vitamin D levels was 33.88 (95% CI: 23.24 to 44.52; p < 0.00001), indicating a statistically significant increase in favor of the experimental group. This finding suggests that the intervention substantially improved serum vitamin D levels compared to the controls. Heterogeneity was very high (I2 = 97%), reflecting considerable variability across the studies, which may be attributed to differences in population characteristics, baseline vitamin D status, dosage, or treatment duration. Despite the high heterogeneity, the consistent direction of effect across the studies supports the robustness of the observed benefit (Figure 8).
Figure 8.
Forest plot for the mean difference from baseline of serum vitamin D. All studies shown are referenced as: Cojic M., et al., (2021), Hajj CE., et al., (2020), Jafari T., et al., (2015), Krul-Poel Y., et al., (2015), Mousa A., et al., (2017) [20,27,28,30,32].
3.11. GRADE Analysis
The quality of evidence for each outcome was systematically evaluated using the GRADE approach, considering five domains: risk of bias, inconsistency, indirectness, imprecision, and publication bias. The results are summarized below.
For fasting plasma glucose (FPG), the certainty of evidence was rated as low. Although a trend toward reduced glucose levels was observed (MD: −2.61 mg/dL), the confidence interval crossed the null, and substantial heterogeneity was detected (I2 = 73%). Additionally, three out of nine studies exhibited unclear randomization procedures, contributing to a moderate risk of bias and subsequent downgrading for both inconsistency and imprecision (Table 3).
Table 3.
GRADE analysis summary result.
| Outcome | Effect Size (MD, 95% CI) | No. of Studies | Risk of Bias | Certainty | Key Justification(s) |
|---|---|---|---|---|---|
| Fasting Plasma Glucose (FPG) | −2.61 [−5.53 to 0.32]; p = 0.08 | Multiple | Moderate | ⬤⬤◯◯ Low | Downgraded for inconsistency (I2 = 73%) and imprecision (non-significant, CI crosses 0); 3/9 studies had unclear randomization. |
| Insulin Level | −2.09 [−4.75 to 0.56]; p = 0.12 | Multiple | Moderate | ⬤⬤◯◯ Low | Downgraded for inconsistency (I2 = 91%) and imprecision; risk of bias due to unclear randomization in several studies. |
| HOMA-IR | −0.74 [−1.75 to 0.27]; p = 0.15 | Multiple | Moderate | ⬤⬤◯◯ Low | Downgraded for imprecision (CI crosses 0) and moderate inconsistency (I2 = 59%); some studies with unclear randomization. |
| HOMA-B | −33.97 [−83.42 to 15.48]; p = 0.18 | Multiple | Moderate | ⬤◯◯◯ Very Low | Downgraded for inconsistency (I2 = 99%), imprecision (wide CI), and subgroup inconsistency (p = 0.03); moderate RoB due to unclear randomization. |
| HbA1c Level | −0.17 [−0.35 to 0.00]; p = 0.05 | Multiple | Low–Moderate | ⬤⬤⬤◯ Moderate | Downgraded for imprecision (borderline p and CI), but heterogeneity was acceptable (I2 = 44%); most studies low risk, some concerns in 3/9 studies. |
| Hs-CRP | −1.79 [−3.70 to 0.13]; p = 0.07 | Multiple | Moderate | ⬤⬤◯◯ Low | Downgraded for inconsistency (I2 = 91%), imprecision, and significant subgroup inconsistency (p = 0.0001); 3 studies had randomization issues. |
| Serum Vitamin D Change | +33.88 [23.24 to 44.52]; p < 0.00001 | Multiple | Low–Moderate | ⬤⬤⬤◯ Moderate | Downgraded for inconsistency (I2 = 97%) but retained moderate certainty due to consistent large effect and direction despite some RoB concerns. |
The outcome for insulin level also received a low certainty rating, with no statistically significant effect (MD: −2.09; p = 0.12) and considerable heterogeneity (I2 = 91%). The presence of unclear randomization in several studies further raised concerns about internal validity. Consequently, the evidence was downgraded for both inconsistency and imprecision.
For HOMA-IR, the quality of evidence was likewise rated as low. The pooled effect (MD: −0.74; p = 0.15) was not statistically significant, and the confidence interval included the null. Although heterogeneity was moderate (I2 = 59%), it still warranted downgrading for inconsistency in addition to imprecision. Risk of bias concerns persisted due to unclear allocation procedures in a subset of studies.
The certainty of evidence for HOMA-B was deemed very low, reflecting substantial uncertainty. The effect size was highly variable (MD: −33.97), with a wide confidence interval and extreme heterogeneity (I2 = 99%). Additionally, a significant subgroup difference (p = 0.03) suggests possible effect modification by follow-up duration. These issues, along with a moderate risk of bias, led to downgrading across three domains: inconsistency, imprecision, and subgroup inconsistency.
In contrast, HbA1c level was supported by moderate-certainty evidence, with a borderline significant reduction (MD: −0.17; p = 0.05) and acceptable heterogeneity (I2 = 44%). The evidence was downgraded only for imprecision, as the confidence interval approached the null, but the risk of bias was generally low across most studies.
The analysis for Hs-CRP showed a potential trend toward improvement (MD: −1.79; p = 0.07) but was supported by low-certainty evidence due to high heterogeneity (I2 = 91%), imprecision, and a significant subgroup effect (p = 0.0001). Additionally, randomization concerns in some studies contributed to the overall moderate risk of bias.
Finally, serum vitamin D change from baseline was the only outcome with a clearly favorable and statistically significant effect (MD: +33.88; p < 0.00001). Despite very high heterogeneity (I2 = 97%), the consistency in effect direction and magnitude across the studies justified a moderate certainty rating. Most included trials were assessed as having a low to moderate risk of bias, and the large effect size strengthened confidence in the result despite some variability.
3.12. Leave-One-Out Sensitivity Analysis
The leave-one-out sensitivity analysis helped us better understand how individual studies influenced the overall findings for fasting plasma glucose (FPG), insulin level, HOMA-IR, HOMA-B, HbA1c, hs-CRP, and serum vitamin D level change outcomes.
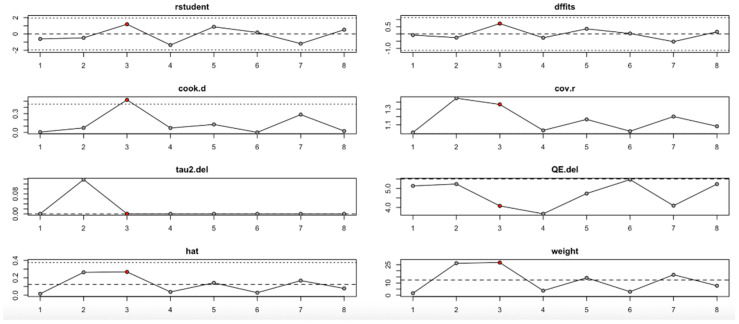
For FPG (Figure 9, Table 4), heterogeneity was moderate to high, with I2 values fluctuating between approximately 42.7% and 90.9% across iterations. Notably, omitting certain studies led to reductions in heterogeneity, but the pooled effect estimates remained relatively consistent. The third study exerted a notable influence, as indicated by elevated values in studentized residuals, Cook’s distance, DFFITS, and hat diagnostics, suggesting some sensitivity to that study. However, the overall statistical conclusions were robust.
Figure 9.
Baujat plot for fasting plasma glucose outcome.
Table 4.
Leave-one-out sensitivity analysis summary.
| Outcome | Leave-One-Out | Estimate | SE | Z-Value | p-Value | CI Lower | CI Upper | Q | Qp | Tau2 | I2 (%) | H2 |
|---|---|---|---|---|---|---|---|---|---|---|---|---|
| FPG | −1 | 6.867 | 2.068 | −1.979 | 0.304 | 2.359 | 5.212 | 5.638 | 0.912 | 8.413 | 90.926 | 5.629 |
| −2 | 7.895 | 1.935 | 4.247 | 0.05 | −3.033 | 9.945 | 18.72 | 0.317 | 6.322 | 88.636 | 7.969 | |
| −3 | 9.817 | 2.595 | 0.679 | 0.005 | 2.17 | 14.966 | 1.162 | 0.2 | 5.852 | 20.305 | 4.857 | |
| −4 | 4.199 | 1.267 | −2.145 | 0.231 | −0.436 | 11.977 | 7.795 | 0.717 | 9.27 | 46.479 | 4.551 | |
| −5 | 7.814 | 1.412 | −1.684 | 0.071 | −1.755 | 6.209 | 1.35 | 0.231 | 8.277 | 76.697 | 6.229 | |
| −6 | 4.584 | 0.978 | 2.348 | 0.763 | 4.319 | 10.332 | 17.03 | 0.376 | 5.789 | 75.2 | 8.259 | |
| −7 | 8.265 | 2.725 | 0.398 | 0.565 | −2.31 | 6.406 | 12.79 | 0.511 | 7.468 | 45.921 | 3.479 | |
| −8 | −0.421 | 2.354 | −0.238 | 0.025 | −3.871 | 11.242 | 2.871 | 0.138 | 3.745 | 63.509 | 9.057 | |
| Insulin | −1 | 9.43 | 1.695 | 1.836 | 0.589 | 2.31 | 9.904 | 8.948 | 0.21 | 1.728 | 74.026 | 5.277 |
| −2 | 8.679 | 2.101 | −1.812 | 0.285 | 4.101 | 10.692 | 10.87 | 0.35 | 9.945 | 88.868 | 6.705 | |
| −3 | 8.833 | 2.238 | −0.409 | 0.135 | 2.425 | 5.672 | 8.345 | 0.637 | 2.751 | 74.423 | 7.825 | |
| −4 | 7.029 | 2.028 | −0.259 | 0.271 | 1.782 | 5.36 | 16.77 | 0.913 | 8.861 | 10.761 | 7.827 | |
| −5 | −1.348 | 1.947 | 4.826 | 0.864 | 1.021 | 12.628 | 0.842 | 0.433 | 2.936 | 76.555 | 3.903 | |
| −6 | 6.251 | 2.966 | 0.188 | 0.882 | −2.605 | 9.518 | 19.01 | 0.031 | 8.053 | 74.418 | 1.281 | |
| −7 | 4.498 | 0.867 | 4.576 | 0.632 | 2.771 | 5.619 | 12.94 | 0.451 | 3.922 | 30.152 | 8.383 | |
| −8 | 0.405 | 2.904 | 2.965 | 0.745 | 1.097 | 5.185 | 6.329 | 0.273 | 7.27 | 29.534 | 8.056 | |
| −9 | 3.272 | 0.627 | −2.857 | 0.374 | −1.144 | 6.785 | 19.51 | 0.456 | 8.888 | 20.875 | 8.239 | |
| HOMA-IR | −1 | −1.036 | 1.91 | −1.502 | 0.009 | 2.614 | 11.05 | 0.769 | 0.553 | 1.371 | 96.687 | 3.014 |
| −2 | 6.221 | 2.305 | 1.37 | 0.185 | −2.339 | 10.231 | 6.836 | 0.599 | 4.722 | 11.999 | 3.602 | |
| −3 | 8.707 | 2.124 | −1.577 | 0.047 | 0.849 | 8.338 | 15.18 | 0.937 | 6.653 | 17.846 | 7.337 | |
| −4 | 5.04 | 1.37 | 2.066 | 0.352 | −4.814 | 9.897 | 1.309 | 0.015 | 6.615 | 45.765 | 4.763 | |
| −5 | 0.164 | 2.633 | 1.504 | 0.275 | −4.673 | 12.593 | 11.6 | 0.407 | 0.734 | 76.639 | 6.544 | |
| −6 | −1.884 | 0.971 | 1.925 | 0.849 | 4.62 | 12.151 | 4.656 | 0.667 | 8.549 | 20.304 | 4.699 | |
| −7 | 2.995 | 0.578 | −0.001 | 0.155 | 4.412 | 5.049 | 14.4 | 0.603 | 0.076 | 9.449 | 1.762 | |
| −8 | 8.784 | 1.85 | −2.758 | 0.049 | 2.173 | 5.831 | 10.33 | 0.042 | 6.437 | 15.698 | 9.872 | |
| −9 | 7.155 | 1.255 | 3.718 | 0.387 | −4.307 | 7.97 | 5.383 | 0.043 | 9.656 | 39.821 | 8.742 | |
| HOMA-B | −1 | 7.731 | 0.678 | −0.314 | 0.788 | −1.317 | 10.31 | 8.014 | 0.162 | 2.391 | 53.44 | 3.075 |
| −2 | 4.054 | 2.768 | −1.709 | 0.361 | −0.459 | 10.042 | 10.09 | 0.525 | 5.2 | 89.3 | 5.257 | |
| −3 | 9.409 | 0.964 | −1.253 | 0.53 | −4.039 | 7.094 | 19.98 | 0.34 | 9.803 | 26.724 | 5.961 | |
| HbA1c | −1 | 0.973 | 1.136 | 4.334 | 0.611 | 3.479 | 8.843 | 14.33 | 0.412 | 3.406 | 38.956 | 1.582 |
| −2 | 2.527 | 2.295 | 0.158 | 0.68 | 2.541 | 12.752 | 9.894 | 0.999 | 1.562 | 99.006 | 5.555 | |
| −3 | 5.142 | 0.65 | −0.44 | 0.876 | −4.328 | 10.953 | 5.21 | 0.494 | 7.379 | 88.052 | 3.918 | |
| −4 | −1.688 | 2.689 | −0.027 | 0.341 | 2.776 | 12.274 | 17.9 | 0.605 | 1.15 | 73.74 | 6.813 | |
| −5 | 5.952 | 1.659 | 3.82 | 0.429 | 3.718 | 11.247 | 17.73 | 0.493 | 9.091 | 55.075 | 3.081 | |
| −6 | 1.218 | 1.254 | −2.535 | 0.507 | 1.473 | 9.716 | 0.513 | 0.714 | 5.382 | 23.323 | 1.856 | |
| hs-CRP | −1 | 2.349 | 0.826 | −1.345 | 0.218 | −3.81 | 10.12 | 8.679 | 0.579 | 9.793 | 82.216 | 4.494 |
| −2 | 4.179 | 2.733 | 1.915 | 0.447 | −1.445 | 13.693 | 6.918 | 0.859 | 5.061 | 17.348 | 3.277 | |
| −3 | −1.612 | 0.759 | 0.603 | 0.132 | −1.792 | 13.262 | 13.88 | 0.818 | 6.027 | 29.9 | 4.152 | |
| Vitamin D | −1 | 4.048 | 0.724 | −0.985 | 0.604 | 2.84 | 13.706 | 14.1 | 0.816 | 4.49 | 62.115 | 6.158 |
| −2 | 8.781 | 2.666 | −1.18 | 0.208 | 0.56 | 8.886 | 4.445 | 0.69 | 6.638 | 79.21 | 5.533 | |
| −3 | 3.285 | 2.569 | −1.709 | 0.303 | 1.48 | 9.355 | 14.12 | 0.085 | 3.186 | 87.486 | 1.038 | |
| −4 | 3.479 | 1.634 | 2.203 | 0.197 | −2.116 | 9.983 | 11.58 | 0.868 | 9.388 | 71.056 | 8.379 | |
| −5 | −0.021 | 2.059 | −2.096 | 0.05 | 4.012 | 5.333 | 11.82 | 0.253 | 4.188 | 5.06 | 4.221 | |
| −6 | 0.712 | 2.991 | −1.793 | 0.591 | −3.136 | 9.245 | 19.24 | 0.299 | 1.389 | 22.088 | 6.045 |
For the insulin level outcome (Figure 10, Table 4), the I2 values remained substantial across all iterations, indicating persistent heterogeneity even after sequential study omission. Although no single study drastically altered the pooled effect estimate, moderate shifts in tau2 and Q statistics were observed, particularly when omitting studies with higher Cook’s distance and hat values. This implies that while individual studies exert moderate influence, the insulin level findings are relatively stable.
Figure 10.
Baujat plot for insulin level outcome.
In the HOMA-IR outcome (Figure 11, Table 4), the I2 values ranged from low to moderate (20–77%), with only slight changes across iterations. No single study had a disproportionate impact on the effect size or heterogeneity. Influence diagnostics (e.g., Cook’s distance, DFFITS, hat) remained within acceptable limits, suggesting that the pooled findings for HOMA-IR are robust and not strongly driven by any outlier study.
Figure 11.
Baujat plot for HOMA-IR outcome.
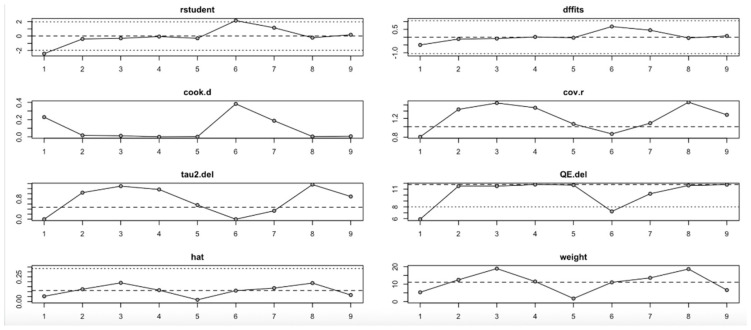
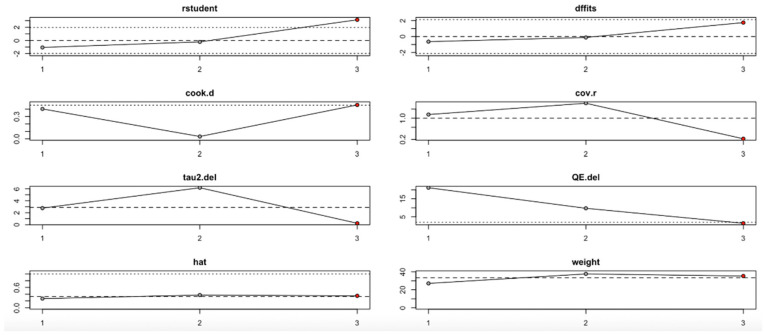
Conversely, the HOMA-B outcome (Figure 12, Table 4) showed high sensitivity to the second study. Omitting this study significantly affected the effect estimate and dramatically reduced heterogeneity (I2), tau2, and Q values. Influence diagnostics such as Cook’s distance and DFFITS confirmed this study’s substantial influence. Despite these variations, the overall effect direction remained consistent, although the robustness of the findings is limited by the small number of included studies.
Figure 12.
Baujat plot for HOMA-B outcome.
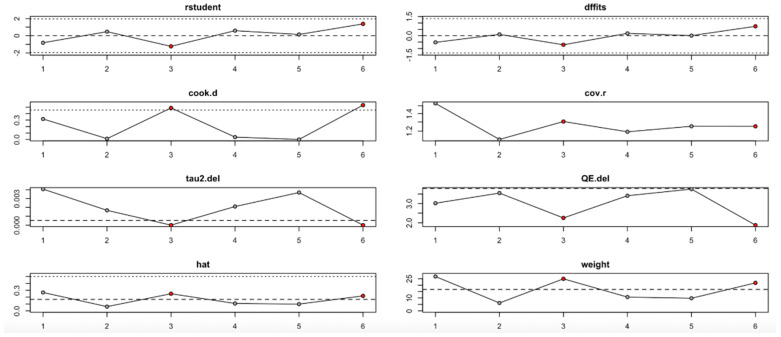
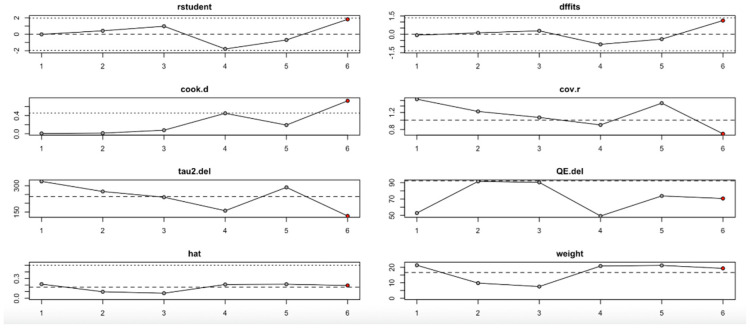
For the HbA1c level outcome (Figure 13, Table 4), heterogeneity remained moderate throughout the leave-one-out iterations. The sixth study appeared particularly influential, as its removal altered both the pooled estimate and the heterogeneity statistics (e.g., reduction in QE.del and tau2). Diagnostic values supported its influence, but even with its exclusion, the effect remained statistically robust.
Figure 13.
Baujat plot for HbA1c level outcome.
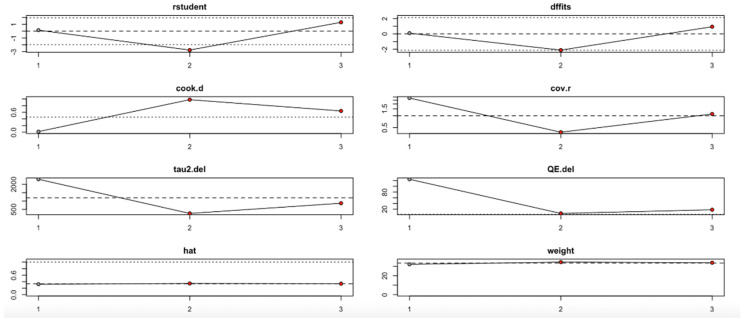
The hs-CRP outcome (Figure 14, Table 4) revealed that the third study had an outsized impact. Its exclusion resulted in large reductions in heterogeneity (I2) and tau2, and influence diagnostics exceeded typical thresholds. This suggests that the findings for hs-CRP may not be fully stable and should be interpreted cautiously.
Figure 14.
Baujat plot for hs-CRP level outcome.
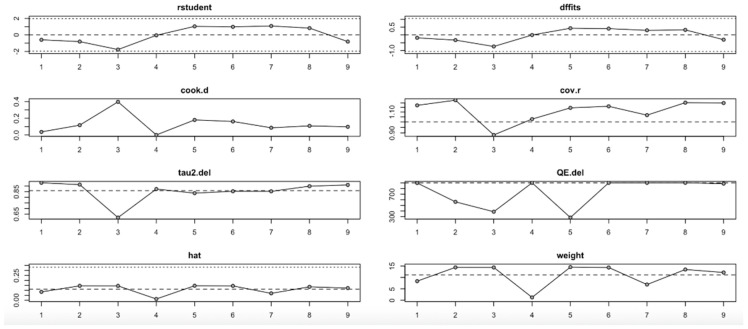
Finally, the serum vitamin D level change (Figure 15, Table 4) showed one particularly influential study (study 6), which notably shifted the tau2 and heterogeneity metrics. Diagnostic plots confirmed its high leverage and influence. Nevertheless, the pooled estimate remained statistically significant, indicating that the beneficial effect on vitamin D level is relatively robust, albeit with some sensitivity to this outlier.
Figure 15.
Baujat plot for level change in serum Vitamin D from Baseline outcome.
In summary, the leave-one-out analysis indicates that while most outcomes (FPG, insulin, HOMA-IR, HbA1c, and vitamin D) show generally robust results, some outcomes—particularly HOMA-B and hs-CRP—are more sensitive to specific influential studies. This reinforces the importance of examining study-level characteristics and potential sources of heterogeneity in future research (Figure 9, Figure 10, Figure 11, Figure 12, Figure 13, Figure 14 and Figure 15, Table 4).
4. Discussion
This systematic review and meta-analysis assessed the impact of vitamin D supplementation on glycemic control and inflammation in patients with T2DM across nine studies. The main findings showed that vitamin D significantly reduced insulin levels, HbA1c, hs-CRP, and HOMA-B at the 12-week follow-up compared to the controls. Only HOMA-IR is observed to be statistically significant and no significant effect is found for FPG at either time point.
Starting with FPG, the studies collectively reveal a pattern where no significant differences were observed between the experimental and control groups across most follow-up periods. This result indicates that the interventions assessed may not significantly affect fasting glucose levels, at least in the timeframe examined. While the current study did not reveal a meaningful effect, earlier research reported different outcomes. A meta-analysis by Chen W et al. showed that vitamin D supplementation can significantly reduce fasting plasma glucose and the result was marked when it was given in a short-term and high dosage to patients with a vitamin D deficiency, who are overweight, or who have an HbA1C of 8% or a higher baseline [19]. The high heterogeneity observed (I2 = 73%) underscores the potential influence of varying study designs and population characteristics; if participants were already vitamin D sufficient, supplementation may not have yielded significant changes. A study by Pittas AG et al., showed that among populations at high risk of T2DM that are not vitamin D insufficient, vitamin D supplementation at a dose of 4000IU did not significantly lower the risk of diabetes [34]. Even with the non-significant results in this study, the potential mechanism remain relevant for future research, as vitamin D influences insulin secretion from pancreatic beta cells and potentially enhances insulin sensitivity in peripheral tissue by reducing systemic inflammation through the vitamin D receptor on pancreatic beta cells, muscles, and liver [35].
Insulin levels present a slightly different narrative. While the pooled data for the 12-week follow-up indicates a significant reduction in insulin levels favoring the experimental group, this effect does not persist at the 24-week mark. The overall trend, though leaning towards a reduction, fails to reach statistical significance, suggesting a potential short-term benefit of vitamin D on insulin levels and that the initial benefits might diminish over time. This finding aligns with the previous meta-analysis by Chen W et al., which showed that vitamin D supplementation can significantly reduce insulin levels and the result was marked when it was given in a short-term and high dosage to patients with a vitamin D deficiency, who are overweight, or who have an HbA1C of 8% or a higher level [19]. The high heterogeneity (I2 = 91%) again highlights the complexity of comparing studies with differing methodologies and populations.
In examining HOMA-IR, a key measure of insulin resistance, the findings reveal a mixed outcome. While no significant difference is observed at 12 weeks, the 24-week follow-up shows a meaningful reduction in insulin resistance favoring the experimental treatment. A meta-analysis by Pramono et al. showed that there was no effect of vitamin D supplementation on peripheral insulin sensitivity [36]. A different finding was found by a study by Lemieux, which showed that a 6-month vitamin D supplementation in individuals at high risk of diabetes or with newly diagnosed T2DM significantly increased peripheral insulin sensitivity [37]. This suggests that longer-term intervention may be required to observe significant improvements in insulin sensitivity.
HOMA-B, which assesses beta cell function, tells yet another story. The 12-week follow-up data suggest that the control group may experience better outcomes, as indicated by a significant difference favoring the control. However, by 24 weeks, these differences are no longer significant, indicating that any early advantage might not persist or could even reverse over time. The high heterogeneity (I2 = 99%) here is particularly striking, reflecting substantial variability across the studies.
The HbA1c levels, a long-term marker of blood glucose control, show a small but significant reduction at 12 weeks in favor of the experimental group. However, this difference does not remain significant at 24 weeks. Our finding does not align with a study by Cojic M et al., which reported that oral daily vitamin D supplementation significantly improved HbA1c levels over a 3-month and 6-month period [32]. However, our finding aligns with a meta-analysis by Hu et al., which reported that vitamin D supplementation in T2D patients significantly improved Hba1c in a short-term intervention (<6 months) [38].
Analysis of hs-CRP reveals that the experimental treatments are associated with significant reductions at 12 weeks, though these effects do not persist at 24 weeks. The overall trend suggests that the treatments may have an anti-inflammatory effect, but this is not sustained over time. A meta-analysis by Yu et al. showed that vitamin D supplementation over 12 weeks is significantly beneficial for the reduction of hs-CRP in T2DM patients; however, this study also has high heterogeneity [39]. The high heterogeneity (I2 = 91%) in our study again suggests variability in study designs and populations, which complicates the interpretation of these findings.
The analysis of serum vitamin D level changes from baseline demonstrates a significant increase in vitamin D levels favoring the experimental group, indicating that supplementation effectively improves vitamin D status. This result is consistent with previous studies showing that vitamin D supplementation reliably raises serum levels, particularly when higher doses are used over shorter periods. However, the very high heterogeneity (I2 = 97%) highlights substantial differences between the studies, likely due to variations in baseline vitamin D levels, dosage, treatment duration, and population characteristics. This variability reflects the well-documented observation that individuals with lower baseline vitamin D levels, higher BMI, or metabolic disturbances tend to show a more pronounced response to supplementation. While the biochemical efficacy of vitamin D supplementation is clear, its clinical relevance in relation to glycemic control and inflammatory outcomes remains uncertain. This finding reinforces the need for future research to focus not only on correcting deficiency but also on determining whether these improvements lead to meaningful metabolic benefits, especially in populations at higher risk of type 2 diabetes. Future trials should aim for longer follow-up periods, standardized dosing protocols, and better participant stratification based on baseline vitamin D status and metabolic risk to better understand the long-term effects of supplementation.
This study’s strengths include its comprehensive approach as the first systematic review and meta-analysis focusing on the impact of vitamin D3 supplementation on key biomarkers related to T2DM, such as FPG, insulin levels, HOMA-IR, HOMA-B, HbA 1c, and hs-CRP. It also benefits from including data from diverse global studies, enhancing the generalizability of the findings. Given these outcomes, clinicians might consider short- to medium-term vitamin D supplementation for T2DM patients who are vitamin D deficient, especially to target inflammatory markers and short-term glucose improvements. However, the diminishing effects over time warrant cautious interpretation. From a research perspective, the findings highlight the need for longer-duration trials and exploration into the dose–response relationship to determine the optimal strategy for sustained metabolic benefits.
This study has several limitations. Firstly, many of these studies employed short follow-up periods, which may limit the ability to evaluate the long-term effects or sustainability of the benefit of vitamin D. Also, variability in population characteristics, such as age, BMI, and baseline vitamin D levels, further influences the outcomes and may limit applicability to specific subgroups. The geographic and healthcare availability among the study populations (ranging from Iran to Mexico to Australia) may also contribute to heterogeneity in outcomes due to differences in diabetes management standards, diet, sun exposure, and healthcare access. The baseline vitamin D status was also not consistently stratified across the studies, which could affect how the participants respond to supplementation and make it harder to see differences between specific groups.
Future research should prioritize long-term randomized controlled trials (exceeding six months), stratification of study populations based on baseline vitamin D status, HbA1c, and BMI, and the standardization of dosing regimens. Further investigations should also examine the underlying mechanisms of action, such as immune modulation, and explore the synergistic effects of vitamin D when combined with other antidiabetic treatments. These directions will help identify the subgroups most likely to benefit and inform more personalized, evidence-based strategies for vitamin D use in T2DM management.
5. Conclusions
The analysis of various biomarkers and the evidence from multiple studies suggests that while vitamin D supplementation shows potential benefits in managing T2DM, these effects are complex and may require individualized approaches. The observed trends in FPG, insulin levels, HOMA-IR, HOMA-B, HbA1c, and hs-CRP indicate that vitamin D may influence glycemic control, insulin sensitivity, and inflammation, but these effects are often modest and may diminish over time. The variability in outcomes across the studies highlights the importance of considering factors such as baseline vitamin D levels, dosage, duration of treatment, and individual patient characteristics. High-dose vitamin D regimens might be necessary for rapid correction in certain populations, while maintenance doses could sustain benefits in the longer term. However, the heterogeneity observed in the data suggests that further research is needed to fully understand the optimal long-term implications of vitamin D supplementation in T2DM management.
Acknowledgments
The authors thank all staff members at the Faculty of Medicine Universitas Diponegoro. The first author was the recipient of a Beasiswa Universitas Diponegoro for Doctoral Study Program of Medical and Health Science, Universitas Diponegoro, Semarang.
Supplementary Materials
The following supporting information can be downloaded at: https://www.mdpi.com/article/10.3390/nu17152489/s1, Supplementary File S1_PRISMA Checklist; Supplementary File S2_Studies Screening Report; Supplementary File S3_Risk of Bias Assessment.
Author Contributions
Conceptualization, E.P. and T.I.W.; methodology, H.W.S. and H.-N.; software, K.C.T.; validation, H.W.S., H.-N., and B.R.; formal analysis, E.P.; investigation, K.C.T.; resources, E.P.; data curation, S.F.M. and D.A.; writing—original draft preparation, E.P., K.C.T., D.A., and T.I.W.; writing—review and editing, T.I.W. and S.F.M.; visualization, K.C.T. and D.A.; supervision, H.W.S. and B.R.; project administration, E.P.; funding acquisition, E.P. All authors have read and agreed to the published version of the manuscript.
Institutional Review Board Statement
Not applicable.
Informed Consent Statement
Not applicable.
Data Availability Statement
The original data presented in the study are openly available in Supplementary File S1.
Conflicts of Interest
The authors declare no conflicts of interest.
Funding Statement
This research received no external funding.
Footnotes
Disclaimer/Publisher’s Note: The statements, opinions and data contained in all publications are solely those of the individual author(s) and contributor(s) and not of MDPI and/or the editor(s). MDPI and/or the editor(s) disclaim responsibility for any injury to people or property resulting from any ideas, methods, instructions or products referred to in the content.
References
- 1.Tabesh M., Azadbakht L., Faghihimani E., Tabesh M., Esmaillzadeh A. Effects of calcium-vitamin D co-supplementation on metabolic profiles in vitamin D insufficient people with type 2 diabetes: A randomised controlled clinical trial. Diabetologia. 2014;57:2038–2047. doi: 10.1007/s00125-014-3313-x. [DOI] [PubMed] [Google Scholar]
- 2.Haines S.T., Park S.K. Vitamin D supplementation: What’s known, what to do, and what’s needed. Pharmacotherapy. 2012;32:354–382. doi: 10.1002/phar.1037. [DOI] [PubMed] [Google Scholar]
- 3.Melguizo-Rodríguez L., Costela-Ruiz V.J., García-Recio E., De Luna-Bertos E., Ruiz C., Illescas-Montes R. Role of Vitamin D in the Metabolic Syndrome. Nutrients. 2021;13:830. doi: 10.3390/nu13030830. [DOI] [PMC free article] [PubMed] [Google Scholar]
- 4.Kaseb F., Haghighyfard K., Salami M.S., Ghadiri-Anari A. Relationship Between Vitamin D Deficiency and Markers of Metabolic Syndrome Among Overweight and Obese Adults. Acta Medica Iran. 2017;55:399–403. [PubMed] [Google Scholar]
- 5.Koziarska-Rościszewska M., Rysz J., Stępień M. High prevalence of vitamin D deficiency and its association with metabolic disorders in elderly patients. Fam. Med. Prim. Care Rev. 2017;9:372–376. doi: 10.5114/fmpcr.2017.70809. [DOI] [Google Scholar]
- 6.Ruze R., Liu T., Zou X., Song J., Chen Y., Xu R., Yin X., Xu Q. Obesity and type 2 diabetes mellitus: Connections in epidemiology, pathogenesis, and treatments. Front. Endocrinol. 2023;14:1161521. doi: 10.3389/fendo.2023.1161521. [DOI] [PMC free article] [PubMed] [Google Scholar]
- 7.Goyal R., Singhal M., Jialal I. StatPearls. StatPearls Publishing; Treasure Island, FL, USA: 2024. Type 2 Diabetes. [Google Scholar]
- 8.Galicia-Garcia U., Benito-Vicente A., Jebari S., Larrea-Sebal A., Siddiqi H., Uribe K.B., Ostolaza H., Martín C. Pathophysiology of Type 2 Diabetes Mellitus. Int. J. Mol. Sci. 2020;21:6275. doi: 10.3390/ijms21176275. [DOI] [PMC free article] [PubMed] [Google Scholar]
- 9.Scragg R., Holdaway I., Singh V., Metcalf P., Baker J., Dryson E. Serum 25-hydroxyvitamin D3 levels decreased in impaired glucose tolerance and diabetes mellitus. Diabetes Res. Clin. Pract. 1995;27:181–188. doi: 10.1016/0168-8227(95)01040-K. [DOI] [PubMed] [Google Scholar]
- 10.Boucher B.J., Mannan N., Noonan K., Hales C.N., Evans S.J. Glucose intolerance and impairment of insulin secretion in relation to vitamin D deficiency in east London Asians. Diabetologia. 1995;38:1239–1245. doi: 10.1007/BF00422375. [DOI] [PubMed] [Google Scholar]
- 11.Baynes K.C., Boucher B.J., Feskens E.J., Kromhout D. Vitamin D, glucose tolerance and insulinaemia in elderly men. Diabetologia. 1997;40:344–347. doi: 10.1007/s001250050685. [DOI] [PubMed] [Google Scholar]
- 12.Maestro B., Dávila N., Carranza M.C., Calle C. Identification of a Vitamin D response element in the human insulin receptor gene promoter. J. Steroid Biochem. Mol. Biol. 2003;84:223–230. doi: 10.1016/S0960-0760(03)00032-3. [DOI] [PubMed] [Google Scholar]
- 13.Wolden-Kirk H., Overbergh L., Gysemans C., Brusgaard K., Naamane N., Van Lommel L., Schuit F., Eizirik D.L., Christesen H., Mathieu C. Unraveling the effects of 1,25OH2D3 on global gene expression in pancreatic islets. J. Steroid Biochem. Mol. Biol. 2013;136:68–79. doi: 10.1016/j.jsbmb.2012.10.017. [DOI] [PubMed] [Google Scholar]
- 14.Sergeev I.N., Rhoten W.B. 1,25-Dihydroxyvitamin D3 evokes oscillations of intracellular calcium in a pancreatic beta-cell line. Endocrinology. 1995;136:2852–2861. doi: 10.1210/endo.136.7.7789310. [DOI] [PubMed] [Google Scholar]
- 15.Doyle M.E., Egan J.M. Pharmacological agents that directly modulate insulin secretion. Pharmacol. Rev. 2003;55:105–131. doi: 10.1124/pr.55.1.7. [DOI] [PubMed] [Google Scholar]
- 16.Gilon P., Chae H.Y., Rutter G.A., Ravier M.A. Calcium signaling in pancreatic β-cells in health and in Type 2 diabetes. Cell Calcium. 2014;56:340–361. doi: 10.1016/j.ceca.2014.09.001. [DOI] [PubMed] [Google Scholar]
- 17.Kjalarsdottir L., Tersey S.A., Vishwanath M., Chuang J.C., Posner B.A., Mirmira R.G., Repa J.J. 1,25-Dihydroxyvitamin D(3) enhances glucose-stimulated insulin secretion in mouse and human islets: A role for transcriptional regulation of voltage-gated calcium channels by the vitamin D receptor. J. Steroid Biochem. Mol. Biol. 2019;185:17–26. doi: 10.1016/j.jsbmb.2018.07.004. [DOI] [PubMed] [Google Scholar]
- 18.Altieri B., Grant W., della casa S., Orio F., Pontecorvi A., Colao A., Sarno G., Muscogiuri G. Vitamin D and pancreas: The role of sunshine vitamin in the pathogenesis of Diabetes Mellitus and Pancreatic Cancer. Crit. Rev. Food Sci. Nutr. 2016;57:3472–3488. doi: 10.1080/10408398.2015.1136922. [DOI] [PubMed] [Google Scholar]
- 19.Chen W., Liu L., Hu F. Efficacy of vitamin D supplementation on glycaemic control in type 2 diabetes: An updated systematic review and meta-analysis of randomized controlled trials. Diabetes Obes. Metab. 2024;26:5713–5726. doi: 10.1111/dom.15941. [DOI] [PubMed] [Google Scholar]
- 20.El Hajj C., Walrand S., Helou M., Yammine K. Effect of Vitamin D Supplementation on Inflammatory Markers in Non-Obese Lebanese Patients with Type 2 Diabetes: A Randomized Controlled Trial. Nutrients. 2020;12:2033. doi: 10.3390/nu12072033. [DOI] [PMC free article] [PubMed] [Google Scholar]
- 21.Higgins J.P.T., Thomas J., Chandler J., Cumpston M., Li T., Page M.J., Welch V.A., editors. Cochrane Handbook for Systematic Reviews of Interventions. Wiley; Hoboken, NJ, USA: 2023. [(accessed on 22 July 2024)]. version 6.4 (updated February 2023) Available online: https://training.cochrane.org/handbook. [Google Scholar]
- 22.Moher D., Liberati A., Tetzlaff J., Altman D.G. Preferred reporting items for systematic reviews and meta-analyses: The PRISMA statement. PLoS Med. 2009;6:e1000097. doi: 10.1371/journal.pmed.1000097. [DOI] [PMC free article] [PubMed] [Google Scholar]
- 23.Sterne J.A.C., Savović J., Page M.J., Elbers R.G., Blencowe N.S., Boutron I., Cates C.J., Cheng H.-Y., Corbett M.S., Eldridge S.M., et al. RoB 2: A revised tool for assessing risk of bias in randomised trials. BMJ. 2019;366:l4898. doi: 10.1136/bmj.l4898. [DOI] [PubMed] [Google Scholar]
- 24.DerSimonian R., Laird N. Meta-analysis in clinical trials. Control. Clin. Trial. 1986;7:177–188. doi: 10.1016/0197-2456(86)90046-2. [DOI] [PubMed] [Google Scholar]
- 25.Higgins J.P.T., Thompson S.G., Deeks J.J., Altman D.G. Measuring inconsistency in meta-analyses. BMJ. 2003;327:557–560. doi: 10.1136/bmj.327.7414.557. [DOI] [PMC free article] [PubMed] [Google Scholar]
- 26.Muñoz-Aguirre P., Flores M., Macias N., Quezada A.D., Denova-Gutiérrez E., Salmerón J. The effect of vitamin D supplementation on serum lipids in postmenopausal women with diabetes: A randomized controlled trial. Clin. Nutr. 2015;34:799–804. doi: 10.1016/j.clnu.2014.10.002. [DOI] [PubMed] [Google Scholar]
- 27.Jafari T., Faghihimani E., Feizi A., Iraj B., Javanmard S.H., Esmaillzadeh A., Fallah A.A., Askari G. Effects of vitamin D-fortified low fat yogurt on glycemic status, anthropometric indexes, inflammation, and bone turnover in diabetic postmenopausal women: A randomised controlled clinical trial. Clin. Nutr. 2016;35:67–76. doi: 10.1016/j.clnu.2015.02.014. [DOI] [PubMed] [Google Scholar]
- 28.Krul-Poel Y.H.M., Westra S., Boekel ETen Wee M.M.T., Van Schoor N.M., Van Wijland H., Stam F., Lips P.T., Simsek S. Effect of Vitamin D supplementation on glycemic control in patients with type 2 diabetes (SUNNY Trial): A randomized placebo-controlled trial. Diabetes Care. 2015;38:1420–1426. doi: 10.2337/dc15-0323. [DOI] [PubMed] [Google Scholar]
- 29.Asemi Z., Raygan F., Bahmani F., Rezavandi Z., Talari H.R., Rafiee M., Poladchang S., Darooghegi Mofrad M., Taheri S., Mohammadi A.A., et al. The effects of vitamin D, K and calcium co-supplementation on carotid intima-media thickness and metabolic status in overweight type 2 diabetic patients with CHD. Br. J. Nutr. 2016;116:286–293. doi: 10.1017/S0007114516001847. [DOI] [PubMed] [Google Scholar]
- 30.Mousa A., Naderpoor N., De Courten M.P.J., Teede H., Kellow N., Walker K., Scragg R., de Courten B. Vitamin D supplementation has no effect on insulin sensitivity or secretion in Vitamin D-deficient, overweight or obese adults: A randomized placebo-controlled trial. Am. J. Clin. Nutr. 2017;105:1372–1381. doi: 10.3945/ajcn.117.152736. [DOI] [PubMed] [Google Scholar]
- 31.Bhatt S.P., Misra A., Pandey R.M., Upadhyay A.D., Gulati S., Singh N. Vitamin D Supplementation in Overweight/obese Asian Indian Women with Prediabetes Reduces Glycemic Measures and Truncal Subcutaneous Fat: A 78 Weeks Randomized Placebo-Controlled Trial (PREVENT-WIN Trial) Sci. Rep. 2020;10:220. doi: 10.1038/s41598-019-56904-y. [DOI] [PMC free article] [PubMed] [Google Scholar]
- 32.Cojic M., Kocic R., Klisic A., Kocic G. The Effects of Vitamin D Supplementation on Metabolic and Oxidative Stress Markers in Patients With Type 2 Diabetes: A 6-Month Follow Up Randomized Controlled Study. Front. Endocrinol. 2021;12:610893. doi: 10.3389/fendo.2021.610893. [DOI] [PMC free article] [PubMed] [Google Scholar]
- 33.Sun X., Yan T., Li Z., Zhou S., Peng W., Cui W., Xu J., Cao Z.B., Shi L., Wang Y. Effects of Endurance Exercise and Vitamin D Supplementation on Insulin Resistance and Plasma Lipidome in Middle-Aged Adults with Type 2 Diabetes. Nutrients. 2023;15:3027. doi: 10.3390/nu15133027. [DOI] [PMC free article] [PubMed] [Google Scholar]
- 34.Pittas A.G., Lau J., Hu F.B., Dawson-Hughes B. The role of vitamin D and calcium in type 2 diabetes. A systematic review and meta-analysis. J. Clin. Endocrinol. Metab. 2007;92:2017–2029. doi: 10.1210/jc.2007-0298. [DOI] [PMC free article] [PubMed] [Google Scholar]
- 35.Argano C., Mirarchi L., Amodeo S., Orlando V., Torres A., Corrao S. The Role of Vitamin D and Its Molecular Bases in Insulin Resistance, Diabetes, Metabolic Syndrome, and Cardiovascular Disease: State of the Art. Int. J. Mol. Sci. 2023;24:15485. doi: 10.3390/ijms242015485. [DOI] [PMC free article] [PubMed] [Google Scholar]
- 36.Pramono A., Jocken J.W.E., Blaak E.E., van Baak M.A. The Effect of Vitamin D Supplementation on Insulin Sensitivity: A Systematic Review and Meta-analysis. Diabetes Care. 2020;43:1659–1669. doi: 10.2337/dc19-2265. [DOI] [PubMed] [Google Scholar]
- 37.Lemieux P., Weisnagel S.J., Caron A.Z., Julien A.S., Morisset A.S., Carreau A.M., Poirier J., Tchernof A., Robitaille J., Bergeron J., et al. Effects of 6-month vitamin D supplementation on insulin sensitivity and secretion: A randomised, placebo-controlled trial. Eur. J. Endocrinol. 2019;181:287–299. doi: 10.1530/EJE-19-0156. [DOI] [PubMed] [Google Scholar]
- 38.Hu Z., Chen J., Sun X., Wang L., Wang A. Efficacy of vitamin D supplementation on glycemic control in type 2 diabetes patients: A meta-analysis of interventional studies. Medicine. 2019;98:e14970. doi: 10.1097/MD.0000000000014970. [DOI] [PMC free article] [PubMed] [Google Scholar]
- 39.Yu Y., Tian L., Xiao Y., Huang G., Zhang M. Effect of Vitamin D Supplementation on Some Inflammatory Biomarkers in Type 2 Diabetes Mellitus Subjects: A Systematic Review and Meta-Analysis of Randomized Controlled Trials. Ann. Nutr. Metab. 2018;73:62–73. doi: 10.1159/000490358. [DOI] [PubMed] [Google Scholar]
Associated Data
This section collects any data citations, data availability statements, or supplementary materials included in this article.
Supplementary Materials
Data Availability Statement
The original data presented in the study are openly available in Supplementary File S1.


