

Abstract
Background:
Direct assessments of cerebral small vessels in Cerebral Autosomal Dominant Arteriopathy with Subcortical Infarcts and Leukoencephalopathy (CADASIL) remain a challenge.
Purpose:
To investigate changes of cerebral small vessels in CADASIL using iso-0.5 mm black-blood MRI.
Study Type:
Case control study.
Population:
Thirty-six genetically confirmed CADASIL patients (23 female, 43 ± 12.48 years) and 35 matched healthy controls (27 female, 40 ± 11.57 years).
Field Strength/Sequence:
3T using a T1-weighted turbo spin-echo with variable flip angles sequence.
Assessment:
Vessel density images (VDIs) were derived from black-blood MRI by using a semi-automatic pipeline with a Jerman filter. The differences in VDI were assessed between CADASIL and control groups. The relationships between changes in VDI and cognitive performance and disease burden were studied in the CADASIL group.
Statistical Tests:
Two-tailed independent samples t-tests were employed to assess the difference in VDI between CADASIL and control groups. Generalized linear mixed-effect models were used to assess the associations of VDI with cognitive performance and disease burden. Voxel-wise analyses were performed to further explore the associations of regional VDI with cognitive performance and disease burden after FDR correction.
Results:
Reduced mean VDI was found in gray matter of CADASIL patients (1.31 ± 0.06) compared to controls (1.35 ± 0.03), which was significantly associated with lower MoCA scores (β = 52.89, SE = 12.99, 95% CI [26.38, 79.40]), and higher cerebral small vessel disease (cSVD) burden scores (β = −14.34, SE = 3.22, 95% CI [−20.91, −7.76]) in CADASIL patients. Voxel-wise analyses revealed reduced regional VDI in regions of the temporal pole, insula, cingulate cortex, and orbitofrontal cortex in CADASIL patients.
Data Conclusion:
The VDI technique based on high-resolution black-blood MRI demonstrated changes in regional VDI in CADASIL patients and offers a noninvasive imaging tool to advance the understanding of the mechanisms underlying cSVD.
Evidence Level:
3.
Technical Efficiency:
Stage 2.
Keywords: Black-blood MRI, CADASIL, cerebral small vessel disease, vessel density imaging
Plain Language Summary
CADASIL is an inherited disorder that damages small brain blood vessels, affecting brain health, causing stroke and dementia. The small brain vessel damage, preceding brain damage, is hard to visualize currently. In this study, researchers used a novel high-resolution MRI technique to map small blood vessel density in CADASIL patients. They discovered CADASIL patients had fewer small vessels in crucial brain regions for cognition, and this vessel loss was directly associated with worse cognitive performance. This new method offers a safe, non-invasive tool to better understand and potentially monitor the disabling changes caused by CADASIL.
1 |. Introduction
Cerebral small vessel disease (cSVD) is an umbrella term for heterogeneous neurological conditions affecting small vessels, including arterioles, capillaries, and venules [1, 2]. It is estimated that cSVD is associated with about 45% of all dementia cases and 25% of lacunar strokes [1, 2]. Among those, Cerebral Autosomal Dominant Arteriopathy with Subcortical Infarcts and Leukoencephalopathy (CADASIL) is the most prevalent form of genetic cSVD caused by NOTCH3 mutation [3]. The homogeneity in its etiology makes CADASIL an ideal case to study the vasculopathy associated with cSVD without confounding factors in sporadic cSVD such as aging and neurodegenerative disorders.
Conventional diagnostic imaging of cSVD solely relies on indirect parenchymal MRI markers including white matter hyperintensities (WMHs), lacunar infarcts, cerebral microbleeds (CMBs), and enlarged perivascular spaces (ePVS), with a composite score of cSVD burden proposed based on the four markers [4]. These markers reflect downstream tissue damage rather than the small vessels, limiting their ability for early diagnosis and assessment of disease progression at the vascular level. A growing body of histopathological evidence suggests that reduced capillary density in CADASIL patients may contribute to further damage to the brain [5]. Direct visualization and quantification of cerebral small blood vessels in the human brain in vivo, however, is limited using most current imaging techniques.
Recent studies employed time-of-flight (TOF) MRA at ultra-high field strength of 7T to visualize lenticulostriate arteries (LSAs), a collection of small perforating arteries supplying the basal ganglia. Results showed a decreased number of LSA branches in CADASIL patients, which is associated with poor cognitive performance [6, 7]. Despite its potential, the application of 7T TOF MRA has been hampered by the limited availability of 7T MRI. In addition, existing studies were mainly focused on the LSAs and have yet to be extended to small vessels of the whole brain [7, 8]. High resolution (~0.5 mm-iso) black-blood MRI at 3T has recently been proposed to visualize and characterize small cerebral blood vessels on the order of a few hundred microns using T1-weighted turbo spin-echo with variable flip angles (T1w-TSE-VFA) sequence with a novel semi-automatic processing pipeline [8, 9]. Lower small blood vessel density across brain regions has been reported in elderly subjects compared to young subjects, which was associated with cognitive performance in aged subjects, suggesting its potential as a sensitive marker of microvascular structure [8].
This study aimed to use high-resolution 3T black-blood MRI combined with a semi-automatic segmentation pipeline to quantify small blood vessel density across the whole brain in CADASIL patients.
2 |. Methods
2.1 |. Subject Characteristics
This study was approved by the local Institutional Review Board and Ethics Committee. Written informed consent was obtained from each participant after the nature of the procedures had been fully explained. The inclusion criterion for CADASIL patients was a confirmed genetic diagnosis of typical mutation of the NOTCH3 gene and age ≥ 18 years. Information on genetic mutations can be found in Table S4. The healthy controls (HCs) were recruited from the family of CADASIL patients having a negative genetic test or within the community. Participants with contraindication to MRI, any history of stroke, head injury, alcoholism, drug abuse, or severe neurologic and psychiatric illness that might impair cognition were excluded from the control group. In addition, participants with poor black-blood MRI image quality were removed upon agreement of three raters (Z.Y, S.M with 2.5 years of experience, and Z.H with 1.5 years of experience). Vascular risk factors including smoking, alcohol use, hypertension, diabetes, and dyslipidemia were documented for all subjects upon initial inclusion. Furthermore, the cognitive functions were assessed using the Montreal Cognitive Assessment (MoCA) score, and a MoCA score < 26 was considered mild cognitive impairment (MCI) and symptomatic in the CADASIL group [10].
2.2 |. MRI Data Acquisition
All participants underwent MRI scans on a 3.0T MRI system (MAGNETOM Prisma, Siemens Healthineers, Erlangen, Germany) with a 64-channel head coil. The imaging protocol included the T1w-VFA-TSE black-blood MRI, a susceptibility-weighted imaging (SWI) (iso-1 mm spatial resolution, repetition time/echo time (TR/TE) = 28/20 ms, Field of View (FOV) = 220 × 220 mm2), a T2-weighted fluid attenuated inversion recovery (FLAIR) iso-1 mm spatial resolution, TR/TE = 5000/388 ms with Inversion Time (TI) = 1800 ms, and a 3D-T1-weighted magnetization-prepared rapid acquisition gradient echo (MPRAGE) sequence (iso-1 mm resolution, TR/TE = 2300/2.98 ms). The imaging parameters for T1w-VFA-TSE MRI were TR/TE = 900/15 ms, turbo factor = 52, matrix size = 384 × 288, FOV = 196 × 147 mm2, iso-0.5 mm spatial resolution, 240 sagittal slices with 7% slice oversampling, GRAPPA = 2, and a scan time of 7:23 min.
2.3 |. Imaging Characteristics of cSVD
The imaging characteristics of cSVD analyzed in this study included white matter hyperintensities (WMHs) quantified and rated on FLAIR images, enlarged perivascular spaces (ePVS) and lacunar infarcts rated on T1 images, and cerebral microbleeds (CMBs) on SWI images [11]. Visual ratings were performed by a neuroradiologist (Y.L., > 10 years of experience) according to the Standard for Reporting Vascular Changes on Neuroimaging (STRIVE) scale [12].
In addition, the WMH volume (WMHv) was segmented using the Lesion Prediction Algorithm (LPA) within the Lesion Segmentation Toolbox (LST-LPA) followed by visual inspection and manual checking for all subjects. The resulting WMHv was normalized to the total intracranial volume (TIV) to account for variabilities in subject head sizes [13]. Finally, the ratings were combined into a composite cSVD score (ordinal scale, 0–4), with one point assigned for the presence of each of the following criteria: (1) A Fazekas score of periventricular WMH = 3 and/or deep WMHs ≥ 2, (2) lacunar infarcts ≥ 1, (3) CMBs ≥ 1, and (4) ePVS ≥ 10 respectively [14, 15].
2.4 |. Processing Pipeline for Black-Blood MRI
The image quality of black-blood MRI was visually rated by three independent researchers (Z.Y., S.M.) with 2.5 years of experience and Z.H. with 1.5 years of experience based on a four-point Likert scale consisting of image contrast, wrap-around artifacts, and image blurring caused by motion. The exclusion was based on the consensus of all three raters with a score of < 2.5. The agreement across three raters was evaluated using the interclass correlation coefficient (ICC).
A schematic plot of the processing pipeline for black-blood MRI is shown in Figure 1. The black-blood MRI and MPRAGE images were skull-stripped using SynthStrip [16]. Subcortical segmentation was obtained from the ASEG map using the SynthSeg function of FreeSurfer [17]. The resulting images were then denoised using a block-wise non-local means (NLM) filter [18], with a window size of 3 × 3 × 3 in blocks of 45 × 45 × 45 for each imaging volume. The small blood vessels on the order of a few hundred microns were then segmented using the Jerman filter, a 3D Hessian filter, to enhance 3D tubular structures [8, 19]. The parameters of the Jerman filter were determined based on receiver operating characteristic (ROC) analysis using manual landmarking of vessels on black-blood MRI (Figures S1 and S2, Table S1). To ensure the landmarking was consistent across all 3 raters, the intraclass correlation coefficient (ICC) was assessed (online supplement).
FIGURE 1 |.
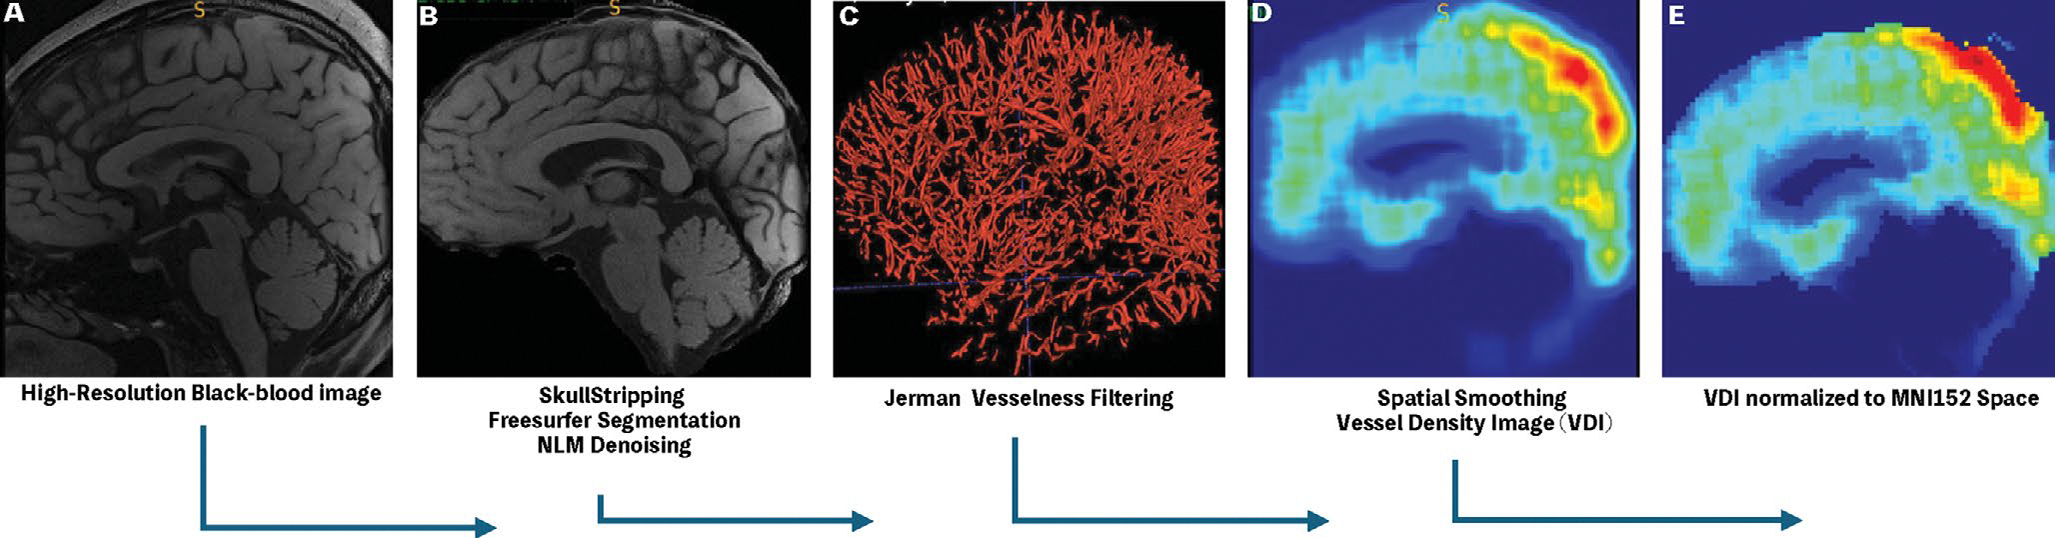
A schematic of semi-automatic Black-Blood Processing Pipeline. (A) (B) The high-resolution BB image was first skull-stripped and de-noised using non-local means filter. (C) Small Vessel Masks were obtained using Jerman vesselness filter with optimal thresholds. (D) The resulting Binary Vessel masks were spatially smoothed into vessel density image (VDI). (E) Finally, the resulting VDIs were normalized to the MNI152 template space for cross-subject analysis.
Due to the discrete and sparse nature of small vessels, direct comparison of their spatial distribution across subjects is not possible. To allow for voxel-wise comparisons of the changes of small vessels across different subjects, vessel density images (VDIs) were constructed (Figure 1 step 4) by convolution of the binarized small vessel masks with a 3D averaging kernel. The window size of the kernel was empirically set to [30,30,30] according to Sarabi et al. [8]. The resulting VDIs were normalized to the Montreal Neurological Institute (MNI) standard space using a two-step registration method. The skull-stripped MPRAGE images were first resampled to the space of the black-blood MRI using affine transformations by the Advanced Normalization Tools (ANTs) followed by a non-linear warp of the MPRAGE image to the 2 mm isotropic MNI152 atlas. The VDIs were then resampled to the MNI152 space by combining the affine transformation and the non-linear warp field from previous steps [20]. Brain tissue segmentation was achieved using the FAST toolbox from FMRIB’s software library (FSL), and lobar ROIs were defined based on the automated anatomical labeling (AAL3) template [21, 22]. Finally, for region-of-interest (ROI) based and voxel-wise analyses, the VDI values were normalized by the global mean VDI in each subject to control for variations of global VDI values across subjects.
To account for variations in brain volume, voxel-based morphometry (VBM) analysis was performed using the deepmriprep package (V0.2.0), a deep learning-based workflow in Python, on T1-weighted structural images [23]. For VBM analysis, the modulated GM and WM images were smoothed with an isotropic Gaussian kernel of 6 mm full-width at half-maximum (FWHM) to derive the final maps of local tissue volume in the MNI152NLin2009cAsym template [23]. The resulting brain masks, tissue segmentations, and normalized final outputs from deepmriprep were visually inspected, and the affine loss and warp mean square error (MSE) were also checked for quality control. The total intracranial volume (TIV) and volumes of the white and gray matters were extracted respectively in each subject.
2.5 |. Statistical Analysis
The demographic and clinical characteristics between the CADASIL and control were compared using two-tailed independent-samples t-tests for continuous variables and chi-square tests for categorical variables. A p-value < 0.05 was considered statistically significant for these comparisons.
To evaluate differences in mean vessel density between CADASIL patients and HCs, two-tailed independent samples t-tests were conducted between the groups for 7 regions of interest (ROIs): whole brain, gray matter (GM), white matter (WM), and the four cortical lobes (for details, refer to Table S2). A Bonferroni correction was applied to control for multiple comparisons across these 7 ROIs, yielding a significance threshold of p < 0.0071 (p = 0.05/7).
To rule out the possibility of potential contribution of altered brain volume in CADASIL patients to observed differences in VDI, independent-samples t-tests were performed to first compare the differences in TIV, WMV, and GMV between CADASIL and control subjects. Voxel-wise analyses were further conducted to compare regional GMV and WMV between CADASIL patients and HC subjects, adjusting for age, sex, education, vascular risk factors, and TIV using SPM12. A false discovery rate (FDR) cluster-corrected p-value < 0.001 was considered statistically significant.
For the ROIs that showed a significant difference between CADASIL patients and controls in mean vessel density after Bonferroni correction, follow-up analyses were performed to examine the relationships of VDI with cognitive performance, WMHv, and cSVD imaging burden using linear mixed-effects (LMMs) models in CADASIL patients adjusting for covariates, including age, sex, education, vascular risk factors, and total intracranial volume (TIV). A Bonferroni-corrected p-value <0.0167 (0.05/number of significant regions × number of effects or 1 × 3) was considered statistically significant.
To further elucidate the effect of CADASIL on regional vessel density, voxel-wise analysis was performed to compare the VDI between the CADASIL patients and HC subjects, adjusting for the same covariates mentioned previously. A false discovery rate (FDR) cluster-corrected p-value <0.001 was considered statistically significant. In addition, post hoc analyses of VDI with cognitive performance, WMHv, and cSVD burden using LMMs adjusting for the same covariates were conducted in the three largest cluster ROIs identified in voxel-wise analyses respectively, including the thalamus, cingulate, and temporal pole (Table 2). A Bonferroni-corrected p-value < 0.006 (0.05/number of significant regions × number of effects, 3 × 3) was considered statistically significant.
TABLE 2 |.
Significant clusters identified using voxel-wise multiple regression analysis of VDI between CADASIL and HC.
| Peak anatomical regions | Peak MNI coordinates | Statistics | |||||
|---|---|---|---|---|---|---|---|
|
|
|
|
|||||
| Hemisphere | Top regions by volume | X | Y | Z | T | p | Size (mL) |
|
| |||||||
| L | Olfactory/Thalamus/Parahippocamal/Red Nucleus/Rectus | 4 | −8 | −6 | 5.6855 | < 0.001 | 8.952 |
| L | Cingulate | −6 | −20 | 26 | 5.6031 | < 0.001 | 3.248 |
| L | Middle/Superior temporal pole | −46 | 12 | −26 | 5.7641 | < 0.001 | 3.2 |
| R | Middle Temporal pole | 36 | 12 | −38 | 4.5197 | < 0.001 | 0.368 |
| R | Superior Temporal pole/Gyrus | 48 | 14 | −20 | 4.2187 | < 0.001 | 0.336 |
| L | OFC/Insula | −30 | 20 | −18 | 4.0464 | < 0.001 | 0.272 |
| R | Para-hippocampal gyrus; Hippocampus | 14 | −6 | −20 | 4.3901 | < 0.001 | 0.248 |
| L | Supplementary motor | 0 | 28 | 58 | −5.7014 | < 0.001 | 1.616 |
| L | White matter | −34 | −58 | 20 | −4.5061 | < 0.001 | 1.264 |
| R | White matter | 40 | −64 | 8 | −4.4664 | < 0.001 | 0.72 |
| R | Pallidum | 26 | −2 | 0 | −4.1733 | < 0.001 | 0.288 |
| R | White matter | 24 | 14 | 24 | −3.9816 | < 0.001 | 0.256 |
| L | White matter | 0 | −22 | 74 | −6.2827 | < 0.001 | 0.248 |
Note: The three largest (by volume) regions, including the thalamus, cingulate, and temporal pole, were used to define custom ROIs.
Finally, the associations of regional VDI with cognitive performance, WMHv, and cSVD burden in CADASIL patients were further explored using voxel-wise multiple regression models adjusting for the same covariates. A false discovery rate (FDR) cluster-corrected p-value <0.001 was considered statistically significant. All image processing and data analysis were carried out using custom scripts in MATLAB 2024b (MathWorks, Natick, MA) and Statistical Parametric Mapping (SPM12) software.
3 |. Results
3.1 |. Patient Demographics and Clinical Characteristics
Table 1 summarizes the demographic and clinical characteristics of the study cohort. The study cohort included 42 CADASIL patients and 43 age- and sex-matched healthy controls (HC), among which, six CADASIL patients and eight HC subjects were excluded due to poor black-blood image quality upon the consensus of three raters (ICC(2.1) = 0.72, 95% CI [0.63, 0.80]), suggesting good to excellent agreement. Finally, a total of 36 genetically confirmed CADASIL patients and 35 HCs were included in the analyses. No statistically significant difference was found in mean age between the CADASIL patients (43.0 ± 12.5 years, 13 males), and HCs (40.0 ± 11.6 years, eight males), p = 0.22, mean difference (MD) = 3.13, 95% CI [−2.57, 8.83]. There were more males in CADASIL than in HC groups (13 vs. 8), although the difference was not significant (Χ2(1.71) = 1.50, p = 0.22). No statistically significant differences in MoCA scores were observed in the CADASIL patients (23.3 ± 6.9) compared to the HCs (25.4 ± 3.9) with a p-value of 0.11, MD = −2.1, 95% CI [−4.77, 0.53]. Furthermore, no significant differences were found in years of education between the CADASIL patients (12.09 ± 4.8 years) and HCs (14.00 ± 5.1 years), p = 0.09 MD = −2, 95% CI [−4.33, 0.53]. Among the CADASIL patients, 20 were identified as being symptomatic (MoCA = 19.1 ± 6.8) and 16 being asymptomatic (MoCA = 28.44 ± 1.4). In CADASIL patients, 17 had lacunar infarcts, 16 had CMBs, and 19 had status Cribosum. In addition, the patients showed on average WMHs of 18.05 ± 16.4 mL.
TABLE 1 |.
Demographic characteristics for CADASIL patients and HC.
| Participants | CADASIL | Healthy control | p |
|---|---|---|---|
|
| |||
| Sample size | 36 | 35 | |
| Age (mean ± SD) | 43 ± 12.5 | 40 ± 11.6 | 0.28 |
| Sex (M/F) | 13/23 | 8/27 | 0.22 |
| Education (years) | 12.0 ± 4.8 | 14.0 ± 5.1 | 0.09 |
| MoCA | 23.3 ± 6.9 | 25.4 ± 3.9 | 0.11 |
| TIA/Stroke | 16/36 | 0/35 | < 0.0001 |
| Vascular risk factors | |||
| Smoking | 7/36 | 3/35 | 0.19 |
| Alcohol use | 9/36 | 8/35 | 0.83 |
| Hypertension | 6/36 | 1/35 | 0.051 |
| Diabetes mellitus | 1/36 | 0/35 | 0.32 |
| Dyslipidemia | 2/36 | 4/35 | 0.37 |
| SVD Burden | |||
| Lacunar infarcts | 17/36 | 0/35 | < 0.0001 |
| CMBs | 16/36 | 0/35 | < 0.0001 |
| Status Cribosum | 19/36 | 0/35 | < 0.0001 |
| WMHv (mL) | 18.05 ± 16.41 | 0 | < 0.0001 |
3.2 |. Regional VDI Reduction in CADASIL Patients Compared With HCs
Figure 2 shows the representative vessel masks for three typical CADASIL patients and three HCs respectively, segmented using a semi-automatic pipeline with optimized Jerman filter. A homogeneous distribution of small vessels can be observed throughout the cortex of the 3 HCs, while visually sparser distribution with fewer small vessels in the frontal and temporal regions can be seen in the 3 patients. Despite the visual differences, the mean VDI of the whole brain was not significantly different between CADASIL patients (0.95% ± 0.2%) and HCs (0.93% ± 0.2%, uncorrected p = 0.66, MD = 0.0002, 95% CI [−0.0008, 0.0013]). However, the patients showed significantly lower normalized VDI in the gray matter (1.31 ± 0.06) compared to the HCs (1.35 ± 0.03, MD = −0.04, 95% CI [−0.06, −0.02]). No statistically significant differences were found in the rest of ROIs. Note that although not statistically significant, a trend of higher VDI in the WM (CADASIL: 1.00 ± 0.08; HC: 0.97 ± 0.04, p = 0.011, MD = 0.041, 95% CI [0.009, 0.07]) but lower VDI in the temporal lobe (CADASIL: 1.45 ± 0.15; HC: 1.53 ± 0.13, p = 0.032, MD = −0.07, 95% CI [−0.14, −0.006]) compared to HCs at uncorrected p < 0.05 was present. Full results of statistical analyses for all ROIs are provided in Table S2. Raw VDI data in percent-age of brain volume has been provided in Table S3. Box plots of GM and WM VDI in CADASIL patients and HC can be seen in Figure 3.
FIGURE 2 |.

Example binary black blood masks. (A–C) Three representative HC subjects. (D–F) Three representative CADASIL patients. Homogeneous distribution of cerebral small vessels can be seen in HC while that in the frontal and temporal areas are visibly sparser in CADASIL patients.
FIGURE 3 |.

Comparison of mean vessel density between HC and CADASIL. (A) GM. (B) WM. p < 0.5/7 = 0.0071 is considered significant (*).
To investigate the potential contribution of brain atrophy, which has been reported in CADASIL patients, to the observed reduction in GM VDI in CADASIL patients, VBM analyses were performed [24]. The TIV (CADASIL: 1162.1 ± 124.9 mL, HC: 1137.3 ± 109.7 mL, p = 0.38, MD = 24.8, 95% CI [−30.939, 80.469]), GM (CADASIL: 621.79 ± 68.6 mL, HC: 614.19 ± 63.0 mL, p = 0.63, MD = 7.6, 95% CI [−23.61, 38.8]), and WM volumes (CADASIL: 540.29 ± 62.2 mL, HC: 523.12 ± 53.9 mL, p = 0.22, MD = 17.2, 95% CI [−10.43, 44.78]) did not differ significantly between the CADASIL and HC groups (Figure 4). Voxel-wise analysis of regional VBM between CADASIL patients and HC subjects using SPM12 after adjusting for age, sex, education, vascular risks, and TIV did not reveal any significant clusters at the level of FDR-cluster corrected p < 0.05 (data not shown).
FIGURE 4 |.

Comparison of voxel-based morphometry (VBM) measures between HC and CADASIL. (A) Total intracranial volume. (B) Gray matter volume. (C) White matter volume. p < 0.05/3 = 0.017 was considered significant difference.
The associations of GM VDI with MoCA, cSVD burden, and WMH volume were further assessed in CADASIL patients using a generalized linear mixed-effects model, adjusting for age, sex, education, vascular risk factors, and TIV. GM VDI was found to have a significant positive association with MoCA scores (β = 52.89, SE = 12.99, 95% CI [26.38, 79.40]) and a significant negative association with cSVD burden (β = −14.34, SE = 3.22, 95% CI [−20.91, −7.76]) in the CADASIL patients (Figure 5A,B).
FIGURE 5 |.

Correlations between GM VDI with SVD burden (A) and MoCA (B), p < 0.05/(1 × 3) = 0.017 was considered significant difference.
3.3 |. Voxel-Wise Analyses of VDI Differences Between CADASIL Patients and HCs
Significantly reduced VDIs were found in CADASIL patients in multiple regions in the bilateral temporal lobe, thalamus, cingulate cortex, orbitofrontal cortex (OFC), rectus, parahippocampal gyrus/hippocampus, insula, red nucleus, and olfactory bulb. Significantly higher VDIs were found in several clusters in the WM, pallidum, and supplementary motor area in the CADASIL group compared to the control group. These clusters showing higher VDI in CADASIL patients are relatively small and are within the WM or next to the CSF (Figure 6, Table 2). Table 2 lists the peak MNI coordinates, brain regions, and size of the significant clusters.
FIGURE 6 |.
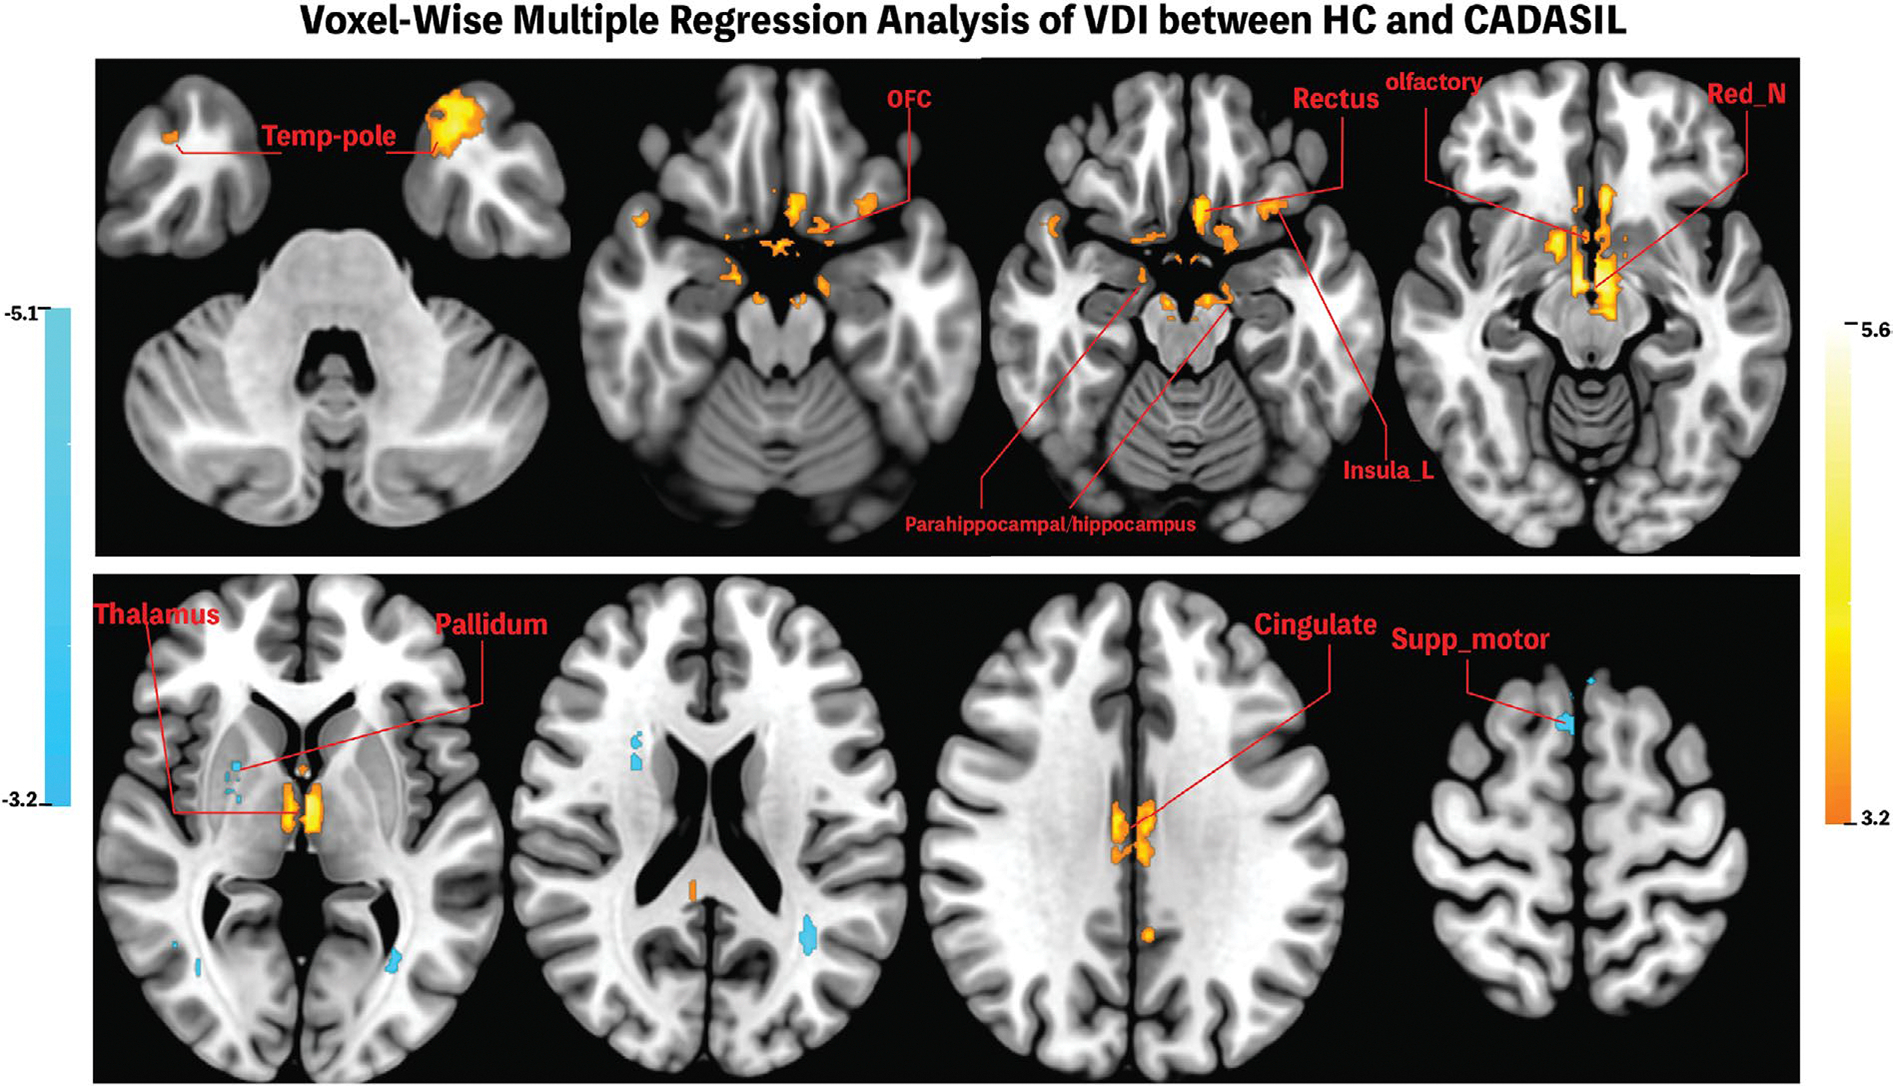
Significant Clusters identified in voxel-wise analyses of VDI between CADASIL and HC. CADASIL patients showed significantly reduced VDI in temporal pole, OFC, rectus, parahippocampal areas, insula, olfactory bulb, red nucleus, thalamus, and cingulate gyrus, whereas increased VDI was found in supplementary motor areas and white matter tracts. Clusters showing positive correlation were colored red to light yellow whereas clusters showing negative correlations were colored cyan. FDR-cluster corrected p < 0.001 was considered significant.
Regional VDIs in the three largest positive clusters detected in the above voxel-wise analysis, including the thalamus, cingulate gyrus, and temporal pole, were further extracted for additional analysis to test whether the previously observed trends in GM VDI persisted in specific brain areas. General trends that VDI is positively associated with MoCA while negatively associated with cSVD burden and WMH volume were observed in the three ROIs, although not reaching Bonferroni-corrected significance. Higher VDI in the temporal pole was associated with better cognitive performance (β = 4.65, SE = 1.56, 95% CI [1.39, 7.91]), while higher VDI in the thalamus (β = −0.82, SE = 0.34, 95% CI [−1.51, −0.13]), and temporal pole (β = −0.83, SE = 0.29, 95% CI [−1.42, −0.23]) were correlated with lower cSVD scores. Furthermore, higher VDI in the cingulate was associated with lower WMH volume (β = −0.016, SE = 0.006, 95% CI [−0.027, −0.004]).
3.4 |. Voxel-Wise Analyses of VDI Associations With Cognitive Performance, cSVD Burden, and WMH Volume in CADASIL Patients
Exploratory voxel-wise multiple regression analyses were carried out to further examine relationships of local VDI with MoCA, WMHv, and cSVD scores in CADASIL patients after controlling for the same covariates. Asymptomatic CADASIL patients showed higher VDI in the superior occipital gyrus, calcarine cortex, superior and inferior frontal gyrus, precentral and postcentral gyri compared to symptomatic CADASIL patients (Figure 7A and Table 3A). Furthermore, lower VDI in the temporal gyrus, middle cingulate, precuneus, and paracentral lobule (Figure 7B and Table 3B) was associated with higher WMH volume, whereas lower VDI in the fusiform, temporal pole, OFC, olfactory bulb, anterior cingulate, parahippocampal region, and hippocampus was associated with higher cSVD score in CADASIL patients (Figure 7C and Table 3C).
FIGURE 7 |.

Significant Clusters identified in voxel-wise analyses of VDI in CADASIL. (A) Significant clusters where asymptomatic CADASIL patients showing significant higher VDI compared to symptomatic patients including the calcarine, middle occipital gyrus, inferior frontal gyrus, precentral gyrus, and the superior frontal gyrus; (B) Significant clusters where lower VDI predicts higher global WMH lesions including the right temporal gyrus, cingulate, precuneus, right parietal gyri, and paracentral lobule; (C) Significant clusters where lower VDI predicts a higher overall SVD burden including the fusiform, temporal pole, parahippocampal area, inferior-frontal gyrus, NAcc, olfactory bulb, and the caudate. Clusters showing positive correlation were colored red to light yellow whereas clusters showing negative correlations were colored cyan. FDR-cluster corrected p < 0.001 was considered significant.
TABLE 3 |.
Anatomical regions for Voxel-Wise analysis of VDI with different measures.
| (A) Cognitive performances | |||||||
|---|---|---|---|---|---|---|---|
|
| |||||||
| Peak anatomical regions | Peak MNI coordinates | Statistics | |||||
|
|
|
|
|||||
| Hemisphere | Top regions by volume | X | Y | Z | T | p | Size (mL) |
|
| |||||||
| R | Inferior frontal gyrus | 36 | 2 | 28 | 5.4667 | < 0.001 | 0.704 |
| L | Superior occipital gyrus | −18 | −88 | 8 | 4.8805 | < 0.001 | 0.592 |
| R | Precentral/frontal gyrus | 20 | 0 | 46 | 4.6529 | < 0.001 | 0.584 |
| R | Calcarine cortex | 20 | −70 | 8 | 4.8323 | < 0.001 | 0.368 |
| L | Postcentral gyrus | −20 | −34 | 46 | 4.8643 | < 0.001 | 0.264 |
| R | Superior frontal gyrus | 20 | 44 | 28 | 4.7496 | < 0.001 | 0.224 |
|
| |||||||
| (B) WMHv | |||||||
|
| |||||||
| Peak anatomical regions | Peak MNI coordinates | Statistics | |||||
|
|
|
|
|||||
| Hemisphere | Top 3 regions by volume | X | Y | Z | T | p | Size (mL) |
|
| |||||||
| R | Precuneus/Parietal | 14 | −62 | 44 | −6.2547 | < 0.001 | 2.84 |
| R | Temporal gyrus | 40 | 2 | −36 | −6.1316 | < 0.001 | 0.904 |
| L | Paracentral lobe | −12 | −30 | 64 | −5.6503 | < 0.001 | 0.368 |
| L | Middle cingulate gyrus | −4 | −36 | 38 | −4.0582 | < 0.001 | 0.288 |
|
| |||||||
| (C) SVD score | |||||||
|
| |||||||
| Peak anatomical regions | Peak MNI coordinates | Statistics | |||||
|
|
|
|
|||||
| Hemisphere | Peak region | X | Y | Z | T | p | Size (mL) |
|
| |||||||
| L | Temporal Pole/Parahippocampal/Fusiform | −14 | 6 | 34 | −7.8457 | < 0.001 | 3.08 |
| R | Olfactory | 6 | 12 | −16 | −6.6986 | < 0.001 | 0.944 |
| R | Parahippocampal/Hippocampus | 16 | 10 | −32 | −6.0615 | < 0.001 | 0.848 |
| R | Temporal pole | 30 | 10 | −32 | −4.5536 | < 0.001 | 0.368 |
| R | OFC | 22 | 16 | −20 | −4.6845 | < 0.001 | 0.336 |
| L | Anterior cingulate | −6 | 10 | −8 | −4.4763 | < 0.001 | 0.32 |
4 |. Discussion
This study investigated changes in small blood vessel density in CADASIL patients using high-resolution black-blood MRI at 3T with a semi-automatic processing pipeline. Although whole brain VDI did not differ between CADASIL and HC, CADASIL patients showed a significant reduction in GM VDI, with a non-significant decrease in the temporal lobe and an increase in WM. VBM analyses ruled out brain atrophy as a confounding factor [24]. Furthermore, reduced GM VDI was associated with greater cSVD burden and poorer cognitive performance in CADASIL patients. Voxel-wise analyses further revealed a trend towards reduced VDI in several key cortical and subcortical regions, including the temporal pole, thalamus, and cingulate cortex. In addition, similar associations of reduced regional VDI with greater cSVD burden and poorer cognitive performance were observed in these regions in CADASIL patients.
Two previous studies have used 7T MRI to investigate the number of LSAs in CADASIL patients but reported conflicting results. Liem et al. found no change in the number or luminal size of LSAs [25]; whereas Ling et al. reported a significant reduction in LSA branches in CADASIL patients [6]. A recent study reported decreased retinal vascular density in CADASIL patients [26]. In addition, post-mortem studies have indicated that patients with CADASIL exhibit stenosis of the small arteries [27]. Overall, the findings of reduced GM VDI are consistent with reported reduced number and/or luminal size of small blood vessels in CADASIL patients. Compared to previous 7T MRI and post-mortem histological studies, the current technique offers the advantage of noninvasive in vivo assessment of VDI across the entire brain.
Reduced GM VDI was found significantly associated with higher total cSVD burden. Previous evidence showed that cerebrovascular dysfunction in addition to microcirculatory rarefaction is the earliest consequence of pathogenic mutant NOTCH3 expression [28]. These changes could lead to hypoperfusion and hemodynamic abnormalities, which result in brain lesions, including lacunar infarcts and WMH. Reduced VDI may reflect reduced brain perfusion and impaired vascular autoregulation; thus, it is associated with cSVD burden.
A positive association between GM VDI and MoCA score in CADASIL patients was also found. Poor cognitive performance has been consistently reported in CADASIL patients, which is associated with MRI markers of CADASIL, including WMHs, lacunar infarcts, and cerebral microbleeds (CMBs) [29, 30]. Compared to these conventional MRI markers of cSVD, black-blood MRA offers a direct, noninvasive measure of small vascular structures of the brain. These findings are especially valuable given the challenges of monitoring cSVD progression in its early stages, when conventional MRI findings may still be mild or nonspecific.
The significant clusters emerging from voxel-wise analyses are largely consistent with existing reports of functional and structural deficits in CADASIL patients [31–34]. Su et al. showed decreased local activity and functional connectivity of the posterior cingulate and parahippocampal gyrus in a resting-state functional MRI (f MRI) study, while damages of the WM tracts of the temporal pole have long been recognized as a specific biomarker for CADASIL and were reported to be associated with abnormal drainage of the interstitial fluid [31–33, 35]. Furthermore, significantly lower blood-oxygen-level dependent (BOLD) response during f MRI task was reported in the insula and thalamus in CADASIL patients, suggesting altered alerting network functions [36]. Such areas play pivotal roles in aspects of cognitive functions including emotion and memory and may underpin the observed associations between reduction in GM VDI and decreased cognitive performance. Moreover, it is worth noting that CADASIL patients included in this study were generally young and well-educated, with MoCA scores comparable to the controls, both of which have been reported to mitigate or delay the vasculopathy in CADASIL patients [37]. Significantly reduced small vessel density in the aforementioned areas of CADASIL patients may play roles in ensuing cognitive decline and disease progression, although future longitudinal studies are required.
Exploratory voxel-wise analyses were performed in CADASIL patients to investigate the associations of local VDI with cognitive performance, cSVD score, and white matter damages (WMHv). Reduced cerebral small vessel density was found in the superior occipital gyrus, calcarine cortex, superior and inferior frontal gyrus, precentral and postcentral gyri of symptomatic CADASIL patients compared to asymptomatic ones. The identified regions have long been recognized as crucial in sensorimotor integration, executive, and visuospatial functions, which are domains included in the MoCA exam [38–41]. Moreover, reduced VDI in the temporal gyrus, middle cingulate, precuneus, and paracentral lobule was found associated with more severe and diffusive WM lesions, which align with established CADASIL pathologies [31, 34, 42]. Corroborating previous reports, these results indicate that microvascular rarefaction within the identified regions likely contributes to the pathogenesis and progression of CADASIL, a hypothesis that warrants further detailed investigation [31–33, 35]. In the current study, significant alterations in the spatial distribution of cerebral small vessels were observed in CADASIL patients showing no apparent cognitive deficits on a group level, suggesting that the reduction in VDI could represent early manifestations of CADASIL pathology, which occurs prior to the emergence of more severe cognitive deficits [3, 43].
4.1 |. Limitation
This study has a relatively limited generalizability. The analyses were based on a relatively small cohort from a single clinical center with a 3T magnet from a single vendor. A few subjects were excluded due to wrap-around and/or severe motion artifacts, which degraded black-blood images. Given that the black-blood MRI is an emerging technique, the limitation underscores the difficulty in obtaining high-resolution, high-quality black-blood MRI with whole-brain coverage, especially in clinical populations prone to involuntary motion. Further studies may benefit from a larger dataset from multiple centers before broader conclusions could be drawn. Higher field strength (7T for example), acceleration factors with constrained reconstruction, and/or deep learning-based denoising and segmentation may improve the imaging speed and quality.
Increased VDI in the WM was also found, which contradicts previous reports suggesting degeneration of small vessels in the WM of CADASIL patients [44–46]. The current T1w TFL-VFA sequence utilizes the long echo-train for flow suppression of small blood vessels to enable the visualization of cerebral small vessels where blood flow is relatively slow [9]. Since CBF in GM is generally higher than that in the WM, better contrast between CSF and vessels can be achieved in the GM compared to the WM [47]. Based on previous observations, the PVS in the WM may also appear gray to dark on T1w black-blood MRI, which may confound the vessel segmentation in the WM. Furthermore, one previous study compared PVS on T2w MRI and LSAs on T1w black-blood MRI and found partial overlap between PVS and LSAs [9]. Enlarged PVS (ePVS) has been frequently reported in sporadic and hereditary cSVD as well as dementia, hypothesized to be associated with impaired fluid-drainage [48]. The close proximity of PVS and vascular structures in the WM presents a challenge for the segmentation of cerebral small blood vessels. Further technical development could involve utilizing delay alternating with nutation for tailored excitation (DANTE) technique or designing a better VFA scheme [49, 50]. Combining T1w and T2w or SWI images with black-blood MRI may help differentiate PVS from small blood vessels to understand their respective changes in cSVD [49, 50].
5 |. Conclusion
In conclusion, this is the first study that utilized a novel high-resolution black-blood MRI technique at 3T with a semi-automatic pipeline to characterize and quantify cerebral small blood vessel densities in patients with CADASIL, the most prevalent form of genetic cSVD. The results showed reduced GM VDI associated with poorer cognitive performance and greater cSVD severity in CADASIL patients, which are in accordance with previously reported changes in CBF and structural damage. This technique may be used for characterizing small blood vessel changes in a range of brain disorders.
Supplementary Material
Supporting Information
Additional supporting information can be found online in the Supporting Information section. Figure S1: Manual landmarking of positive (vessels, green) and negatives (CSF or nonvascular structures, red). Figure S2: ROC curves by varying NLM filter strength with fixed Jerman scale (S). Table S1: Parameter optimization results for image filtering. Table S2: Comparison between normalized VDI between CADASIL and Control Subjects. Table S3: Raw VDI (% brain volume) between CADASIL and Control Subjects. Table S4: Relevant Genetic Mutation of CADASIL Patient in Study Cohort.
Funding:
This work was supported by the US NIH Fundings (R01NS114382, S10OD032285, RF1AG084072), National Health Commission of the People’s Republic of China (2023ZD0504900, 2023ZD0504903), National Natural Science Foundation of China (82025018, 82402207).
References
- 1.Pantoni L, “Cerebral Small Vessel Disease: From Pathogenesis and Clinical Characteristics to Therapeutic Challenges,” Lancet Neurology 9, no. 7 (2010): 689–701, 10.1016/S1474-4422(10)70104-6. [DOI] [PubMed] [Google Scholar]
- 2.Shi Y and Wardlaw JM, “Update on Cerebral Small Vessel Disease: A Dynamic Whole-Brain Disease,” Stroke Vasc Neurol 1, no. 3 (2016): 83–92, 10.1136/svn-2016-000035. [DOI] [PMC free article] [PubMed] [Google Scholar]
- 3.Meschia JF, Worrall BB, Elahi FM, et al. , “Management of Inherited CNS Small Vessel Diseases: The CADASIL Example: A Scientific Statement From the American Heart Association,” Stroke 54, no. 10 (2023): e452–e464, 10.1161/STR.0000000000000444. [DOI] [PubMed] [Google Scholar]
- 4.Duering M, Biessels GJ, Brodtmann A, et al. , “Neuroimaging Standards for Research Into Small Vessel Disease—Advances Since 2013,” Lancet Neurology 22, no. 7 (2023): 602–618, 10.1016/S1474-4422(23)00131-X. [DOI] [PubMed] [Google Scholar]
- 5.Rajani RM, Ratelade J, Domenga-Denier V, et al. , “Blood Brain Barrier Leakage Is Not a Consistent Feature of White Matter Lesions in CADASIL,” Acta Neuropathologica Communications 7, no. 1 (2019): 187, 10.1186/s40478-019-0844-x. [DOI] [PMC free article] [PubMed] [Google Scholar]
- 6.Ling C, Fang X, Kong Q, et al. , “Lenticulostriate Arteries and Basal Ganglia Changes in Cerebral Autosomal Dominant Arteriopathy With Subcortical Infarcts and Leukoencephalopathy, a High-Field MRI Study,” Frontiers in Neurology 10 (2019): 870, 10.3389/fneur.2019.00870. [DOI] [PMC free article] [PubMed] [Google Scholar]
- 7.Cho ZH, Kang CK, Han JY, et al. , “Observation of the Lenticulostriate Arteries in the Human Brain in Vivo Using 7.0T MR Angiography,” Stroke 39, no. 5 (2008): 1604–1606, 10.1161/STROKEAHA.107.508002. [DOI] [PubMed] [Google Scholar]
- 8.Sarabi MS, Ma SJ, Jann K, Ringman JM, Wang DJJ, and Shi Y, “Vessel Density Mapping of Small Cerebral Vessels on 3D High Resolution Black Blood MRI,” NeuroImage 286 (2024): 120504, 10.1016/j.neuroimage.2023.120504. [DOI] [PMC free article] [PubMed] [Google Scholar]
- 9.Ma SJ, Sarabi MS, Yan L, et al. , “Characterization of Lenticulostriate Arteries With High Resolution Black-Blood T1-Weighted Turbo Spin Echo With Variable Flip Angles at 3 and 7 Tesla,” NeuroImage 199 (2019): 184–193, 10.1016/j.neuroimage.2019.05.065. [DOI] [PMC free article] [PubMed] [Google Scholar]
- 10.Dautzenberg G, Lijmer J, and Beekman A, “Diagnostic Accuracy of the Montreal Cognitive Assessment (MoCA) for Cognitive Screening in Old Age Psychiatry: Determining Cutoff Scores in Clinical Practice. Avoiding Spectrum Bias Caused by Healthy Controls,” International Journal of Geriatric Psychiatry 35, no. 3 (2020): 261–269, 10.1002/gps.5227. [DOI] [PMC free article] [PubMed] [Google Scholar]
- 11.Fazekas F, Chawluk J, Alavi A, Hurtig H, and Zimmerman R, “MR Signal Abnormalities at 1.5 T in Alzheimer’s Dementia and Normal Aging,” American Journal of Roentgenology 149 (1987): 351–356. [DOI] [PubMed] [Google Scholar]
- 12.Wardlaw JM, Smith EE, Biessels GJ, et al. , “Neuroimaging Standards for Research Into Small Vessel Disease and Its Contribution to Ageing and Neurodegeneration,” Lancet Neurology 12, no. 8 (2013): 822–838, 10.1016/S1474-4422(13)70124-8. [DOI] [PMC free article] [PubMed] [Google Scholar]
- 13.Egger C, Opfer R, Wang C, et al. , “MRI FLAIR Lesion Segmentation in Multiple Sclerosis: Does Automated Segmentation Hold Up With Manual Annotation?,” NeuroImage Clinical 13 (2017): 264–270, 10.1016/j.nicl.2016.11.020. [DOI] [PMC free article] [PubMed] [Google Scholar]
- 14.Staals J, Makin SDJ, Doubal FN, Dennis MS, and Wardlaw JM, “Stroke Subtype, Vascular Risk Factors, and Total MRI Brain Small-Vessel Disease Burden,” Neurology 83, no. 14 (2014): 1228–1234, 10.1212/WNL.0000000000000837. [DOI] [PMC free article] [PubMed] [Google Scholar]
- 15.Jiang Y, Wang Y, Yuan Z, et al. , “Total Cerebral Small Vessel Disease Burden Is Related to Worse Performance on the Mini-Mental State Examination and Incident Dementia: A Prospective 5-Year Follow-Up. Yu JT, Ed,” Journal of Alzheimer’s Disease 69, no. 1 (2019): 253–262, 10.3233/JAD-181135. [DOI] [PubMed] [Google Scholar]
- 16.Hoopes A, Mora JS, Dalca AV, Fischl B, and Hoffmann M, “SynthStrip: Skull-Stripping for any Brain Image,” NeuroImage 260 (2022): 119474, 10.1016/j.neuroimage.2022.119474. [DOI] [PMC free article] [PubMed] [Google Scholar]
- 17.Billot B, Greve DN, Puonti O, et al. , “SynthSeg: Segmentation of Brain MRI Scans of any Contrast and Resolution Without Retraining,” Medical Image Analysis 86 (2023): 102789, 10.1016/j.media.2023.102789. [DOI] [PMC free article] [PubMed] [Google Scholar]
- 18.Buades A, Coll B, and Morel JM, “Non-Local Means Denoising,” Image Process Line 1 (2011): 208–212, 10.5201/ipol.2011.bcm_nlm. [DOI] [Google Scholar]
- 19.Jerman T, Pernus F, Likar B, and Spiclin Z, “Enhancement of Vascular Structures in <?Pub _newline?> 3D and 2D Angiographic Images,” IEEE Transactions on Medical Imaging 35, no. 9 (2016): 2107–2118, 10.1109/TMI.2016.2550102. [DOI] [PubMed] [Google Scholar]
- 20.Avants B, Epstein C, Grossman M, and Gee J, “Symmetric Diffeomorphic Image Registration With Cross-Correlation: Evaluating Automated Labeling of Elderly and Neurodegenerative Brain,” Medical Image Analysis 12, no. 1 (2008): 26–41, 10.1016/j.media.2007.06.004. [DOI] [PMC free article] [PubMed] [Google Scholar]
- 21.Zhang Y, Brady M, and Smith S, “Segmentation of Brain MR Images Through a Hidden Markov Random Field Model and the Expectation–Maximization Algorithm,” IEEE Transactions on Medical Imaging 20, no. 1 (2001): 45–57, 10.1109/42.906424. [DOI] [PubMed] [Google Scholar]
- 22.Rolls ET, Huang CC, Lin CP, Feng J, and Joliot M, “Automated Anatomical Labelling Atlas 3,” NeuroImage 206 (2020): 116189, 10.1016/j.neuroimage.2019.116189. [DOI] [PubMed] [Google Scholar]
- 23.Fisch L, Winter NR, Goltermann J, et al. , “Deepmriprep: Voxel-Based Morphometry (VBM) Preprocessing via Deep Neural Networks,” (2024), 10.48550/arXiv.2408.10656. [DOI] [Google Scholar]
- 24.Peters N, Holtmannspötter M, Opherk C, et al. , “Brain Volume Changes in CADASIL: A Serial MRI Study in Pure Subcortical Ischemic Vascular Disease,” Neurology 66, no. 10 (2006): 1517–1522, 10.1212/01.wnl.0000216271.96364.50. [DOI] [PubMed] [Google Scholar]
- 25.Liem MK, Van Der Grond J, Versluis MJ, et al. , “Lenticulostriate Arterial Lumina Are Normal in Cerebral Autosomal-Dominant Arteriopathy With Subcortical Infarcts and Leukoencephalopathy: A High-Field in Vivo MRI Study,” Stroke 41, no. 12 (2010): 2812–2816, 10.1161/STROKEAHA.110.586883. [DOI] [PubMed] [Google Scholar]
- 26.Guo Y, Hao J, Zhu R, et al. , “Decreased Retinal Vascular Density Is Associated With Cognitive Impairment in CADASIL: An Optical Coherence Tomography Angiography Study,” Neurological Sciences 45, no. 7 (2024): 3267–3275, 10.1007/s10072-024-07390-2. [DOI] [PubMed] [Google Scholar]
- 27.Cotrutz CE, Indrei A, Dac C, et al. , “Electron Microscopy Analysis of Skin Biopsies in CADASIL Disease,” Romanian Journal of Morphology and Embryology 51, no. 3 (2010): 455–457. [PubMed] [Google Scholar]
- 28.Joutel A, Monet-Leprêtre M, Gosele C, et al. , “Cerebrovascular Dysfunction and Microcirculation Rarefaction Precede White Matter Lesions in a Mouse Genetic Model of Cerebral Ischemic Small Vessel Disease,” Journal of Clinical Investigation 120, no. 2 (2010): 433–445, 10.1172/JCI39733. [DOI] [PMC free article] [PubMed] [Google Scholar]
- 29.Taniguchi A, Shindo A, K. i. Tabei, et al. , “Imaging Characteristics for Predicting Cognitive Impairment in Patients With Cerebral Autosomal Dominant Arteriopathy With Subcortical Infarcts and Leukoencephalopathy,” Frontiers in Aging Neuroscience 14 (2022): 876437, 10.3389/fnagi.2022.876437. [DOI] [PMC free article] [PubMed] [Google Scholar]
- 30.Brookes RL, Hollocks MJ, Tan RYY, Morris RG, and Markus HS, “Brief Screening of Vascular Cognitive Impairment in Patients With Cerebral Autosomal-Dominant Arteriopathy With Subcortical Infarcts and Leukoencephalopathy Without Dementia,” Stroke 47, no. 10 (2016): 2482–2487, 10.1161/STROKEAHA.116.013761. [DOI] [PMC free article] [PubMed] [Google Scholar]
- 31.Yamamoto Y, Ihara M, Tham C, et al. , “Neuropathological Correlates of Temporal Pole White Matter Hyperintensities in CADASIL,” Stroke 40, no. 6 (2009): 2004–2011, 10.1161/STROKEAHA.108.528299. [DOI] [PMC free article] [PubMed] [Google Scholar]
- 32.Su J, Ban S, Wang M, et al. , “Reduced Resting-State Brain Functional Network Connectivity and Poor Regional Homogeneity in Patients With CADASIL,” Journal of Headache and Pain 20, no. 1 (2019): 103, 10.1186/s10194-019-1052-6. [DOI] [PMC free article] [PubMed] [Google Scholar]
- 33.O’Sullivan M, Jarosz JM, Martin RJ, Deasy N, Powell JF, and Markus HS, “MRI Hyperintensities of the Temporal Lobe and External Capsule in Patients With CADASIL,” Neurology 56, no. 5 (2001): 628–634, 10.1212/WNL.56.5.628. [DOI] [PubMed] [Google Scholar]
- 34.Li Y, Liu X, Jia X, Li H, Jia X, and Yang Q, “Structural and Functional Alterations in Cerebral Small Vessel Disease: An ALE-Based Meta-Analysis,” Cerebral Cortex 33, no. 9 (2023): 5484–5492, 10.1093/cercor/bhac435. [DOI] [PubMed] [Google Scholar]
- 35.Rolls ET, “The Cingulate Cortex and Limbic Systems for Emotion, Action, and Memory,” Brain Structure & Function 224, no. 9 (2019): 3001–3018, 10.1007/s00429-019-01945-2. [DOI] [PMC free article] [PubMed] [Google Scholar]
- 36.Gavazzi G, Orsolini S, Salvadori E, et al. , “Functional Magnetic Resonance Imaging of Inhibitory Control Reveals Decreased Blood Oxygen Level Dependent Effect in Cerebral Autosomal Dominant Arteriopathy With Subcortical Infarcts and Leukoencephalopathy,” Stroke 50, no. 1 (2019): 69–75, 10.1161/STROKEAHA.118.022923. [DOI] [PubMed] [Google Scholar]
- 37.Zieren N, Duering M, Peters N, et al. , “Education Modifies the Relation of Vascular Pathology to Cognitive Function: Cognitive Reserve in Cerebral Autosomal Dominant Arteriopathy With Subcortical Infarcts and Leukoencephalopathy,” Neurobiology of Aging 34, no. 2 (2013): 400–407, 10.1016/j.neurobiolaging.2012.04.019. [DOI] [PubMed] [Google Scholar]
- 38.Craggs LJL, Yamamoto Y, Ihara M, et al. , “White matter pathology and disconnection in the frontal lobe in cerebral autosomal dominant arteriopathy with subcortical infarcts and leukoencephalopathy (CADASIL),” Neuropathology and Applied Neurobiology 40, no. 5 (2014): 591–602, 10.1111/nan.12073. [DOI] [PMC free article] [PubMed] [Google Scholar]
- 39.Johns P, “Functional Neuroanatomy,” in Clinical Neuroscience (Elsevier, 2014), 27–47, 10.1016/B978-0-443-10,321-6.00003-5. [DOI] [Google Scholar]
- 40.Ban S, Wang H, Wang M, et al. , “Diffuse Tract Damage in CADASIL Is Correlated With Global Cognitive Impairment,” European Neurology 81, no. 5–6 (2019): 294–301, 10.1159/000501612. [DOI] [PubMed] [Google Scholar]
- 41.Nakaoku Y, Oishi N, Hase Y, et al. , “Montreal Cognitive Assessment Score Correlates With Regional Cerebral Blood Flow in Post-Stroke Patients,” Clinical Neurology and Neurosurgery 174 (2018): 68–74, 10.1016/j.clineuro.2018.09.004. [DOI] [PubMed] [Google Scholar]
- 42.Papma JM, Den Heijer T, De Koning I, et al. , “The Influence of Cerebral Small Vessel Disease on Default Mode Network Deactivation in Mild Cognitive Impairment,” NeuroImage Clinical 2 (2013): 33–42, 10.1016/j.nicl.2012.11.005. [DOI] [PMC free article] [PubMed] [Google Scholar]
- 43.Li Y, Ying Y, Yao T, et al. , “Decreased Water Exchange Rate Across Blood–Brain Barrier in Hereditary Cerebral Small Vessel Disease,” Brain 146, no. 7 (2023): 3079–3087, 10.1093/brain/awac500. [DOI] [PMC free article] [PubMed] [Google Scholar]
- 44.Pettersen JA, Keith J, Gao F, Spence JD, and Black SE, “CADASIL Accelerated by Acute Hypotension: Arterial and Venous Contribution to Leukoaraiosis,” Neurology 88, no. 11 (2017): 1077–1080, 10.1212/WNL.0000000000003717. [DOI] [PMC free article] [PubMed] [Google Scholar]
- 45.Craggs LJL, Yamamoto Y, Deramecourt V, and Kalaria RN, “Microvascular Pathology and Morphometrics of Sporadic and Hereditary Small Vessel Diseases of the Brain,” Brain Pathology 24, no. 5 (2014): 495–509, 10.1111/bpa.12177. [DOI] [PMC free article] [PubMed] [Google Scholar]
- 46.Van Den Brink H, Kopczak A, Arts T, et al. , “CADASIL Affects Multiple Aspects of Cerebral Small Vessel Function on 7T-MRI,” Annals of Neurology 93, no. 1 (2023): 29–39, 10.1002/ana.26527. [DOI] [PubMed] [Google Scholar]
- 47.Juttukonda MR, Li B, Almaktoum R, et al. , “Characterizing Cerebral Hemodynamics Across the Adult Lifespan With Arterial Spin Labeling MRI Data From the Human Connectome Project-Aging,” NeuroImage 230 (2021): 117807, 10.1016/j.neuroimage.2021.117807. [DOI] [PMC free article] [PubMed] [Google Scholar]
- 48.Barnes A and Ballerini L, “Topological Relationships Between Perivascular Spaces and Progression of White Matter Hyperintensities: A Pilot Study in a Sample of the Lothian Birth Cohort 1936,” Frontiers in Neurology 13 (2022): 889884. [DOI] [PMC free article] [PubMed] [Google Scholar]
- 49.Deistung A, Dittrich E, Sedlacik J, Rauscher A, and Reichenbach JR, “ToF-SWI: Simultaneous Time of Flight and Fully Flow Compensated Susceptibility Weighted Imaging,” Journal of Magnetic Resonance Imaging 29, no. 6 (2009): 1478–1484, 10.1002/jmri.21673. [DOI] [PubMed] [Google Scholar]
- 50.Mugler JP, “Optimized Three-Dimensional Fast-Spin-Echo MRI,” Journal of Magnetic Resonance Imaging 39, no. 4 (2014): 745–767, 10.1002/jmri.24542. [DOI] [PubMed] [Google Scholar]
Associated Data
This section collects any data citations, data availability statements, or supplementary materials included in this article.