

ABSTRACT
Locomotion is a vital motor function for any living being. In vertebrates, a basic locomotor pattern is controlled by the spinal locomotor network (SLN). Although SLN has been extensively studied, due to technical difficulties, most data were obtained during fictive locomotion, and data about the activity of spinal neurons during locomotion with intact sensory feedback from limbs are extremely limited. Here, we overcame the technical problems and recorded the activity of putative spinal interneurons from spinal segments L4–L6 during treadmill forward locomotion evoked by stimulation of the mesencephalic locomotor region in the decerebrate cat. We found that neurons were activated and inactivated preferably within one of the four phase ranges presumably related to preparation for the limb lift‐off, the limb lift‐off, transition from the limb flexion to limb extension during swing, and the limb touch‐down. We analyzed the activity phases of recorded interneurons by using a new method that took into account the previously ignored information about the stability of neuronal modulation in the sequential locomotor cycles. We suggested that neurons with stable modulation (i.e., small dispersion of their activity phase in sequential cycles) represent the core of SLN. Our analysis revealed groups of neurons active approximately out of phase and presumably contributing to the control of vertical (VC) and horizontal (HC) components of the step. We found that most VC‐ and HC‐related neurons were located in the intermediate and dorsal/ventral parts of the grey matter, respectively. Our experimental data can be used as a benchmark for computational models of locomotor neuronal networks.
Keywords: decerebrate cat, locomotion, mesencephalic locomotor region, neuronal network, spinal cord, spinal neurons
In decerebrate cat, activity of spinal interneurons during locomotor movements evoked by stimulation of the mesencephalic locomotor region was recorded. We found that neurons were activated and inactivated preferably within one of the four phase ranges (I–IV). By using a novel method of analysis of neuronal activity, we revealed groups of neurons active out of phase and presumably contributing to control upward (U), forward (F), downward (D), and backward (B) movement of the limb during the locomotor cycle.

Abbreviations
- CPG
central pattern generator
- HC
horizontal component of the step
- MLR
mesencephalic locomotor region
- SLN
spinal locomotor network
- VC
vertical component of the step
1. Introduction
For most legged vertebrates, forward locomotion represents the main form of progression, although they can also perform backward, sideways, and in‐place stepping. In all studied vertebrates, including humans, the basic pattern of stepping movements in any direction is generated by a neuronal network residing in the spinal cord (the spinal locomotor network, SLN). SLN includes a network capable of generating the basic locomotor pattern without the sensory feedback (Brown 1911) currently termed as “the central pattern generator,” CPG. However, normally, this basic pattern is substantially modified by the activity of the sensory neurons that constitute an important part of SLN (Rossignol et al. 2006). The descending commands from the brain turn SLN on and off, control the speed and gait of locomotion, and modify the basic pattern for steering, obstacle avoidance, and so forth (Orlovsky et al. 1999; Bouvier et al. 2015; Caggiano et al. 2018). Forward locomotion can be evoked, and its speed and gait can be controlled in the decerebrate preparation by stimulation of the mesencephalic locomotor region (MLR) of the brainstem (Shik et al. 1966; Shik and Orlovsky 1976). This experimental paradigm has been extensively used for investigation of SLN. The results of these experiments together with studies of the locomotor kinematics and the motor pattern in intact and spinal animals (Halbertsma 1983; Krouchev et al. 2006; Markin et al. 2012) have led to the development of computational models of SLN that include interneurons, motoneurons, limb dynamics, and sensory feedback (McCrea and Rybak 2008; Rybak et al. 2015; Shevtsova et al. 2015; Markin et al. 2016). However, due to technical difficulties related to the recording of spinal neurons during locomotor movements, the experimental data related to operation of SLN during “real locomotion” that is locomotion with close to normal sensory feedback are extremely limited (Orlovsky and Feldman 1972; Feldman and Orlovsky 1975). Also, spinal interneurons were recorded during forward air stepping, when the movement‐related sensory feedback was present but substantially different from the normal one (AuYong et al. 2011).
Most data related to the activity of spinal interneurons were obtained during fictive locomotion in immobilized animals or in in vitro newborn mice preparations. Thus, the activity of identified spinal interneurons (Renshaw cells and Ia interneurons) was recorded during fictive locomotion caused by stimulation of MLR (Noga et al. 1987; Pratt and Jordan 1987; Shefchyk et al. 1990). Since it was demonstrated that MLR is a center for the initiation of forward locomotion only (Musienko et al. 2012), most likely, these neurons were recorded during fictive forward locomotion. Also, the activity of non‐identified spinal interneurons was recorded during spontaneous episodes of fictive locomotion in paralyzed cats (Baev et al. 1979) and in anesthetized rabbits (Viala et al. 1991). In these studies, as well as in studies on in vitro preparations (Tresch and Kiehn 1999; Butt and Kiehn 2003; Dougherty and Kiehn 2010; Zhong et al. 2010, 2012), the neuronal activity was recorded along with the activity of motor nerves only to a pair of antagonistic muscles in each limb or ventral roots, and thus, it was impossible to determine if forward, backward, or in‐place fictive locomotion was generated. Our earlier results suggest that SLNs generating forward and backward stepping differ to some extent (Merkulyeva et al. 2018; Musienko et al. 2022). Thus, it is difficult to assess whether the models based on data obtained during fictive locomotion represent the operation of SLN during real forward locomotion.
The aim of the present study was to analyze the operation of SLN during real forward locomotion with normal sensory feedback from limbs. For this purpose, we recorded the activity of putative spinal interneurons during real locomotion evoked in decerebrate cats by MLR stimulation. We employed a new approach for the analysis of locomotion‐related activity of neurons. Our analysis allowed us to reveal four key ranges of the locomotor cycle where most of the neurons were activated and inactivated, to reveal functional groups of neurons presumably contributing to the control of vertical and horizontal components of the step, and to characterize their distribution in the spinal cord.
A brief account of this study was published in abstract form (Zelenin et al. 2019).
2. Materials and Methods
2.1. Animals
Experiments were carried out on five adult cats of either sex (weighing 2.5–4.0 kg). The same animals were used in our previous study (Musienko et al. 2020). All procedures were conducted in accordance with a protocol approved by the Animal Care Committee of the Pavlov Institute of Physiology, St. Petersburg, Russia (protocol #01a/2016), and followed the European Community Council Directive (2010/63EU) and the guidelines of the National Institute of Health Guide for the Care and Use of Laboratory Animals.
2.2. Surgical Procedures
The surgical procedures were the same as in our previous study (Musienko et al. 2020). The cats were deeply anesthetized with isoflurane (2%–4%) delivered in O2. The trachea was cannulated, and carotid arteries were ligated. The animals were decerebrated at the precollicular–postmammillar level. A laminectomy was performed in the lumbar area. Anesthesia was discontinued after the surgical procedures, and the experiments were started 2–3 h thereafter. During the experiment, the rectal temperature and mean blood pressure of the animal were continuously monitored and were kept at 37°C ± 0.5°C and > 80 mmHg.
2.3. Experimental Design
The experimental design (Figure 1A) was similar to that used in the previous study (Musienko et al. 2020). The head, the vertebral column, and the pelvis of the decerebrate cat were fixed in a rigid frame (Figure 1A). The forelimbs had no support, whereas the hindlimbs were positioned on a treadmill with two separate belts (left and right) moving backward in relation to the animal at the same speed (0.5 m/s) and below referred to as the “treadmill belt.” The distance between the treadmill belt and the fixed pelvis was 21–25 cm (depending on the animal's size), which determined a semi‐flexed limb configuration in the middle of stance typical for walking.
FIGURE 1.

Recording of the activity of spinal neurons during MLR‐evoked locomotion. (A) Experimental design. MLR‐stim, an electrode for stimulation of the mesencephalic locomotor region. MEA, a microelectrode array for recording neuronal activity. Limb‐L, a mechanical sensor recording anterior/posterior movements of the left hindlimb (a sensor recording the right hindlimb movements is not shown). FP, a force plate. (B–D) An example of 18 spinal neurons recorded simultaneously in L6 during locomotion. Red and green, neurons with stable and unstable modulation, respectively. Blue, non‐modulated neurons. (B) Locations of the neurons. (C) Superimposed spikes of individual neurons extracted from the mass activity. (D) Activity of individual neurons (##1–18) during locomotion recorded along with hindlimb movements (Limb‐R, Limb‐L) and contact forces (Force‐R, Force‐L). Swing phases of the left hindlimb are highlighted.
Locomotion was evoked by electrical stimulation of the mesencephalic locomotor region (MLR) (Shik et al. 1966; Shik and Orlovsky 1976; Jordan 1986; Garcia‐Rill and Skinner 1987a, 1987b). The stimulation started in 2–3 s after the onset of the treadmill belt motion. For MLR stimulation, a bipolar electrode (two 150‐μm wires isolated except for the tips and separated by 0.5 mm) was inserted into the brainstem area (Horsley‐Clarke coordinates P2, R/L4, H0) by means of a micromanipulator (MLR‐stim in Figure 1A). We used the following parameters of stimulation: frequency, 30 Hz; pulse duration, 0.5–1 ms; current, 50–200 μA.
We recorded the anterior–posterior locomotor limb movements by means of two mechanical sensors (one of which, Limb‐L, is shown in Figure 1A), as well as the vertical forces developed by each of the limbs by means of two force plates positioned under the left and right parts of the moving belt (FP in Figure 1A).
2.4. Electrophysiology
Neurons were recorded extracellularly by means of commercially available multichannel electrode arrays (MEA in Figure 1A). Each array consisted of a shaft with 32 Pt/Ir/Au electrode sites (A1x32‐10 mm‐50‐177; Neuronexus, Ann Arbor, MI). Each site's surface area was 177 μm2. Electrode sites were distributed 50 μm apart vertically; thus, the recording length of the array was approximately 1.5 mm, which allowed for simultaneous recordings of many individual neurons from different areas of the gray matter (Figure 1B). The array was mounted on a custom electrode holder driven by a manual micromanipulator. We attempted to systematically explore the whole cross‐section of the gray matter except for the motor nuclei areas. The activity of putative spinal interneurons during MLR‐evoked locomotion was recorded along with ground reaction forces and signals from mechanical sensors in ~20–60 locomotor cycles. Only episodes with stable, well‐coordinated locomotion (similar limb trajectories, stable forces, and the right and left hindlimbs stepping in antiphase) were analyzed. For all analyzed episodes, the relative variability (SD/mean) of the cycle duration was < 12%, the relative variability of the swing proportion was < 17%, the relative variability of the step length was < 20%, and the right and left hindlimb movements were close to anti‐phase (deviation of the inter‐limb phase shift from 0.5 was < 0.05).
To increase the stability of recording that is to prevent displacement of the nervous tissue in relation to the recording electrodes caused by movements (locomotor, breathing, etc.), the space between the dura mater and walls of the spinal canal was filled by tissue adhesive glue Indermil X Fine (Henkel Ireland Operations and Research Ltd, Dublin, Ireland) in the area of recording.
Signals from the electrode array (neuronal activity), from mechanical sensors and force plates, were amplified, digitized with a sampling frequency of 30 kHz (neurons) and 1 kHz (sensors), and recorded on a computer disk using a data acquisition and analysis system (Power1401/Spike2, Cambridge Electronic Design, Cambridge, UK). The multiunit spike trains recorded by each electrode were separated into unitary waveforms representing the activity of individual neurons using the spike‐sorting procedure in the same system. The spikes with the same waveform were supposedly generated by the same spinal neuron during locomotion (Figure 1C). Only neurons with a stable spike shape were used for analysis. Many neurons were recorded simultaneously by several neighboring sites, which increased the confidence of the spike sorting. An example of the activity of 18 neurons simultaneously recorded during locomotion, the waveforms of their spikes, and positions of the neurons on the cross‐section of the gray matter are shown, respectively, in Figure 1D,C,B. To exclude recording of the same neuron twice, the medio‐lateral distance between recording tracks was at least 0.2 mm (while the distance between recording sites that could pick up spikes of the same neuron was not more than 0.1 mm).
2.5. Analysis of Activity of Individual Neurons
Neurons with the mean firing frequency less than 1 Hz were considered inactive during locomotion (Table 1). The activity of neurons was typically modulated in the rhythm of stepping movements (Figure 1D). To characterize this modulation, the phase histogram of neuronal activity in a step cycle of the ipsilateral limb was generated. Because of some variability in the duration and structure of step cycles within a test and between tests in different animals, we used dual‐referent phase analysis (Berkowitz and Stein 1994); that is, we normalized swing and stance phase separately. Step cycle durations were normalized to unity. Swing and stance phases were normalized, respectively, to 0.38 and 0.62 parts of the locomotor cycle that represent proportions of swing and stance in the locomotor cycle averaged across all episodes of locomotion in all cats (for details, see Supporting Information, p. 3). Such normalization ensured that neuronal activity during a definite phase (swing or stance) during one walking episode was compared to activity during the same phase in the other episodes, or when these characteristics were compared in different steps within the same episode.
TABLE 1.
Descriptive statistics for the recorded population.
| Cat # | Spinal segment | Recorded neurons | Not active | Non‐modulated | Modulated neurons | Stable neurons |
|---|---|---|---|---|---|---|
| 1 | L4 | 91 (100%) | 2 (2%) | 11 (12%) | 78 (86%) | 48 (53%) |
| 2 | L4 | 9 (100%) | 0 | 1 (11%) | 8 (89%) | 7 (77%) |
| 3 | L4 | 28 (100%) | 1 (3%) | 3 (11%) | 24 (86%) | 15 (54%) |
| Total | L4 | 128 (100%) | 3 (2%) | 15 (12%) | 110 (86%) | 70 (55%) |
| 4 | L6 | 35 (100%) | 1 (3%) | 2 (6%) | 32 (91%) | 24 (69%) |
| 5 | L6 | 80 (100%) | 6 (7%) | 23 (29%) | 51 (64%) | 32 (40%) |
| Total | L6 | 115 (100%) | 7 (6%) | 25 (22%) | 83 (72%) | 56 (49%) |
| Total | L4 + L6 | 243 (100%) | 10 (4%) | 40 (17%) | 193 (79%) | 126 (52%) |
Note: Spinal segment, the segment in which neurons were recorded in a particular cat. The number of neurons as well as the percentage of neurons out of the entire population of neurons recorded in an individual cat, or in a segment, or of the entire population of recorded neurons, are indicated in parentheses.
Typically, neurons discharged only during a part of the step cycle, producing one burst of activity. Some neurons had their bursts on top of the background tonic activity. To estimate the onset and offset phases of the neuron's burst in the step cycle, the spike time sequence during one step (Figure 2A) was converted to the instantaneous rate versus time (Figure 2B) and then to instantaneous rate versus phase (1000 data points per normalized cycle; Figure 2C). The resulting curve was approximated with the best two‐level rectangular fit (shown by red lines in Figure 2C; Zelenin et al. 2011). This fit provided the burst onset phase and offset phase expressed as a proportion of the normalized cycle (Figure 2C; for details, see Supporting Information, p. 4). The phases (Figure 2D) were averaged across all step cycles using the circular statistics methods (Batschelet 1981), providing the mean onset and offset phases, as well as the corresponding standard deviations, characterizing stability/variability of the phases (Figure 2E; for details, see Supporting Information, p. 5).
FIGURE 2.

Analysis of the activity of spinal neurons during MLR‐evoked locomotion. (A–E) An example of analysis of activity (neuron #4 from Figure 1B–D). For each individual step, a spike raster aligned at the swing start (A), the instantaneous firing rate versus time (B), the rate versus phase with dual‐reference phase normalization (C), and the burst phase (D) were determined. Burst phases in individual steps were used to calculate the average and SD for burst onset and offset phases (E).
We supposed that neurons with a stable phase of activity have a larger contribution to the control of locomotor movements. The stability of the phase is characterized by its SD: The smaller SD reflects the higher stability. We proposed one novelty in the analysis: assigning more weight to the data with lower variability (smaller SD). With this purpose, we converted SDs into “weights” by using a formula: w = 10/(1 + 900SD2) (for details, see Supporting Information, p. 6). Thus, neurons with higher variability (i.e., neurons with unstable activity and therefore larger SD) had a lower weight of their phase, and vice versa. To take into account both the onset stability and the offset stability of a neuron, we calculated the integral stability of the activity phase of the neuron during locomotion (W): W = (w on)2 + (w off)2, where w on, w off were the weights of the onset and offset phases, respectively.
Averaging of the instantaneous rate versus phase across all recorded steps produced the mean phase profile of the neuron's activity. A neuron was considered modulated if the activity profiles in individual steps were similar to the average profile (the Pearson's correlation coefficient was higher than 0.3 in more than 60% of the locomotor cycles). The other neurons, with more random bursts of activity, were considered non‐modulated (Table 1; blue neurons in Figure 1B–D).
Modulated neurons were further classified into two subpopulations: with stable modulation and with unstable modulation. We used two criteria for the stability of modulation of the neuron. (i) SD of the burst onset and/or burst offset had to be not more than 0.1 part of the locomotor cycle. We accepted the stability of only one edge of the burst since some of the recorded neurons had a ramp‐up or ramp‐down burst shape with stable burst offset and burst onset phase, respectively. (ii) The average coefficient of correlation between the profiles of the activity in individual locomotor cycles and in the entire activity histogram should not be less than 0.6. Modulation was considered stable if both criteria were satisfied. Examples of neurons with stable and unstable modulation (their locations, spike shapes, and activity) are shown in Figure 1B–D (red and green, respectively).
It should be noted that we analyzed the activity of neurons in relation to the locomotor cycle of the ipsilateral limb. However, we cannot exclude that some of the recorded neurons were commissural interneurons contributing to the control of the contralateral limb.
2.6. Analysis of Population Distribution of Burst Onset and Offset Phases
The population distribution of any measurable parameter (e.g., the burst offset phase measured in a set of neurons) is traditionally presented with a distribution histogram. We proposed a modified presentation that took into account not only the measured values but also the precision of these measurements. Specifically, each phase φ i measured with a precision SD i was presented with the probability density p i (φ): a Gaussian distribution with the mean value equal to φ i and the standard deviation equal to SD i . The average of such distributions across the entire population of neurons provided the probability density to observe a particular value of the measured parameter. Besides taking into account the precision of measurements, this procedure also smoothens the resulting curves. Analogous to the described above probability distribution of onset/offset phases, the weighted probability distribution of onset/offset phases was calculated. With this purpose, the weighted averaging was applied to the distributions for individual neurons: Σ (w i p i (φ))/Σw i where w i was the weight function described in Section 2.5. For details of these procedures, see Supporting Information, p. 7.
2.7. Cluster Analysis
To reveal groups of neurons with similar activity phases, we used a modified version of the “nearest neighbor” method of cluster analysis similar to the method used by Krouchev et al. (2006). For each neuron, its activity phases were presented as a scatterplot in which the burst offset phase of a given neuron was plotted versus its burst onset phase (Krouchev et al. 2006) together with the onset and offset weights (Figure S2A).
We did not specify the number of clusters a priori. The clustering procedure consisted of three stages: (i) ranking neurons according to the stability of their activity, (ii) primary clustering (“seeding”) that produced an initial set of “raw” clusters, and (iii) “refining” of the “raw” clusters.
First, we ranked all neurons according to the integral stability of the activity phase of the neuron during locomotion (W, described in Section 2.5). Then, for primary clustering, the point in the scatterplot corresponding to the first neuron in the ranked list (characterizing the onset and offset of the neuron's burst) was considered as the first cluster. Then points of other neurons were one by one compared with already existing clusters. Closeness or remoteness of a point from the centers of the existing clusters was characterized by two parameters: Euclidian distance (D) and Z‐distance (Z). If at least one of these distances exceeded the threshold level (D > 0.15 or Z > 3) the point gave rise to a new cluster. If the point was close to one or several clusters (D < 0.15 and Z < 3), it was merged with the cluster for which D was minimal. For this expanded cluster, its center was re‐calculated. The center of the cluster—that is the average onset and offset phases for neurons composing the cluster—was calculated by using the weighted average for a phase of the onset (Φ on ) or offset (Φ off ): Φ = Σ(w i φ i )/Σw i , while the corresponding standard deviations were calculated with a formula: SD = Σ(w i SD i )/Σw i .
The set of clusters obtained during the primary (“seeding”) clustering was used to re‐sort the points with a “refining” procedure, similar to “seeding” but by using stricter similarity/closeness criteria: The point was considered far from the center of the cluster if D > 0.1 or Z > 3. In such a case, it was considered “assorted” (added to cluster 0). If the point was close to one or several clusters (D < 0.1 and Z < 3), it was merged with the cluster for which D was minimal. This resorting was repeatedly applied to the entire ranked list of neurons until convergence to the final set of Clusters. In addition, for each cluster, the midburst phase Φ mid was calculated as Φ mid = (Φ on + Φ off )/2.
Detailed description of the clustering analysis is presented in Supporting Information (pp. 8, 9) and Figures S2 and S3.
2.8. Statistical Analyses
All quantitative data in this study are presented as mean ± SD. To evaluate the statistical significance of the difference in percentages of different Clusters of modulated neurons recorded in L4 and in L6, we used Fisher's exact test; the significance level was set at p = 0.05.
2.9. Histological Procedures
At termination of the experiments, cats were deeply anesthetized with isoflurane (5%) and then perfused with isotonic saline, followed by a 10% formalin solution. Frozen spinal cord sections of 50‐μm thickness were cut in the regions of recording. The tissue was stained for Nissl substance with cresyl violet. The positions of the array in the spinal cord were verified by observation of the array track. Positions of recording sites were estimated in relation to the array track position.
3. Results
3.1. Neuronal Database
Altogether, the activity of 243 individual spinal neurons was extracted from the multiunit spike trains recorded in five decerebrate cats during treadmill forward walking evoked by MLR stimulation, including 128 neurons recorded in L4 and 115 neurons—in L6 (Table 1). Of these, few (4%) neurons were “inactive” (i.e., they had the mean cycle frequency of less than 1 Hz), and 17% were active but non‐modulated (see criteria for modulation in Section 2.5).
The majority of active neurons (~86% from L4 and ~72% from L6) were modulated in the rhythm of stepping movements (Table 1 and Figure 1D [red and green neurons]) suggesting that they contribute to control of forward walking. Only these 193 modulated neurons were used for further analysis. Phase of bursts of individual modulated neurons recorded in L4 and L6 segments in the normalized locomotor cycle is shown in Figure 3. The neurons were ranked according to the value of the parameter “integral stability of the activity phase” during locomotion (W; see Section 2.5). One can see that neurons with high values of W (with small SD of the burst onset and/or burst offset) located in the upper part of L4 and L6 neurons as well as neurons with low values of W (with large SD of the burst onset and burst offset) located in the lower part of L4 and L6 neurons had various phases of activity in the locomotor cycle.
FIGURE 3.
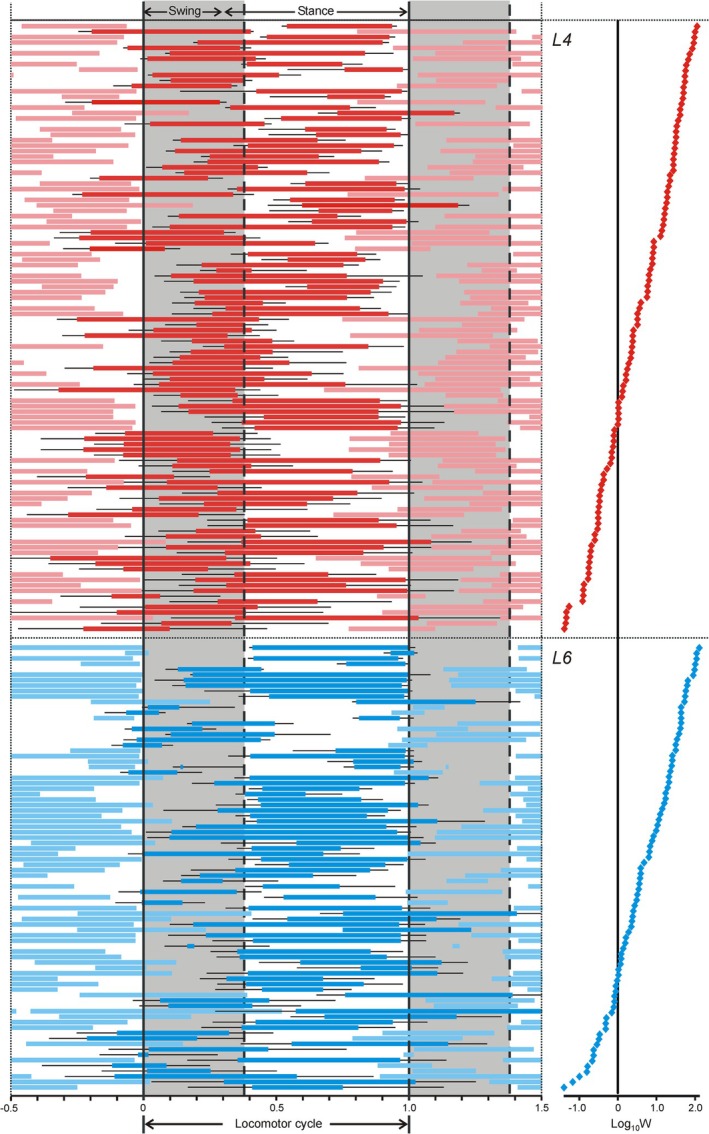
Phase distribution of bursts of individual neurons recorded in L4 and L6 segments in the normalized locomotor cycle. Neurons recorded in each segment are ranked according to the value of their parameter W (integral stability of the activity phase) shown on the right panel in logarithmic scale. Bursts of individual neurons recorded in L4 and L6 are indicated by thick red and blue lines, respectively. Activity of the same neurons in the preceding and the following cycles is indicated by the corresponding pale colors. Thin black lines indicate standard deviations of the burst onset and offset phases.
3.2. Distribution of Burst Onset and Offset Phases Across the Locomotor Cycle
One can expect that phases of the locomotor cycle at which the burst onsets and burst offsets occur more frequently represent the most critical/important phases for generation of the locomotor pattern (Orlovsky and Feldman 1972). To reveal these key phases, the measured mean burst onset and burst offset phases of individual modulated neurons were used to calculate the probability densities (see Section 2.6) of the burst onsets (Figure 4A) and burst offsets (Figure 4B) phases. The values of probability density above its average level in the locomotor cycle (indicated by horizontal dotted lines in Figure 4A,B) formed peaks. Some of them were large and exceeded double the average value (indicated by horizontal dashed lines in Figure 4A,B), while others did not reach it. Peaks of the burst onsets (Figure 4A) fell into four phase ranges (I–IV), while peaks for the offset probability (Figure 4B) fell into three phase ranges (I, II, and IV). These results are qualitatively similar to lower precision results of previous studies (Orlovsky and Feldman 1972).
FIGURE 4.

Important phases of the locomotor cycle. (A–D) Distributions of phase probability density (A, B) and phase weighted probability density (C, D) for the burst onsets (A, C) and offsets (B, D) for all (L4 + L6) neurons. (E, F) Phases of peaks (parts of the curve above the average level indicated by dotted line in A–D) and major peaks (above the doubled average level indicated by dashed line in A–D) of probability (E) and weighted probability (F) distributions are shown separately for L4 and L6 neurons. Thin and thick lines and small and large diamonds indicate peaks and major peaks and the peak tops, respectively. Only significant peaks were taken into account: If a peak would disappear after the exclusion of one neuron with w = 1, this peak was considered not significant. Additionally, two neighboring peaks were fused into one if they were separated by an insignificant trough that would disappear after the addition of one neuron with w = 1. Practically all peaks fell into four phase ranges I–IV (indicated by yellow in E, F).
The observed complex patterns of peaks can be explained either by the real presence of many important phases in the locomotor cycle or by data noise. To reduce the noise, we examined the weighted phase distributions (see Section 2.6), assigning larger weight to edges with lower SD. Thus, the weight of 1 was assigned to edges with SD = 0.1, which, on one hand, was the median value of both the onset and offset phases in our database and, on the other hand, constituted a rather small part of the locomotor cycle (approximately one quarter of the swing or one sixth of the stance). The weight was higher than 9 (although never higher than 10) for edges with SD ≤ 0.01, which is a negligibly small variance, comparable to the instrument error in our experiments. Finally, the weight was lower than 0.3 (though always positive) for edges with SD ≥ 0.2, which is a rather large variance (e.g., larger than a half of the swing).
In such weighted distribution, data from approximately 30% of the entire population (neurons with large SD, which most likely were not critical for the locomotor pattern generation) were effectively filtered out. On the other hand, data from approximately 20% of the population (neurons with small SD, most likely, comprising the core of SLN) contributed more to the result. The weighted distribution (Figure 4C,D) had the same peak locations as the probability distribution (Figure 4A,B), but the peaks were much clearer. Thus, the fuzziness of the original edge distribution was most likely due to random data noise from neurons with unstable modulation (large SD).
In both L4 neurons and L6 neurons, most of the observed peaks of the onsets and offsets fell into the same four phase ranges (I–IV) (Figure 4E,F): range I with phases close to 0.8 part of the locomotor cycle, range II with phases close to 0 (beginning of the cycle), range III with phases close to 0.15 part of the cycle, and range IV with phases close to 0.4 part of the cycle. Thus, neurons were activated and inactivated not randomly in the locomotor cycle, but preferably within one of the four phase ranges. These four ranges were presumably related to discrete behavioral events: preparation for the limb lift‐off (range I), the limb lift‐off (range II), transition from the limb flexion to limb extension during swing (range III), and the limb touch‐down (range IV).
3.3. Classification of Neurons Based on Their Burst Phases
To reveal groups of neurons with similar phase of activity modulation in the locomotor cycle, we considered only neurons with stable modulation that are most likely to strongly contribute to the control of locomotion. The following criteria for stability of modulation formulated in our previous study (Musienko et al. 2022) were used: (i) SD of the burst onset and/or burst offset should not be more than 0.1 part of the locomotor cycle. We accepted stability of only one edge of the burst, as a subset of the recorded neurons had ramp‐up or ramp‐down burst shapes with stable burst offset and burst onset phase, respectively. (ii) The average coefficient of correlation between the profiles of the activity in individual locomotor cycles and in the entire activity histogram had to be no less than 0.6. According to these criteria, 126 out of 193 modulated neurons (65%) had stable modulation (“stable neurons,” Table 1). To the population of stable neurons, we applied a novel method of clustering that relies more on data with higher values of the phase weight (see Section 2.7). As a result, activities of almost all stable neurons (91%, 115 out of 126 stable neurons) were classified into 19 Clusters (Table 2 and Figures 5 and S2A). In 11 neurons, activity phases were unique. We termed them “Cluster 0” and did not consider them in the further analysis.
TABLE 2.
Rostro‐caudal distribution of neurons belonging to different Clusters.
| Cluster # | L4 (n) | L6 (n) | p |
|---|---|---|---|
| 1 | 3 | 7 | 0.19 |
| 2 | 4 | 2 | 0.69 |
| 3 | 0 | 3 | 0.09 |
| 4 | 2 | 6 | 0.14 |
| 5 | 6 | 1 | 0.23 |
| 6 | 6 | 2 | 0.47 |
| 7 | 5 | 0 | 0.07 |
| 8 | 0 | 5 | 0.02 |
| 9 | 6 | 6 | 0.77 |
| 10 | 4 | 2 | 0.69 |
| 11 | 2 | 1 | 0.99 |
| 12 | 7 | 0 | 0.02 |
| 13 | 0 | 4 | 0.04 |
| 14 | 6 | 3 | 0.73 |
| 15 | 5 | 1 | 0.23 |
| 16 | 2 | 2 | 0.99 |
| 17 | 5 | 1 | 0.23 |
| 18 | 2 | 1 | 0.99 |
| 19 | 0 | 3 | 0.09 |
| 0 | 5 | 6 | 0.54 |
| Total | 70 | 56 |
Note: Rostro‐caudal distribution of neurons belonging to different Clusters as well as assorted neurons (Cluster 0) was compared to that of the entire recorded population using Fisher's exact test (df = 1). Statistically significant (with p < 0.05) and visible but statistically insignificant (with 0.05 < p < 0.3, due to low numbers of neurons) biases in the neurons' location are indicated, respectively, by bold and underlined p values.
Abbreviation: n, number of neurons.
FIGURE 5.

Phase distribution of sorted into Clusters bursts of individual neurons with stable modulation recorded in L4 and L6 segments in the normalized locomotor cycle. The mean bursts of individual Clusters with the middle point indicated (white circles) are shown by thick purple lines. Neurons of different Clusters are demarcated by dotted lines. Clusters are ordered according to the midburst phase. Numbers in circles on the left are Cluster numbers. Four phase ranges I–IV are indicated by yellow. Other abbreviations as in Figure 3.
Since the neurons within each Cluster had similar activity phases, in the further analysis, we considered each Cluster as a functionally homogeneous set of neurons. For each Cluster, the phase of activity of the Cluster was characterized by weighted average phases of the burst onsets and offsets of neurons comprising the Cluster with the corresponding SDs (see Section 2.7). The interval between these average phases was termed the “burst” of the Cluster (thick purple lines in Figure 5). As seen in Figure 5, the majority of Clusters had the burst onset in one phase of the locomotor cycle (swing or stance) and the burst offset in another phase. Only two Clusters (2 and 12) had bursts within the stance and no one within the swing.
3.4. Functional Classification of Clusters
In different SLN models (Ijspeert 2008), the locomotor rhythm is generated by neuronal classes with reciprocal inhibition, which are active out of phase. To reveal such pairs of Clusters active out of phase, for each Cluster, we calculated its midburst phase (see Section 2.7; white circles on thick purple lines in Figure 5). Then, for each pair of Clusters, we calculated the phase shifts between their midburst phases (see Section 2.7 as well as Supporting Information, pp. 10–11, for specific details). Figure 6A shows the heatmap of the phase shift between midbursts in different Cluster pairs. All Clusters can be combined into four pairs of Groups active approximately out of phase (the corresponding phase shifts outlined by 4 dashed rectangles in Figure 6A): Group 1 (Clusters 10, 13, and 17) is out of phase with Group 2 (Clusters 16, 6, 8, and 9), Group 3 (Clusters 11 and 5) – with Group 4 (Clusters 1 and 2), Group 5 (Clusters 14 and 18) – with Group 6 (Clusters 12 and 19), and Group 7 (Clusters 15 and 7) – with Group 8 (Clusters 4 and 3).
FIGURE 6.

Functional classification of Clusters. (A) Heatmap of the phase shift between midbursts of different Cluster pairs. All Clusters can be combined into four pairs of Groups active approximately out of phase (with phase shifts close to 0.5, outlined by four dashed rectangles): Gr1/Gr2, Gr3/Gr4, Gr5/Gr6, and Gr7/Gr8. (B) The paw trajectory during the locomotor cycle. Green, red, yellow, and blue parts of the trajectory are, respectively, forward (F), backward (B), upward (U), and downward (D) limb movements. (C) Groups are formed by Clusters with similar midburst phases (each color band corresponds to one Group). These Groups can be assigned to the horizontal (HC) or vertical (VC) components of the step (see explanations in the text and Figure S7). Green and red stars show the middle of the swing and stance, respectively.
Clusters constituting one Group had similar midburst phases (Figure 6C). Phase ranges of midbursts of Clusters forming individual Groups (indicated by colored bands in Figure 6C) were shifted in relation to one another by approximately 1/8 of the locomotor cycle. To assign functional roles to the Groups, one can take into account the paw trajectory during the locomotor cycle (Figures 6B and S7). It can be divided into forward (the green part of the trajectory, F) and backward (the red part of the trajectory, B) movements corresponding to the horizontal component of the step (HC) or into two parts corresponding to the vertical component of the step (VC) that includes the movements of the limb when it is subjected to unloading and upward transition (the yellow part of the trajectory, U) and to downward transition and loading (the blue part of the trajectory, D), respectively. Phases of HC and VC are shifted by approximately 1/4 of a cycle (Figures 6B and S7). The existence of separate neural mechanisms generating VC and HC of the step was demonstrated earlier (Musienko et al. 2012). Thus, Groups 3 and 4, with activity phase ranges close to the middle of the swing and to the middle of stance, respectively, can be responsible for execution of the forward and backward paw movements, respectively (Figure 6C). Group 7, with its activity following Group 3 by 1/4 and leading Group 4 by 1/4, executed the downward movement (limb extension during the swing second half, touchdown, and weight support during the stance first half), while Group 8 executed the upward movement (limb unloading during the stance second half, lift‐off, and limb flexion during the swing first half) (Figure 6C). The remaining Groups 1, 2, 5, and 6, leading the corresponding Groups 3, 4, 7, and 8 by 1/8 of the locomotor cycle (Figure 6C), can be assigned preparatory roles for the forward, downward, backward, and upward movements, respectively. Thus, one can assume that Groups 1–4 and Groups 5–8 contribute to control of the HC and VC of the step, respectively (Figure 6C).
Although in general, neurons forming different Clusters were intermingled in the gray matter, we found some specificity in their spatial distribution. Thus, neurons of Clusters 7 and 12 were found only in the spinal segment L4, while neurons of Clusters 3, 8, 13, and 19 were found only in L6 (Figures 7 and 5 and Table 2). In both L4 and L6, the majority of neurons contributing to control of the VC of the step (Groups 5–8) were located in the intermediate zone of the gray matter, while the majority of neurons contributing to control of the HC network (Groups 1–4) were located in the dorsal and ventral zones (Figure 7 and Table 3). In both segments, these differences in distribution of VC‐ and HC‐related neurons were statistically significant (Table 4).
FIGURE 7.

Location of individual neurons of different Clusters in the spinal cord. VC network neurons and HC network neurons are shown separately on cross‐sections of the gray matter at spinal segments L4 and L6. Thick hatched lines demarcate the dorsal, intermediate, and ventral zones of the gray matter. Designations (shapes and colors) are as in Figure 6C.
TABLE 3.
Rostro‐caudal and dorso‐ventral distribution of neurons comprising networks generating the vertical and horizontal components of stepping.
| Circuit | Spinal segment | Zone 1 (n) | Zone 3 (n) | Zones 1 + 3 (n) | Zone 2 (n) |
|---|---|---|---|---|---|
| VC | L4 | 2 | 7 | 9 | 18 |
| HC | L4 | 6 | 22 | 28 | 10 |
| Total | L4 | 8 | 29 | 37 | 28 |
| VC | L6 | 2 | 1 | 3 | 14 |
| HC | L6 | 13 | 15 | 28 | 5 |
| Total | L6 | 15 | 16 | 31 | 19 |
| VC | L4 + L6 | 4 | 8 | 12 | 32 |
| HC | L4 + L6 | 19 | 37 | 56 | 15 |
| Total | L4 + L6 | 23 | 45 | 68 | 47 |
Note: VC and HC, networks generating, respectively, the vertical and horizontal components of stepping. The number of neurons (n) in each of three zones of the gray matter (dorsal, Zone 1; intermediate, Zone 2; ventral, Zone 3; Figure 7) is indicated. Numbers shown in bold are statistically compared in Table 4.
TABLE 4.
Statistical comparison of the distribution of VC and HC neurons across the transverse section of the gray matter.
| Comparison | Spinal segment | p |
|---|---|---|
| VC vs. HC | L4 | 0.002 |
| VC vs. HC | L6 | 0.0001 |
| VC vs. HC | L4 + L6 | 0.0001 |
Note: The relative number of neurons in Zone 2 and Zones 1 + 3 (see Table 3) were statistically compared using Fisher's exact test (df = 1). Values of p < 0.05 (statistically significant bias in the neurons' location) are indicated by bold.
4. Discussion
4.1. Neurons Comprising the Spinal Locomotor Network (SLN)
In the present study, we analyzed the spinal locomotor network (SLN) controlling real forward locomotion with close to normal movement‐related sensory feedback. Spinal interneurons form the core of this network. It should be noted that we discriminate between SLN and the central pattern generator (CPG, the part of the spinal network capable of generating the locomotor pattern without sensory feedback). SLN includes CPG but is not limited to CPG and also includes neurons modulated by sensory feedback.
There is some discrepancy in the results of the recording of spinal interneurons with activity modulated in the locomotor rhythm. Studies in which spinal interneurons were recorded during forward locomotor movements (e.g., earlier studies in which a small database was obtained during real forward locomotion in cats with intact sensory feedback and after deafferentation, Orlovsky and Feldman 1972, studies on spinal cats performing forward air‐stepping, AuYong et al. 2011, as well as the present study) demonstrated rather uniform distribution of phases of interneuronal activity across the locomotor cycle. By contrast, recording of spinal interneurons during spontaneous episodes of fictive locomotion in rabbits (Viala et al. 1991) and cats (Baev et al. 1979) revealed two clusters of neurons with activity phases almost coincident with either flexor or extensor motoneuronal activity. Unfortunately, in the last two studies, only motor nerves to flexor and extensor muscles of the ankle joint were recorded, which did not allow us to determine the type of the generated locomotor pattern (i.e., whether the motor pattern corresponded to forward stepping, backward stepping, or in place stepping). One of the possible explanations for the discrepancy between the data obtained in these studies during fictive locomotion and forward locomotion with intact movement‐related sensory feedback is that in immobilized animals, neurons were recorded during in‐place locomotion characterized by simple reciprocal activity of flexor and extensor muscles around all joints of the limb (Lyakhovetskii et al. 2021). Earlier, we demonstrated that spinal networks generating forward and backward stepping differ to some extent (Merkulyeva et al. 2018; Musienko et al. 2022). Studies in which non‐identified as well as molecularly identified spinal interneurons were recorded in in vitro preparations of neonatal mice during pharmacologically evoked locomotor‐like activity demonstrated different phases of interneuronal activity across the locomotor cycle (Tresch and Kiehn 1999; Butt and Kiehn 2003; Dougherty and Kiehn 2010; Zhong et al. 2010, 2012). However, since only one or two ventral roots containing predominantly axons of flexor or extensor motoneurons were recorded in these studies, it is unknown to which type of locomotion (forward, backward, or in‐place) this locomotor‐like activity was related.
In our study, we focused on interneurons with stable modulation of activity that most likely represent the essential elements of SLN. We excluded neurons with sparse firing from our analysis. It has been suggested that such neurons may play an important role in the rhythm generation (Strohmer et al. 2024). Unfortunately, adequate analysis of sparse activity would require recording of much longer episodes than those used in the present study. This can be a goal of future studies.
Since spinal interneurons were recorded during real forward locomotion in the presence of normal movement‐related sensory feedback, we cannot exclude that locomotion‐related modulation of activity in a part of these neurons was driven by the sensory feedback. There are numerous findings (e.g., Grillner and Rossignol 1978; Whelan et al. 1995; Hiebert et al. 1996) strongly suggesting that in real stepping, the timing of different events in the step cycle is determined not by CPG activity (Orlovsky et al. 1999) but rather by afferent signals about the limb movement. Thus, sensory‐driven neurons represent an important part of SLN controlling forward locomotor movements. However, the majority of interneurons recorded in our study were similar to those revealed during locomotion in deafferented cats (Orlovsky and Feldman 1972; Dai et al. 2005) in terms of location (the ventral and intermediate zones of the gray matter, Figure 7) and in terms of the distribution of the activity phases across the locomotor cycle. Therefore, one can suppose that a substantial part of our SLN neurons belonged to CPG.
We correlated the activity of recorded neurons with the locomotor cycle of the ipsilateral limb. We cannot exclude that a part of the recorded neurons were commissural interneurons involved in the control of the contralateral limb. However, the majority of neurons were recorded outside of areas in which commissural interneurons are located. Thus, we do not think that some commissural neurons in our database can affect the interpretation of our results.
4.2. Possible Functional Roles of Neuronal Clusters
Our analysis revealed four phase ranges in the cycle (Figure 4) when many neurons were turned on and off. Onset and offset phases of the majority of neuronal Clusters revealed in the present study fell into the abovementioned four phase ranges (Figure 5). Thus, the activity of SLN neurons is changed mainly around four critical moments in the locomotor cycle that demarcate F, E1, E2, and E3 phases of the cycle revealed by kinematic analysis (Endberg and Lundberg 1969). Most likely, changes in neuronal activity within range I contribute to the transition from weight support (E2 phase) to limb unloading (E3 phase) as well as to preparation for the following limb lift‐off. Changes in activity within range II contribute to the transition from the stance (E3 phase) to the swing phase (F phase; the limb lift‐off) as well as to preparation for the following limb forward transfer. Activity changes within range III may contribute to the transition from limb flexion (F phase) to knee and ankle extension during swing (E1 phase) as well as to preparation for the following touch‐down and weight acceptance. Finally, activity changes within range IV may contribute to the transition from swing (E1 phase) to stance phase (E2 phase; the limb touch‐down). In contrast, the transition from limb shortening to limb elongation during stance (in the midstance) is less precisely controlled: neurons of Clusters 19, 12 and 18, 15 that are turned, respectively, on and off in this part of the cycle (Figure 5) are relatively not numerous, and their onset and offset phases are defined not very precisely (note the larger SDs in these Clusters in Figure 5).
Analysis of the motor pattern of forward stepping revealed a few (2–5 in different studies) motor modules or muscle synergies that underlie forward locomotor movement (Dominici et al. 2011; Ting et al. 2015; Aoi et al. 2013). It was suggested that their phases represent important events in the locomotor cycle. While there is a consensus that this structure exists in motor patterns, how it arises, whether it reflects neuronal structure, and whether it is functionally relevant are sources of lively debate.
The activity phase of some Clusters (Figure 5) coincided with the activity phase of specific limb muscles (Krouchev et al. 2006; Markin et al. 2012). For example, the activity of Cluster 3 coincided with the activity of muscles initiating the swing (Cluster 2 in Figure 7, Krouchev et al. 2006, and Cluster 5 in Figure 5B, Markin et al. 2012), and Cluster 14 was active at the end of the swing and the beginning of the stance, similar to muscle Cluster 5 in Figure 7 (Krouchev et al. 2006) and Cluster 7 in Figure 5B (Markin et al. 2012). Neurons of such Clusters could be the last order premotor interneurons. However, the other Clusters (e.g., 7, 10, 17) had no motoneuronal counterparts; thus, they probably do not directly affect the motoneurons.
4.3. Organization of SLN Controlling Forward Locomotion
Our previous study, in which SLN was activated by epidural stimulation, demonstrated the existence of separate neural mechanisms generating vertical (VC) and horizontal (HC) components of a step (Musienko et al. 2012). The present study suggests that according to their activity phases, all interneuronal Clusters can be assigned either to VC or HC parts of SLN (Figure 8). Moreover, the VC consists of pairs of reciprocally active Groups 1, 2 and 3, 4, while the HC consists of pairs of reciprocally active Groups 5, 6 and 7, 8 (Figure 6C). Thus, in contrast to previous studies (Orlovsky and Feldman 1972; Baev et al. 1979; Viala et al. 1991; AuYong et al. 2011), we found several pairs of reciprocally active Groups with activity in different and specific parts of the step cycle.
FIGURE 8.

Structure of the spinal locomotor network controlling forward stepping.
It was demonstrated that the network generating the VC of step can be activated selectively that leads to in‐place stepping (Musienko et al. 2012). However, it is not clear whether only one or several Clusters of VC‐related Groups are rhythmogenic, while the others follow their rhythm, or if the rhythm is an emergent property of a part of or the entire VC network. Also, it is not clear whether the HC network alone can generate the rhythmic horizontal component of steps or if the HC‐related Groups are driven by the VC network. These are questions for future studies.
We also found that spinal interneurons presumably controlling VC and those controlling HC of the step have significantly different distributions across the gray matter of the spinal cord. Most VC‐related neurons (Groups 1–4) were located in the intermediate part of the gray matter, while the majority of HC‐related neurons (Groups 5–8)—in the dorsal and ventral parts of the grey matter (Figure 7).
There are a number of models explaining the generation of locomotor movements, which are debated. Some earlier hypothetical models suggested that the locomotor rhythm can be generated by three or more neuronal elements forming a closed ring (Kling and Székely 1968). Later, a model was suggested in which the neuronal activity is continuously cycling through all phases of the locomotor cycle (Lindén et al. 2022). The most popular model based on numerous studies of locomotor networks in animal models of different complexity suggests that a rhythm‐generating part of the locomotor network consists of just two populations (half‐centers) of neurons with mutual inhibitory connections (Brown 1914; Jankowska et al. 1967; Lundberg 1981; Ijspeert 2008). Experimental observations demonstrated that the original half‐center hypothesis in its simplest form cannot account for specific profiles of EMG activity (Perret and Cabelguen 1980) and non‐resetting deletions of activity of specific muscles (Lafreniere‐Roula and McCrea 2005). Therefore, a more advanced SLN model (Rybak et al. 2006; McCrea and Rybak 2008; Rybak et al. 2015) includes a rhythm generator of the half‐center type and an output stage responsible for the formation of the locomotor EMG pattern. Another SLN model (Grillner 1985, 2006, 2021) suggests that the locomotor network contains a set of rhythm‐generating units, each controlling muscles of a particular joint, and specific interactions between these units result in the generation of a particular locomotor pattern. Finally, CPG controllers incorporating pattern formation models simulating modular muscle activations with multiple patterns loosely corresponding to different locomotor phases have been proposed as well (Aoi et al. 2013).
We think that our experimental data are compatible with all other models. Each of the revealed Clusters can be rhythmogenic and thus represent a unit generator or a part of a unit generator from Grillner's model. We cannot exclude that just one Cluster or a pair of reciprocally active Clusters are rhythmogenic, while the other Clusters represent different parts of the pattern formation layer from Rybak's model. It is also possible that the minimal rhythmogenic circuit must include Clusters from all 8 Groups to form a rhythmogenic ring. Future studies will clarify these issues.
Recent advances in genetics led to the initiation of numerous studies devoted to the identification of components of the spinal locomotor network based on transcription factor expression (for review, Kiehn 2016). It turned out that no single genetically identified type of spinal interneurons has been found to be solely responsible for the locomotor rhythm generation or control of the step direction (Rancic and Gosgnach 2021). It was suggested that the locomotor rhythm is generated by a set of genetically heterogeneous populations (Kiehn 2016; Dougherty et al. 2013; Caldeira et al. 2017). Thus, there is evidence that at least two genetically identified populations of interneurons, glutamatergic Hb9‐expressing interneurons and Shox2 non‐V2a interneurons (Shox2 + interneurons that do not co‐express Chx10), may be involved in the generation of the locomotor rhythm (Dougherty et al. 2013; Caldeira et al. 2017). By contrast, it was demonstrated that two genetically identified populations, V1 and V2b interneurons, are required for the flexor–extensor alternation during locomotion (inhibition of flexors is mediated by V1 interneurons and of extensors by V2b interneurons) (Britz et al. 2015).
To conclude, in the present study, by using a novel method of analysis of neuronal activity recorded during real forward locomotion, we have revealed four key ranges of the locomotor cycle where most of the neurons were activated or inactivated, groups of spinal putative interneurons presumably controlling the vertical and horizontal components of a step and their possible contribution to the control of limb movement in different parts of the locomotor cycle, as well as roughly demarcating their locations. The obtained data can be used as a benchmark for computational models of locomotor neuronal networks. The method of analysis developed in the present study can be used for the analysis of rhythmical activity of neurons related to other motor functions (e.g., scratching, paw shaking, etc.).
Author Contributions
Pavel E. Musienko: conceptualization, funding acquisition, investigation, methodology, writing – review and editing. Oleg V. Gorskii: investigation, methodology, writing – review and editing. Tatiana G. Deliagina: conceptualization, funding acquisition, investigation, methodology, validation, visualization, writing – original draft. Pavel V. Zelenin: conceptualization, formal analysis, investigation, methodology, validation, visualization, writing – original draft.
Conflicts of Interest
The authors declare no conflicts of interest.
Peer Review
The peer review history for this article is available at https://www.webofscience.com/api/gateway/wos/peer‐review/10.1111/ejn.70238.
Supporting information
Figure S1: (A) The phase weight versus the phase SD curve. (B–G) Distributions of phase SDs for onsets (B, C), offsets (D, E), and edges (onsets and offsets together) (F, G), respectively, in the entire population of active modulated neurons. Horizontal scale in (A), (C), (E), and (G) is logarithmic.
Figure S2: Activity phases of 126 stable neurons and their Clusters. (A) Results of clustering of the stable neurons into 19 Clusters. Lengths of the horizontal and vertical arms of the crosses indicate weights of the burst onset and offset of individual neurons, respectively. Green areas demarcate Clusters. (B) Scatterplot for average (±SD) Cluster offset phase plotted versus onset phase. These two panels present the same data as Figure 5 but in a two‐dimensional form that was used for cluster analysis of motor activity by other authors (Krouchev et al. 2006). Four phase ranges I–IV (indicated by yellow) are the same as in Figure 5. Note that due to the clustering procedure, Clusters with the smaller numbers tend to have smaller SDs, while Clusters with the greater numbers tend to have larger SDs.
Figure S3: Technical details for clustering of stable neurons. Heatmaps of the Euclidean (A) and “z‐score” (B) distances for all pairs of 126 clustered neurons. Our analysis produced 19 Clusters, while 9% of the neurons were not included into any of the 19 Clusters and were called “Cluster #0.” Note that for any pair of neurons belonging to the same Cluster, Euclidean distance was < 0.1 (dark blue squares on the diagonal in A), and “z‐score” distances was < 3 (dark blue squares on the diagonal in B). Note the nonlinear scale in (B), it was used to have better color resolution for small values of Z. Numbers were assigned to Clusters according to the clustering procedure.
Figure S4: Search for Clusters active approximately in anti‐phase. (A) A circular diagram showing phases of the middle of the burst for all 19 revealed Clusters on the locomotor cycle circle. Some Clusters were active in anti‐phase with one another, for example: Clusters #2 and #5 (blue arrow), Clusters #8 and #13 (purple arrow), and Clusters #18 and #19 (orange arrow). (B) A circular diagram showing the mid‐burst phases of the a priori possible hypothetical Clusters neither of which are active in anti‐phase. In (A) and (B), the green and red stars indicated the middle of the swing and stance, respectively. (C) An example of phase differences between a reference Cluster (#13, shown by bold black) and the other Clusters. The color scheme is the same as in Figure 6A: The difference from anti‐phase less than 1% of the cycle duration is indicated by red, < 3%; by orange, < 6%; by yellow, < 10%; by green, < 25%; by light blue; the in‐phase half of the cycle is shown by dark blue.
Figure S5: Combining Clusters into Groups that are active approximately in anti‐phase. (A–C) All Clusters were combined into N pairs of Groups: a combination with four pairs (A), a combination with three pairs (B), and a combination with eight pairs (C). The midphase of each Cluster is shown on the locomotor cycle circle. Borders between Groups are shown with white dashed lines. Groups active in anti‐phase are shown with the same color (e.g., in A, Groups #1 and #2 are shown in red, Groups #3 and #4 in green, Groups #5 and #6 in blue, and Groups #7 and #8 in black). (D–F) The heatmap of the phase shift between midbursts of different Cluster pairs corresponding to different Cluster combinations: D corresponds to four pairs of Groups shown in A, E—three pairs of Groups shown in B, and F—eight pairs of Groups shown in C. White dashed lines show borders between Groups. Dashed color rectangles demarcate “selected” Cluster pairs. Black crosses in (E, F) indicate “neighbor” Cluster pairs. The color scheme is the same as in Figures 6A and S4C.
Figure S6: (A) The selected cost for the optimal combinations of Clusters (the minimum of the selected cost function across all possible combinations of Clusters for a given number of Group pairs N) is shown in red. The corresponding neighbor cost for these optimal combinations is shown in blue. (B) The contrast ratio (the neighbor cost divided by the selected cost for the optimal combination of Clusters into N pairs of Groups). The maximum is reached at N = 4. The optimal combination Coptimal of four Cluster pairs is presented in Figure S5A,D.
Figure S7: Vertical and horizontal components of the locomotor movements. During air‐stepping, the hindlimb movements can be presented with an idealized scheme (A). The paw trajectory has four critical points: (1) the extreme posterior (light gray limb configuration), (2) the extreme dorsal (gray limb configuration), (3) the extreme anterior (dark gray limb configuration), and (4) the extreme ventral (black limb configuration). These critical points divide the entire limb trajectory into forward (green, F; from points 1 to 3) and backward (red, B; from points 3 to 1) movements, or into upward (yellow, U; from points 4 to 2) and downward (blue, D; from points 2 to 4) movements. A black arrow indicates the direction of movement. The corresponding graphs for phase dependence of the anteroposterior (C) and dorso‐ventral (D) paw position are drawn under assumption of equal swing and stance durations. Analogous to (A), a scheme of the hindlimb movements can be drawn for overground locomotion (B). In contrast to (A), the lower part of the paw trajectory in (B) is horizontal (the limb is on the ground during stance). However, it is not uniform in terms of ground reaction force vertical component: In the red‐blue part of the trajectory, gradual loading of the limb takes place, while in the red‐yellow part, the limb gets unloaded. The phase dependence of the antero‐posterior paw position for overground locomotion is the same as for the air stepping (C). The phase dependence of the dorso‐ventral paw position is slightly different: During stance, the position does not change, while the force does (E; solid and dashed lines, respectively). Despite the difference in kinematics in forces, one can argue that the red‐blue part of the trajectory during air stepping (when the paw moves downwards due to activity of the extensor muscles) is homologous to the red‐blue part of the trajectory during overground locomotion (when the same extensor muscles are activated to counteract the increasing load). Similarly, the red‐yellow part of the air stepping trajectory (when the paw moves upwards due to activation of the flexors and activity reduction of the extensors) is homologous to the red‐yellow part of the overground trajectory (when the limb unloading coincides with similar changes in the muscle activity).
Acknowledgments
This work was supported by the St. Petersburg State University, St. Petersburg, Russia (projects: 94030803, 104623591) to P.E.M.; by a grant from NIH (R01 NS‐100928) to T.G.D. and P.E.M.; by a grant from NIH (R01 NS‐064964) to T.G.D.; by grants from the Swedish Research Council (2020‐02502) to T.G.D.; by the Russian Science Foundation grant 22‐15‐00092 to P.E.M.; by the Sirius University of Science and Technology project: NRB‐RND‐2115 to P.E.M. We thank Natalia Merkulyeva for helping with the histological evaluation.
Musienko, P. , Gorskii O., Deliagina T., and Zelenin P.. 2025. “Functional Organization of the Spinal Locomotor Network Based on Analysis of Interneuronal Activity.” European Journal of Neuroscience 62, no. 4: e70238. 10.1111/ejn.70238.
Tatiana G. Deliagina and Pavel V. Zelenin contributed equally to this work and share senior authorship.
Associate Editor: Francisco Alvarez
Funding: This work was supported by the St. Petersburg State University, St. Petersburg, Russia (projects: 94030803 and 104623591) to P.E.M.; by a grant from NIH (R01 NS‐100928) to T.G.D. and P.E.M.; by a grant from NIH (R01 NS‐064964) to T.G.D.; by grants from the Swedish Research Council (2020‐02502) to T.G.D.; by the Russian Science Foundation grant 22‐15‐00092 to P.E.M.; by the Sirius University of Science and Technology project: NRB‐RND‐2115 to P.E.M.
Data Availability Statement
The data that support the findings of this study are available from the corresponding author upon reasonable request.
References
- Aoi, S. , Kondo T., Hayashi N., et al. 2013. “Contributions of Phase Resetting and Interlimb Coordination to the Adaptive Control of Hindlimb Obstacle Avoidance During Locomotion in Rats: A Simulation Study.” Biological Cybernetics 107: 201–216. [DOI] [PubMed] [Google Scholar]
- AuYong, N. , Ollivier‐Lanvin K., and Lemay M. A.. 2011. “Preferred Locomotor Phase of Activity of Lumbar Interneurons During Air‐Stepping in Subchronic Spinal Cats.” Journal of Neurophysiology 105: 1011–1022. [DOI] [PMC free article] [PubMed] [Google Scholar]
- Baev, K. V. , Degtyarenko A. M., Zavadskaya T. V., and Kostyuk P. G.. 1979. “Activity of Interneurons of the Lumbar Region of the Spinal Cord During Fictive Locomotion of Thalamic Cats.” Neir̆ofiziologiia 11: 329–338. [PubMed] [Google Scholar]
- Batschelet, E. 1981. Circular Statistics in Biology. Academic Press. [Google Scholar]
- Berkowitz, A. , and Stein P. S.. 1994. “Activity of Descending Propriospinal Axons in the Turtle Hindlimb Enlargement During Two Forms of Fictive Scratching: Phase Analyses.” Journal of Neuroscience 14: 5105–5119. [DOI] [PMC free article] [PubMed] [Google Scholar]
- Bouvier, J. , Caggiano V., Leiras R., et al. 2015. “Descending Command Neurons in the Brainstem That Halt Locomotion.” Cell 163: 1191–1203. [DOI] [PMC free article] [PubMed] [Google Scholar]
- Britz, O. , Zhang J., Grossmann K. S., et al. 2015. “A Genetically Defined Asymmetry Underlies the Inhibitory Control of Flexor‐Extensor Locomotor Movements.” eLife 4: e04718. 10.7554/eLife.04718. [DOI] [PMC free article] [PubMed] [Google Scholar]
- Brown, T. G. 1911. “The Intrinsic Factors in the Act of Progression in Mammals.” Proceedings of the Royal Society of London B 84: 308–319. [Google Scholar]
- Brown, T. G. 1914. “On the Nature of the Fundamental Activity of the Nervous Centres: Together With an Analysis of the Conditioning of Rhythmic Activity in Progression, and a Theory of the Evolution of Function in the Nervous System.” Journal of Physiology 48: 18–46. [DOI] [PMC free article] [PubMed] [Google Scholar]
- Butt, S. J. , and Kiehn O.. 2003. “Functional Identification of Interneurons Responsible for Left‐Right Coordination of Hindlimbs in Mammals.” Neuron 38: 953–963. [DOI] [PubMed] [Google Scholar]
- Caggiano, V. , Leiras R., Goñi‐Erro H., et al. 2018. “Midbrain Circuits That Set Locomotor Speed and Gait Selection.” Nature 553: 455–460. [DOI] [PMC free article] [PubMed] [Google Scholar]
- Caldeira, V. , Dougherty K. J., Borgius L., and Kiehn O.. 2017. “Spinal Hb9::Cre‐Derived Excitatory Interneurons Contribute to Rhythm Generation in the Mouse.” Scientific Reports 7: 41369. 10.1038/srep41369. [DOI] [PMC free article] [PubMed] [Google Scholar]
- Dai, X. , Noga B. R., Douglas J. R., and Jordan L. M.. 2005. “Localization of Spinal Neurons Activated During Locomotion Using the c‐Fos Immunohistochemical Method.” Journal of Neurophysiology 93: 3442–3452. [DOI] [PubMed] [Google Scholar]
- Dominici, N. , Ivanenko Y. P., Cappellini G., et al. 2011. “Locomotor Primitives in Newborn Babies and Their Development.” Science 334: 997–999. [DOI] [PubMed] [Google Scholar]
- Dougherty, K. J. , and Kiehn O.. 2010. “Firing and Cellular Properties of V2a Interneurons in the Rodent Spinal Cord.” Journal of Neuroscience 30: 24–37. [DOI] [PMC free article] [PubMed] [Google Scholar]
- Dougherty, K. J. , Zagoraiou L., Satoh D., et al. 2013. “Locomotor Rhythm Generation Linked to the Output of Spinal Shox2 Excitatory Interneurons.” Neuron 80: 920–933. 10.1016/j.neuron.2013.08.015. [DOI] [PubMed] [Google Scholar]
- Endberg, I. , and Lundberg A.. 1969. “An Electromyographic Analysis of Muscular Activity in the Hindlimb of the Cat During Unrestrained Locomotion.” Acta Physiologica Scandinavica 75: 614–630. [DOI] [PubMed] [Google Scholar]
- Feldman, A. G. , and Orlovsky G. N.. 1975. “Activity of Interneurons Mediating Reciprocal 1a Inhibition During Locomotion.” Brain Research 84: 181–194. [DOI] [PubMed] [Google Scholar]
- Garcia‐Rill, E. , and Skinner R. D.. 1987a. “The Mesencephalic Locomotor Region. I. Activation of a Medullary Projection Site.” Brain Research 411: 1–12. [DOI] [PubMed] [Google Scholar]
- Garcia‐Rill, E. , and Skinner R. D.. 1987b. “The Mesencephalic Locomotor Region. II. Projections to Reticulospinal Neurons.” Brain Research 411: 13–20. [DOI] [PubMed] [Google Scholar]
- Grillner, S. 1985. “Neurobiological Bases of Rhythmic Motor Acts in Vertebrates.” Science 228: 143–149. [DOI] [PubMed] [Google Scholar]
- Grillner, S. 2006. “Biological Pattern Generation: The Cellular and Computational Logic of Networks in Motion.” Neuron 52: 751–766. [DOI] [PubMed] [Google Scholar]
- Grillner, S. 2021. “The CPGs for Limbed Locomotion—Facts and Fiction.” International Journal of Molecular Sciences 20: 5882. 10.3390/ijms22115882. [DOI] [PMC free article] [PubMed] [Google Scholar]
- Grillner, S. , and Rossignol S.. 1978. “On the Initiation of the Swing Phase of Locomotion in Chronic Spinal Cats.” Brain Research 146: 269–277. [DOI] [PubMed] [Google Scholar]
- Halbertsma, J. 1983. “The Stride Cycle of the Cat: The Modelling of Locomotion by Computerized Analysis of Automatic Recordings.” Acta Physiologica Scandinavica. Supplementum 521: 1–75. [PubMed] [Google Scholar]
- Hiebert, G. W. , Whelan P. J., Prochazka A., and Pearson K. G.. 1996. “Contribution of Hind Limb Flexor Muscle Afferents to the Timing of Phase Transitions in the Cat Step Cycle.” Journal of Neurophysiology 75: 1126–1137. [DOI] [PubMed] [Google Scholar]
- Ijspeert, A. J. 2008. “Central Pattern Generators for Locomotion Control in Animals and Robots: A Review.” Neural Networks 21: 642–653. [DOI] [PubMed] [Google Scholar]
- Jankowska, E. , Jukes M. G., Lund S., and Lundberg A.. 1967. “The Effect of DOPA on the Spinal Cord. 6. Half‐Centre Organization of Interneurones Transmitting Effects From the Flexor Reflex Afferents.” Acta Physiologica Scandinavica 70: 389–402. [DOI] [PubMed] [Google Scholar]
- Jordan, L. M. 1986. Neurobiology of Vertebrate Locomotion: Initiation of Locomotion From the Mammalian Brainstem. Macmillan. [Google Scholar]
- Kiehn, O. 2016. “Decoding the Organization of Spinal Circuits That Control Locomotion.” Nature Reviews Neuroscience 17: 224–238. [DOI] [PMC free article] [PubMed] [Google Scholar]
- Kling, U. , and Székely G.. 1968. “Simulation of Rhythmic Nervous Activities. I. Function of Networks With Cyclic Inhibitions.” Kybernetik 5: 89–103. [DOI] [PubMed] [Google Scholar]
- Krouchev, N. , Kalaska J. F., and Drew T.. 2006. “Sequential Activation of Muscle Synergies During Locomotion in the Intact Cat as Revealed by Cluster Analysis and Direct Decomposition.” Journal of Neurophysiology 96: 1991–2010. [DOI] [PubMed] [Google Scholar]
- Lafreniere‐Roula, M. , and McCrea D. A.. 2005. “Deletions of Rhythmic Motoneuron Activity During Fictive Locomotion and Scratch Provide Clues to the Organization of the Mammalian Central Pattern Generator.” Journal of Neurophysiology 94: 1120–1132. [DOI] [PubMed] [Google Scholar]
- Lindén, H. , Petersen P. C., Vestergaard M., and Berg R. W.. 2022. “Movement Is Governed by Rotational Neural Dynamics in Spinal Motor Networks.” Nature 610: 526–531. [DOI] [PubMed] [Google Scholar]
- Lundberg, A. 1981. “Half‐Centres Revisited.” In Regulatory Functions of the CNS—Principles of Motion and Organization, edited by Szentágothai J., Palkovits M., and Hámori J., 155–167. Pergammon Press; Akadémiai Kiadó. [Google Scholar]
- Lyakhovetskii, V. , Merkulyeva N., Gorskii O., and Musienko P.. 2021. “Simultaneous Bidirectional Hindlimb Locomotion in Decerebrate Cats.” Scientific Reports 11: 3252. [DOI] [PMC free article] [PubMed] [Google Scholar]
- Markin, S. N. , Klishko A. N., Shevtsova N. A., Lemay M. A., Prilutsky B., and Rybak I. A.. 2016. “A Neuromechanical Model of Spinal Control of Locomotion.” In Neuromechanical Modeling of Posture and Locomotion, edited by Prilutsky B. I. and Edwards D. H., 21–65. Springer. [Google Scholar]
- Markin, S. N. , Lemay S. N., Prilutsky B. I., and Rybak I. A.. 2012. “Motoneuronal and Muscle Synergies Involved in Cat Hindlimb Control During Fictive and Real Locomotion: A Comparison Study.” Journal of Neurophysiology 107: 2057–2071. [DOI] [PMC free article] [PubMed] [Google Scholar]
- McCrea, D. A. , and Rybak I. A.. 2008. “Organization of Mammalian Locomotor Rhythm and Pattern Generation.” Brain Research Reviews 57: 134–146. [DOI] [PMC free article] [PubMed] [Google Scholar]
- Merkulyeva, N. , Veshchitskii A., Gorsky O., et al. 2018. “Distribution of Spinal Neuronal Networks Controlling Forward and Backward Locomotion.” Journal of Neuroscience 38: 4695–4707. [DOI] [PMC free article] [PubMed] [Google Scholar]
- Musienko, P. E. , Lyalka V. F., Gorskii O. V., et al. 2020. “Comparison of Operation of Spinal Locomotor Networks Activated by Supraspinal Commands and by Epidural Stimulation of the Spinal Cord in Cats.” Journal of Physiology 598: 3459–3483. [DOI] [PMC free article] [PubMed] [Google Scholar]
- Musienko, P. E. , Lyalka V. F., Gorskii O. V., Zelenin P. V., and Deliagina T. G.. 2022. “Activity of Spinal Interneurons During Forward and Backward Locomotion.” Journal of Neuroscience 42: 3570–3586. [DOI] [PMC free article] [PubMed] [Google Scholar]
- Musienko, P. E. , Zelenin P. V., Lyalka V. F., Gerasimenko Y. P., Orlovsky G. N., and Deliagina T. G.. 2012. “Spinal and Supraspinal Control of the Direction of Stepping During Locomotion.” Journal of Neuroscience 32: 17442–17453. [DOI] [PMC free article] [PubMed] [Google Scholar]
- Noga, B. R. , Shefchyk S. J., Jamal J., and Jordan L. M.. 1987. “The Role of Renshaw Cells in Locomotion: Antagonism of Their Excitation From Motor Axon Collaterals With Intravenous Mecamylamine.” Experimental Brain Research 66: 99–105. [DOI] [PubMed] [Google Scholar]
- Orlovsky, G. N. , Deliagina T. G., and Grillner S.. 1999. Neuronal Control of Locomotion. From Mollusc to Man. Oxford Univ. Press. [Google Scholar]
- Orlovsky, G. N. , and Feldman A. G.. 1972. “Classification of Lumbosacral Neurons by Their Discharge Pattern During Evoked Locomotion.” Neurophysiology 4: 311–317.4667961 [Google Scholar]
- Perret, C. , and Cabelguen J. M.. 1980. “Main Characteristics of the Hindlimb Locomotor Cycle in the Decorticate Cat With Special Reference to Bifunctional Muscles.” Brain Research 187: 333–352. [DOI] [PubMed] [Google Scholar]
- Pratt, C. A. , and Jordan L. M.. 1987. “Ia Inhibitory Interneurons and Renshaw Cells as Contributors to the Spinal Mechanisms of Fictive Locomotion.” Journal of Neurophysiology 57: 56–71. [DOI] [PubMed] [Google Scholar]
- Rancic, V. , and Gosgnach S.. 2021. “Recent Insights Into the Rhythmogenic Core of the Locomotor CPG.” International Journal of Molecular Sciences 22: 1394. 10.3390/ijms22031394. [DOI] [PMC free article] [PubMed] [Google Scholar]
- Rossignol, S. , Dubuc R., and Gossard J. P.. 2006. “Dynamic Sensorimotor Interactions in Locomotion.” Physiological Reviews 86: 89–154. [DOI] [PubMed] [Google Scholar]
- Rybak, I. A. , Dougherty K. J., and Shevtsova N. A.. 2015. “Organization of the Mammalian Locomotor CPG: Review of Computational Model and Circuit Architectures Based on Genetically Identified Spinal Interneurons.” ENeuro 2: 1–25. [DOI] [PMC free article] [PubMed] [Google Scholar]
- Rybak, I. A. , Stecina K., Shevtsova N. A., and McCrea D. A.. 2006. “Modelling Spinal Circuitry Involved in Locomotor Pattern Generation: Insights From the Effects of Afferent Stimulation.” Journal of Physiology 577: 641–658. [DOI] [PMC free article] [PubMed] [Google Scholar]
- Shefchyk, S. , McCrea D., Kriellaars D., Fortier P., and Jordan L.. 1990. “Activity of Interneurons Within the L4 Spinal Segment of the Cat During Brainstem‐Evoked Fictive Locomotion.” Experimental Brain Research 80: 290–295. [DOI] [PubMed] [Google Scholar]
- Shevtsova, N. A. , Talpalar A. E., Markin S. N., Harris‐Warrick R. M., Kiehn O., and Rybak I. R.. 2015. “Organization of Left–Right Coordination of Neuronal Activity in the Mammalian Spinal Cord: Insights From Computational Modelling.” Journal of Physiology 593: 2403–2426. [DOI] [PMC free article] [PubMed] [Google Scholar]
- Shik, M. L. , and Orlovsky G. N.. 1976. “Neurophysiology of Locomotor Automatism.” Physiological Reviews 56: 465–501. [DOI] [PubMed] [Google Scholar]
- Shik, M. L. , Severin F. V., and Orlovsky G. N.. 1966. “Control of Walking and Running by Means of Electrical Stimulation of the Mid‐Brain.” Biophysics 11: 756–765. [Google Scholar]
- Strohmer, B. , Najarro E., Ausborn J., Berg R. W., and Tolu S.. 2024. “Sparse Firing in a Hybrid Central Pattern Generator for Spinal Motor Circuits.” Neural Computation 36: 759–780. [DOI] [PubMed] [Google Scholar]
- Ting, L. H. , Chiel H. J., Trumbower R. D., et al. 2015. “Neuromechanical Principles Underlying Movement Modularity and Their Implications for Rehabilitation.” Neuron 86: 38–54. [DOI] [PMC free article] [PubMed] [Google Scholar]
- Tresch, M. C. , and Kiehn O.. 1999. “Coding of Locomotor Phase in Populations of Neurons in Rostral and Caudal Segments of the Neonatal Rat Lumbar Spinal Cord.” Journal of Neurophysiology 82: 3563–3574. [DOI] [PubMed] [Google Scholar]
- Viala, D. , Viala G., and Jordan M.. 1991. “Interneurones of the Lumbar Cord Related to Spontaneous Locomotor Activity in the Rabbit. I. Rhythmically Active Interneurones.” Experimental Brain Research 84: 177–186. [DOI] [PubMed] [Google Scholar]
- Whelan, P. J. , Hiebert G. W., and Pearson K. G.. 1995. “Stimulation of the Group I Extensor Afferents Prolongs the Stance Phase in Walking Cats.” Experimental Brain Research 103: 20–30. [DOI] [PubMed] [Google Scholar]
- Zelenin, P. V. , Deliagina T. G., Orlovsky G. N., et al. 2011. “Activity of Motor Cortex Neurons During Backward Locomotion.” Journal of Neurophysiology 106: 2698–2714. [DOI] [PMC free article] [PubMed] [Google Scholar]
- Zelenin, P. V. , Gorskii O. V., Gerasimenko Y. P., Deliagina T. G., and Musienko P. E.. 2019. “Functional Organization of the Spinal Locomotor Network Based on Analysis of Interneuronal Activity.” SfN Abstracts 45: 497.14. [DOI] [PubMed] [Google Scholar]
- Zhong, G. , Droho S., Crone S. A., et al. 2010. “Electrophysiological Characterization of V2a Interneurons and Their Locomotor‐Related Activity in the Neonatal Mouse Spinal Cord.” Journal of Neuroscience 30: 170–182. [DOI] [PMC free article] [PubMed] [Google Scholar]
- Zhong, G. , Shevtsova N. A., Rybak I., and Harris‐Warrick R. M.. 2012. “Neuronal Activity in the Isolated Mouse Spinal Cord During Spontaneous Deletions in Fictive Locomotion: Insights Into Locomotor Central Pattern Generator Organization.” Journal of Physiology 590: 4735–4759. [DOI] [PMC free article] [PubMed] [Google Scholar]
Associated Data
This section collects any data citations, data availability statements, or supplementary materials included in this article.
Supplementary Materials
Figure S1: (A) The phase weight versus the phase SD curve. (B–G) Distributions of phase SDs for onsets (B, C), offsets (D, E), and edges (onsets and offsets together) (F, G), respectively, in the entire population of active modulated neurons. Horizontal scale in (A), (C), (E), and (G) is logarithmic.
Figure S2: Activity phases of 126 stable neurons and their Clusters. (A) Results of clustering of the stable neurons into 19 Clusters. Lengths of the horizontal and vertical arms of the crosses indicate weights of the burst onset and offset of individual neurons, respectively. Green areas demarcate Clusters. (B) Scatterplot for average (±SD) Cluster offset phase plotted versus onset phase. These two panels present the same data as Figure 5 but in a two‐dimensional form that was used for cluster analysis of motor activity by other authors (Krouchev et al. 2006). Four phase ranges I–IV (indicated by yellow) are the same as in Figure 5. Note that due to the clustering procedure, Clusters with the smaller numbers tend to have smaller SDs, while Clusters with the greater numbers tend to have larger SDs.
Figure S3: Technical details for clustering of stable neurons. Heatmaps of the Euclidean (A) and “z‐score” (B) distances for all pairs of 126 clustered neurons. Our analysis produced 19 Clusters, while 9% of the neurons were not included into any of the 19 Clusters and were called “Cluster #0.” Note that for any pair of neurons belonging to the same Cluster, Euclidean distance was < 0.1 (dark blue squares on the diagonal in A), and “z‐score” distances was < 3 (dark blue squares on the diagonal in B). Note the nonlinear scale in (B), it was used to have better color resolution for small values of Z. Numbers were assigned to Clusters according to the clustering procedure.
Figure S4: Search for Clusters active approximately in anti‐phase. (A) A circular diagram showing phases of the middle of the burst for all 19 revealed Clusters on the locomotor cycle circle. Some Clusters were active in anti‐phase with one another, for example: Clusters #2 and #5 (blue arrow), Clusters #8 and #13 (purple arrow), and Clusters #18 and #19 (orange arrow). (B) A circular diagram showing the mid‐burst phases of the a priori possible hypothetical Clusters neither of which are active in anti‐phase. In (A) and (B), the green and red stars indicated the middle of the swing and stance, respectively. (C) An example of phase differences between a reference Cluster (#13, shown by bold black) and the other Clusters. The color scheme is the same as in Figure 6A: The difference from anti‐phase less than 1% of the cycle duration is indicated by red, < 3%; by orange, < 6%; by yellow, < 10%; by green, < 25%; by light blue; the in‐phase half of the cycle is shown by dark blue.
Figure S5: Combining Clusters into Groups that are active approximately in anti‐phase. (A–C) All Clusters were combined into N pairs of Groups: a combination with four pairs (A), a combination with three pairs (B), and a combination with eight pairs (C). The midphase of each Cluster is shown on the locomotor cycle circle. Borders between Groups are shown with white dashed lines. Groups active in anti‐phase are shown with the same color (e.g., in A, Groups #1 and #2 are shown in red, Groups #3 and #4 in green, Groups #5 and #6 in blue, and Groups #7 and #8 in black). (D–F) The heatmap of the phase shift between midbursts of different Cluster pairs corresponding to different Cluster combinations: D corresponds to four pairs of Groups shown in A, E—three pairs of Groups shown in B, and F—eight pairs of Groups shown in C. White dashed lines show borders between Groups. Dashed color rectangles demarcate “selected” Cluster pairs. Black crosses in (E, F) indicate “neighbor” Cluster pairs. The color scheme is the same as in Figures 6A and S4C.
Figure S6: (A) The selected cost for the optimal combinations of Clusters (the minimum of the selected cost function across all possible combinations of Clusters for a given number of Group pairs N) is shown in red. The corresponding neighbor cost for these optimal combinations is shown in blue. (B) The contrast ratio (the neighbor cost divided by the selected cost for the optimal combination of Clusters into N pairs of Groups). The maximum is reached at N = 4. The optimal combination Coptimal of four Cluster pairs is presented in Figure S5A,D.
Figure S7: Vertical and horizontal components of the locomotor movements. During air‐stepping, the hindlimb movements can be presented with an idealized scheme (A). The paw trajectory has four critical points: (1) the extreme posterior (light gray limb configuration), (2) the extreme dorsal (gray limb configuration), (3) the extreme anterior (dark gray limb configuration), and (4) the extreme ventral (black limb configuration). These critical points divide the entire limb trajectory into forward (green, F; from points 1 to 3) and backward (red, B; from points 3 to 1) movements, or into upward (yellow, U; from points 4 to 2) and downward (blue, D; from points 2 to 4) movements. A black arrow indicates the direction of movement. The corresponding graphs for phase dependence of the anteroposterior (C) and dorso‐ventral (D) paw position are drawn under assumption of equal swing and stance durations. Analogous to (A), a scheme of the hindlimb movements can be drawn for overground locomotion (B). In contrast to (A), the lower part of the paw trajectory in (B) is horizontal (the limb is on the ground during stance). However, it is not uniform in terms of ground reaction force vertical component: In the red‐blue part of the trajectory, gradual loading of the limb takes place, while in the red‐yellow part, the limb gets unloaded. The phase dependence of the antero‐posterior paw position for overground locomotion is the same as for the air stepping (C). The phase dependence of the dorso‐ventral paw position is slightly different: During stance, the position does not change, while the force does (E; solid and dashed lines, respectively). Despite the difference in kinematics in forces, one can argue that the red‐blue part of the trajectory during air stepping (when the paw moves downwards due to activity of the extensor muscles) is homologous to the red‐blue part of the trajectory during overground locomotion (when the same extensor muscles are activated to counteract the increasing load). Similarly, the red‐yellow part of the air stepping trajectory (when the paw moves upwards due to activation of the flexors and activity reduction of the extensors) is homologous to the red‐yellow part of the overground trajectory (when the limb unloading coincides with similar changes in the muscle activity).
Data Availability Statement
The data that support the findings of this study are available from the corresponding author upon reasonable request.