

Key Points
Question
What are the estimated rates of US youth (younger than 18 years) who have lost a parent due to drug poisoning or firearms?
Findings
In this cross-sectional study of the US population using publicly available data between 1999 and 2020, an estimated 1.19 million US youth had a parent die by drug poisoning or firearms. In 2020, drugs and firearms caused 23% of all parental deaths compared with 12% in 1999, and Black youth experienced a disproportionate burden, mainly due to firearm deaths of fathers.
Meaning
Results of this modeling study suggest that US youth are at high and increasing risk of experiencing parental death by drugs or firearms.
Abstract
Importance
Youth (those aged <18 years) parental death has been associated with negative health outcomes. Understanding the burden of parental death due to drug poisoning (herein, drugs) and firearms is essential for informing interventions.
Objective
To estimate the incidence of youth parental death due to drugs, firearms, and all other causes.
Design, Setting, and Participants
This cross-sectional observational study was conducted using vital registration, including all US decedents, and census data from January 1990 through December 2020. Data were analyzed from May 30, 2023, to March 28, 2024.
Exposures
Parental death due to drug poisoning or firearms.
Main Outcomes and Measures
A demographic matrix projection model was used to estimate the number and incidence of youth experiencing parental death, defined as the death of 1 or more parents, per 1000 population aged less than 18 years. Analyses evaluated parental deaths by drugs, firearms, and all other causes from 1999 through 2020 by race and ethnicity.
Results
Between 1999 and 2020, there were 931 785 drug poisoning deaths and 736 779 firearm-related deaths with a mean (SD) age of 42.6 (16.3) years. Most deaths occurred among males (73.8%) and White decedents (70.8%) followed by Black (17.5%) and Hispanic (9.5%) decedents. An estimated 759 000 (95% CI, 722 000-800 000) youth experienced parental death due to drugs and an estimated 434 000 (95% CI, 409 000-460 000) youth experienced parental death due to firearms, accounting for 17% of all parental deaths. From 1999 to 2020, the estimated number of youth who experienced parental death increased 345% (95% CI, 334%-361%) due to drugs and 39% (95% CI, 37%-41%) due to firearms compared with 24% (95% CI, 23%-25%) due to all other causes. Black youth experienced a disproportionate burden of parental deaths, based primarily on firearm deaths among fathers. In 2020, drugs and firearms accounted for 23% of all parental deaths, double the proportion in 1999 (12%).
Conclusions and Relevance
Results of this modeling study suggest that US youth are at high and increasing risk of experiencing parental death by drugs or firearms. Efforts to stem this problem should prioritize averting drug overdoses and firearm violence, especially among structurally marginalized groups.
This cross-sectional study uses a demographic projection model and publicly available vital statistics data to estimate the national incidence of parental death due to drugs and firearms overall and by race and ethnicity.
Introduction
The US is experiencing dual overlapping public health crises of drug poisoning (herein, drugs) and firearm deaths. Since 1999, more than 1 million residents of the US have died by fatal drug poisonings and more than 750 000 by firearms.1 Most deaths by drugs and firearms are among those aged 15 to 54 years, a period of life when many are parents to youth, defined as those aged less than 18 years. Recently, both drug-related mortality and firearm-related mortality have increased among children and adolescents, with drug-related mortality becoming the third leading and firearm-related mortality becoming most common causes of death in this group.2
Given this, youth face a double burden from drugs and firearms. In addition to the direct risk of fatal drug poisonings and firearm-related mortality, they may also experience the impacts of the death of a parent by drugs and firearms. Parental death, defined as the death of at least 1 parent, has been associated with negative educational, economic, and health outcomes.3,4,5,6,7 Further, substantial racial and ethnic disparities in mortality translate to vastly different exposure to parental death, resulting in disadvantages in health over the life course and contributing to cumulative racial disadvantage.8,9
To our knowledge, there are no estimates of the number of youth who experience parental death by drugs or firearms in the US. Efforts to estimate the incidence of parental deaths by drug poisoning or firearms are limited to single counties with intensive data linkage5 or small longitudinal cohort studies.10 This cross-sectional retrospective study used a demographic projection model and publicly available vital statistics data to estimate the national incidence of parental death due to drugs and firearms overall and by race and ethnicity.
Methods
The Stanford University Institutional Review Board determined that this study did not meet the criteria for human participant research and is thus exempt from review, approval, and the need for informed consent. The Strengthening the Reporting of Observational Studies in Epidemiology (STROBE) reporting guideline was followed. The data, model, assumptions, validation, and sensitivity analyses are briefly described herein. The eMethods in Supplement 1 provides more detailed information. All analyses were performed using R, version 4.2.1 (R Foundation for Statistical Computing). Reproducible code and data are described in eAppendix 1 in Supplement 1.
Data Sources
This modeling analysis used publicly available data from multiple sources: population estimates from the US Census Bureau,11 male fertility rates from the Human Fertility Collection,12 mortality data from the National Center for Health Statistics (NCHS),13 and female fertility rates from the NCHS.14 All datasets contained information from 1990 through 2020, stratified by age, sex, and race and ethnicity.
In addition to the total population, Hispanic, non-Hispanic Black (hereinafter, Black), and non-Hispanic White (hereinafter, White) subgroups were examined. These groupings were selected because they had sufficient sample size when using 1-year age groupings while being consistent with the NCHS bridged-race categories.15 The NCHS bridged-race process collapses 31 race categories into 4 single race categories (American Indian or Alaska Native, Asian, Black, and White), which are used in both the NCHS mortality and fertility datasets.
Statistical Analysis
Estimating Parental Deaths Among Youth
Deaths were aggregated into 1-year age groups (each year from age 0 to 84 years and ending at age ≥85 years) and were identified as drug poisonings, firearm-related, or all other causes. Mortality rates specific to age, sex, and race and ethnicity for drugs and firearms for years 1999 through 2020 were calculated, as well as all-cause mortality rates specific to age, sex, and race and ethnicity for years 1990 through 2020. While 1999 through 2020 is our period of interest, data from 1990 through 1998 were used to initialize the matrix projection model and obtain accurate estimates of the number of children per individual in later years. Data on male fertility rates by age and race and ethnicity were not available and were modeled based on overall and female fertility rates (eMethods in Supplement 1).
Similar to approaches used to estimate familial death due to COVID-19,16,17 a demographic matrix projection model18,19,20 was used to estimate the number and incidence of youth who experienced parental death, defined as the death of at least 1 parent. Briefly, the model uses fertility and mortality rates specific to age, sex, and race and ethnicity to estimate implied populations of surviving children to parents by age. These populations are projected forward in time, incorporating time-varying survival probabilities and fertility rates. The results of the projections are combined with cause-specific death counts to estimate the number and incidence of youth experiencing parental death from 1999 through 2020 by race and ethnicity as well as cause of death. For clarity, incidence is expressed as estimated number of youth affected per 1000 population. While birth and mortality data have no sampling error, uncertainty from the underlying variability of population vital rates and from estimates of male fertility were incorporated using Monte Carlo simulation.
Sensitivity Analysis and Model Validation
A key assumption of the model is that after adjusting for year, age, sex, and race and ethnicity, fertility rates among those who died by drug poisoning or firearms are the same as those who did not. To evaluate the robustness of our results to this assumption, we varied the fertility rate of those who died by drug poisoning or firearms by 25%. This range was selected to represent extreme but plausible values based on survey data (eAppendix 2, eFigure 1, and eTable 1 in Supplement 1). Where possible, estimates from the matrix projection model were validated against survey data. Validation methods are explained in eAppendix 3 in Supplement 1.
Results
Between 1999 and 2020, there were 931 785 drug poisoning deaths and 736 779 firearm-related deaths with a mean (SD) age of 42.6 (16.3) years. Most deaths occurred among males (73.8%; n = 1 231 420) and White decedents (70.8%; N = 1 180 957) followed by Black (17.5%; n = 291 715) and Hispanic (9.5%; n = 159 931) decedents. The modeling analysis estimated that these deaths resulted in 759 000 (95% CI, 722 000-800 000) youth experiencing parental death due to drugs and 434 000 (95% CI, 409 000-460 000) experiencing parental death due to firearms, accounting for 17% of all parental deaths (Figure 1, Figure 2, and the Table).
Figure 1. Estimated Number of Youth Affected by Parental Death Due to Drug Poisoning.

A, Estimated number of youth affected by parental death due to drug poisoning by race and ethnicity, 1999-2020. B, Youth affected by parental death due to drug poisoning per 1000 population by race and ethnicity, 1999-2020. Numbers in thousands of youth less than age 18 years by race and ethnicity, 1999-2020, are listed at the bottom.
Figure 2. Number of Youth Affected by Parental Death Due to Firearms .

A, Estimated number of youth affected by parental death due to firearms by race and ethnicity, 1999-2020. B, Youth affected by parental death due to firearms per 1000 population by race and ethnicity, 1999-2020. Numbers in thousands of youth less than age 18 years by race and ethnicity, 1999-2020, are listed at the bottom.
Table. Estimated Number of Youth Affected by Parental Death Due to Drugs, Firearms, and All Other Causes.
| Race and ethnicitya | 1999 | 2020 | Change in youth affected 1999-2020 | Cumulative youth affected 1999-2020 | ||||||
|---|---|---|---|---|---|---|---|---|---|---|
| Youth affected (95% CI), 1000s | Population <18 y, 1000s | Youth affected per 1000 population (95% CI) | Youth affected (95% CI), 1000s | Population <18 y, 1000s | Youth affected per 1000 population (95% CI) | Absolute increase (95% CI), 1000s | % Increase (95% CI) | Cumulative youth affected (95% CI), 1000s | Cumulative youth affected per 1000 person-years (95% CI) | |
| Estimated youth affected by parental deaths due to fatal drug poisonings | ||||||||||
| Hispanic | 2.5 (2-2.9) | 11 901.6 | 0.21 (0.17-0.25) | 10.9 (10-12) | 18 631.8 | 0.59 (0.54-0.64) | 8.4 (7.9-9.1) | 342.2 (309.9-388.0) | 90.4 (81.6-100.2) | 2.96 (2.67-3.28) |
| Non-Hispanic Black | 3.0 (2.5-3.5) | 11 131.4 | 0.27 (0.22-0.31) | 12.4 (11.5-13.4) | 11 123.7 | 1.12 (1.04-1.20) | 9.4 (9.0-9.9) | 317.1 (283.1-360.6) | 93.5 (85-102.6) | 4.20 (3.82-4.61) |
| Non-Hispanic White | 10.6 (9.6-11.6) | 45 335.1 | 0.23 (0.21-0.26) | 45.8 (43.4-48.4) | 37 778.4 | 1.21 (1.15-1.28) | 35.2 (33.8-36.9) | 332.0 (318.7-352.0) | 528.7 (500-558.4) | 6.36 (6.02-6.72) |
| Total | 16.4 (15.1-17.6) | 71 946 | 0.23 (0.21-0.24) | 72.8 (69.4-76.5) | 72 822.1 | 1.00 (0.95-1.05) | 56.4 (54.3-58.9) | 344.8 (334.3-360.7) | 759.3 (722-799.9) | 5.24 (4.99-5.53) |
| Estimated youth affected by parental deaths due to firearms | ||||||||||
| Hispanic | 2.5 (2.2-2.8) | 11 901.6 | 0.21 (0.18-0.24) | 4 (3.6-4.4) | 18 631.8 | 0.21 (0.19-0.24) | 1.5 (1.4-1.5) | 59.0 (54.2-64.5) | 64.5 (58-71.5) | 2.11 (1.90-2.34) |
| Non-Hispanic Black | 6.3 (5.7-7) | 11 131.4 | 0.56 (0.51-0.63) | 10.8 (10-11.8) | 11 123.7 | 0.97 (0.90-1.06) | 4.5 (4.3-4.8) | 71.5 (68.7-76.1) | 157.9 (144.8-172.5) | 7.09 (6.51-7.75) |
| Non-Hispanic White | 10.0 (9.2-10.9) | 45 335.1 | 0.22 (0.20-0.24) | 11.1 (10.5-11.8) | 37 778.4 | 0.29 (0.28-0.31) | 1.1 (0.9-1.3) | 11.2 (8.3-14.4) | 226.2 (212.7-240.8) | 2.72 (2.56-2.90) |
| Total | 18.0 (16.8-19.3) | 71 946 | 0.25 (0.23-0.27) | 25 (23.6-26.5) | 72 822.1 | 0.34 (0.32-0.36) | 7.0 (6.8-7.2) | 38.6 (37.2-40.5) | 433.7 (409.1-459.8) | 3.00 (2.83-3.18) |
| Estimated youth affected by parental deaths due to other causes | ||||||||||
| Hispanic | 31.2 (28.7-33.8) | 11 901.6 | 2.62 (2.41-2.84) | 69.9 (65.3-74.9) | 18 631.8 | 3.75 (3.50-4.02) | 38.7 (36.6-41.1) | 124.2 (121.7-127.4) | 868 (810.3-928) | 28.43 (26.54-30.39) |
| Non-Hispanic Black | 69.1 (64.5-73.4) | 11 131.4 | 6.21 (5.80-6.59) | 72.6 (69.5-75.7) | 11 123.7 | 6.53 (6.25-6.80) | 3.5 (5.0-2.3) | 5.0 (3.1-7.7) | 1347.9 (1284.9-1412.3) | 60.56 (57.74-63.46) |
| Non-Hispanic White | 158.6 (150.9-166.7) | 45 335.1 | 3.50 (3.33-3.68) | 166.7 (160.2-172.7) | 37 778.4 | 4.41 (4.24-4.57) | 8.1 (9.3-6.0) | 5.1 (3.6-6.2) | 3424.4 (3295.2-3560.2) | 41.20 (39.65-42.84) |
| Total | 265.5 (253.6-277.7) | 71 946 | 3.69 (3.52-3.86) | 328.2 (317.4-340.4) | 72 822.1 | 4.51 (4.36-4.67) | 62.7 (63.8-62.7) | 23.6 (22.6-25.2) | 5916.2 (5708-6134.1) | 40.87 (39.43-42.37) |
The Hispanic, non-Hispanic Black, and non-Hispanic White classifications were selected because they were consistent with the National Center for Health Statistics bridged-race categories, were consistent across both the mortality and fertility datasets, and had sufficient sample size when using 1-year age groupings.
From 1999 through 2020, 755 000 (95% CI, 713 000-799 000) White youth experienced parental death due to drugs or firearms, the largest number of any racial and ethnic group. However, there was substantial variation in the relative burden by race and ethnicity (Table; eTable 2 and eFigure 2 in Supplement 1). For example, in 2020, 2.08 Black youth per 1000 population (95% CI, 1.93-2.26) experienced parental death due to drugs or firearms compared with 1.51 White youth per 1000 population (95% CI, 1.43-1.60) and 0.80 Hispanic youth per 1000 population (95% CI, 0.73-0.88) (eTable 3 and eFigure 2 in Supplement 1). This disparity was primarily attributable to firearms, where 0.97 Black youth per 1000 population (95% CI, 0.90-1.06) experienced parental deaths due to firearms compared with 0.29 White youth per 1000 population (95% CI, 0.28-0.31) and 0.21 Hispanic youth per 1000 population (95% CI, 0.19-0.24) (Figure 2).
The causes of parental death displayed distinct trajectories. The estimated number of children who experienced parental death due to drugs increased across all racial and ethnic groups by 345% (95% CI, 334%-361%) from 1999 through 2020 (Figure 1B). Over the same period, parental deaths due to firearms increased 39% (95% CI, 37%-41%) primarily based on increases among Black youth who experienced consistently higher levels of parental deaths and a marked acceleration beginning in 2014 (Figure 2B). As a result, in 2020, 23% of all parental deaths were due to drugs and firearms, double the proportion compared with 1999 (Table; eTable in Supplement 1). In addition, parental deaths due to all other causes remained stable at approximately 3.5 youth per 1000 population with the exception of the COVID-19 pandemic in 2020 (eFigure 3 in Supplement 1), resulting in an overall increase of 23.6% (95% CI, 22.6%-25.2%) (Table).
Most parental deaths occurred among fathers. In 2020, 0.99 youth per 1000 population (95% CI, 0.93-1.06) experienced the death of a father due to drugs or firearms compared with 0.35 per 1000 population (95% CI, 0.33-0.38) for mothers (Figure 3; eTable 3 and eTable 4 in Supplement 1). Over the entire study period, Black youth were at least twice as likely to experience the death of a father by firearms compared with White youth. For example, in 2020, 0.86 Black youth per 1000 population (95% CI, 0.79-0.95) experienced the death of a father by firearms compared with 0.24 per 1000 population (95% CI, 0.22-0.26) for White youth and 0.18 per 1000 population (95% CI, 0.16-0.21) for Hispanic youth (Figure 3; eTable 3 in Supplement 1).
Figure 3. Youth Affected by the Death of a Father and Mother Due to Drug Poisoning and Firearms.
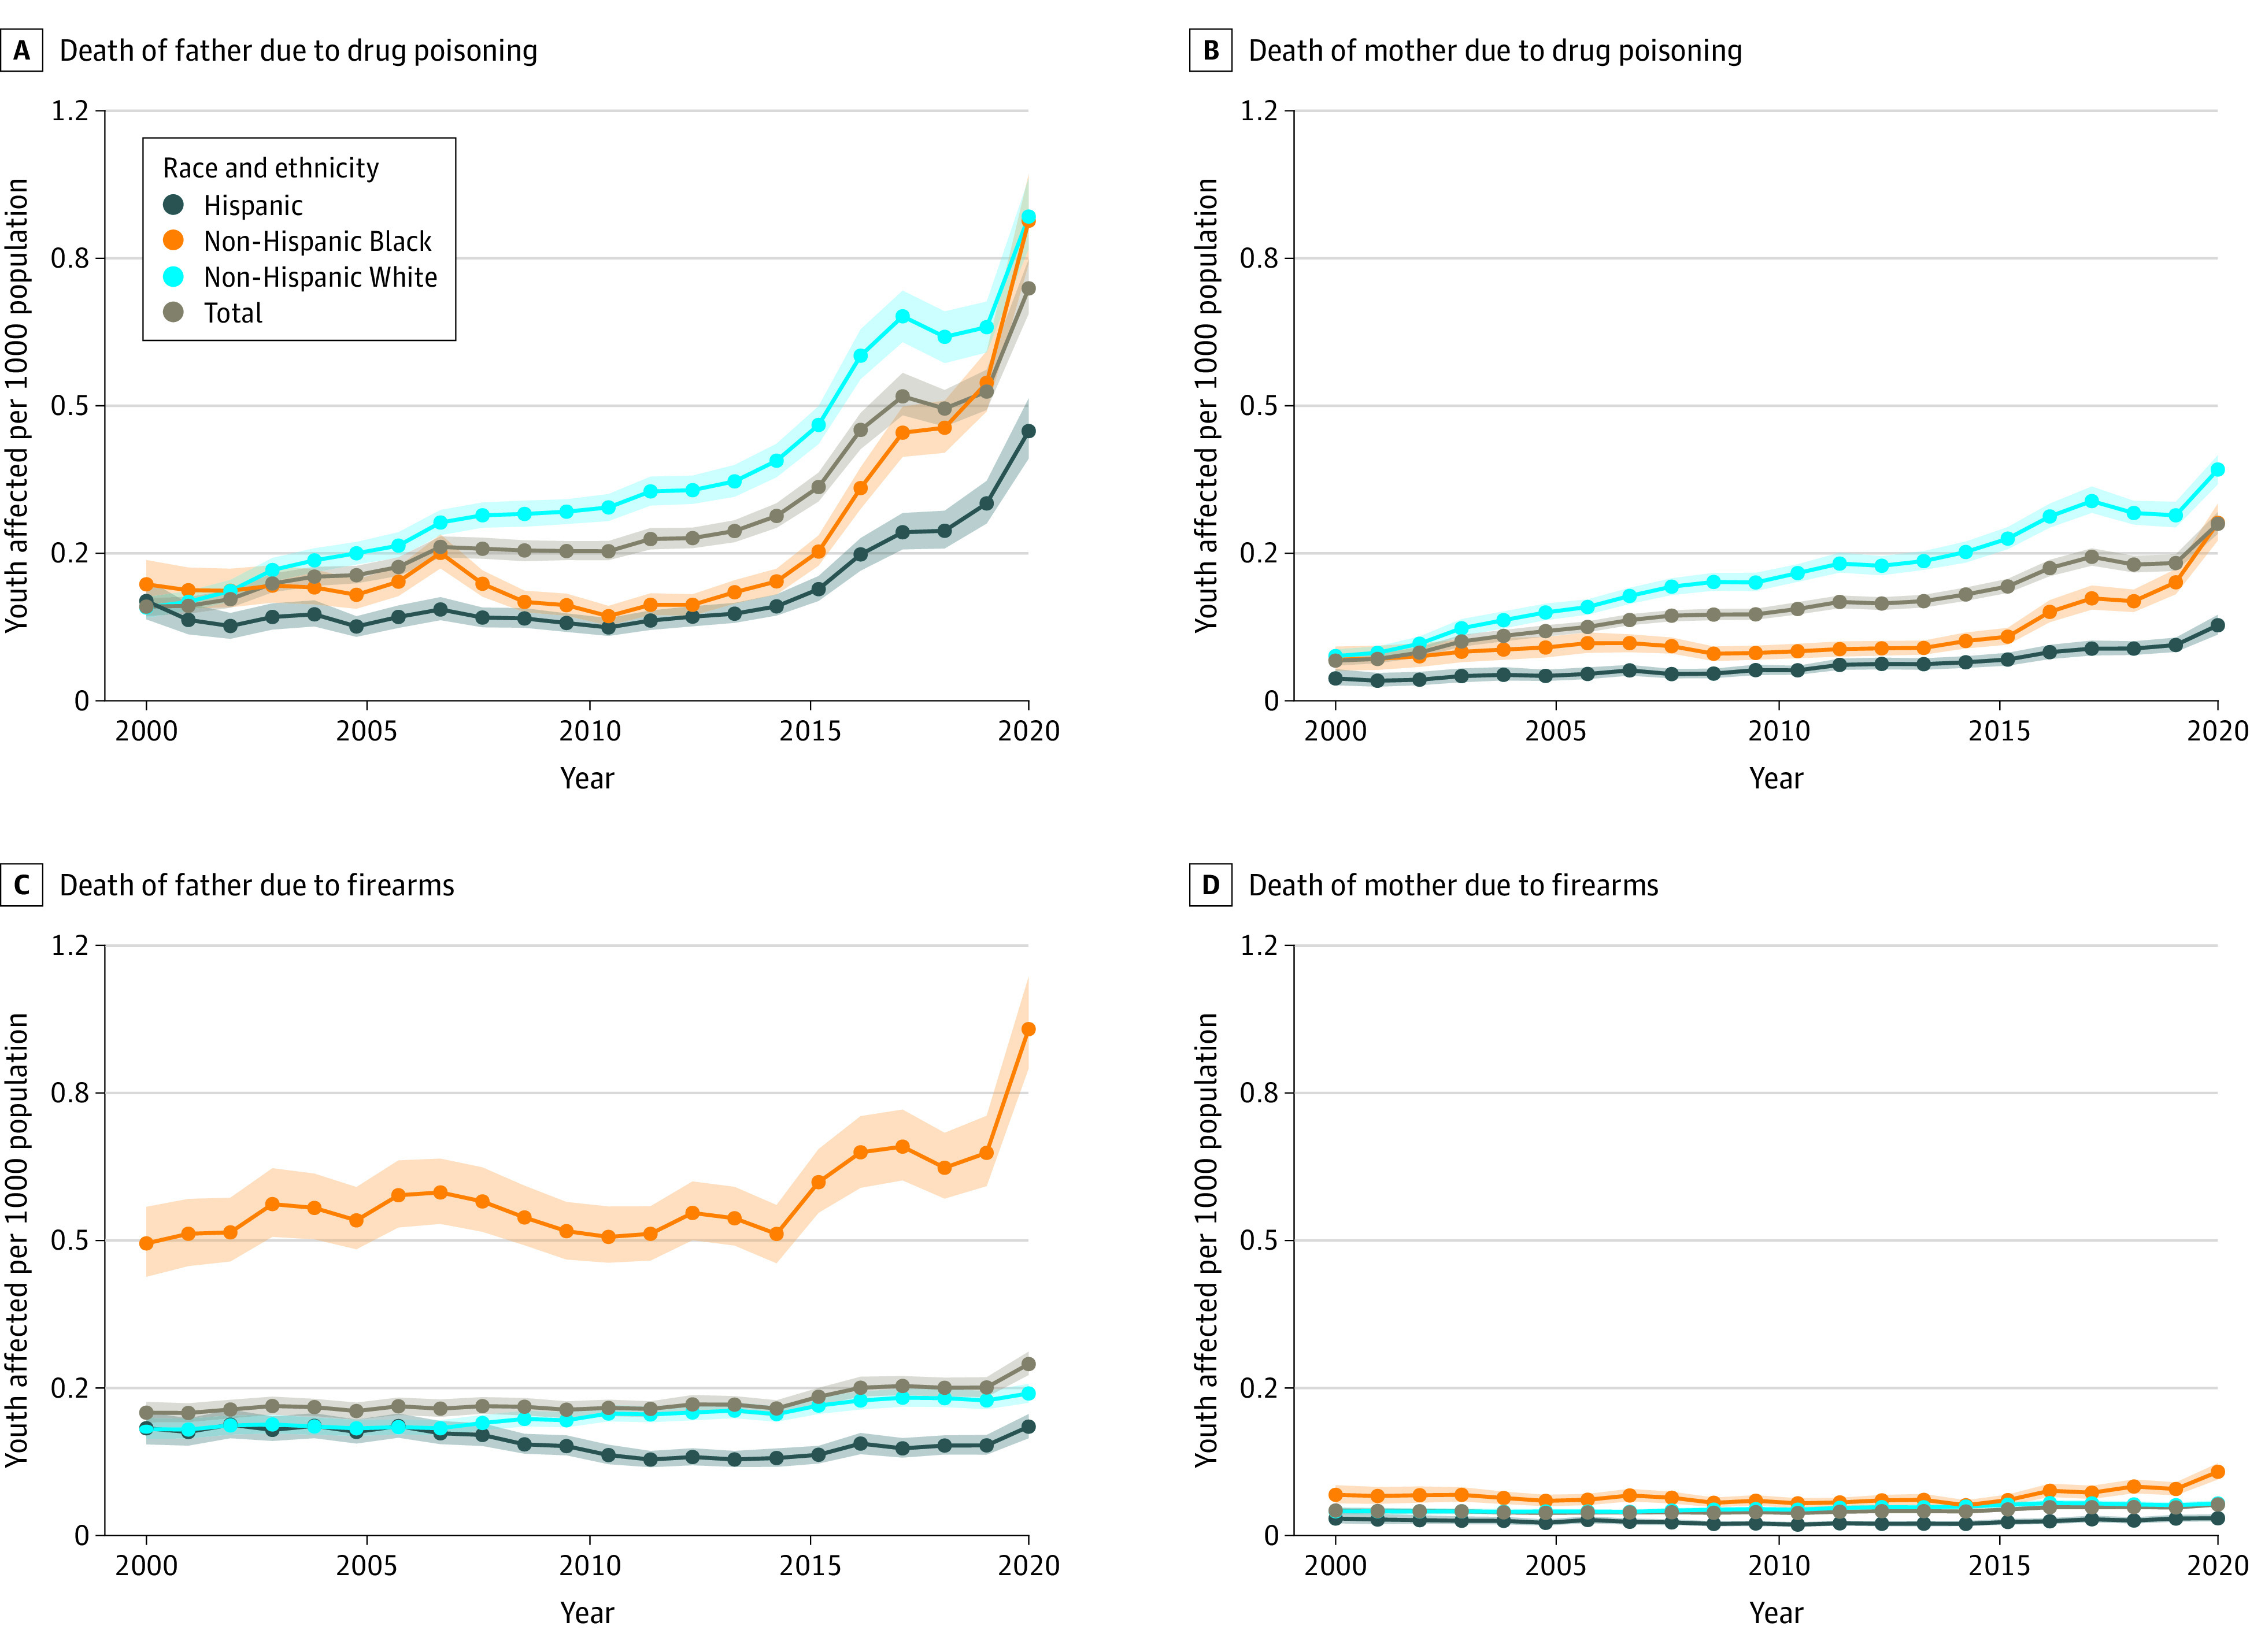
A, Youth affected by the death of a father due to drug poisoning per 1000 population by race and ethnicity, 1999-2020. B, Youth affected by the death of a mother due to drugs per 1000 population by race and ethnicity, 1999-2020. C, Youth affected by the death of a father due to firearms per 1000 population by race and ethnicity, 1999-2020. D, Youth affected by the death of a mother due to firearms per 1000 population by race and ethnicity, 1999-2020.
Sensitivity analyses suggests these results are robust to modeling assumptions about the fertility rate of those who die by drugs and firearms compared with those who die by all other causes (eAppendix 2 in Supplement 1). For example, if those who died by drugs and firearms had 10% lower fertility than those who died by all other causes, the result is an estimated 1.07 million (95% CI, 1.06-1.09 million) youth who have experienced parental death due to drugs or firearms over the study period. Conversely, a 10% higher fertility rate results in an estimated 1.31 million (95% CI, 1.29-1.33 million) (eFigure 5 in Supplement 1). Validation analyses suggests the model is well-calibrated for most race-specific estimates of prevalence of parental death across all causes but may overestimate parental deaths among White youth and underestimate parental death among Black youth in some years (eAppendix 3 and eFigure 6 in Supplement 1).
Discussion
This modeling analysis estimated that 1.19 million children experienced parental death due to drugs or firearms from 1999 through 2020, with these causes accounting for approximately 17% of all parental deaths. In 2020, drugs and firearms accounted for approximately one-quarter of all parental deaths, double the proportion in 1999. Black youth experienced the highest relative burden of parental deaths, primarily because of a higher burden of firearm-related deaths among fathers.
In addition to experiencing an increased risk of death by drugs or firearms,21 youth are now also at high risk of experiencing a parental death by drugs or firearms. This has immediate implications for those children who may require support from mental health services and the foster care system. There are likely also long-term impacts as this generation of youth ages into adulthood. These impacts are unlikely to be distributed uniformly across the population, as deaths by both drugs and firearms are socioeconomically patterned, reflecting the deep history of US gun culture and structural exclusion of groups from opportunities. While both Black and White youth are experiencing high levels of parental death by drugs, Black youth additionally face uniquely high levels of parental deaths by guns, particularly for the deaths of fathers. Parental deaths by these causes are one way health inequities may be transmitted across generations. Estimates of the benefit of interventions to reduce the risk of death by drugs or firearms and their corresponding inequities should consider the additional indirect impact these deaths have on families.
Limitations
This study has several limitations. First, these estimates rely on demographic projections, which assume that after adjusting for age, sex, and race and ethnicity, those who die by drugs and firearms have the same fertility rates as those who do not. In sensitivity analyses, these results were robust to differences in fertility rates between these groups.
Second, fertility data are limited. For example, male fertility rates specific to age and race are not available. Therefore, this study modeled male fertility rates but was unable to validate the estimates. Similarly, multiracial fertility rates were not available; therefore, models in this analysis stratified groupings by single race and ethnicity, which does not accurately reflect the reality of many living in the US.
Third, these results are based on model estimates and direct comparisons with empirical data on parental loss by cause were not available. However, we conducted validation analyses and found the estimates well-calibrated with race-specific estimates of prevalence of parental death across all causes with 2 exceptions. This study’s estimates were lower than survey estimates for early years among Black respondents and consistently higher across all years for White respondents. These differences may represent different target populations or differences in demographic processes not captured by fertility and mortality rates.
Fourth, misclassification of both decedent and youth racial and ethnic identity is possible. Analysis by the NCHS suggests that misclassification for the racial and ethnic groupings examined in this study is minimal.22 This analysis assumed that the racial and ethnic identity of the child matches that of the parent, but some youth may identify as a different race and ethnicity.
Conclusions
Findings of this modeling study suggest that US youth are at high and increasing risk of experiencing parental death by drugs or firearms. Such traumatic events may cause immediate and long-term mental health issues for the affected youth and family members and their communities. Efforts to stem this problem should prioritize averting drug overdoses and firearm violence, especially among structurally marginalized groups.
eMethods. Details of the data sources, Matrix Kinship Model, assumptions, limitations, and incorporating uncertainty.
eAppendix 1. Reproducible Code and Data
eAppendix 2. Assessing the Sensitivity of Our Results to Differences in Fertility Rates
eAppendix 3. Validation of the Model With Empirical Data
eFigure 1. Number of Children Under 18 in the Household Among NSDUH Respondents Who Have Ever Used an Illicit Substance and Those Who Have Never Used an Illicit Substance by Race/Ethnicity and Sex, 2020
eFigure 2. A, Number of Youth Impacted by Parental Death Due to Drugs or Firearms by Race and Ethnicity, 1999-2020. B, Youth Impacted by Parental Death Due to Drug or Firearms per 1,000 Population by Race and Ethnicity, 1999-2020
eFigure 3. A, Number of Youth Impacted by Parental Death Due to All Other Causes by Race and Ethnicity, 1999-2020. B, Youth Impacted by Parental Death due to All Other Causes per 1,000 Population by Race and Ethnicity, 1999-2020.
eFigure 4. Absolute and Number per 1,000 Population of Youth Impacted by Parental Death Due to All Other Causes by Race and Ethnicity and Parent, 1999-2020
eFigure 5. Results of Sensitivity Analysis to Changing Fertility Rate of Those Who Die by Drugs or Firearms
eFigure 6. Validation of Our Estimates to the National Survey on Children’s Health, 2016-2020
eTable 1. Number of Children Under 18 in the Household Among NSDUH Respondents Who Have Ever Used an Illicit Substance and Those Who Have Never Used an Illicit Substance
eTable 2. Youth Experiencing Parental Death Due to Drugs or Firearms
eTable 3. Youth Experiencing the Death of a Father Due to Drugs, Firearms, and All Other Causes
eTable 4. Youth Experiencing the Death of a Mother Due to Drugs, Firearms, and All Other Causes
eReferences
Data Sharing Statement
References
- 1.US Centers for Disease Control and Prevention . National Center for Health Statistics mortality data on CDC WONDER. April 4, 2024. Accessed April 23, 2024. https://wonder.cdc.gov/mcd.html
- 2.Goldstick JE, Cunningham RM, Carter PM. Current causes of death in children and adolescents in the United States. N Engl J Med. 2022;386(20):1955-1956. doi: 10.1056/NEJMc2201761 [DOI] [PMC free article] [PubMed] [Google Scholar]
- 3.Patterson SE, Verdery AM, Daw J. Linked lives and childhood experience of family death on educational attainment. Socius. 2020;6:2378023120975594. doi: 10.1177/2378023120975594 [DOI] [PMC free article] [PubMed] [Google Scholar]
- 4.Miller GE, Chen E, Parker KJ. Psychological stress in childhood and susceptibility to the chronic diseases of aging. Psychol Bull. 2011;137(6):959-997. doi: 10.1037/a0024768 [DOI] [PMC free article] [PubMed] [Google Scholar]
- 5.Pham S, Porta G, Biernesser C, et al. The burden of bereavement. Am J Psychiatry. 2018;175(9):887-896. doi: 10.1176/appi.ajp.2018.17070792 [DOI] [PMC free article] [PubMed] [Google Scholar]
- 6.Shonkoff JP, Slopen N, Williams DR. Early childhood adversity, toxic stress, and the impacts of racism on the foundations of health. Annu Rev Public Health. 2021;42(1):115-134. doi: 10.1146/annurev-publhealth-090419-101940 [DOI] [PubMed] [Google Scholar]
- 7.Hayward MD, Gorman BK. The long arm of childhood: the influence of early-life social conditions on men’s mortality. Demography. 2004;41(1):87-107. doi: 10.1353/dem.2004.0005 [DOI] [PubMed] [Google Scholar]
- 8.Umberson D, Olson JS, Crosnoe R, Liu H, Pudrovska T, Donnelly R. Death of family members as an overlooked source of racial disadvantage in the United States. Proc Natl Acad Sci U S A. 2017;114(5):915-920. doi: 10.1073/pnas.1605599114 [DOI] [PMC free article] [PubMed] [Google Scholar]
- 9.Umberson D. Black deaths matter. J Health Soc Behav. 2017;58(4):405-420. doi: 10.1177/0022146517739317 [DOI] [PMC free article] [PubMed] [Google Scholar]
- 10.Hulsey EG, Li Y, Hacker K, Williams K, Collins K, Dalton E. Potential emerging risks among children following parental opioid-related overdose death. JAMA Pediatr. 2020;174(5):503-504. doi: 10.1001/jamapediatrics.2020.0613 [DOI] [PMC free article] [PubMed] [Google Scholar]
- 11.Centers for Disease Control and Prevention . US census populations with bridged race categories. 2021. Accessed April 15, 2023. https://wonder.cdc.gov/bridged-race-population.html
- 12.Human Fertility Collection . Data by country. Accessed March 25, 2024. https://www.fertilitydata.org
- 13.Centers for Disease Control and Prevention, National Center for Health Statistics . National Vital Statistics System, Natality on CDC WONDER Online Database. Accessed March 25, 2024. https://wonder.cdc.gov/mcd-icd10.html
- 14.Centers for Disease Control and Prevention, National Center for Health Statistics . National Vital Statistics System, Natality on CDC WONDER Online Database. Accessed April 15, 2023. https://wonder.cdc.gov/natality-expanded-current.html
- 15.Ingram DD, Parker JD, Schenker N, et al. United States Census 2000 population with bridged race categories. Vital Health Stat 2. 2003;(135):1-55. [PubMed] [Google Scholar]
- 16.Snyder M, Alburez-Gutierrez D, Williams I, Zagheni E. Estimates from 31 countries show the significant impact of COVID-19 excess mortality on the incidence of family bereavement. Proc Natl Acad Sci U S A. 2022;119(26):e2202686119. doi: 10.1073/pnas.2202686119 [DOI] [PMC free article] [PubMed] [Google Scholar]
- 17.Verdery AM, Smith-Greenaway E, Margolis R, Daw J. Tracking the reach of COVID-19 kin loss with a bereavement multiplier applied to the United States. Proc Natl Acad Sci U S A. 2020;117(30):17695-17701. doi: 10.1073/pnas.2007476117 [DOI] [PMC free article] [PubMed] [Google Scholar]
- 18.Caswell H. The formal demography of kinship. Demogr Res. 2019;41:679-712. doi: 10.4054/DemRes.2019.41.24 [DOI] [Google Scholar]
- 19.Caswell H, Song X. The formal demography of kinship III. Demogr Res. 2021;45:517-546. doi: 10.4054/DemRes.2021.45.16 [DOI] [Google Scholar]
- 20.Caswell H. The formal demography of kinship IV. Demogr Res. 2022;47:359-396. doi: 10.4054/DemRes.2022.47.13 [DOI] [Google Scholar]
- 21.Woolf SH, Wolf ER, Rivara FP. The new crisis of increasing all-cause mortality in US children and adolescents. JAMA. 2023;329(12):975-976. doi: 10.1001/jama.2023.3517 [DOI] [PubMed] [Google Scholar]
- 22.Arias E, Heron M. The validity of race and Hispanic-origin reporting on death certificates in the United States: an update. Vital Health Stat 2. 2016;(172):1-21. [PubMed] [Google Scholar]
Associated Data
This section collects any data citations, data availability statements, or supplementary materials included in this article.
Supplementary Materials
eMethods. Details of the data sources, Matrix Kinship Model, assumptions, limitations, and incorporating uncertainty.
eAppendix 1. Reproducible Code and Data
eAppendix 2. Assessing the Sensitivity of Our Results to Differences in Fertility Rates
eAppendix 3. Validation of the Model With Empirical Data
eFigure 1. Number of Children Under 18 in the Household Among NSDUH Respondents Who Have Ever Used an Illicit Substance and Those Who Have Never Used an Illicit Substance by Race/Ethnicity and Sex, 2020
eFigure 2. A, Number of Youth Impacted by Parental Death Due to Drugs or Firearms by Race and Ethnicity, 1999-2020. B, Youth Impacted by Parental Death Due to Drug or Firearms per 1,000 Population by Race and Ethnicity, 1999-2020
eFigure 3. A, Number of Youth Impacted by Parental Death Due to All Other Causes by Race and Ethnicity, 1999-2020. B, Youth Impacted by Parental Death due to All Other Causes per 1,000 Population by Race and Ethnicity, 1999-2020.
eFigure 4. Absolute and Number per 1,000 Population of Youth Impacted by Parental Death Due to All Other Causes by Race and Ethnicity and Parent, 1999-2020
eFigure 5. Results of Sensitivity Analysis to Changing Fertility Rate of Those Who Die by Drugs or Firearms
eFigure 6. Validation of Our Estimates to the National Survey on Children’s Health, 2016-2020
eTable 1. Number of Children Under 18 in the Household Among NSDUH Respondents Who Have Ever Used an Illicit Substance and Those Who Have Never Used an Illicit Substance
eTable 2. Youth Experiencing Parental Death Due to Drugs or Firearms
eTable 3. Youth Experiencing the Death of a Father Due to Drugs, Firearms, and All Other Causes
eTable 4. Youth Experiencing the Death of a Mother Due to Drugs, Firearms, and All Other Causes
eReferences
Data Sharing Statement