

Abstract

Cellular function is controlled through intricate networks of signals, which lead to the myriad pathways governing cell fate. Fluorescent biosensors have enabled the study of these signaling pathways in living systems across temporal and spatial scales. Over the years there has been an explosion in the number of fluorescent biosensors, as they have become available for numerous targets, utilized across spectral space, and suited for various imaging techniques. To guide users through this extensive biosensor landscape, we discuss critical aspects of fluorescent proteins for consideration in biosensor development, smart tagging strategies, and the historical and recent biosensors of various types, grouped by target, and with a focus on the design and recent applications of these sensors in living systems.
1. Introduction
A single cell contains countless proteins and molecules that are constantly changing in response to extra- and intracellular cues. The interactions between cells within a tissue add layers of complexity to the signaling networks maintaining a dynamic equilibrium between and within cells. These heterogeneous signaling networks are organized and regulated across multiple spatial and temporal scales, intensifying their complexity. Dissecting the signaling activities that underlie cellular functions in healthy and diseased states is crucial to expanding our knowledge and understanding of cellular biology.
Our knowledge of cellular biology has been shaped by a multitude of technical advances over the last several decades. Many landmark discoveries were achieved using powerful biochemical and sequencing technologies that capture detailed snapshots of cellular events. But as our appreciation of the inherently dynamic and heterogeneous nature of cellular behavior has grown, so has the need for more sophisticated tools capable of precisely monitoring the intricate molecular dance occurring within and between cells. With the discovery of fluorescent proteins, a completely new field emerged which enabled researchers to visualize the real-time dynamics of various analytes, macromolecules, and biochemical activities with spatiotemporal precision in single living cells. The subsequent expansive engineering efforts targeting fluorescent proteins have yielded a vast suite of labeling and biosensing tools that enrich our understanding of the complex systems at work within cells, leveraging the power of live-cell fluorescence microscopy methods to offer deeper insights than previously achievable.
With this review, we aim to provide a comprehensive overview of fluorescent biosensors (the term biosensor is used throughout this review interchangeably with the terms sensor, reporter, probe, and indicator) and their utility as engineered tools to probe cellular biology, with an emphasis on cutting-edge applications and emerging areas of improvement and research. We start with a description of the properties of fluorescent proteins which have been engineered to enhance their utility as molecular tools. Reflecting the evolution of the field, the design of fluorescent protein-based labels and biosensors as well as their corresponding applications with increasingly innovative strategies are discussed. Briefly, we describe applications of fluorescent proteins as smart labels, which involve harnessing the intrinsic properties of various fluorescent proteins to observe the behavior of a molecular target. Furthermore, we provide a comprehensive overview of the design and use of genetically encoded, fluorescent protein-based biosensors (for a comprehensive list, visit biosensordb.ucsd.edu), which are engineered molecular tools whose fluorescence properties alter in response to the detection of distinct molecular species or biochemical activities, thereby allowing us to monitor signaling dynamics in living cells. Notable biological findings obtained using these tools are also highlighted. Finally, avenues and opportunities for enhancing available tools and addressing gaps in the field are discussed.
2. Passive Sensors Go Smart
For the initial discovery of Aequorea victoria green fluorescent protein (GFP) in 1962, the groundbreaking demonstration of GFP as a genetically encoded fluorescent label in 1994,1,2 and the subsequent molecular engineering of GFP variants, Drs. Osamu Shimomura, Martin Chalfie, and Roger Y. Tsien were awarded the 2008 Nobel Prize in Chemistry. Since then, numerous fluorescent proteins (FPs) with distinct properties have been derived from this initial template. The discovery of new FPs from diverse marine organisms has further expanded the palette available for modification. In the simplest application, an FP is fused to a protein of interest (POI) as a passive label that allows us to visualize the presence and location of the tagged POI within a cell. In this way, the intrinsic fluorescence of an FP is visualized and tracked to infer certain behaviors of the tagged POI with high spatial and temporal resolution. While such passive sensors were originally conceived to monitor protein expression, mobility, or localization in live cells, their utility has been greatly extended with the engineering of scores of FPs that exhibit a diverse range of spectral and photochemical properties, including brightness, color, and photostability (a glossary of FP-related terms can be found on FPbase, https://help.fpbase.org/glossary).3 The novel properties of these engineered FPs are readily manipulated in the experimental setting, thus allowing FPs to also serve as smart labels, to gain deeper insights into the behaviors of labeled proteins. Below, we provide a brief overview of the various properties that have been engineered to increase the utility of FPs and drive the development of the molecular tools discussed throughout this review. Specific applications of FPs as passive and smart labels, and the fascinating biological insights they have provided, are also highlighted.
2.1. Properties of Fluorescent Proteins
A combination of structural, chemical, and biophysical features allows FPs to efficiently absorb and emit light. By carefully and systematically studying FP behavior, researchers have been able to harness and manipulate these features to engineer myriad FP variants with distinct functional properties. In this section, we introduce the diverse spectral, photophysical, photochromic, chemical, and structural properties that characterize the FP toolkit.
2.1.1. Spectral Properties
GFP and related FPs form their chromophore through a post-translational covalent reaction among amino acids 65, 66, and 67 (numbered according to Aequorea victoria GFP), which confer fluorescence to the protein without requiring additional cofactors or enzymes.4 This chromophore is surrounded by a β-barrel consisting of 11 strands. The residues neighboring the chromophore and those that are enclosed within the β-barrel are crucial to defining the chromophore environment, which in turn affects the fluorescent properties of the FP. For instance, molecular oxygen is required for chromophore formation, and so a hypoxic environment can hinder FP fluorescence. The chromophore environment of an FP can also shield it from external factors that can quench fluorescence of the chromophore.5,6 Residues within the chromophore environment can also participate in a hydrogen bond network that stabilizes the chromophore and can impact FP emission.7,8 Mutation of chromophore residues in GFP, which peaks in emission at 509 nm, have enabled researchers to spectrally tune the FP fluorescence, yielding blue (440–470 nm emission), cyan (470–500 nm emission), and yellow (510–540 nm emission) FPs.9 However, the discovery of other naturally occurring FPs, such as the red FP DsRed from Discosoma coral,10 which peaks in fluorescence emission at 583 nm, was necessary for the generation of FPs spanning a rainbow of colors.11 Recent efforts to diversify FP spectral properties have focused on shifting FP excitation and emission spectra to far red-, with emission between 640–700 nm, or near-infrared (NIR) wavelengths, with emission at >700 nm, to both minimize spectral overlap with existing FPs and enhance light penetration in living tissue, thus enabling greater compatibility with multiplexed and in vivo imaging applications. Some far-red FPs, such as TagRFP65712 and TagRFP658,13 were derived from the GFP-like eqFP578 protein from the sea anemonae Entacmaea quadricolor.14 The characterization of bacterial phytochromes (BphPs), which require an extrinsic chromophore15 (discussed further in section 2.1.6), enabled the further expansion of NIR-FPs.
While maximizing spectral separation is often desirable, the availability of spectrally diverse FPs also enables tagging approaches that take advantage of overlap between color variants. Notably, when the emission spectrum of one FP overlaps sufficiently (>30%) with the absorption spectrum of another FP, the two can engage in Förster (or fluorescence) resonance energy transfer (FRET) where excited-state energy is transferred from the first FP (donor) to the second FP (acceptor). Energy transfer occurs nonradiatively via dipole–dipole interactions and is thus exquisitely sensitive to the proximity and orientation of the donor and acceptor fluorophores, as summarized in the following equation
where E is FRET efficiency, r is the distance between the donor and acceptor, and R0 is the distance at which a given donor/acceptor pair exhibits half-maximal FRET efficiency (also known as the Förster distance). The value of R0 accounts for factors such as the spatial orientation of the donor and acceptor dipoles, as well as their spectral overlap, and is characteristic to each unique donor/acceptor pair. Importantly, FRET occurs at scales of 10–100 Å (1–10 nm), making it a powerful molecular ruler.16,17 This distance-dependence has inspired the use of FRET-compatible FP pairs for multiple applications, most notably to visualize and monitor protein–protein interactions (PPIs) and to generate genetically encoded biosensors, as detailed later on in this review.
2.1.2. Photophysical Properties
Beyond simply expanding the color palette of available FPs by tuning their excitation/emission spectra, FP engineering can influence an array of photochemical properties, including chromophore maturation, brightness, and photostability, to suit different applications. Chromophore maturation denotes the time required for the FP chromophore to covalently form and become capable of fluorescence emission. Chromophore maturation requires molecular oxygen (O2), and mutations that alter chromophore structure and its accessibility to O2 via changes to the chromophore environment can therefore affect maturation times.18,19 Maturation time is a key factor for optimizing the use of FPs in the live-cell context. Maturation half-times of 40 min to 1–2 h are suitable for passive labeling applications. However, faster maturation may be necessary in specific applications, such as to detect early promoter activation or to label proteins with rapid turnover.20
Timer FPs are a category of FPs that exploit the process of chromophore maturation resulting in time-dependent altered spectral properties. Timer FPs spontaneously change their emission spectra over certain periods of time. For instance, DsRed-E5 initially matures into a green-emitting species but spontaneously converts to a red-emitting species over time, independent of protein concentration.21 This allows for labeling targets with a timer of expression. Building on DsRed, mCherry fluorescent timers were developed that change from blue to red emission.22 Three mCherry timers were generated that undergo fast, medium, and slow color conversion (half times of 3.9, 7.1, and 28 h respectively). Timer FPs are thus useful labels that indicate time in the live-cell context.
A major property that defines FP performance across diverse contexts is brightness, which has been a distinct focus of the field when generating new FPs. The intrinsic brightness of an FP is the product of its extinction coefficient and fluorescence quantum yield. The extinction coefficient summarizes how efficiently light of a certain wavelength is absorbed by the FP chromophore, whereas quantum yield relates how efficiently the chromophore converts absorbed light into emitted light (i.e., fluorescence).23 These two properties can be tuned by introducing mutations that may affect the chromophore structure or molecular brightness of the FP.24 Of note, the quantum yields reported for FPs are typically averaged over bright and dark FP states.25−27 Haarscboch et al. reported that the bright-state quantum yields of several red FPs were higher than previously reported, due to the inclusion of the dark states in past measurements, which made up a considerable fraction of the total FPs.28 Other factors can also affect the apparent brightness of FPs in the experimental context, such as in live cells. For instance, a recent approach to developing brighter FPs aimed to improve the folding efficiency of EGFP to allow better solubility in the live-cell context and thereby enhance brightness. These efforts resulted in the generation of mGreenLantern, a green-emitting FP with 6-fold brighter fluorescence emission than EGFP, but similar quantum yield.29
Photostability is another important consideration, as frequent or high-intensity exposure to excitation light can lead to photobleaching, or a loss of fluorescence.30 Often, there is a trade-off between FP brightness and photostability, as alterations to the chromophore that increase brightness can inversely affect chromophore decomposition.31,32 Achieving high brightness and photostability has therefore been a goal of the field. The expansion of fast-maturing, bright, and high-quantum-yield FPs, like mScarlet333 or StayGold31 and its variants (mStayGold34 and mBaojin35), will be integral to furthering the development of FP-based tools that are improved in quality and performance.
2.1.3. Photochromism
Photochromism refers to the ability of a chromophore to switch between two forms upon irradiation, either reversibly or irreversibly.36 On a molecular level, altered conformation of the methylene bridge between two rings of the FP chromophore (cis–trans or trans–cis isomerization) can lead to photoswitching.37 Residues around the chromophore are responsible for stabilizing one conformation over the other and may contribute to the isomerization process as well. Photochromism has been exploited in the development of FPs that exhibit changing spectral properties upon exposure to light of different wavelengths, such as Dronpa and UnaG. FP photochromism can manifest as photoactivation, photoconversion, or photoswitching depending on how the chromophore is affected by light.37 Photoactivatable FPs increase in fluorescence upon exposure to a certain wavelength of light, and photoconvertible FPs change their emission wavelength (i.e., color) upon exposure to a specific wavelength of light. Photoswitchable FPs, on the other hand, reversibly switch between emitting (bright or “on”) or nonemitting (dark or “off”) states upon exposure to specific wavelengths of light. These photochromic behaviors have been integral to the application of FPs in super-resolution microscopy techniques.38
Advances in super-resolution microscopy techniques, for which Drs. Eric Betzig, Stefan W. Hell, and William E. Moerner were awarded the Nobel Prize in Chemistry in 2014, have coevolved with new FPs to enable fluorescence imaging past the diffraction limit. Many of these techniques exploit photochromic FPs, such as those that undergo photoactivation, to achieve super-resolution imaging.39 Briefly, super-resolution fluorescence microscopy relies upon photostable and bright FPs due to the high illumination intensity often required for these techniques. Reversibly photoswitchable FPs, such as Dronpa, mEos, or the newer monomeric Skylan-NS,40 have proven indispensable for many super-resolution imaging techniques, as these FPs allow for lower illumination intensity while still achieving super-resolution by taking advantage of the distinct fluorescent states of these FPs. Two revolutionary methods for improving the resolution of fluorescence microscopy have laid the groundwork for many newer super-resolution microscopy techniques: patterned illumination, such as stimulated emission depletion (STED), and single molecule localization microscopy (SMLM).41 For SMLM-based techniques in particular, photoactivatable or photoswitchable FPs are crucial for achieving live-cell imaging, as this method relies on image reconstruction based on photoswitching of the fluorophore. For instance, SOFI, or stochastic optical fluctuation imaging, was developed to take advantage of spontaneous blinking of some fluorophores to reconstruct super-resolution images.42 PALM, or photoactivated localization microscopy, is another method that localizes single fluorophores by inducing rounds of fluorescence activation in a densely labeled region of the cell.38,43 Such techniques have enabled the characterization of previously undefined organellar structures and processes,44−48 protein–protein and protein–RNA interactions,49−51 and biochemical activity.52 The ever-expanding palette of FPs will contribute to innovative developments in super-resolution microscopy that can enhance the spatiotemporal resolution of biochemical and biomolecular imaging in live cells.
2.1.4. Chemical Properties
FPs have been further engineered to achieve variable chemical properties. One major adjustment to an intrinsic property of FPs was the development of monomeric FPs, as many FPs tend to dimerize or oligomerize. For instance, DsRed exhibits strong oligomerization and exists as an obligate tetramer in vitro,53 which greatly hinders its biological utility. The development of a monomeric red fluorescent protein (mRFP1)54 derived from DsRed greatly enhanced the biological application of red FPs. Monomeric FPs are useful for applications where protein aggregation may impact results, such as when labeling dimeric or oligomeric targets. Many FPs also exhibit sensitivity to environmental factors such as pH and temperature. These properties have been exploited to develop sensors of pH or temperature utilizing the inherent sensitivity of certain FPs to these conditions (discussed in section 4). There are also consistent efforts to develop new FP variants with reduced sensitivity to environmental factors. For instance, tdLanYFP55 is a new yellow-emitting FP that is significantly less sensitive to pH than existing YFPs.
2.1.5. Structural Modification of FPs
In addition to tuning spectral, photophysical, and chemical properties of FPs, several groups have introduced complex structural modifications that broaden the applicability of FPs as tools to probe cellular biology. One major example of this is the development of circularly permuted FPs (cpFPs), which were first developed by the Tsien lab.56 Baird and colleagues showed that linking the original N- and C- termini using a short linker and introducing new N- and C-termini within the seventh β-strand did not disrupt GFP fluorescence. The resulting cpGFP could also be fused to proteins of interest at various positions on the FP barrel, wherein conformational changes in the protein of interest altered GFP fluorescence. Such structural rearrangements resulted in the development of an FP that can reflect changes in the fused protein of interest, serving as a biochemical indicator. This inspired many cpFPs encompassing the spectral rainbow57−59 that have been incorporated in the development of fluorescent biosensors,60−63 some of which will be discussed later in this review.
Another important modification to FP structure has been the development of split FPs for applications involving nonspontaneous fragment complementation. In such systems, the FP is divided into two fragments that are individually nonfluorescent and cannot reassemble on their own but will fully reconstitute and gain fluorescence when brought into sufficient proximity. The recovery of fluorescence therefore indicates an interaction between the two components, making split FPs suitable for use in bimolecular fluorescence complementation (BiFC) assays to detect protein–protein interactions (PPIs) (discussed in section 2.2.2). Ghosh and colleagues first introduced a nonspontaneously complementing FP system by splitting GFP into two fragments, one comprising the first 158 residues, and the other comprising residues 158–238.64 When brought into proximity by a pair of interacting proteins, the two GFP fragments successfully reassembled, resulting in fluorescence (Figure 1a). Similar nonspontaneously complementing split FPs have since been developed that span most of the visible spectrum,65 including the recent development of an orange BiFC assay using the Kusabira-Orange FP, mKO2.66 Spontaneously complementing split FPs are another example of a structural modification that expands the utility of FPs. These FPs are engineered to split the FP β-barrel between the 10th and 11th strands (N-terminal strands 1–10, C-terminal 11th strand) resulting in two nonfluorescent fragments that can spontaneously reassemble into an intact FP67−71 (Figure 1b). Because of their relatively efficient self-assembly, this class of spontaneously complementing split FPs is usually used to monitor protein expression, solubility, localization, or trafficking in cells, rather than to report on PPIs.70 Inspired by these designs, a tripartite fluorescence complementation (TriFC) assay was developed to create a new nonspontaneously complementing split FP system. For TriFC, GFP is split into three parts: β-strands 1–9, 10, and 11. On their own, neither GFP10 nor GFP11 spontaneously reconstitutes with GFP1–9, but when the two strands are brought into molecular proximity by interactions between their tagged POIs, they will recruit and reconstitute with untagged GFP1–9,72 whereupon Glu222, in the GFP11 strand, can catalyze chromophore maturation73 (Figure 1c). The fluorescence signal of the TriFC system was improved in 2020 by fusion of strand 11 to strands 1–9 to generate a bipartite system that enhanced signal-to-noise ratio.74
Figure 1.
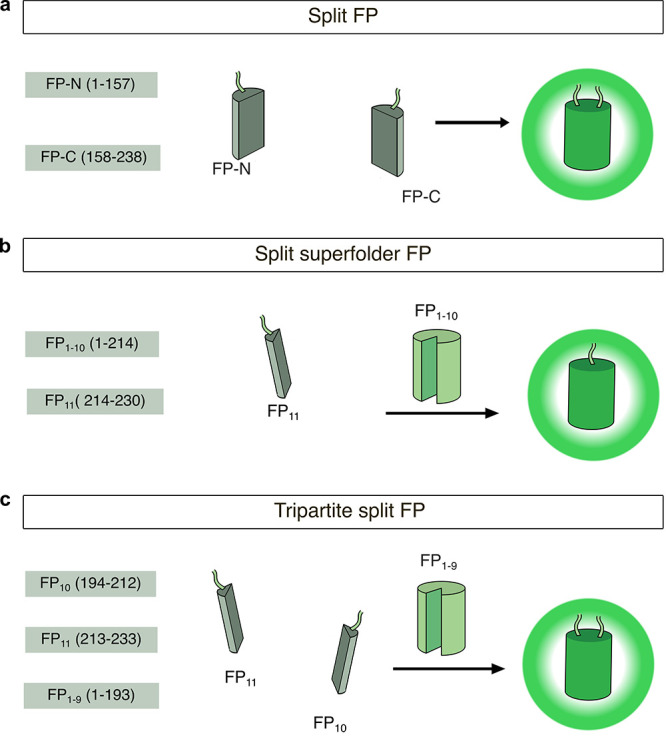
Structural modifications of FPs. (a) In the split FP system, N- and C-terminal fragments of the FP (FP-N and FP-C, respectively) are split at residue 158 and reconstitute when in proximity to one another in a nonspontaneous manner. (b) In the split superfolder FP system, FP strands 1–10 (FP1–10) and strand 11 (FP11) are split and spontaneously reconstitute. (c) In the tripartite split FP system, the FP is split into three parts: FP strands 1–9 (FP1–9), strand 10 (FP10), and strand 11 (FP11). Upon interaction of FP10 and FP11, both strands reconstitute with FP1–9.
2.1.6. Alternative Labels Beyond GFP-like FPs
The conventional FP includes an endogenously fluorescent chromophore, and several such naturally occurring FPs have been leveraged to generate labels exhibiting a wide range of spectral, chemical, and photophysical properties. However, additional labels exist beyond the FPs we have thus far discussed. As hybrid and semisynthetic approaches to biosensor engineering are expanding, we will briefly touch on some of these alternative labels in this section. More in-depth discussions of these approaches are available in other reviews in this special issue.
As mentioned in section 2.1.1, the characterization of bacterial phytochrome photoreceptors (BphPs), which require an extrinsic cofactor to confer fluorescence,15 led to expansion of the FP palette in the NIR direction.75 These BphP-based FPs use biliverdin (BV), a red-shifted chromophore that is present at low levels endogenously in mammalian cells, as a cofactor which covalently binds to and stabilizes the BphP structure. The palette of NIR-FPs which were developed using BV-binding FPs, such as mIFP, miRFP, and emiRFP variants, have enabled whole-body and deep-tissue imaging of up to two targets in vivo.76
Chemigenetic labels are another type of fluorescent label rapidly expanding in use. Chemigenetic labels include a self-labeling protein that is nonfluorescent on its own but which can be labeled by a small-molecule fluorophore to become fluorescent. The first example of a chemigenetic label was introduced in 1998 by the Tsien lab, where 4′,5′-bis(1,3,2-dithioarsolan-2-yl)fluorescein was used to label a tetracysteine domain.77 This was followed by several other chemigenetic labels, including SNAP-tag,78,79 FAST,80 TMP/eDHFR tag,81 and the broadly used Halo-tag.82 Compared to fluorescent proteins, chemigenetic labels provide greater versatility. The self-labeling protein can be made to fluoresce in different colors by using synthetic fluorophores with variable spectral properties. These labels also overcome classical limitations in FPs, such as low photostability, pH sensitivity, and the oxygen requirement for chromophore maturation. Thus, chemigenetic labels like Halo-tag are rapidly being adapted for use as labels and in biosensors,83 although the details of these applications are beyond the scope of this review.
Bioluminescence has emerged as another light emission-based tool for the study of cellular biology. Bioluminescent molecules emit light through biochemical means, wherein a luciferase enzyme can oxidize its luciferin substrate to achieve the excited state, resulting in the emission of a photon upon return of the luciferin to its ground state.84 One of the first characterized luciferases, Firefly luciferase, was isolated from bioluminescent beetles.85 Much like FPs, bioluminescent molecules can undergo resonance energy transfer (bioluminescence resonance energy transfer or BRET), which has been instrumental to their use in biosensors. Unlike FPs, bioluminescent proteins do not need excitation light to emit fluorescence. Thus, bioluminescent tools avoid phototoxicity and autofluorescence, which are some limitations of fluorescence-based tools. However, naturally occurring bioluminescent molecules tend to exhibit much lower brightness than FPs. Mirroring the engineering of FPs, brighter variants of luciferases and novel substrates occupying different spectral spaces have been engineered. Improvements in stability and signal in these systems have been achieved in part by the isolation and mutagenesis of various luciferases from naturally occurring bioluminescent species, such as NanoLuc from Oplophorus gracilirostris(86) and RLuc8 from Renilla reniformis(87) with their respective luciferins. The use of bioluminescence for labeling and biosensing approaches have been extensively reviewed elsewhere.88,89
The expansion of alternative fluorescent labeling approaches beyond the GFP-like FP have enabled the development of hybrid biosensors which combine alternative labeling approaches, like chemigenetic labels, with an FP. While these hybrid sensors are out of the scope of this review, they will contribute to expanding the capabilities and applications of fluorescent biosensors.90
Ultimately, such engineering innovations have made FPs valuable tools in the development and application of pioneering technologies. The development of a rainbow of FPs, including far-red and NIR FPs, has enabled both multiplexed and in vivo imaging. Furthermore, the development of FPs with unique photochemical properties, such as photoswitchable FPs, has directly contributed to the parallel development of novel super-resolution imaging techniques that rely on these unique FPs. Structural modifications to FPs, such as the creation of split-FP systems, have served as the basis for tools to detect PPIs. Finally, harnessing FRET between various FPs, as well as the development of cpFPs, has been instrumental to the development of a diverse array of genetically encoded biosensors to directly monitor the dynamics of cellular signaling and biochemical pathways. Such advances, which will be discussed in depth in upcoming sections of this review, present numerous opportunities to expand the use of FPs in high-impact translational and clinical applications.
2.2. Fluorescent Protein Labels for Monitoring Molecular and Cellular Behavior
The earliest, simplest, and still widest application for FPs is as passive labels tagged onto POIs, where an FP essentially serves as a marker that reports on the presence and location of the target protein. As FP properties were manipulated and the palette diversified, they were exploited to accomplish more complex tasks, becoming smart labels to power unique and innovative applications that have brought to light diverse aspects of cellular biology. In this section, we provide an overview of the many approaches that harness FPs as passive and smart labels to probe biological phenomena at various scales, from individual molecules up to whole animals.
2.2.1. Labeling Proteins
An FP can be tagged to the N- or C- terminus of a protein and visualized by fluorescence microscopy to directly provide information on protein expression levels, mobility, and subcellular localization. Fluorescence microscopy of FP-fused proteins allows for the quantification of these properties at the level of single cells, which accounts for cell-to-cell heterogeneity as opposed to the population-level changes that are detected in biochemical techniques such as Western blotting. When choosing an FP for a labeling application, the color variant to be used is an important consideration. Especially for labeling multiple different targets, FPs with minimal spectral overlap must be used. Another significant consideration is determining whether to attach an FP to the N- or C-terminus of the POI. Although an FP tag can be viewed as functionally inert, its presence may nevertheless physically occlude part(s) of the POI. Thus, it is important to consider the structural and functional significance of either terminus of the POI and how this might be impacted by a fused FP. Incorporation of an extended flexible linker to serve as a buffer between the FP and POI may help minimize such perturbations. Lastly, overexpression of the POI may impact its native behavior. Therefore, it is also crucial to choose an appropriate expression system and, for sensitive contexts, to consider generating stable cell lines which express the FP-fused POI at or near endogenous levels. A slightly more sophisticated approach to FP labeling involves spontaneously complementing split-FPs, consisting of separate FP strand 11 and FP strands 1–10 (Figure 2). Rather than fusing the full FP to the POI, only FP11 is attached, reducing the load on the POI. The remaining strands (FP1–10) are expressed separately and will reconstitute with the FP11-tagged POI to yield fluorescence and thereby enable visualization of the POI in live cells. These various strategies and considerations for using FPs as labels are crucial to optimizing experimental design.
Figure 2.

Split-FP labeling for imaging a protein of interest. The 11th β-strand (FP11) of split superfolder GFP is fused to a protein of interest, and reconstitution of FP11 with untargeted FP1–10 allows for labeling of structures such as actin in live cells.
A simple approach to tracking protein expression involves fusing an FP to a POI and then performing fluorescence imaging to quantify relative changes in fluorescence intensity as a proxy for expression changes over time. Endogenous changes in protein expression are regulated at many levels, including at the level of gene expression, by intracellular signals. Because overexpression of a fluorescently tagged POI using an exogenous promoter can mask endogenous regulation of the POI, the POI should ideally be endogenously tagged to an FP. A classic example of this approach was presented by Elowitz and colleagues, who profiled single-cell protein expression heterogeneity in Escherichia coli using FP-fusions. This work revealed differences between cells in the production of proteins as well as intrinsic sources of noise, such as transcription rate and genetic factors, that contribute to inter- and intracellular heterogeneity in protein expression.91 The use of FPs as labels can be taken a step further to map the spatiotemporal complexity of cellular signaling in live animals. For instance, NFkB signaling was mapped through in vivo imaging of live mice expressing mEGFP-RelA or mScarlet-c-Rel, representing the next step in labeling approaches to infer signaling activity in living organisms with spatiotemporal resolution.92
In addition to tracking expression, FP labels can be used to track protein mobility. An important element of tracking protein mobility involves harnessing the photobleaching property of FPs. A method called fluorescence recovery after photobleaching (FRAP) is used for tracking protein motility. In this technique, high-intensity illumination is used to bleach FP fluorescence in a small region of interest within a cell, and the ensuing time-dependent recovery of fluorescence in the bleached region is quantified as an indicator of protein mobility. Similarly, the photoswitching behavior of certain photochromic FPs (discussed in section 2.1.3) can be used for the same goal. Rather than photobleaching, FP molecules in a small region are photoconverted by exposure to a characteristic illumination wavelength. The ensuing emergence of the photoconverted fluorescence signal in another region of interest can then be detected and quantified over time as an indication of protein mobility. Monomeric photoactivatable or photoswitchable FP variants are particularly useful for monitoring protein trafficking within the cell. For instance, a recent study by Gerlitz et al. developed transgenic Arabidopsis thaliana expressing DRONPA-s, a photoactivatable FP, which enabled the tracking of proteins between cells to define cell-to-cell protein transport.93
Lastly, FP labels are useful for visualizing the subcellular localization of proteins in single cells. An FP-tagged POI can be coimaged with an organelle dye/tag or another FP-tagged control protein which is known to localize to a certain cellular compartment. The degree of overlap between the fluorescence signals from the tagged POI and the localization marker can be analyzed to determine whether the POI localizes to the identified compartment. By imaging cells over time, changes in subcellular localization can also be tracked. For instance, a recent study used this approach to design a drug-discovery platform targeting chromosomal region maintenance 1 (CRM1), which is responsible for controlling nuclear trafficking of proteins and has emerged as an avenue for overcoming therapy resistance in cancer patients. By tagging an array of nuclear proteins with either RFP or GFP, researchers were able to elucidate the mode of nuclear export for several nuclear proteins. This same platform was then used as a screen to discover drugs that disrupt CRM1-dependent nuclear export.94 This simple and widely applicable approach highlights the complex spatial biology that can be revealed using FPs as labels.
FPs have provided valuable biological insights as labels to track protein expression, localization, and turnover. The utility of FPs to label proteins does not end here, however; FP-labels can also allow for the detection of PPIs through applications of FP fragmentation complementation- or FRET-based assays, which are discussed next.
2.2.2. Monitoring Protein–Protein Interactions
Proteins often interact with one another to carry out their unique functions. Identifying and characterizing these interactions in real-time can provide valuable insight into complex intracellular signaling networks. Traditional methods to resolve PPIs, such as immunoprecipitation, are limited to detecting bulk interactions and lack the spatiotemporal resolution that can be achieved by live-cell fluorescence imaging. Therefore, FP labels are routinely harnessed to quantify PPIs in the live-cell context, often supplementing and sometimes supplanting more traditional biochemical methods.
2.2.2.1. Bimolecular Fluorescence Complementation (BiFC)
Bimolecular fluorescence complementation (BiFC) is a method of visualizing and quantifying interactions between POIs by fusing each interaction partner to complementary fragments of a split FP that does not spontaneously complement but rather complements depending on proximity (Figure 3a,b; as introduced in section 2.1.5).95 BiFC was first conducted using fragments of GFP fused to antiparallel leucine zippers. Fusing the leucine zipper helices in antiparallel orientation to either GFP fragment resulted in the successful reconstitution of GFP, which was observed by the presence of green fluorescence.64 Soon after this first BiFC study using GFP, enhanced YFP was split and fused to transcription factors containing the bZIP or Rel domain to observe interactions between these proteins through the reconstitution of YFP fluorescence.96
Figure 3.
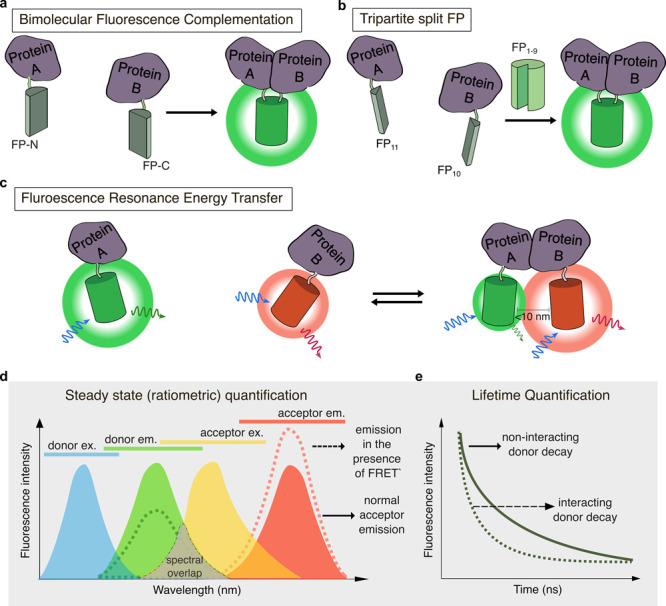
BiFC and FRET approaches to detect protein–protein interactions. (a) In bimolecular fluorescence complementation (BiFC), two complementary fragments of a split-FP, FP-N, and FP-C, are tagged to different proteins of interest (POIs). When the two POIs interact, the FP fragments undergo irreversible complementation and chromophore maturation, resulting in fluorescence emission. (b) In trimolecular fluorescence complementation (TriFC), β-strands 11 (FP11) and 10 (FP10) of sfGFP are tagged to two different POIs, along with untargeted FP1–9. As with BiFC, interaction of the two POIs induces irreversible FP reconstitution and fluorescence emission. (c) In Förster/fluorescence resonance energy transfer (FRET)-based PPI detection, a donor (e.g., green) and acceptor (e.g., red) FP are tagged to two different POIs, such that interaction between the POIs brings the two FPs into molecular proximity (<10 nm distance), resulting in increased acceptor fluorescence and decrease donor fluorescence. (d) FRET requires significant overlap between the donor emission spectrum and the acceptor absorption spectrum. During FRET, excitation of the donor will lead to increased emission from the acceptor increases (dashed red line) and reduced emission from the donor (dashed green line). Thus, the acceptor-to-donor emission ratio can be calculated as an indicator of FRET. (e) FRET can also be quantified by monitoring the fluorescence lifetime of the donor fluorophore. The donor fluorescence emission decays more rapidly in the presence of a FRET acceptor (dashed line) compared to when no FRET acceptor is present (solid line).
The newest generation of BiFC assays focuses on red-shifting fluorescence emission to visualize PPIs in live animals. For example, a tandem NIR BiFC assay based on split IFP2.0, which exhibited increased brightness compared to other NIR BiFC systems, was developed in 2021 for use in mice.97 Another NIR BiFC assay was developed using miRFP670nano to visualize PPIs in live cells and mice. This assay detected interactions between the SARS-CoV-2 nucleocapsid protein and host cell stress granule proteins.98 This approach was advantageous due to the small size of miRFP670nano, which belongs to a family of small FP variants evolved from cyanobacteriochrome. With a molecular weight of 17 kDa (compared to GFP at ∼27 kDa), miRFP670nano is half the size of bacterial phytochrome-based NIR FPs.99
Super-resolution BiFC assays have been developed as well. BiFC-SOFI and BiFC-PALM approaches for super-resolution imaging of PPIs have enabled nanometer-scale detection of PPIs and tracking of PPI dynamics in various organellar membranes, respectively.50,100 Another photoswitchable BiFC assay was developed using rsEGFP2 (split at residue 158) and validated by super-resolution imaging of Bcl-xL and Bak PPIs. The dynamics of this interaction were characterized on the outer mitochondrial membrane using RESOLFT microscopy, a form of patterned-illumination super-resolution imaging.101 This approach adds a layer of temporal resolution that previous super-resolution BiFC assays lacked, because BiFC-PALM was previously demonstrated in fixed cells and BiFC-SOFI required postprocessing that prevents real-time super-resolution imaging of PPIs.
Important considerations for using split FPs to detect PPIs include high SNR, low spontaneous reassembly independent of POI proximity, and fast chromophore maturation to visualize transient or dynamic interactions. FP reconstitution is irreversible, which enables the visualization of weak or transient interactions more clearly. However, this prevents the identification of interaction dynamics. Many applications of BiFC show the utility of this approach in diverse systems for identifying and characterizing PPIs to better understand the complexity of cells. For instance, Bischof et al. developed a multicolor BiFC library covering 65% of Drosophila transcription factors that can be used for large-scale interaction screens and analysis of PPIs.102 By tracking the reconstitution of Venus yellow fluorescence, they were able to characterize the spatiotemporal regulation of transcription factor interactions in Drosophila. They were also able to multiplex their assay using cyan (Cerulean) and yellow (Venus) BiFC pairs to monitor two interactions simultaneously.102 In another application, multiple protein interactions were visualized using a tool called BiFC-rainbow that takes advantage of the large Stokes-shift (LSS) FPs mT-Sapphire and CyOFP1 to ensure spectral separation and allow for multiplexed identification of PPIs. These FPs were combined with mCerulean and mVenus to detect 4 pairs of PPIs in a single cell and simultaneously visualize Bak/Bcl-xl, Jun/β-Fos, β-Jun/β-Fox, and lifeact/lifeact (split, F-actin) interactions.103 BiFC has also been combined with FRET to investigate ternary complex formation using LSS FPs. Ribo-BiFC is a method developed to detect interactions between 40S and 60S ribosomal proteins using Venus-derived BiFC fragments to visualize ribosome assembly in neurons and characterize their subcellular localization.104 BiFC has also been used with bioluminescence. For instance, SRET2, or sequential bioluminescence resonance energy transfer 2-fluorescence resonance energy transfer, was combined with BiFC to study the dynamics of GPCR heterotrimerization, specifically detecting interactions between 4 distinct parts of a G-protein complex.105
Studies utilizing BiFC to detect PPIs in live cells have been the basis for updated and novel applications of BiFC in diverse systems. For instance, BiFC has been widely adapted to identify factors that drive, disrupt, or alter PPIs under various conditions. A novel BiFC-based PPI screen was developed to characterize the elements that were important for homeostatic control of dopamine-modulated adenylyl cyclase type 5 (AC5) signaling in a neuronal cell line. Two previously unknown modulators of AC5 were identified, protein phosphatase 2A catalytic subunit and NSF-attachment protein alpha.106 Another assay called Cell-PCA (cell-based protein complementation assay) was developed based on BiFC and ORFeome-wide (open-reading frame) screening for high-throughput identification of proteins that interact with various bait proteins in live cells.107 Drug screening based on the interaction of Keap1 and Nrf2 in cancer was conducted through BiFC to identify inhibitors of this interaction in the live-cell context.108 The range of BiFC screening assays that have identified regulators of PPIs point to translational impacts for the clinic and exemplify the utility of fluorescence imaging-based approaches in characterizing novel aspects of cellular biology.
2.2.2.2. Förster Resonance Energy Transfer (FRET)
FRET, first introduced in section 2.1.1, can be harnessed for the detection of PPIs,109 as it allows for the measurement of proximity between FPs17 (Figure 3c). As mentioned previously, the Förster distance depends on the degree of overlap between the absorption or excitation spectrum of the acceptor and the emission spectrum of the donor (Figure 3d), and the alignment or orientation of the donor and acceptor dipoles. FRET efficiency depends on the distance between the donor and acceptor and can therefore be harnessed to serve as a spectroscopic or molecular ruler that monitors dynamic PPIs in the live-cell context.110 In designing a FRET-based PPI detection assay, it is important to consider the type of FRET experiment being conducted. In general, distinguishing PPIs will require detection of intermolecular FRET, wherein the donor and acceptor FPs are fused to two different proteins. The selection of FRET pairs for the detection assay will depend on the imaging setup available and other experimental settings, as there are several types of FRET pairs and diverse FPs that can be used, including but not limited to CFP-YFP pairs, GFP-RFP pairs, far-red FP-infrared FP pairs, LSS FP pairs, and dark FP-based FRET pairs. A more thorough list of FRET pairs has been generated and capably reviewed elsewhere.111 Importantly, because most FPs exhibit some degree of overlap between their own excitation and emission spectra, FRET can also be measured between spectrally identical FPs (i.e., homo-FRET), although this requires more specialized equipment than monitoring FRET between spectrally distinct FPs (i.e., hetero-FRET), which is thus more commonly employed.
FRET can be quantified through several methods. The most common method for monitoring FRET involves ratiometric quantification of sensitized emission, wherein the intensity of donor-sensitized acceptor emission (i.e., acceptor emission after donor excitation; FRET signal) is divided by the intensity of donor-direct emission (i.e., donor emission after donor excitation). Although this method is simple to implement, it can lead to variability between different microscope setups because it is not directly measuring the FRET efficiency. Furthermore, emission-ratio imaging is only suitable in contexts where the ratio of donor and acceptor is fixed. Altered fluorescence polarization can also relate to the change in FRET efficiency by polarization-resolved FRET. Fluorescence anisotropy measures the changing orientation or rotational motion of FPs in time and space upon excitation by polarized light.112 Specifically, a donor fluorophore is excited with vertically polarized light and consequent changes in the vertical and horizontal components of emitted light are compared to the total emission in the measurement of fluorescence anisotropy.112 Given the slow rotational motion of FPs relative to their fluorescence lifetime (see below) and the imperfect alignment between FPs in a FRET pair, light emitted by the FRET acceptor will be more depolarized with respect to the excitation light, leading to a decrease in anisotropy. Other quantification methods for FRET include quantifying changes over time via spectral imaging, acceptor photobleaching, or donor fluorescence lifetime imaging.111,113 Fluorescence lifetime imaging in particular is increasingly being used for FRET quantification. The fluorescence lifetime of a fluorophore refers to the time that a fluorophore spends in the excited state before it relaxes back down to the ground state (Figure 3e). Excited-state lifetime is shortened by the availability of nonradiative paths back to the ground state. Thus, when a donor FP transfers energy to an acceptor FP, its fluorescence lifetime is decreased. Fluorescence lifetime imaging microscopy (FLIM) can provide a direct readout of altered FRET efficiency from the measured change in lifetime of the donor fluorophore.114 Because fluorescence lifetime is an intrinsic fluorophore property, FLIM-FRET measurements are insensitive to changes in intensity caused by variable FP expression, illumination levels, sample thickness, etc., and allow robust, quantitative comparisons between experiments and instruments. Furthermore, as only donor fluorescence is measured in FLIM-FRET, potential issues related to spectral crosstalk between donor and acceptor channels can be minimized. Nevertheless, much like fluorescence anisotropy, FLIM-FRET requires specialized hardware to implement.
A basic application of FRET for detecting PPIs is exemplified by a recent study that detected the interaction between the apoptotic proteins XT and Bad via CFP or YFP fusion tags to each protein.115 Upon proximity of CFP and YFP to one another induced by the interaction of these two apoptotic proteins, FRET efficiency increased as an indication of a successful PPI. In another application, a high-throughput FRET-based assay was developed to detect the key amino acid residues required for maintaining the interaction between antizyme, an endogenous cell cycle inhibitor and tumor suppressor, and the antizyme inhibitor protein (AZIN).116 The assay incorporates Clover-tagged AZIN and mRuby2-tagged antizyme, which are imaged to detect PPIs via an increase in FRET. Such a FRET-based design can be used for screening drugs that inhibit the interaction between antizyme and AZIN and highlight the translational impact of FRET-based PPI assays in the potential identification of novel therapeutic strategies.
2.2.3. Visualizing Nucleic Acids
An early approach to detecting DNA or RNA in cells was fluorescence in situ hybridization (FISH), wherein fluorescently labeled oligonucleotide probes are used to identify target sequences through base-pairing interactions.117 This technique can provide great spatial resolution but lacks temporal resolution, as it requires cell fixation. Fluorogenic aptamer-based probes that can directly bind nucleic acid sequences of interest were also developed and shown to be suitable for achieving direct labeling.118,119 FPs are a widely accessible alternative to accomplish the same task via fusion to nucleic-acid-binding proteins to track specific DNA or RNA in living cells.
2.2.3.1. Visualizing DNA
FP-tagging of DNA-binding proteins can be used to study DNA-binding patterns and dynamics in real time in live cells. A suite of FP-tagged DNA-binding proteins is available for studying chromosome dynamics, DNA replication, transcription factors, and DNA damage and repair that can be a suitable entry point for initiating studies in the field.120 Takahashi et al. utilized FP-fused dsDNA-binding proteins to track dsDNA at the single-molecule level.121 These efforts helped elucidate DNA decay rates and enabled imaging of a single molecule of bacteriophage DNA stretched on glass to characterize dynamic behaviors of DNA in conditions with and without flow. Genomic loci have also been visualized using DNA-binding proteins tagged to FPs in Drosophila.122 FPs have also been used to visualize chromosomal structure during cell division. By tagging histone 2B with GFP, researchers were able to characterize the temporal behavior of the centrosome during mitosis123 (Figure 4a). Chen and colleagues from the Huang lab tagged endonuclease-deficient Cas9 with EGFP and coexpressed it with a small guide RNA (gRNA) to recognize repetitive elements in telomeres and protein-coding genes.124 Using this system, Chen et al. were able to visualize telomere dynamics and chromatin organization during the cell cycle.124 To track changes in chromosome organization in live cells, Lyu and colleagues introduced a CRISPR-mediated FISH amplifier system called CRISPR FISHer. In this system, a single-gRNA (sgRNA) scaffold incorporating two PP7 RNA aptamers recruits the PP7 coat protein PCP, GFP, and a trimeric motif to enable trimer assembly and thus, formation of a phase-separated condensate at the site of recruitment. This enables local enrichment of GFP, which enhances the visualization of genomic loci targeted by the sgRNA in live cells. Such applications illustrate the utility of FPs for characterizing DNA dynamics.125,126
Figure 4.
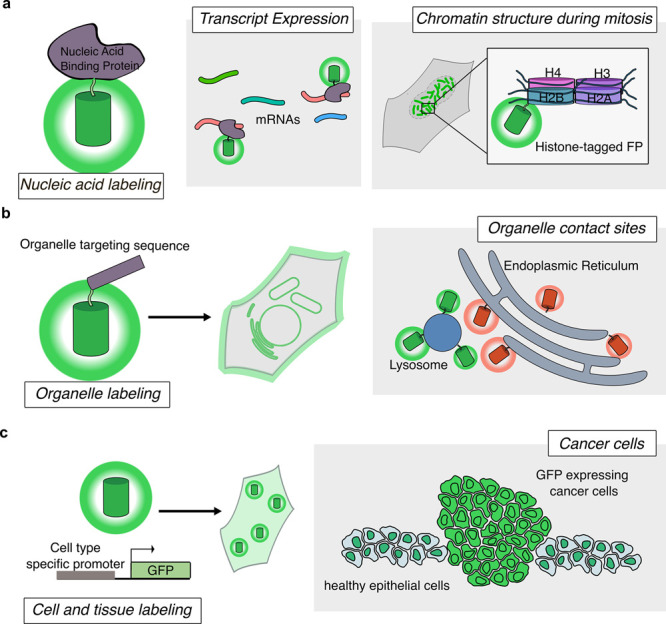
Using FP labels for imaging at different biological scales. (a) FPs fused to nucleic acid-binding proteins or histones to allow for labeling of mRNAs or chromatin structure, respectively. (b) FP fusion to organelle-targeting sequences allows labeling of various organelles in live cells. Imaging two FPs targeted to different organelles can indicate organelle contact sites at regions with colocalized fluorescent signals. (c) Expression of FPs driven by cell-type specific promoters can enable labeling of groups of cells or tissues. This approach can be used to distinguish cancerous cells from neighboring healthy tissue.
2.2.3.2. Visualizing RNA
Similar to DNA, labeling RNA has been achieved through the use of fluorogenic RNA aptamers127 or fluorescently labeled RNA-binding proteins.128 mRNA tracking is particularly significant as mRNAs are regulated by both transcription and translation. Thus, further efforts have been expended on developing methods to study these processes through FP-based labeling approaches.
2.2.3.2.1. Tracking Transcription
Transcription is a major process in the cell that is dynamically regulated by numerous cellular signaling pathways under a myriad of different conditions. Cellular transcription can be tracked at several levels, from studying the structure of chromatin and the activity of transcription factors and RNA polymerases to mRNA output on a transcriptome-wide scale through high-throughput sequencing.129 At the single cell level, the intricate spatial structure of chromatin and its relation to transcriptional activity via dynamic interactions with transcriptional regulators and factors has yet to be defined in live cells. Current methods to probe transcript levels in cells, including reverse transcription-quantitative polymerase chain reaction (RT-qPCR), RNA sequencing (RNA-seq), and even the advent of methods such as single-cell RNA-seq or spatial transcriptomics,130 can provide great depths of information but still lack the spatiotemporal resolution that can be provided by live-cell imaging approaches. Live-cell imaging with FP-labeling of transcription factors or mRNA itself can be harnessed to provide information on the spatiotemporal dynamics we are missing.
Previously, transcription factor dynamics have been characterized via FRAP (discussed in section 2.2.1). Transcription factors labeled with fluorescent dyes are photobleached by exposure to a high-intensity laser in a small region of interest. The recovery of fluorescence in the bleached area indicates the mobility of the labeled transcription factor, which can be measured under various conditions that alter transcription factor activity.131 This approach has enabled single-particle tracking of transcription factors to characterize dynamic regulation of DNA-binding events at specific loci.132,133 By providing information about the dynamic behavior of transcription factors, such approaches may provide hints about transcriptional activity within live cells as well.
A more direct strategy to characterize transcription in live cells is to perform imaging using reporter systems such as the previously discussed CRISPR sgRNA/Cas9 system or the MS2 system. MS2 sequences are bacteriophage-derived stem-loops that can be used to label RNAs of interest. Coexpression of an FP-fused RNA-binding MS2 coat protein (MCP) will enable detection of mRNA via the interaction between MS2 and MCP.128,134 The MS2 system was improved by the Singer lab in 2018 to overcome the tendency for MS2-MCP binding to block RNA degradation, thereby masking the native behavior and lifecycle of RNA. Specifically, Tutucci et al. generated the MBSV6 reporter system by engineering a modified MCP with reduced binding affinity to enable tracking of mRNAs without preventing their degradation.135 This allowed for the detection of rapid mRNA turnover and single-molecule mRNA imaging in live mammalian cells.135 The MS2-based RNA detection approach has also been applied in the context of in vivo imaging. A generalizable reporter based on the MS2 system was developed to track β-actin mRNA in vivo in the cerebral cortex of live mice through optical cranial window imaging and two-photon (2P) microscopy.136 Other orthologous stem-loop-based systems like PP7,137 in combination with CRISPR sgRNAs, have enabled multicolor tracking of multiple mRNAs in single cells.138−140 These stem-loop systems cannot probe endogenous transcripts because target RNA must be overexpressed. Nonetheless, further expansion of these systems for in vivo and multiplexed imaging applications can greatly enhance our understanding of the dynamics of gene transcription and the complex interplay between mRNAs.
2.2.3.2.2. Imaging Translation
Translation is responsible for producing the proteins required for all cellular processes and is thus fundamental to our understanding of cell function. Conventional techniques to assess protein levels through end point biochemical assays, such as Western blotting or mass spectrometry, as well as emerging methods like ribosome profiling, are indispensable for our understanding of protein expression and translation. However, studying translation in real time has only recently gained traction with major technological breakthroughs that shift the focus to the starting material, the mRNAs being translated, rather than the translation product.
One of the first studies to image translation events was reported by the Chao lab in 2015. Halstead and colleagues took advantage of the sequential displacement of RNA-binding proteins during translation to develop a method to detect this process. Specifically, a transcript of interest was labeled with nuclear targeted PCP-GFP and MCP-RFP stem-loops recognizing the coding region (including a PP7 stem loop) and 3′ untranslated region (UTR, including MS2 stem loop) of the transcript, respectively. Upon initiation of translation, the mRNA is exported from the nucleus, and PP7-GFP is displaced from the transcript, whereas MS2-RFP remains bound.141 The following year, the Stasevich lab developed their nascent chain tracking (NCT) technique, in which a sequence encoding 10 copies of the FLAG epitope, named Spaghetti Monster by the Stasevich lab, is introduced to the 5′-end of the protein-coding region of the mRNA of interest, along with 24 copies of the MS2 tag in the 3′-UTR. An anti-FLAG antibody labeled with the Cy3 fluorescent dye is used to recognize FLAG Spaghetti Monster translation, whereas the coding mRNA is labeled via coexpression of dye-labeled HaloTag-MCP.82,142 Using this approach, Morisaki et al. tracked the translation of three different genes in polysomes and defined their translation kinetics. They further developed an HA-tag based Spaghetti Monster to simultaneously image translation from two mRNA transcripts in single cells.
In 2016, three studies were published presenting novel methods to detect the translation of mRNA transcripts of interest in real time based on FP labels. These methods are based on the SunTag system, which was originally developed to induce signal amplification by enabling the recruitment of multiple copies of GFP to a protein of interest. Briefly, the SunTag system involves tagging a POI with a peptide epitope which can recruit a synthetic single-chain intracellular antibody (scFV) fused to GFP. The inclusion of multiple copies of the epitope tag allows recruitment of multiple GFP-labeled scFVs, leading to amplification of the fluorescent signal at the POI.143 Based on this system, the Tanenbaum, Singer, and Zhuang laboratories all separately developed similar mRNA-based signal amplification systems in which an mRNA transcript of interest is engineered to include PP7 or MS2 stem-loops within the 3′-UTR, such that binding of SunTag-labeled PP7 or MCP will cause recruitment GFP-scFV near the mRNA of interest during translation. The Zhuang lab utilized their platform to identify transient regulation of translation upon environmental stress.144 The Singer lab applied their translation imaging system, called SINAPS (single-molecule imaging of nascent peptides) to study subcellular translation at the endoplasmic reticulum (ER), enabling them to visualize protein insertion into the ER during translation.145 Finally, the Tanenbaum group used their platform to conducted long-term imaging of mRNAs and characterize ribosome stalling.146 Each of these studies demonstrates the striking insights that can be obtained by the application of novel methods to image cellular processes in real time.
Similarly innovative FP-based approaches to obtain spatiotemporal insights into DNA and RNA dynamics and gene expression can be transformative in our understanding of the complex signaling pathways that regulate the central dogma of biology at all its distinct levels, via imaging of DNA organization, gene expression, and protein translation.
2.2.4. Labeling Organelles
On a larger scale, FP-fusion tags have been vital to our understanding of organellar structure and interorganellar contacts. The dynamics of organelles themselves can be an indicator of cellular health (e.g., mitochondrial fission/fusion balance), intracellular communication (e.g., contact sites), migration status or mechanotransduction (e.g., cytoskeletal organization), or cellular signaling (e.g., calcium signaling at organelle contacts).147−150 Therefore, FP-tagging of organelles can reveal important insights into the interplay between cellular state, function, signaling, and organelle dynamics.
2.2.4.1. Approaches to Labeling Cellular Organelles
FPs can be used to track integral cellular components such as organelles or the cytoskeleton through the use of localization motifs that target FPs to specific compartments/components of interest (Figure 4b).20 Several groups are refining targeting mechanisms and FP labels to achieve more specific labeling of subcellular compartments and processes. For instance, Yang and colleagues recently identified aggregation of RFPs used in the study of mitochondrial transfer, including DsRed and mCherry. These RFPs tended to aggregate at lysosomes, a compartment that can release contents by exocytosis that may be mistaken for mitochondrial transfer, a process that is harnessed by certain cell types to improve mitochondrial function via transfer of mitochondrial DNA or proteins.151 Although the specific mechanism underlying lysosomal aggregation of mitochondria-targeted DsRed and mCherry is still unclear, Taiko et al. postulated that these RFPs may be autophagocytosed to appear at lysosomes.152 To generate a more reliable assay for studying mitochondrial transfer, Taiko et al. identified a bright, fast-maturing RFP, TurboRFP, which did not aggregate at lysosomes and was suitable for visualizing intercellular transfer of viable mitochondria. Imaging of mitochondria-targeted TurboRFP revealed that immortalized human amniotic epithelial cells can transfer healthy mitochondria to HEK293T cells with damaged mitochondrial DNA and mitochondrial dysfunction.152 Along with emphasizing the importance of developing robust and well-controlled experiments, this approach highlights the impact that FP-labeling of organelles can have on our understanding of diverse cellular processes, such as cell-to-cell communication.
Methods have also been developed to label organelles without direct fusion to an FP, thereby avoiding potential disruption of endogenous organelle dynamics and behavior. One example harnessed the unique biotinylation reaction between biotinylated substrate protein (BCCP) and biotin protein ligase (BPL),153,154 which leads to the formation of a stable complex between these proteins. This system was utilized to label and characterize the nuclear envelope during mitosis.155 In this strategy, BCCP is fused to GFP and localized to the nucleus using a C-terminal NLS (nuclear localization sequence). BPL is fused to the C-terminus of the transmembrane domain of the human platelet-derived growth factor receptor, enabling it to face the cytoplasm or nucleoplasm. BCCP-GFP-NLS interacts with BPL and localizes to the nuclear envelope, potentially without disrupting native behavior. This approach enabled imaging and characterization of the dynamic breakdown and reformation of the nuclear envelope during mitosis. Cytoskeletal labeling (β-actin and α-tubulin) was also accomplished using this approach.156 An alternative strategy to label organelles without direct FP fusion involves using the transient interactions between small (21–28 residue) helical protein tags called K- and E-coils, or KECs.157 In this strategy, an FP is fused to the E-coil, which can interact with a POI-fused K-coil. This method is advantageous because it reduces the load on the POI, replacing the relatively bulky FP barrel with a small helical structure. KECs can also label newly synthesized proteins because the maturation time of the FP chromophore will not significantly affect labeling and there will be mature FPs readily available to label newly translated proteins. Practical considerations for this approach include developing a better understanding of the effect of such interactions, despite their transience, on endogenous protein behavior and the intrinsic biological function of these new interaction partners, if any.
Not only can FP labels reveal dynamic behaviors of organelles, they can be harnessed to reveal the complex trafficking pathways that proteins take to reach their target organelles. For example, mCherry Timer FPs have been used to track delivery of LAMP-2A to lysosomes and characterize its trafficking pathway.22 Through this approach, Subach et al. suggested that LAMP-2A is trafficked first to the plasma membrane from the Golgi, then to early and recycling endosomes, and finally to lysosomes.22 Such an approach could be utilized to study age-dependent organelle distribution or protein trafficking to enhance our understanding of the temporal behavior of cellular components. New applications of FPs as smart labels are constantly being developed to better understand the dynamics and structure of cellular organelles. Further work on this topic will enhance our understanding of the previously understudied impacts of organelle dynamics and turnover.
2.2.4.2. Labeling Organelle–Organelle Contacts
Another area where smart FP labels are useful for gleaning novel biological insights has been in detecting or manipulating organelle contacts (Figure 4b). Organelles have long been observed to be dynamic and come in proximity to one another, but the concept of interorganellar communication through sites of physical contact has only recently been defined.158 To date, the most well-studied contacts have been those involving the ER.159 However, contacts between other organelles and even homotypic contacts between two parts of the same organelle are being discovered. These sites are defined by molecular tethering between two proximal organelle membranes to fulfill a specific function.158 This proximity is typically in the range of 10–80 nm but can occur at greater distances as well. A BiFC system was used to detect ER-mitochondrial contact sites through fusion of split Venus fragments to the cytoplasmic faces of the ER and mitochondrial membranes.160 This application led to the identification of motile ER-mito contact sites that were modulated by ER stress or serum-deprivation. Another application of BiFC in the study of organelle contact sites was the visualization of active ER arrival sites (ERAS) by monitoring of contacts between coat protein complex I (COPI) coat components and the ER-resident DsI tethering complex.161 There have been useful advancements made by these types of assays, but the irreversible interaction between BiFC components can be an impediment to studying endogenous organelle interactions. To address this, FRET has been utilized to detect organelle contact sites, as FRET, unlike BiFC, is reversible and should not disrupt the endogenous dynamics of the contacts. Although organelle contact sites are defined by a proximity of 10–80 nm,158 which hits the upper limit for FRET detection, a FRET-FLIM system could nevertheless be used to identify the molecular determinants of ER-Golgi contact sites, including the specific proteins involved (VAP and ORP proteins). Specifically, GFP was fused to the Golgi membrane protein TGN46 and mCherry to the ER membrane protein cytochrome b5. FRET between the two proteins decreased the GFP fluorescence lifetime, enabling the identification of ER-Golgi contacts using FRET-FLIM measurements. This strategy was then used to conduct an siRNA screen to identify the specific ER- and Golgi-resident proteins involved in the formation of these specific contact sites.162
Compared to BiFC, FRET is advantageous due to its reversibility, which does not tamper with native contacts as significantly as the irreversible nature of BiFC pairs. However, this perceived drawback of BiFC has also been exploited as a tool to manipulate organelle interactions or contacts and assess the effects on cellular biology. For example, the irreversible feature of BiFC has been used to “glue” chloroplasts in plant cells to one another and regulate organellar interactions.163 The application of BiFC as an organellar glue was later used by Ishikawa and colleagues to manipulate the plant metabolome, which could be a process exploited in the future to generate important metabolites or molecules for the pharmaceutical industry.164 Such unique applications of FP-based assays leverage aspects of a system that have traditionally been perceived as limitations to develop novel tools for manipulating and probing cellular biology.
2.2.5. Labeling Cells, Tissues, and Organisms
In addition to providing spatiotemporal information on subcellular structures, FPs can be applied to track the behavior of whole cells at the tissue or even organism level. Cell-scale labeling approaches can enable the detection of cell–cell contacts, for instance, which are crucial signaling sites that are involved in development and neuronal signaling, among other processes.165 Thus, approaches to label and detect cell–cell contacts can elucidate their functional roles in various disease contexts. To study cellular contacts at synapses, Kim et al. developed mGRASP, a fragment-complementation-based labeling approach that utilizes GFP1–10 and GFP11 fused to fragments of the pre- and postsynaptic proteins neurexin 1β and neuroligin-1, such that proximity of the protein fragments will permit GFP reconstitution and visualization of interacting synaptic membranes.166 Tsetsenis and colleagues then developed SynView, which fused GFP1–10 and GFP11 to the full-length synaptic proteins (neurexin-1β and neuroligin-1 or neuroligin-2) that bind trans-synaptically, thereby marking synapses with GFP fluorescence via PPI.167 These approaches are just a few of the ways FPs can be exploited to label cellular contacts and provide a deeper understanding of cellular communication in the live-cell context.
On a broader scale, cells themselves can be labeled with different FPs to distinguish populations or types of cells in a population. A classic example of using FPs to label cell types is the “brainbow” method.168 In this approach, a novel transgenic strategy was used to introduce multiple copies of three different FPs into neurons with incompatible lox sites in various parts of the inset gene. Recombination causes different gene fragments to be cut out, leading to variable expression of the FPs and a distinct assortment of colors being expressed in each cell. This technique has been the inspiration for more recent developments targeting different subpopulations of cells. For instance, a 2019 study reported the development of a method to label the metastatic niche of breast cancer cells found in the lung by using “leaky FPs”, which can be released from cancer cells and taken up by neighboring cells found in the metastatic niche. To achieve this, the authors modified mCherry with a membrane-permeable trans-activator of transcription (TATk) peptide to generate sLP-mCherry. This construct was coexpressed with GFP in breast cancer cells that were introduced into mice via tail-vein injection. As the breast cancer cells metastasized to the lung, cells in the metastatic niche could be identified by FACS to select for mCherry fluorescence. These cells can then be used for downstream studies such as single-cell sequencing to further characterize the metastatic niche. The use of this FP-based technology led to the identification of a lung epithelial compartment in the metastatic niche that exhibits dedifferentiation and tissue stem cell-like features.169
Similar to the use of Timer FPs to trace gene expression or organelle dynamics over time, FPs have also been used trace cell lineages. In this approach, FPs are expressed from cell-type-specific promoters to drive expression only in certain cell types (Figure 4c). Once the FP is expressed in these cells, lineage tracing can be performed to identify daughter cells and their characteristics. This method was pioneered in the 1980s with site-specific recombinase technology that allows for the breaking of DNA and then recombinase-mediated joining through site-specific gene integration or excision. The commonly used system for this is the inducible Cre/LoxP system.170 For instance, homologous recombination in mouse embryonic stem cells (ESCs) was utilized to drive expression of nuclear-localized Cerulean, plasma membrane-targeted mKate2, and tamoxifen-inducible expression of EYFP only in melanocytes to achieve lineage tracing.171 This strategy was taken a step further with the development of optical barcoding, which uses a fluorescent barcoding system with the introduction of up to three spectrally distinct FPs, combined in six different constructs, into target cells, wherein the combination of FPs expressed serves as a genetic barcode for each cell.172 Similar work was done to develop optical barcoding systems that can track tumor heterogeneity. Six spectrally distinct FPs were utilized, and cells were allowed to express up to three colors at once to yield up to 41 distinct barcodes, made up of 3, 2, or 1 color. Tumor heterogeneity of cell populations was characterized by identifying expressed FPs using flow cytometry.173 An analogous system was used to conduct multiclonal tracking of tumor cells expressing different combinations of 3 FPs to gain key biological insights into the immune escape signature.174
In vivo imaging of labeled cells in live animals is an important next step for improving the physiological relevance and spatiotemporal resolution of such work without relying on cell collection and postprocessing. Invasive cranial window imaging of live mice is one method used to achieve in vivo imaging using shorter-wavelength FPs such as GFP. As red-shifted wavelengths allow for greater tissue depth and reduced light scattering, advances in far-red or infrared FP development are crucial to enabling advancements to deep-tissue imaging.175 An early example of this type of FP is Katushka, a relatively bright, fast maturing, and pH- and photostable FP with an emission maximum at 635 nm that extends to the infrared at >700 nm.176 Katushka was validated for in vivo imaging in Xenopus laevis embryos. Development of far-red and NIR FPs, in combination with advanced imaging techniques, is promoting in vivo, deep-tissue imaging of proteins or protein activities. The palette of bright monomeric NIR FPs (mIFPs and miRFPs)177,178 have demonstrated photophysical properties suitable for noninvasive in vivo imaging in mice. Enhanced miRFPs were used to achieve two-color, whole-body in vivo imaging in mice via STED microscopy.76 These NIR FPs incorporate biliverdin as an exogenous chromophore, and many (IFPs, miRFPs) require biliverdin supplementation for in vitro imaging, although exogenous administration is not always required in vivo dependong on the bioavailability of biliverdin in the specific organism. iRFP is one example of a far-red FP that does not require biliverdin supplementation in vivo and exhibited a higher signal-to-noise ratio (SNR) than comparable FPs in mice at the time of its development.179 smURFP, a smaller FP variant that also incorporates biliverdin, was later developed and validated for in vivo imaging in mice.180 tdTomato, a red FP, was expressed in Mycobacterium tuberculosis under an L5 mycobacterial promoter to image subcutaneous and pulmonary infections in live mice and to determine bacterial load.181 RFP expression has also been combined with MRI using the clinical MR contrast agent gadobutrol, which serves as a pseudo-optical clearing agent, to enhance in vivo imaging of fluorescently labeled subcutaneous tumor xenografts, representing a novel method for imaging FPs using clinical tools.182
The simplicity and versatility of FP fusion tags have enabled the study of cellular biology at diverse scales, from molecular to subcellular to organismal. As FP properties are improved and engineered for use in different contexts, along with advances in imaging and genetic manipulation techniques, our ability to illuminate diverse and complex biological phenomena will continue to expand. But the utility of FPs expands further than their role as labels. As discussed below, the design of FP-based biosensors that can detect molecular events and signaling activities is a rapidly growing field that has already greatly enhanced our understanding of the spatiotemporal regulation of cellular signaling and will continue to do so.
3. Engineered Sensors
In contrast to the above tagging approaches, in which the FP is primarily used as a static label whose spectral properties are not affected by the biological process being tracked, engineered genetically encoded FP-based biosensors are designed to directly link the intrinsic fluorescence properties of FPs to the detection of molecular events such that fluorescence changes provide a readout for cellular signaling. In general, FP-based biosensor designs incorporate a modular architecture comprising two distinct elements: a sensing unit and a reporting unit.
The sensing unit of an FP-based biosensor detects the molecular target or activity of interest. In most biosensors, the sensing unit is designed to serve as a “molecular switch” that undergoes a conformational change in response to target recognition. This conformational change in the sensing unit is then transmitted to the reporting unit through conformational coupling, leading to a change in biosensor fluorescence.183 Sensing units are often constructed based on proteins that are directly involved in the signaling pathway of interest, therefore conferring some degree of both sensitivity to and selectivity for the desired target. Molecular switch behavior can be achieved using a single component, for example, by relying on the intrinsic conformational change of a single protein or domain that binds an analyte of interest, or by combining multiple components, such as a binding domain paired with an interacting peptide. Specific examples of sensing unit designs are discussed in more detail in later sections of this review, organized by signaling target.
The biosensor reporting unit consists of one or more FPs that can provide a quantifiable readout for the signaling event of interest. Depending on how the sensing and reporting units are linked, this readout can take several forms, including changes in fluorescence intensity or resonance energy transfer, whether FRET or BRET. In certain cases, such as pH or temperature sensing, the reporting unit also doubles as the sensing unit, resulting in a unified design. In general, biosensors can be classified as using either single- or multicomponent reporting unit designs depending on whether their optical readout is driven by one or more emissive sources. For the purposes of this review, we generally regard multicomponent reporting units as consisting of two FPs, or an FP paired with a luciferase in BRET-based designs, whose proximity and orientation are altered by the sensing unit, whereas single-component reporting units feature modulation of only one FP as the source of fluorescent signal. Below, we discuss several common strategies for constructing biosensors incorporating multi- and single-component reporting units, as well as some practical considerations related to implementing either variety.
3.1. Multicomponent Reporting Units
Multicomponent reporting units utilize interactions among two or more FPs to provide an optical readout of signaling or activity, as detected by the sensing unit. These readout modes include changes in FRET between a pair of FPs, changes in BRET between an FP and a luciferase, and changes in the intensity of dimerization-dependent FP (ddFP) pairs. Given their relatively straightforward construction, multicomponent sensors are often the go-to design solution when developing a new sensor class. While many sensor classes have gone on to adopt single-component reporting unit designs as well, multicomponent reporting units remain robust and popular tools.
Among multicomponent reporting unit designs, FRET-based biosensors are quite common, and FRET-based designs often lie at the root of biosensor family trees. As discussed previously (section 2.1.1), FRET describes the ability of a donor fluorophore to nonradiatively transfer excited-state energy to a spectrally compatible acceptor fluorophore, in a manner that depends on both proximity and orientation (Figure 5a, upper). Given this strict dependence, FRET can provide a highly sensitive readout for changes in protein conformation. Thus, FRET-based biosensor designs typically feature a sensing unit sandwiched between a pair of FPs, such that conformational changes within the sensing unit will alter the inter-FP distance and orientation, and thus FRET efficiency. Classic examples of spectrally compatible FRET FP pairs include GFP/RFP and CFP/YFP, but there is a myriad of FRET pairs that can be used in biosensors. For instance, red/far-red and yellow/red FP pairs have been used to develop FRET-based biosensors that are more suitable for multiplexed imaging applications.184 Although several methods of quantification are available (as discussed in section 2.2.2.2), FRET-based biosensor responses are generally monitored by quantifying changes in the acceptor-to-donor emission ratio, wherein the intensity of donor-sensitized acceptor emission (acceptor fluorescence upon donor excitation) is divided by the donor-direct emission intensity (donor fluorescence upon donor excitation), or changes in the excited-state lifetime of the donor fluorophore, which should decrease as a function of increasing FRET efficiency (Figure 3d). Monitoring two wavelengths reduces the influence of intrinsic (e.g., cell thickness, sensor expression) and external (e.g., instrument variations) factors on the fluorescence signal, as these will likely impact both FPs similarly and be canceled out by calculating the ratios. Ratiometric readouts are thus advantageous for comparing responses across experiments and instrument set-ups, in addition to enabling absolute determination of analyte (e.g, pH, ions) levels. Lifetime measurements offer similar benefits, as excited-state lifetime is an intrinsic property that is insensitive to fluorescence intensity.
Figure 5.

Types of reporting units. (a) Multicomponent reporting units can be based on FRET (upper panel) or dimerization-dependent FPs (ddFPs, lower panel). In the FRET system, the donor (green) and acceptor (red) fluorophores are tagged to the termini of the sensing unit (purple). Upon a sensing a specific molecular event, a conformational change in the sensing unit alters the proximity and orientation of the donor and acceptor fluorophores, resulting in a change in FRET. In the ddFP-based system, ddFP-A (dimly fluorescent) and ddFPB (nonfluorescent) are tethered to either end of the sensing unit. Analogous to the FRET-based design, a conformational change resulting from a sensing event alters the interaction between the two ddFP partners, modulating the fluorescence intensity of ddFP-A. (b) Single-component reporting units can consist of a single FP that exhibits sensitivity to the target (upper panel). In this reporting scheme, the target directly binds to the FP chromophore and leads to altered fluorescence intensity. Alternatively, a circularly permuted FP (cpFP) can be integrated with a sensing unit, with the sensing event leading to altered fluorescence intensity in the cpFP. (c) An example of translocation-based reporting, in which the function of tandem nuclear localization and export signals is modulated by a molecular event (e.g., kinase-mediated phosphorylation of a substrate peptide; T, threonine), leading to changes in the nucleocytoplasmic shuttling of a tethered FP. (d) Phase separation-based reporting involves tagging an FP to a peptide or protein capable of forming dynamic, multivalent interactions in response to a molecular event, sequestering the FP into phase-separated biomolecular condensates, shown here as green cytosolic puncta.
BRET-based sensors are analogous to FRET-based designs, except that the donor FP is replaced with a luciferase and its corresponding substrate. As with FRET-based reporting units, the luciferase is paired with a spectrally appropriate FP (RLuc and variants are commonly paired with GFP). Upon detection of an analyte or signaling event, a conformational change in the sensing unit will alter the proximity between the luciferase donor and FP acceptor, resulting in a change in BRET efficiency. Importantly, luciferases produce light through a chemical reaction and thus do not require external illumination to reach their excited state. As such, BRET-based sensors tend to exhibit very low background from a lack of cellular autofluorescence, as well as reduced photoxicity, compared with FRET-based sensors. However, BRET-based sensors are comparatively dim due to relatively poor quantum efficiencies of the luciferase–luciferin systems, confounded by a number of other crucial parameters such as catalytic efficiencies of luciferases and local concentrations of the substrates.
An alternative multicomponent reporting unit design features ddFPs such as ddRFP, ddGFP, or ddYFP.185,186 The development of ddFPs was inspired by the need for an FP complementation approach utilizing RFP, which has been seldom used in such approaches because RFPs are usually obligate tetramers. While oligomerization stabilizes the chromophore and yields brighter fluorescence, it can interfere with the underlying biology being probed and has therefore been unfavorable for many applications of RFPs.54 However, the Campbell lab was able to harness this property to engineer a series of FP pairs that greatly increase in brightness upon dimerization.185,186 ddFP pairs consist of a dimly fluorescent FP-A and a nonfluorescent FP-B, in which FP-A greatly increases in brightness upon binding of FP-B (Figure 5a, lower). ddFP-based reporters can be designed to produce either a ratiometric or intensiometric response, depending on how the sensing unit is coupled to the ddFPs. For example, an intensiometric response can be achieved by simply sandwiching a sensing unit molecular switch between a ddFP pair, such that conformational changes will alter dimer formation and thus fluorescence intensity. Alternatively, a ratiometric readout can be obtained by taking advantage of the fact that multiple FP-As (e.g., RFP-A and GFP-A) can bind the same FP-B, leading to a phenomenon known as ddFP exchange. Here, the reporting unit incorporates three components, two FP-As of different colors and a single FP-B, with the signaling-induced conformational change triggering exchange of one ddFP pair for another to yield an emission ratio change. The flexibility of ddFP-based systems makes them attractive for the development of both ratiometric and intensiometric sensors. For intensiometric sensors in particular, though, single-component biosensors have also become an attractive option.
3.2. Single-Component Reporting Units
Single-component reporting unit designs modulate the signal from a single FP as their optical readout and are thus sometimes referred to as single-FP biosensors (Figure 5b). These biosensors generally occupy less spectral space than multicomponent reporting unit designs and are thus more amenable to multiplexed imaging. The generally smaller size of single-FP sensors can also potentially alleviate some of the stress put upon cells when expressing exogenous DNA. While multicomponent reporting units still often serve as a starting point for biosensor development, recent years have seen considerable growth in the development and optimization of biosensors containing only a single FP as the reporting unit.
Single-component reporting units can be constructed in several different ways, with the simplest being direct fusion of the sensing unit to the N- or C- terminus of an FP. Many lipid sensors, for instance, fuse an FP directly to a lipid-binding domain, such that translocation of fluorescence to (or from) a membrane surface signals the production (or degradation) of a particular lipid species.187,188 Kinase translocation reporters (KTRs) are another type of translocation-based sensor, in which a single FP is fused to a kinase substrate that contains both a nuclear localization (NLS) and nuclear export signal (NES). Upon phosphorylation of the substrate, the NLS is disrupted, allowing nuclear export of fluorescence to serve as the readout189,190 (Figure 5c). A recent twist on this approach leverages the phenomenon of liquid–liquid phase separation (LLPS), in which initially diffuse molecules spontaneously coalesce to form discrete, liquid-like assemblies, or condensates, within cells.191−193 LLPS-based sensor designs utilize a bimolecular design, in which each half of the split sensing unit is fused to an oligomerization domain, such as tetrameric or hexameric HOTag coiled-coils. One part of this bimolecular switch also incorporates the FP reporting unit. Activation of a cellular signal triggers multivalent interactions between sensing unit oligomers, resulting in the formation of droplet-like biosensor condensates, visualized as the redistribution of FP fluorescence from the cytosol to these punctate structures194 (Figure 5d). While these translocation-based biosensor designs have proven successful, a more versatile strategy has been to use the sensing unit to directly alter the fluorescence properties of the FP as a readout of signaling activity. For instance, an early voltage sensor was constructed by fusing a single FP to the C-terminus of a voltage-gated ion channel, wherein voltage changes alter FP fluorescence intensity.195 However, a more generalizable approach to modulating the fluorescence of a single FP involves completely integrating the reporting unit FP with a sensing unit molecular switch. Most commonly, this is accomplished by inserting a cpFP (discussed in section 2.1.5) into the sensing unit. Specifically, the sensing unit components are fused to the N and C termini of the cpFP, located in β-strand 7.62 Upon detection of the signal of interest, the conformational change in the sensing unit acts to distort the cpFP β-barrel structure, which alters the chromophore environment and affects the fluorescence signal (Figure 5b). Typically, this results in a change in fluorescence intensity,196 but other effects, including changes in excitation60,63,197−199 or emission198,200 spectra or fluorescence lifetime201 have been reported.
Importantly, these cpFP-based single-component sensors tend to show significantly higher responses and sensitivity when compared side-by-side with similar multicomponent biosensors. These properties make cpFP-based sensors highly desirable to visualize minute signaling changes in vivo. However, cpFPs are only available in a somewhat limited range of colors, and expanding the palette of cpFPs will thus be very useful for future efforts to generate red-shifted sensors with greater utility for both in vivo and multiplexed imaging applications. For instance, five circularly permuted far-red FPs with excitation and emission wavelengths >600 nm have been developed based on mMaroon1 and mCarmine.57 Meanwhile, other strategies for combining an FP with a molecular switch202 include direct insertion of the sensing unit into the FP barrel without circular permutation,203,204 or into a BV-binding protein near the biliverdin binding site, which has yielded sensors with NIR emission.205
3.3. Practical Considerations
Multiple factors contribute to biosensor performance. These include but are not limited to sensitivity, selectivity, stability, response time, tissue penetration, and dynamic range.206 Some of these parameters are “fundamental” and greatly influenced by particular components of the sensor. For instance, the selectivity for one target over another is largely determined by the sensing unit, and the reporting unit has the most influence over the spectral identity and photophysical properties of the sensor. However, while careful choice of sensing unit and reporting unit will give strong starting points in the design of a sensor with particular properties, the way the two components affect one another cannot be overstated. Thus, optimization of the linkers and combinations of reporting and sensing units are crucial to biosensor development.
3.3.1. Fundamental Parameters
Many fundamental aspects of biosensor performance are determined by the sensing unit. For instance, a biosensor must demonstrate selectivity for the target of interest, ideally recognizing the target without responding to other similar molecules. The biosensor should also have affinity for the target within a physiologically relevant concentration range that corresponds to the native cellular conditions in which it is being detected. The precise physiological range can vary depending upon the organism, cell type, or even subcellular compartment in which a biosensor is being expressed, as various analytes and proteins can be present in each of these locations at varying concentrations. This point is well illustrated in the case of the ZifCY and ZapCY sensors, which were used to detect subcellular zinc ion (Zn2+) levels at various compartments based on their relative Zn2+ affinities207 (discussed in section 5.2.1).
The reporting unit can similarly influence biosensor performance. The choice of FP in biosensor development is crucial as it can affect the brightness and excitation and emission wavelengths of the sensor, and compound with characteristics of the sensing unit to affect dynamic range and sensitivity. FP excitation and emission wavelengths determine the spectral identity (i.e., color) of the FP, and different illumination wavelengths are more (shorter wavelength/bluer light) or less phototoxic or able to penetrate through tissues (longer wavelength/redder light). Brighter FPs will be more visible and are often chosen for biosensor development for this reason. Different FPs also mature at different rates (see section 2.1.2). In general, this process is slower for RFPs than for GFP variants, as chromophore maturation requires an additional oxygen-dependent step.208 Incomplete maturation can affect biosensor performance, resulting in lower fluorescence signal, which should be taken into account when designing biosensors with multicomponent reporting units featuring red or orange FPs, which sometimes exhibit this incomplete maturation.209 FPs also vary in their photostability and many will bleach upon extended illumination. Thus, FPs with good photostability should be used whenever possible in sensor design. Another FP-specific consideration is the fact that many FPs are pH sensitive. Depending on the application, this may be desirable or something to be avoided, and so should be considered in the design of a biosensor. Considerations related to pH are discussed in more detail in the Application Considerations section (section 3.3.3).
From these fundamental sensing and reporting unit parameters emerge features of overall biosensor performance, which impact biosensor applications across diverse contexts. Signal-to-noise ratio (SNR) is often used to quantify biosensor performance, which reflects how clearly the biosensor fluorescence response (signal) can be detected above fluctuations in the basal fluorescence (noise) and can be determined by dividing the amplitude of the sensor response by the standard deviation of the baseline. Higher values indicate greater reliability in measuring target biochemical changes. The contribution of noise increases as less light from the biosensor is able to reach the detector, a particular challenge when working with complex specimens where light scattering is more prominent, such as in tissue and in vivo imaging. One solution is thus to use the brightest sensor with the highest available dynamic range. The dynamic range of a biosensor is defined as the maximum difference between the fluorescence signals in the fully “on” and fully “off” biosensor states. Biosensors with large dynamic ranges hold greater utility in detecting minute changes in target concentrations or activity, such as at the subcellular level. Ideally, a high dynamic range can be achieved by pairing a sensing unit that undergoes a large conformational change with a reporting unit where the chromophore is sensitive to changes in the molecular environment, such as the cpEGFP in GCaMP,210 which has been demonstrated to show large changes in fluorescence upon Ca2+-binding. However, actual performance depends on efficient coupling between the sensing and reporting units, which can be hard to predict.
These fundamental aspects of biosensor function influence their overall sensitivity and performance and can be carefully selected to produce an ideal biosensor for a specific application.
3.3.2. Design Optimization
The overall performance of a biosensor is a synthesis of multiple more fundamental parameters, with the sensitivity of the sensor the most often discussed. Biosensor sensitivity is determined by the limit of detection and the response to the target of interest at physiologically relevant levels. This sensitivity and the overall performance of the biosensor, while influenced by individual fundamental parameters such as the affinity of the sensing unit, dynamic range, and SNR, can also be optimized in more complex ways, often specific to particular biosensor designs, with particular considerations for multi- versus single-component sensors.
A critical optimization strategy for FRET-based reporters is switching out the donor and acceptor fluorophores to identify an optimal pair that will result in the most efficient energy transfer in the high-FRET state. Another, complementary strategy is to include a long flexible linker, such as the “extension for enhanced visualization by evading extra FRET” (Eevee, or EV) linker developed by Komatsu et al. in the Matsuda lab, to separate the FPs and minimize energy transfer in the low-FRET state.211 The EV linker consists of a series of flexible (SAGG)n repeats, where “n” indicates the number of sequence repeats. This results in a greater difference between the “on” and “off” states of the reporter, and therefore a greater dynamic range.211 In these and other cases where the reporting unit has two components, both FPs should mature at similar rates, to avoid artificially affecting the emission ratio, and thus potentially affecting the biosensor response.
For biosensors incorporating single-component reporting units, linker optimization is a valuable strategy to improve biosensor performance. Varying the linkers that join the cpFP to the sensing unit has allowed for the engineering of large improvements in dynamic range in these types of sensors.202,212,213 The ideal linkers to use for any given biosensor are difficult to determine through rational design, making random mutagenesis of the linker residues the best way to develop a functional biosensor. In some cases, a single round of linker randomization and screening may be sufficient to identify a well-performing sensor.213 More commonly, however, several rounds of mutagenesis of the linkers or other parts of the sensor are applied in a directed evolution approach.196,214−216 Often these efforts are focused on the linker residues, but at times it is fruitful to induce random mutations throughout the sensor via error-prone PCR, especially within the cpFP in single-component reporting unit biosensors. To facilitate these efforts, novel high-throughput screening strategies have been developed and optimized for particular analytes of interest or sensor readouts.217,218 These directed evolution strategies are employed in the development of both multicomponent reporting unit and single-component reporting unit biosensors but are especially critical for the success of single-FP sensor strategies.219,220 While the details of these directed evolution and screening efforts are outside the scope of this review, these engineering strategies are crucial to modern biosensor development, and are an active area of research that is instrumental in the field.
Another optimization strategy for single-FP based sensors can involve testing different topologies for combining the sensing and reporting units.204 For instance, while inserting a cpFP between two components of a sensing unit remains a particularly common design strategy, recent developments in single-FP biosensors have shown that directly inserting the sensing unit into a non-circularly permuted FP can also be an effective approach. In both cases, attaching the sensing unit to so-called “gatepost” residues that surround a “bulge” within the FP β-barrel, often located in the seventh β-strand, has been suggested as a good starting point.202 In all design strategies, the use of monomeric FPs is important as well, as this will prevent aggregation of the biosensor.
3.3.3. Application Considerations
Many additional factors must be taken into consideration and optimized when users seek to apply a biosensor to answer a biological question. Decisions need to be made about which biosensors are most appropriate for specific applications, including which design strategy and imaging modality are most appropriate, as well as considerations specific to the biological system being investigated.
One of the first choices to consider is whether to use a single-component or multicomponent biosensor. Compared to FRET-based biosensors, single-FP-based biosensors tend to have greater dynamic ranges. In addition, incorporation of a single FP mitigates some of the drawbacks of multi-FP design schemes, such as high spectral occupancy or differences in FP maturation rates. However, there are also drawbacks to cpFP-based biosensors, including the increased sensitivity of the FP spectral properties to environmental factors like pH and ion concentrations, as the chromophore with a cpFP can be more exposed to the environment.56,60 These issues can be exacerbated by the fact that they generally lack an internal control, such as a second FP with a well-understood pH response to account for these changes. This should be considered for sensing schemes designed for acidic environments, such as inside the lumen of some organelles. Because single-FP sensors are generally intensiometric, they are also more susceptible to movement artifacts or changes in focal plane throughout imaging compared to multicomponent reporting unit scaffolds, where the second FP can additionally enable correction for movement. These difficulties can be somewhat mitigated by simply adding a second, carefully chosen FP as a point of normalization, either by appending it to one terminus of the sensor or inserting it within the sensor, known as the Matryoshka strategy.209 However, this removes some of the benefits the single-FP-based strategy, particularly the reduced spectral footprint. cpFPs can also take more time to achieve chromophore maturation.59 ddFPs also suffer from the same pH sensitivity issues as single-component reporting unit systems, so while they remain useful as single-color biosensors, they should be used with caution.
FRET-based biosensors or other ratiometric sensors can mitigate this pH sensitivity, as one FP can function as an internal control for the other, as long as the relative pH sensitivities of the two FPs are well-understood and calibrated.221 As described above, compared with the typical intensiometric readout offered by single-FP sensors, ratiometric readouts provided by FRET-based as well as certain ddFP-based biosensors mitigate the effects of certain variations such as cell thickness and illumination intensity and facilitate comparison and quantification. FRET-based biosensors also have well-defined lifetime changes, compared with single-FP based sensors. Contextualizing the advantages and disadvantages of these different reporting schemes to the intended use case is crucial to designing and selecting the most appropriate biosensor.
As will be discussed in section 4, many biosensors have been developed which harness the environmental sensitivities of FPs, but the relevance of the biological environment cannot be disregarded in the design of other biosensors, especially in cases where such environmental factors may change with or impact the signal of interest. For instance, detecting events within organelle lumens requires FPs that are pH-insensitive. Biosensors for detecting targets involved in signaling microdomains could require further controls to check for the effects of molecular crowding on biosensor performance. Regardless of design strategy, all biosensor experiments should carefully consider controls to avoid or mitigate changes in the sensor response due to effects other than the signal of interest. While this is especially problematic for single-component reporting designs, multicomponent reporting designs are not immune to these effects. As discussed briefly above, and further expanded on in section 4.1, many FPs are sensitive to pH changes. As such, pH changes during a biological process are a large source of off-target fluorescence changes in biosensors, although other environmental changes can affect fluorescence as well. An important strategy to account for these artifacts is the use of a “dead” sensor. In this case, a variant of the sensor is developed which is insensitive to the signal of interest, i.e., a target phosphorylation site is mutated to a nonphosphorylatable residue in a kinase sensor,222 or a binding site is mutated to abolish affinity for the analyte of interest. These “dead” sensors can then be used in parallel experiments under the same stimulation conditions to correct for off-target signals from the biosensor or to adjust experimental conditions to avoid these artifacts. For instance, in the case of peroxide sensors like HyPer or HyPerRed, a single mutation of a cysteine to a serine renders HyPer insensitive to peroxide, but still sensitive to pH.223 This “dead” sensor, termed SypHer, has subsequently been used to account for pH changes in peroxide-sensing experiments with HyPer and HyPerRed.
As discussed in the Fundamental Parameters section 3.3.1, the FPs used in a biosensor affect the wavelengths of light used for imaging, as well as the photostability of the sensor. It is therefore important to choose a biosensor in which the FP or FPs used match the context in which it will be used. For instance, in vivo imaging applications need longer wavelengths to penetrate tissue and therefore ideally use biosensors occupying red, far-red, or infrared spectral space. Certain wavelengths of light, such as those in the UV range, can also damage cells during high-speed or long-term imaging and should be avoided for such applications. This damage, referred to as phototoxicity, can also occur as a result of the chemical reactions that cause photobleaching. For this reason, photobleaching of FPs should generally be avoided by choosing FPs with high photostability and adjusting the imaging parameters (i.e., number of imaging cycles, experiment duration, exposure time, emission filters and detectors) to minimize the bleaching observed, not just to ensure the stability of the biosensor signal but also to ensure the health of the biological system being examined. One way to identify photobleaching is to include a vehicle control condition. If the biosensor signal changes over time even in response to a vehicle control, this may indicate that photobleaching is occurring. The advances in FP development and considerations in biosensor design discussed in this review so far have been applied to develop biosensors for numerous cellular targets. Specific design strategies vary between targets, especially with respect to the sensing units used, but the broad categories of multi- and single-component reporting unit designs, as well as the practical considerations discussed in this section, apply across many sensor families. These and other more specific considerations are discussed in the following sections, as biosensors designed to monitor specific cellular targets are discussed in more detail. The sensors are broadly grouped according to their biological targets, including cellular environment, ions, GPCR activation, and kinase activity. Within these broad categories, sensors for specific analytes are highlighted, with design considerations and biological applications for each discussed in more depth.
4. Cell Environment
The cell environment is defined by a myriad of factors, including pH, temperature, mechanical strain, molecular crowding, and voltage. Cellular signaling and function are finely attuned to changes in these conditions, both extra- and intracellularly. Thus, it is vital to characterize and understand dynamic changes in these environmental cues and the ways they affect cellular biology. The FP chromophore can often be directly sensitive to such environmental factors. Many iterations of FPs have been engineered to remove such environmental sensitivities, but these characteristics have also been harnessed to monitor environmental changes. Alternatively, more advanced FP-based environmental sensors incorporate dedicated sensing units with specific environmental sensitivities, following a more generalized biosensor design.
4.1. pH
pH is defined by proton (H+) content, which is generated from organic acids found within cells and can significantly impact cellular function.224 For instance, intracellular pH, which is typically alkaline in most living cells, is reported to become more acidic under apoptotic conditions.225 An added layer of complexity is revealed by the spatial regulation of pH, which varies from one organelle to another.226,227 The development and application of tools to probe pH changes in real time at subcellular resolution will be crucial to furthering our understanding of the spatiotemporal regulation of pH as it relates to cellular signaling and function.
4.1.1. Principles of pH Biosensor Design
As discussed earlier (see section 2.1.4), many FPs exhibit intrinsic pH sensitivity. This can be explained by the existence of two distinct states of the FP chromophore: a neutral, protonated form and an anionic, deprotonated form. In GFP, protonation of the chromophore alters the excitation spectrum, leading to enhanced excitation at 395 nm versus 475 nm, while deprotonation leads to the reverse.4,228,229 This characteristic has been exploited and critically engineered to measure changes in fluorescence intensity as a read-out of pH changes. In this pH sensing approach, the FP is further mutated to directly sensitize it to the optimal range of pH that is being sensed.
pHluorin was the first example of this type of genetically encoded pH sensor. It was developed by histidine scanning of sites in the GFP chromophore environment involved in forming an H-bond network with the Tyr 66 residue of GFP, including the critical residues Gln 94, Arg 96, His 148, Ile 167, Thr 203, and Glu 222, which are important for stabilizing the protonated GFP chromophore state. Altering this network enhanced sensitivity to pH at various pH ranges.230 Specifically, several rounds of mutagenesis resulted in the development of ratiometric pHluorin and ecliptic pHluorin. Ratiometric pHluorin increases in excitation ratio (395/470 nm) with increasing pH (between pH 7.5–5.5), whereas ecliptic pHluorin decreases in fluorescence at 470 nm excitation with more acidic pH, with complete loss of fluorescence at pH < 6.0.230 Sankaranarayanan et al. developed a brigher, superecliptic pHluorin that enabled greater changes in fluorescence intensity in response to pH changes.231 Mahon later developed pHluorin2 with enhanced brightness at 395 nm but similar pH sensitivity as ratiometric pHluorin, which they applied to detect changes in pH upon endocytosis of parathyroid hormone 1 receptor.232 Inspired by pHLuorins, Li and Tsien developed a red-shifted pH sensor, pHTomato, which is sensitive to pH 7.4 to 5.5. pHTomato was multiplexed with a calcium ion (Ca2+) sensor, GCaMP3 to study the interplay between vesicular turnover and synaptic Ca2+ signaling in neurons.233 More recently, Shen et al. developed a pH sensor based off of superecliptic pHluorin by introducing mutations that increased brightness and pH sensitivity. This pH sensor, called Lime, can detect pH changes between pH 7.4 and 5.5.234
A different ratiometric pH-sensing strategy was introduced by Pakhomov et al. using Dendra2, a monomeric FP that undergoes irreversible green-to-red photoconversion upon violet-blue excitation.235 Photoconverted Dendra2 turns back to green in acidic environments due to protonation of the chromophore phenol group. Using this behavior, Pakhamov and colleagues used photoconverted Dendra2 as a ratiometric pH sensor in which the red-to-green emission ratio correlates to increasing pH. One limitation of this strategy is the need for three illumination wavelengths: 400 nm light for photoconversion, 490 nm to excite the “green” chromophore, and 555 nm to excite the “red” chromophore. However, this strategy was suitable for measuring intracellular pH from 7.0–9.5 in mammalian cells (CHO and HEK293 cells).235 Although the large spectral space occupied by this sensor could be a disadvantage for multiplexed imaging approaches, the ratiometric readout is a distinct advantage for monitoring intracellular pH changes. Another unique approach to sensing pH was introduced in the sensor pHLIM, which, rather than quantifying changes in the emission properties of the pH-sensing FP, relied upon pH-dependent changes in the fluorescence lifetime of mApple, a red-emitting FP, to reduce uncertainty by enabling absolute quantification of single-color sensors, or improved SNR for FRET-based sensors.236 This new sensor can sense pH changes from 4.6 to 7.4 and was utilized to detect the pH of various endolysosomal compartments in mammalian cells.
After the introduction of the first pH sensors, multiple advances have been made in the generation and application of novel pH sensors in the live-cell context. One area that needed to be addressed involved optimization for measuring pH in different subcellular compartments that have variable characteristic pH ranges. For instance, pHluorin has recently been modified to enable pH sensing in the ER, which was not possible previously. Using a superfolder variant overcame misfolding of the sensor due to the oxidative environment of the ER to enable pH sensing in this compartment.237 Similar modifications may also enhance the use of pHluorin in other secretory compartments.
Another organelle in which pH sensing was previously difficult is the lysosome due to its highly acidic environment, which confers degradative function. Keeping this in mind, Burgstaller et al. developed pH-Lemon, a FRET-based sensor that pairs pH-sensitive EYFP with pH-resistant mTurquoise2 to visualize pH in acidic compartments.238 As the EYFP chromophore becomes protonated and thus quenched under acidic conditions, the FRET efficiency decreases, resulting in an increased cyan-to-yellow emission ratio for detecting changes in pH from 7.5 to 4.5. In 2021, long-term pH sensing in the lysosomal lumen was achieved with a new biosensor incorporating pHluorin-mCherry fused to the luminal domain of the lysosomal marker protein LAMP1, and a cytosolic facing 3XFLAG to make ratiometric pHluorin (RpH)-LAMP1-3xFLAG. The sensor was well localized to lysosomes and exhibited sensitivity to pH values relevant to the lysosomal lumen (pH 7.1–4.2). Using this biosensor, pH was tracked in the lysosomes of cells undergoing various stages of the cell cycle over 5 h and during cell migration.239 In the same year, Ponsford and colleagues developed FIRE-pHLy, another ratiometric pH sensor for detecting lysosomal pH within the range of 6.0–3.5. FIRE-pHLy was engineered using the teal-emitting FP mTFP1 and the red-emitting FP mCherry sandwiching LAMP1. Inserting LAMP1 between the two FPs ensures luminal targeting of the pH-sensitive mTFP and cytosolic exposure of mCherry. The sensor was used in primary neurons and iPSCs to elucidate lysosomal pH changes during neurodegeneration and aging.240 Tantama, Hung, and Yellen developed a ratiometric red pH sensor, pHRed, utilizing the red-emitting FP mKeima as the pH-sensitive reporter, which exhibits increased excitation at 440 nm versus 585 nm in acidic environments. pHRed exhibited a large dynamic range (∼10-fold) and was utilized for pH detection in the cytosol and mitochondria within the range of pH 9–5.5.241
Strategies to optimize pH sensors for various cellular compartments can greatly enhance our ability to study dynamic pH changes in relation to subcellular signaling events and processes. Future developments in pH sensors may also benefit from the identification of a more traditional design incorporating a proton-sensing molecular switch and pH-insensitive reporting unit to enable suitability for more diverse imaging modalities.
4.1.2. Applications of pH Sensors for Detecting Exocytosis, Endocytosis, and Autophagy
Certain cellular processes are marked by defined changes in pH levels, which can be tracked as an indicator of the stages in these processes. Vesicular trafficking via exo- and endocytosis, for instance, is marked by changes in luminal pH. Endosomal maturation into lysosomes involves acidification of the vesicular lumen.242 At neuronal synapses, exocytic vesicles are acidic (pH 5.6) but become alkaline (pH 7.4) upon fusion with the plasma membrane.231 Autophagy is similarly marked by autophagosome acidification as it fuses with the lysosome.243 Such defined changes in pH can be tracked to denote the phases of exocytosis or autophagy, which both necessitate changes in pH. Thus, along with enabling the detection of time-resolved and subcellular pH changes in live cells, pH sensors can be modified to report on these cellular processes.
The first reported use of pHluorin to detect acidification of synaptic vesicles as they underwent exocytosis230 highlights the potential for using pH sensors in this capacity. Superecliptic pHluorin was optimized precisely for this purpose and utilized in later studies to detect vesiclular fusion events, exocytosis, and endocytosis.244,245 Shen and colleagues later developed pHuji, a red-emitting, pH-sensitive FP for visualization of endo- and exocytosis concurrently with pHluorin. pHuji. and pHluorin were coimaged to detect differential sorting of two receptors into endocytic vesicles.246 A later red pH sensor for monitoring exocytosis was developed by Liu et al, called pHmScarlet, with enhanced sensitivity and greater brightness compared to pHuji and pHluorin.247 Using pHmScarlet, Liu and colleagues tracked single-vesicle exocytosis and demonstrated the biosensor’s ability to distinguish the previously undetectable docking step of exocytosis, beautifully exemplifying the utility of pH sensors for elucidating the steps of processes involving subtle pH changes.
In addition to exo- and endocytosis, pH sensors have been developed to probe autophagy, a process marked by luminal acidification of the autophagosome. The advent of FP tagging provided unprecedented spatiotemporal resolution in the study of autophagy, and a simple early strategy for monitoring autophagy was the passive labeling of the autophagosome protein LC3 (microtubule-associated protein 1 light chain 3) with GFP.248 Upon autophagy initiation, autophagosome formation can be detected by the presence of green punctate structures in the cell.249 Although this strategy can indicate autophagosome formation, it cannot provide time-resolved information on autophagy progression from autophagosome to autolysosome. Harnessing the pH-sensitivity of GFP, a second LC3-tagging strategy was developed to distinguish stages of autophagy in live cells. In this strategy, Kimura et al. fused mRFP and GFP in tandem to LC3 to be expressed in the autophagosome lumen. Upon autophagosome fusion with lysosomes, GFP fluorescence is quenched, but mRFP fluorescence is stable, providing a fluorescent readout of autophagy progression.250 The following year, Rosado and colleagues developed Rosella, a similar pH-sensitive system to monitor autophagy at various subcellular locations. This sensor includes DsRed fused to superecliptic pHluorin. pH sensitive pHluorin indicates acidification as the biosensor progresses through the stages of autophagy, and DsRed serves as the stable, pH-insensitive reference.251 In these sensors, however, the pH-sensitive element is not sensitive enough to detect the acidic lysosomal pH. Zhou et al. developed the mTagRFP-mWasabi-LC3 autophagy sensor in which the pH-sensitive element, mWasabi, is more suitable for detecting acidic pH environments than GFP or pHluorin.252 The latest stage in autophagic flux sensors focuses on engineering methods to distinguish the stages of autophagy progression with higher sensitivity. To this end, Kim and colleagues generated a red-green-blue autophagy sensor incorporating three FPs with distinct pH sensitivities fused to LC3. This sensor functions through sequential quenching of green, red, and blue fluorescence as compartmental pH becomes increasingly acidic.253
Building off strategies to detect autophagic flux, pH biosensors have recently been adapted to detect mitophagy, the autophagy of damaged mitochondria.254 A mitophagy sensor, mito-SRAI (signal-retaining autophagy indicator), was developed by Katayama et al. in 2020 to enable quantitative readouts of mitophagy.255 This FRET-based sensor incorporates a pH-insensitive and acidity resistant FP, afCFP (acid-fast CFP). This FP, also named TOLLES by Katayama et al. (TOLerance of Lysosomal EnvironmentS), is fully fluorescent at acidic pH in the lysosomal lumen (pH 4–5). TOLLES is fused to YPet, which is irreversibly denatured in the acidic environment of the lysosomal lumen. This FRET-pair exhibits high FRET efficiency in less acidic environments but decreases in FRET as autophagy leads to compartment acidification. In addition to enabling autophagy detection, SRAI was targeted to the mitochondrial matrix to enable detection of mitophagy in mouse embryonic fibroblasts and in vivo in nondopaminergic neurons of the mouse midbrain. Furthermore, mito-SRAI was used to screen for therapeutic inducers of mitophagy in a high-throughput context. Katayama and colleagues identified several hits that induce mitophagy in cells,255 illustrating the diverse applicability of such robust biosensors of cellular processes.
As demonstrated by the capability of pH sensors to detect exocytosis and autophagy, the biosensor toolbox holds great potential for characterizing cellular processes that exhibit variable cellular signaling or environmental properties, or alternatively for characterizing and quantifying changes in the environment and signaling during certain processes.
4.2. Temperature
Body temperature has long been an indicator of human health and reflects the impact that cellular temperature changes may have on cellular health as well. Heat is important to many cellular processes. At the molecular level, heat can shift the equilibrium of chemical reactions within cells. At the cellular level, temperature changes can induce altered expression of heat shock proteins,256 and temperature changes dynamically throughout the cell cycle.257 Methods for monitoring temperature could therefore elucidate the interplay between heat/temperature and cellular signaling. To this end, there are generally two approaches for developing biosensors to monitor temperature: leveraging the intrinsic temperature sensitivity of FPs by monitoring thermal quenching or using a molecular switch that changes conformation at different temperatures.258
The earliest FP-based temperature sensor was reported in 2007. This sensor took advantage of the intrinsic blinking properties of EGFP using fluorescence correlation spectroscopy (FCS). This imaging method can be used to define some of the photophysical properties of FPs that affect temporal changes in fluorescent intensity, such as diffusion dynamics and molecular concentrations or interactions.259 Wong et al. used EGFP in this context to measure laser-induced heating in liquids.260 The protonation/deprotonation of Tyr 66 in EGFP, and the corresponding change in 488 nm excitation, can be correlated to temperature, as the relaxation time associated with EGFP blinking (related to protonation state) depends on fluctuations in temperature, which can in turn be quantified by FCS. This sensor was not validated in cellular systems, as EGFP blinking is also influenced by changes in pH and salt concentrations which are variable within the cell. However, this approach presents an early example of an FP being used to measure temperature.260 Another study in 2012 also directly used GFP as a thermal nanoprobe to map intracellular temperature in HeLa and U87 glioma cells with 0.4 °C temperature precision. This approach is based on the interrelation of fluorescence polarization and molecular rotation, which is accelerated with increasing temperature. Faster rotational motion leads to decreased fluorescence polarization. Therefore, by measuring the polarization of GFP fluorescence emission, Donner and colleagues used the FP as a temperature sensor.261 In 2015, the first red-emitting temperature sensor was generated using mRFP1 in E. coli. Different variants of mRFP1 were made to exhibit variable sensitivities to changes in temperature. Fluorescence intensity decreased with increasing temperature, which Deepankumar and colleagues postulated was due to thermal quenching of mRFP1 fluorescence, wherein a temperature change from 4 to 40 °C yielded a 40.5% decrease in fluorescence intensity.262 More recently, a ratiometric temperature sensor called B-gTEMP was developed.258 This sensor is a follow up on gTEMP, a bicistronic construct that incorporates mT-Sapphire and the blue-emitting FP Sirius, which exhibit variable temperature sensitivities, linked by a T2A peptide to ensure equal expression levels in the cell.263 B-gTEMP incorporates the tandem fusion of mNeonGreen and tdTomato to report on temperature changes with greater SNR, faster kinetics, and greater sensitivity (155 μs time resolution, 0.042 °C temperature resolution). Both gTEMP and B-gTEMP rely on thermal quenching of the FP chromophore to alter fluorescence intensity and serve as a readout of temperature changes.
Early iterations of temperature sensors were all designs that used intrinsic changes in FP properties to detect temperature changes. However, the more conventional sensing-and-reporting-unit configuration has also been utilized to generate FP-based temperature sensors. In 2013, Kiyonaka and colleagues generated tsGFP, wherein GFP serves as the reporting unit coupled to tandem coiled-coil structures from the Salmonella thermosensing protein TipA as the sensing unit. GFP is sandwiched between the two coiled-coil structures, with changes in temperature causing conformational changes in TipA that can induce quantifiable changes in GFP fluorescence.264 Another such temperature sensor is the FRET-based ELP-TEMP, which incorporates a temperature-responsive elastin-like polypeptide with two FPs (mTurquoise2 and mVenus) to detect temperature changes wherein increased temperature leads to greater FRET efficiency. ELP-TEMP exhibited the highest temperature sensitivity (45.1 ± 8.1% response/1 °C in the range of 33–40 °C) compared with other sensors available at the time.265 Such improvements in temperature sensors are crucial for future work in understanding how subcellular variations in temperature under various conditions may cause or respond to alterations in cellular signaling. A GFP-based sensor was recently used to resolve mitochondrial temperature changes in cells treated with a chemical uncoupler of oxidative phosphorylation, exhibiting the first use of an FP-based temperature sensor to detect subcellular temperature changes.266 However, further work in improving the spatial, temporal, and temperature resolution of these sensors is necessary to allow more robust subcellular characterization.
4.3. Mechanical Strain
Cells are responsive to forces acting on them both extracellularly and intracellularly and several force-responsive proteins exist to transduce these mechanical forces into signaling information within cells, leading to changes in cellular morphology, cytoskeletal organization, transcription, and more.267−271 Extracellular rigidity and stiffness can affect the mechanical strain or forces that cells experience. Changes in such factors can be important elements in carcinogenesis.272 Despite the link between mechanical strain and cellular signaling, the specific impacts of changing mechanical strain on signaling and cellular function are poorly understood. Current methods for characterizing mechanical strain, such as atomic force microscopy and magnetic tweezers, cannot be readily applied to probe forces within cells or in vivo. Therefore, biosensors of mechanical strain can elucidate how these molecular forces can affect cellular signaling activities in single cells to extract more meaningful insights.
Mechanical strain sensors rely on the elastic deformation of protein structures in response to physical forces. By incorporating peptide linkers that can be elastically deformed under exposure to mechanical force or strain between or within the reporting unit(s), the sensor can provide a fluorescent readout of this force. Many synthetic flexible linkers have been developed and used in sensors, as well as many peptides derived from flagelliform silk. These peptides are usually sandwiched between or linked to the reporting unit(s), and then the whole construct is introduced into a protein that experiences mechanical strain, such as a mechanotransducer protein. The region of sensor integration is important for obtaining an accurate readout of mechanical strain and should be in a mechanically active region.273 A simple example is the stretch-sensitive FRET sensor (stFRET) that was developed by Meng et al. from the Sachs lab, who linked the cyan-yellow FRET pair Cerulean and Venus using an α helix.274 Upon loading of force onto the sensor, the helix stretches and increases the distance between the FRET pair, leading to reduced FRET.274 Inserting stFRET into different POIs allowed Meng and colleagues to visualize spatiotemporal force exertion on those proteins during various processes. For instance, when inserted into actinin and filamin, stFRET revealed greater mechanical stress at the leading edge of migrating cells than at the trailing edge.275 stFRET was later improved by incorporating a more relaxed (less rigid) helical peptide as the sensing unit to achieve a wider dynamic range within the 5–7 pN range (50% decrease in FRET in response to increased force), while still relaying similar stress patterns as identified by stFRET.276
cpstFRET (circularly permuted stretch-sensitive FRET sensor) was subsequently generated to overcome limitations on sensitivity and dynamic range of the original stFRET construct stemming from the sensing unit peptide, which basally separates the FRET pair and thus limits the ability of stress/force application to further reduce FRET. Incorporating circularly permuted versions of Cerulean and Venus allowed the FRET pair to be positioned closer together and in a more favorable orientation in the basal (relaxed) state, thus maximizing the signal difference from the stretched state.277 An added benefit of this variant is its smaller size (30% lower molecular weight) compared to the original stFRET, making its insertion less likely to perturb the fused target protein.
Another development was TSMod, or tension sensor module, a FRET-based biosensor developed by Grashoff et al. by sandwiching an elastic tension sensing domain (40 amino acids) from silk protein flagelliform between Venus and mTFP1.278 To study focal adhesions, the sensor was inserted into the mechanotransduction protein vinculin, between the N-terminal head and C-terminal tail. In vitro validation using laser tweezers to cyclically apply stress revealed that the sensor is responsive to stress from 1 to 6 pN. In live cells, the mechanical force experienced by vinculin during cell migration was mapped to reveal higher force in focal adhesions at the leading edge of the cell compared with the trailing edge.278 This sensor variant was also optimized in subsequent studies for use with VE-cadherin and PECAM1.279 Tension sensors were developed using the 35-amino-acid-long villin headpiece peptide (HP35) sandwiched between YPet and mCherry.280 HP35 is an ultrafast-folding peptide that goes through an equilibrium unfolding/folding transition in response to mechanical forces of ∼7 pN, and a mutant version responds to 10 pN forces (HP35st). By incorporating either of these two peptides, two different sensors were developed with response thresholds of 7 and 10 pN. The sensor was incorporated into Talin in an unstructured linker region found between the head and rod domain of the protein and used to characterize forces exerted on Talin during cell adhesion and extracellular rigidity sensing.280
Biosensor development benefits greatly from the diversity of imaging approaches available to enable response quantification. For sensing strain, Iwai and Uyeda made use of proximity imaging (PRIM) to develop a strain biosensor called PriSSM.281 PRIM allows for the detection of distance based on spectral changes caused by proximity between two FPs.282 In this strain sensor, a 29-amino-acid-long flexible linker (AS(GGS)9) is incorporated between unmodified and circularly permuted GFP (cp174GFP). Spectral changes between the two GFPs are probed (ratio of emission at 490 over 390 nm) as mechanical strain is introduced to the sensor and affects the inter-FP distance. The sensor was incorporated between two motor domains of myosin II, and upon movement of the motor domains, mechanical strain was introduced to the sensor.281 This allowed for the sensing of small forces, on the scale of several piconewtons. In another example of exploiting diverse approaches to quantify biosensor response, Ren and colleagues from the Berro lab generated a force sensor that took advantage of protein condensation induced by force.283 Rather than quantifying fluorescence intensity, condensate formation induced by force served as an indicator of force distribution in yeast. Ren et al’s biosensor includes dimeric coiled coils that unfold to expose hydrophobic interaction surfaces upon exposure to forces in the range of 2–14 pN. These surfaces being exposed can induce oligomerization, which can then lead to protein condensation. The coiled-coil was inserted to Hip1R, a yeast protein present at endocytic sites, and GFP was fused to the C-terminus. As the protein underwent force, protein condensates were formed. Quantification of condensate diameter and number of condensates per cell served as a readout of force. Three FRET sensors were developed in 2016 incorporating 25-, 40-, and 50-amino-acid peptide repeats from spider silk to detect a wider range of forces, with the shortest peptide having the widest range of force sensing at 2–11 pN.284 A subsequent study published the following year introduced a FRET-based tension sensor reporting in the single-piconewton regime, called FL-TSM.285 This sensor is sensitive to 3–5 pN forces, and incorporates a ferredoxin-like linker peptide that has a more immediate response to forces above a certain threshold (∼3 pN) to yield a “digital response”. This linker peptide was sandwiched between the yellow-red FRET pair YPet and mCherry, and the sensor was tested upon insertion into talin and multiplexed with an orthogonal talin sensor incorporating mTFP1 and LSSmOrange to validate the observed response.285
Traditionally, tension sensors have been developed in an ad hoc way. However, in 2018, a tunable tension sensor was developed and tested in vinculin utilizing rational sensor design.286 A method was developed to predict sensor sensitivity in cellulo by characterizing existing sensors before and after incorporating modifications to determine how sensor properties change. The most important properties that defined the mechanical sensitivity of tension sensors were identified to be the mechanical properties and length of the tension sensing domain, the physical separation between the two FP chromophores, and the relative orientation of the two FPs. The physiological relevance of the range of force sensing in most tension sensors (variable from 1–11 pN) is unclear, so LaCroix and colleagues also developed several Clover-mRuby2 incorporating sensors with unstructured polypeptide domains (of variable lengths) that can be selected for use in different contexts based on dynamic range, mechanical sensitivity, and extension or force-based strain exposure.286
There is still much to be learned about mechanosensing proteins and mechanotransduction, which can be discovered using strain or tension sensors. What we learn using these biosensors can in turn enable fine-tuning of biosensor properties to enhance their physiological relevance, as exemplified by the work done by LaCroix and colleagues to define the most important characteristics of a tension sensor via in silico modeling. The development of a broader range of mechanosensing biosensors with variable properties will aid in these efforts.
4.4. Molecular Crowding
Cells contain high concentrations of biomacromolecules, and measuring the molecular crowding in cells can help elucidate the physical and chemical properties of the cytoplasm or other cellular compartments like the nucleus. Similar to tension sensors, biosensors for visualizing molecular crowding incorporate flexible linkers between reporting units that deform in response to molecular crowding and result in altered fluorescent readout. For instance, a FRET-based molecular crowding sensor called CrGE was developed in 2015 by incorporating a flexible domain comprising 2 α-helical peptides that undergo conformational changes between an mCerulean and mCitrine FRET pair, with the monomerizing A206K mutation incorporated to reduce dimerization/self-association.287 CrGE was characterized in vitro using Ficoll PM70 or polyethylene glycol (PEG) as the crowding agent, as well as in E. coli. Increased FRET was observed under high-crowding conditions. Importantly, CrGE is not sensitive to small molecules, ions, or DNA. A newer generation of CrGE, named CrGE2.3, was later developed by incorporating mEGFP and mScarlet-I as the FRET pair.288 CrGE2.3 was used to reveal age-dependent changes in organellar crowding in yeast and that stability of crowding, rather than absolute crowding levels, was a suitable predictor of lifespan in this model organism. The FPs in CrGE2.3 had similar chromophore maturation kinetics, which made this sensor more suitable for long-term imaging experiments, whereas the original CrGE was limited to short-term imaging.288
Another improved sensor for macromolecular crowding, called CRONOS, was developed and used to look at changes in crowding in membraneless organelles. CRONOS uses mNeonGreen and mScarlet-I as the reporting unit and the same sensing unit as CrGE and can be targeted to different membraneless organelles. For instance, CRONOS was fused to NPM1, a protein that forms nuclear condensates containing rRNA and proteins with arginine-rich linear motifs,289 and thereby targeted CRONOS to the nucleolus. Upon inhibition of transcription or induction of environmental stress, molecular crowding levels within the nucleolus were reduced, as sensed by CRONOS.290
More recently, Joron and colleagues determined that changes in FP fluorescence lifetimes can be used to report on molecular crowding.291 Specifically, certain monomeric FPs, including mCherry, mRFP, mCitrine, and mEGFP, exhibited significant decreases in fluorescence lifetime in vitro upon exposure to polyethylene glycol PEG. Using this property, Joron and colleagues tagged the histone protein HP1α with mCherry and measured changes in fluorescence lifetime in early differentiated and undifferentiated mouse embryonic stem cells. Upon differentiation, the biosensor revealed a transition to a less heterogeneous and less dense population of nuclear condensates compared to the highly heterogeneous distribution of condensates in undifferentiated cells. This single-color approach to visualizing changes in molecular crowding in live cells may ultimately open the door to multiplexed imaging applications to study the behavior of biomolecular condensates.
Biosensors to probe molecular crowding are relatively new, with few examples reported thus far. The generation and application of more single-color variants will be an important step moving forward, especially for establishing relationships between molecular crowding and other important cellular properties or signaling events.
4.5. Transmembrane Voltage
Voltage, in the context of cell biology, refers to the difference in electrical potential across the plasma membrane caused by differences in the intra- and extracellular concentrations of negatively and positively charged ions. ATP-driven ion transporters actively maintain this charge imbalance, leading to a slightly negative resting membrane potential, or voltage, in all cells. In neurons and other electrically excitable cells, extracellular signals acting on transmembrane ion channels can trigger substantial changes in voltage, including action potentials marked by sudden and transient membrane depolarization, that induce downstream cellular signaling events.292 Voltage-dependent signals such as action potentials are exceptionally important in neurobiology, as they are crucial to neuronal function. Voltage sensors, often called genetically encoded voltage indicators (GEVIs), are therefore frequently used in neuroscience to monitor electrical potential across neuronal plasma membranes and directly visualize neuronal activity.
GEVI design relies on many of the same considerations that are important for fluorescent biosensors overall. In general, GEVIs incorporate the reporting unit into a transmembrane voltage-sensing protein which undergoes conformational changes in response to membrane potential changes. The large majority of GEVIs exhibit a decrease in fluorescence signal upon membrane depolarization. Sensor performance thus relies greatly upon the sensitivity and performance of the selected voltage-sensing units, as well as FP brightness. Additional factors are at play for GEVIs, however. Because membrane potential must be measured at the plasma membrane, GEVIs depend on robust plasma membrane targeting to enhance their presence at this crucial site. The first generation of GEVIs was severely hindered in performance by their poor plasma membrane localization, which resulted in a large proportion of voltage-insensitive fluorescence, confounding actual readout of membrane potential changes.293 Methods to improve GEVI membrane localization are important to amplifying their voltage-dependent responses. Membrane localization is also a limiting factor in GEVI performance, as the quantity of biosensors available at the membrane is controlled and therefore limits the signal amplification that can be achieved by increasing sensor expression at the membrane. As such, GEVI optimization is also greatly focused on increasing the difference between the “on” and “off” states of the biosensor to maximize amplitude and dynamic range. Furthermore, because action potentials are very rapid, biosensor kinetics must be equal to or faster than voltage transients occurring on milli- or submillisecond time scales. Achieving rapid kinetics for voltage biosensors has traditionally been a limitation in the field and is an important consideration for optimizing voltage sensor performance. In this context, the field has traditionally focused on several specific aspects of GEVI development. Below, we will discuss two of the most common classes of GEVIs, which are based on sensing units derived from either voltage-sensing domains (VSDs) or rhodopsins,294 highlighting the most recent developments among efforts to overcome some of the aforementioned challenges. We also highlight recent applications of GEVIs that have enriched our understanding of neurobiology.
4.5.1. Voltage Sensing Domain-Based Voltage Biosensors
The first GEVIs relied on the coupling of a reporting unit to VSDs derived from voltage-gated ion channels or voltage-sensitive phosphatases (Figure 6a,b). For such biosensors, optimizing the sensing domain itself via mutations or optimizing linker sequences are common approaches to improving biosensor performance and voltage sensitivity.295−301 Here, we will focus on some of the first VSD-based GEVIs to be introduced and highlight various families that have been developed more recently, with an eye toward the incremental improvements that have been made to biosensor performance.
Figure 6.

Types of genetically encoded voltage indicators (GEVIs). (a,b) Voltage sensing domain (VSD)-based GEVIs incorporate a voltage-gated ion channel or voltage-sensitive phosphatase as a sensing domain, tagged to either a FRET-pair (a) or cpFP (b). Membrane depolarization induces a conformational change that alters FRET efficiency or fluorescence intensity of the cpFP. (c,d) Rhodopsin-based GEVIs include a 7-transmembrane photoreceptor, or rhodopsin, as the sensing unit. The rhodopsin exhibits an intrinsic fluorescence signal that is affected by membrane depolarization. In the single-fluorophore design (c), this intrinsic fluorescence change is the readout of membrane potential. Electrochromic FRET-based GEVIs (d) include a bright FP as a FRET donor paired with the rhodopsin, which acts as an acceptor. Upon membrane depolarization, donor FP fluorescence is quenched, yielding a decrease in fluorescence intensity.
The first VSD-based voltage biosensor was developed in 1997 when Siegel and Isacoff developed FLaSH, a green voltage sensor wherein GFP is inserted into the cytosolic C-terminal tail of the voltage-sensitive Shaker potassium ion (K+) channel, just after the sixth transmembrane helix (S6).195 Upon membrane depolarization, the channel undergoes a conformational change that leads to an ∼5% decrease in GFP fluorescence intensity. Sakai and colleagues subsequently generated the first FRET-based voltage biosensor called VSFP (voltage sensitive fluorescent protein). In contrast to FLaSH, which incorporates the full-length Shaker channel, VSFP consists of a minimal VSD from the Kv2.1 K+ channel fused to cyan and yellow FPs.302 A voltage-dependent conformational change in the VSD leads to an increase in FRET upon membrane depolarization (Figure 6a). The dynamic ranges of these early voltage sensors were severely limited, and optimization efforts focused on improving dynamic range by incorporating brighter FPs to amplify the effect of fluorescence change upon membrane depolarization. For instance, in 2008, Tsutsui et al. generated a FRET-based GEVI named Mermaid303 using new, coral-derived FPs.303 Mermaid uses the VSD from Ciona intestinalis voltage sensing phosphatase (Ci-VSP) coupled to the relatively pH-insensitive green FP Umi-Kinoko (UKG) and the orange FP mKO as the FRET pair. Mermaid yielded a greatly improved dynamic range, with a 40% emission ratio change upon a 100 mV voltage change. However, the biosensor response exhibited fast (7.3–17.4 ms) and slow (98–638 ms) components, as well as slow “off” kinetics, which suggested a multistep conformational change in the VSD. Mermaid2 was then developed in 2013 by replacing the FRET pair with CFP and YFP, resulting in slightly improved dynamic range and “on”/”off” kinetics (0.93 ms “on”, 10.3 ms “off”).304 Nevertheless, Mermaid2 incorporates the same VSD as Mermaid, and thus exhibits a multistep conformational change upon membrane depolarization that complicates the biosensor response.
Around the same time, Jin and colleagues from the Cohen and Pieribone laboratories generated a single-color GEVI named ArcLight.295 ArcLight incorporates the VSD of Ci-VSP (CiVSD) along with ecliptic pHluorin (pH-sensitive GFP variant, see section 4.1). Upon membrane depolarization, much like other VSDs, Ci-VSD changes conformation, and the FP inserted into the sensing domain undergoes changes in fluorescence intensity (Figure 6b). An A227D mutation unintentionally introduced to ecliptic pHluorin resulted in improved dynamic range, which was further enhanced by inserting the FP closer to S4 of in the CiVSD sensing domain. The final ArcLight A242 variant exhibited a 35% fluorescence intensity decrease in response to 100 mV depolarization in HEK293 cells. Despite the high voltage sensitivity, ArcLight lacked the temporal resolution necessary for spike detection (∼10 ms reported response time). Subsequent improved ArcLight variants were developed by introducing mutations into the VSD to improve biosensor kinetics, including the GEVI Bongwoori, which was able to resolve action potentials in neurons with a reported response time of approximately 6–7 ms.298
Another family of VSD-based sensors is the accelerated sensor of action potentials (ASAP) family, which started with the development of ASAP1.305 In contrast to the aforementioned designs, in which the reporting unit is inserted C-terminal to the VSD, St-Pierre and colleagues from the Lin lab generated ASAP1 by inserting cpGFP into the extracellular loop connecting helices S3 and S4. All VSDs are thought to undergo voltage-dependent conformational changes in these regions, and the authors reasoned that inserting the reporting unit here would lead to efficient conformational coupling. Specifically, they used the VSD from Gallus gallus VSP, which has a shorter S3–S4 extracellular loop compared with CiVSD, and observed that the inserted cpGFP undergoes a loss of fluorescence intensity in response to membrane depolarization. ASAP1 was a great improvement in terms of response time, with on/off kinetics of ∼2 ms, which is faster than other variants available at the time, and the high brightness, dynamic range, and fast kinetics of ASAP1 make it a preferred voltage biosensor in the field. Several improved variants have been developed since the introduction of ASAP1. The latest variant, ASAP4e, exhibits improved photostability and is particularly notable for its large, positive response to membrane depolarization. A single-color GEVI with a positive response has long been sought after in the field, as depolarization-induced fluorescence increases would allow more robust and reliable measurements of neuronal activity. Reported in 2023 by Evans and colleagues from the Lin lab, ASAP4e was generated by exhaustively screening mutations at two sites within GFP to alter the chromophore H-bond network and invert the response, followed by structure-guided mutation to tune the voltage sensitivity and dynamic range. These efforts yielded a sensor with a 210% fluorescence increase within the physiological voltage range, along with high temporal resolution (activation kinetics of 2.6 ms at room temperature). These properties of ASAP4e were harnessed to achieve long-term in vivo imaging of voltage and Ca2+ changes in behaving mice.215
4.5.2. Rhodopsin-based Voltage Biosensors
A second major class of GEVIs incorporates rhodopsin-based sensing domains (Figure 6c,d). Rhodopsins are 7-transmembrane photoreceptors that contain retinal as a covalently bound chromophore.306,307 These proteins are named for animal (or type II) rhodopsins, which are a family of light-sensing G-protein coupled receptors (GPCRs) involved in phototransduction in the retina. However, it is the much larger family of microbial (or type I) rhodopsins, which often function as light-activated ion channels, that has inspired this class of GEVIs.306,307 The first rhodopsin-based voltage sensor, PROPS (proteorhodopsin optical proton sensor), was generated by Kralj and colleagues from the Cohen lab, who utilized a mutated form of the green-absorbing protein proteorhodopsin to detect electrical spiking in E. coli.308 However, PROPS failed to localize correctly to the plasma membrane in eukaryotic cells, leading Kralj et al. to generate a GEVI based on the microbial rhodopsin Archaerhodopsin 3 (Arch), which successfully reported voltage changes with a 2-fold fluorescence intensity change and submillisecond response time within the range of −150 to +150 mV in HEK293 cells.309 This first foray into rhodopsin-based voltage sensing by the Cohen lab birthed a new subclass of Arch-based GEVIs.
Subsequent iterations of Arch-based GEVIs aimed to improve upon some of the limitations of the original sensor. For instance, early engineering efforts were directed at eliminating the native proton-pumping activity of Arch, which generates a photoinduced current that can perturb endogenous membrane potential.309−311 Arch, which excites at ∼560 nm and emits at 690 nm,309 is naturally very dim. At only 9 × 10⁻⁴ (ref (309)) the quantum yield of Arch is lower than GFP, thus severely limiting its application. Like other microbial rhodopsins, Arch fluorescence is driven by a complex photocycle, where the protonation equilibrium of a specific photointermediate confers sensitivity to membrane voltage312−314 (Figure 6c). The voltage sensitivity and performance of Arch-based biosensors have thus been improved by mutating residues involved in the opsin photocycle.310,311,315 This led to the development of several Arch variants with improved brightness, quantum yield, and voltage sensitivity that have been used to develop intensiometric GEVIs, including Archers,316 QuasArs,310 Archons,317 and Arch5 and Arch7.318 Each of these sensors exhibit distinct characteristics and advantages that make them suitable for imaging in different contexts.319 For instance, Archer1 incorporates Arch3 (D95E//T99C) tagged with EGFP as a reference, along with membrane-trafficking and ER-export sequences to enhance plasma membrane localization, and exhibits a 25–40% fluorescence intensity change in response to action potentials.316 With its higher brightness relative to other Arch-based sensors available at the time, Archer1 was used to image activity in neuronal networks in C. elegans.316
A new frontier in the field of rhodopsin-based GEVIs was established with the development of electrochromic FRET (eFRET)-based GEVIs (Figure 6d). This strategy repurposes Arch as a voltage-sensitive FRET acceptor for another attached FP that serves as a much brighter FRET donor. When membrane depolarization occurs, a voltage-dependent shift in the absorption spectrum of the retinal chromophore results in nonradiative donor quenching, yielding a robust decrease in donor fluorescence intensity,320,321 thus overcoming the intrinsically low brightness of Arch-based sensors. The Cohen and Schnitzer laboratories introduced such eFRET sensors in 2014 in two different studies. Zou et al.321 aimed to diversify the palette of GEVIs, which at the time largely comprised green VSD-based or near-IR Arch-based GEVIs, by pairing Arch with various donor FPs.321 They introduced 4 new GEVIs by fusing QuasAr2310 to eGFP, Citrine, mOrange2, or mRuby2. These sensors generated average intensity decreases ranging from 7.7 to 13.1% following 100 mV membrane depolarization in HEK293 cells. A citrine-Quasar2 fusion, named citrine-arch eFRET sensor (CAESR), was also developed by Brinks and co-workers which, with a calibration of membrane voltage to citrine lifetime, enabled monitoring of absolute voltage using 2-photon FLIM.322 Alternatively, Gong et al. used Leptosphaeria maculans (Mac) rhodopsin as the voltage sensor, which has a blue-shifted absorption spectrum and slower photocycle, potentially increasing voltage sensitivity, compared with Arch.323 The eFRET sensors MacQ-mCitrine and MacQ-mOrange2 were developed by fusing mCitrine or mOrange2, respectively, to the Mac C-terminus. Membrane depolarization from −140 to 100 mV in cultured neurons resulted in fast (∼3 ms) responses and approximately 20% fluorescence intensity changes. The rapid kinetics of the MacQ sensors are more suitable for spike detection compared with VSD-based designs and have been applied in brain slices from the mouse neocortex and dendrites of Purkinje neurons in live mice.323 eFRET represents an important advance in GEVI design that continues to expand the palette of sensors available for high-speed voltage imaging,324−326 as well as multiplexing applications.
4.5.3. Recent Advances in the Development of Red Voltage Biosensors
In recent years, voltage sensing applications have been expanded to track voltage changes across organelle membranes327 or in vivo. Although the green GEVI ArcLight was recently used for in vivo voltage imaging in a transgenic mouse model,328 recent engineering efforts have focused on expanding the toolbox of GEVIs to include red and far-red sensors that are more suitable for in vivo and deep-tissue imaging. For instance, a red-fluorescent GEVI with millisecond kinetics was developed in 2019.329 For this red GEVI, Kost et al. set out to optimize the linkers found in VSD-FR189–188, a previously developed GEVI scaffold in which CiVSD is inserted into cpFusionRed.330 A total of 13 different short linkers were tested, yielding variants with 25-fold faster response kinetics. A specific linker length that inverts the fluorescence change from negative to positive was also identified, introducing important differences to this red voltage sensor. While dynamic range was not improved, the rapid kinetics are a significant improvement. Additional improvements in dynamic range can further optimize this sensor for in vivo imaging.
Another red-fluorescent GEVI, VARNAM (voltage-activated red neuronal activity monitor), was developed shortly afterward by fusing the fast Acetabularia opsin (Ace) to the bright, red-emitting FP mRuby3.331 VARNAM was successfully used in vivo and combined with blue-shifted optical tools to allow dual-color voltage spike imaging in brain slices or live Drosophila with enhanced sensitivity to subthreshold voltages. In an alternative strategy using a VSD as the sensing unit, a FRET-based NIR GEVI named nirButterfly was recently developed by sandwiching a chimeric VSD, based on Ci-VSP and the Kv3.1 K+ channel,332 between an miRFP670 donor and miRFP720 acceptor.328 Through a series of linker screens, Monakhov et al. were able to optimize nirButterfly performance to achieve multiplexed imaging of voltage and Ca2+ responses in cortical neurons.
As technologies advance, new protocols are being developed to optimize biosensor dynamic range and response kinetics to yield greatly improved GEVIs. For instance, a new screening platform was developed in 2023, called Photopick,217 which was used to evolve Arch-based GEVIs to generate variants with improved SNR (QuasAr6a) and kinetics (QuasAr6b), as well as higher brightness in cultured neurons and in vivo mouse brains. Tian and colleagues used the coexpressed photoconvertible FP mEos4a with a mutant GEVI library in mammalian cells, then imaged with an ultrawidefield imaging system.333 Cells with the correct phenotype were phototagged with patterned illumination, harnessing the photoconverting capability of mEos4a. The cells were then sorted by FACS to create a sublibrary from the phototagged population. High-throughput screening was used to quantify the prevalence of candidate sensors. The authors started with Archon1,317 which has been validated in vivo, tagged to the yellow-emitting FP Citrine. The final versions included various mutations in Arch that yielded the two improved variants QuasAr6a and QuasAr6b.334 Such innovative approaches to developing improved biosensors can pave the way for future advancements in the field.
As evidenced by the large amount of recently developed voltage sensors and diverse applications of these sensors, the burgeoning field of GEVI development is poised to enable deep insights into fundamental aspects of cellular signaling.
5. Ions
Within single cells and across tissues, many of the signaling cascades important for life are regulated by the flow of ions, the movement of which is carefully regulated. The movement of ions across cell membranes results in membrane potential (see section 4.5), and ion release from internal stores is an important component of downstream processes such as neurotransmitter release, further second messenger generation, and activation of effector enzymes. Dysregulation of these ionic signals can lead to cellular dysfunction and disease. Because of their critical and varied roles in cellular communication, ions have been targets of biosensor development for decades.
Many innovations in biosensor development were originally made to facilitate the sensing of ion concentration changes, including the use of cpFPs.56 Subsequent innovations in ion biosensor design have focused on improving the specificity of the sensing units. Divalent metal cations are among the most biologically relevant ions, and binding domains sensitive for one species may be affected by several others. The ability to specifically discriminate between ions is therefore a critical design consideration. There are broadly two strategies for ion biosensor sensing units. In the first approach, two peptide binding partners are used, whose affinity for one another increases upon binding of the ion of interest. The resulting conformational change then modulates the response of the reporting unit. Typically, this is manifested as a change in either FRET between two FPs (Figure 7a, top) or the fluorescence intensity of a single FP (Figure 7a, middle). The other strategy leverages the intrinsic ion-binding behavior exhibited by certain FPs, whereby ion binding directly changes FP fluorescence properties (Figure 7a, bottom). The ion binding region can then be engineered to achieve higher affinity and specificity for the ion of interest and a greater response. Although less common, this strategy is notably applied in the development of halide sensors, alongside some reporters for metal ions.
Figure 7.

Monitoring ion concentrations using FP-based sensors. (a) The three primary biosensor design strategies used for ion sensors: FRET-based sensors (upper), single-FP sensors (middle), and sensors in which the FP itself responds to changes in ion concentration (lower). (b) Sensing units for ion biosensors are generally either bipartite designs (top panel) as used in GCaMP, or unimolecular sensors (bottom panel), such as the zinc fingers used in the ZifCY series of sensors. (c,d) An example of one strategy for measuring absolute ion concentrations using a single-FP sensor. (c) PEAQ biosensing leverages the photochromism of some cpEGFP-based biosensors. In the presence of Ca2+ (top panel), fluorescence is increased with violet light illumination, and decreased with cyan illumination. In the absence of Ca2+ (bottom panel) the inverse is true, with violet light turning the sensor “off” and cyan turning it “on”. (d) The workflow for PEAQ or iPEAQ biosensing. The sensor is measured under both violet and cyan illumination in vitro, in the presence of different concentrations of Ca2+, from 0 to a saturating amount. The fluorescence intensity at each wavelength is used to calculate (ΔF/F0)hv at each of the various Ca2+ concentrations. This calibration is then applied to data from Ca2+ imaging in live cells, enabling determination of absolute Ca2+ concentrations in biological contexts, e.g., after histamine stimulation.
5.1. Calcium Sensors
The calcium ion (Ca2+) is one of the longest-studied ions in all of cell signaling, owing to its role in neuronal communication, where Ca2+ spikes follow neuronal action potentials. The desire to monitor these Ca2+ dynamics, both as a proxy for voltage in systems where direct voltage measurements have been impractical and to understand the downstream signal cascades Ca2+ potentiates in neurons, yielded some of the earliest fluorescent sensors capable of reporting on changes in ion concentration.
The synthetic dye-based Ca2+ reporter, Fura2, which combines a fluorescent reporting unit with a BAPTA Ca2+-chelating moiety, was one of the earliest reporters that enabled widespread Ca2+ imaging in living systems.335 While the success of Fura2 has allowed great strides in the field of Ca2+ imaging, exogenous dyes and cofactors may be toxic to cells of interest, and dyes often have issues of tissue penetration, making in vivo imaging challenging. These concerns, along with a desire to image Ca2+ only in genetically defined cell types or within specific subcellular locations, have led to the development of genetically encoded calcium indicators (GECIs). Over time, the Ca2+ sensor field has grown to encompass several scaffolds and has resulted in the birth of several novel strategies for biosensor design. These innovations in biosensor design initially developed for use in Ca2+ sensors have also informed the strategies later used for other ion biosensors, especially other divalent metal cations. In this way, Ca2+ biosensors launched several fields of ion biosensor development and set the standards for many related biosensor classes.
5.1.1. FRET-Based Calcium Ion Sensors
The first entry in the field of GECIs was Cameleon-1, whose introduction in 1997 kicked off decades of Ca2+ biosensor development.336 Cameleon-1 utilizes calmodulin (CaM) and the CaM-binding M13 peptide from myosin light-chain kinase as the bipartite sensing unit. Miyawaki and co-workers leveraged the Ca2+-dependent conformational switch, from an extended form to a globular Ca2+-bound form, that occurs when these two proteins are fused, by inserting this molecular switch between two FPs (initially BFP and GFP, later CFP and YFP), to modulate FRET efficiency in a Ca2+-dependent manner.
This FRET-based scaffold has proven adaptable and useful in various contexts and applications over the last several decades. The basic scaffold introduced in the Cameleon series of sensors has been improved along numerous axes to produce more effective sensors for both intensity and lifetime-based FRET readouts for monitoring Ca2+ concentrations.337,338 A recent development along these lines saw the replacement of ECFP in the Cameleon scaffold with mCerulean3 to detect mitochondrial changes in Ca2+ in both brain slices and cardiomyocytes. mCerulean3 has improved quantum yield compared to ECFP, resulting in better performance in emission-ratiometric FRET imaging, as well as a single-exponential fluorescence decay, enabling improved readout using FLIM.339 This scaffold has also recently been applied to newly developed NIR proteins to create GECIs that emit in the NIR region for improved tissue penetration and in vivo Ca2+ sensing. Shemetov and co-workers recently developed a Cameleon-based GECI that uses two different NIR proteins (miRFP670 and miRFP720) for an entirely IR reporter.340 FRET-based Ca2+ sensors have also been developed outside of the original Cameleon scaffold, notably the Twitch series of sensors which utilizes the C-terminus of Troponin C as the Ca2+ binding domain.341 These troponin-based Ca2+ sensors contain fewer Ca2+ binding sites as compared to CaM/M13 (two as compared to four), which results in a Ca2+ sensor with a more linear response to Ca2+, and less buffering of Ca2+.342,343 These sensors offer an alternative scaffold to develop Ca2+ sensors and may prove a fruitful avenue for continued development of more linear Ca2+ sensors.
5.1.2. Single-FP Calcium Ion Sensors
While the FRET-based sensor Cameleon-1 and its successors enabled great strides in the field of GECI development, single-color biosensors require simpler imaging setups and permit improved multiplexing. These features have spurred the development of multiple series of single-FP-based Ca2+ biosensors. The first of these, Camgaroo, was reported by Baird and co-workers as part of their initial report on the circular permutation of GFP and its spectral variants. Through the development of the Camgaroo sensor, they demonstrated not only that cpFPs maintain fluorescence, despite the changes to their folding and pKa, but also that fluorescence could be modulated by insertion of a sensing unit.56 Camgaroo is somewhat unique among these sensors in that it uses only CaM as the sensing unit, and not a second Ca2+/CaM-binding domain. This changed with the next generation of single-color GECIs, dubbed Pericam. Nagai and co-workers utilized a cpYFP fused to the bipartite sensing unit of CaM and M13 (Figure 7b, top) to produce the three sensors in the Pericam series: flash-Pericam, which exhibits a positive intensiometric response, inverse-Pericam, with a negative response, and ratiometric-Pericam, which shows an excitation-ratiometric response to Ca2+.60
The early single-FP Ca2+ sensors Camgaroo and Pericam demonstrated the utility of cpFPs for Ca2+ sensor development, and the principles behind those designs were expanded and optimized to produce the two most commonly used families of GECIs today: GCaMP and GECO. GCaMP, developed by Nakai and co-workers, utilizes the CaM/M13 Ca2+ sensing domain flanking cpEGFP, which elicits large changes in fluorescence upon Ca2+ binding (150% ΔF/F upon purinergic receptor stimulation). The improved brightness and dynamic range of this sensor over previous cpFP-based scaffolds allowed for improved imaging of Ca2+ transients in HEK cells and mouse myotubes.210 The single-FP GCaMP scaffold has been improved upon and adapted over several generations, producing numerous improvements and variants. For instance, G-GECO1 was derived from the GCaMP3 sensor using directed evolution and random mutagenesis via error-prone PCR, alongside a colony-based screen for Ca2+-dependent fluorescence change. The resulting G-GECO construct contained four mutations relative to GCaMP3, with two mutations within the FP itself, and two within the CaM portion of the sensor. G-GECO1 was further engineered to produce G-GECO1.1 and 1.2, as well as color variants B-GECO and R-GECO, the first entries in the GECO series of Ca2+ sensors.198
Both the GCaMP and GECO series have been expanded to allow for greater spectral range. Alongside the previously mentioned cpmApple-based R-GECO, a red variant of GCaMP was developed using mRuby as the reporting unit, termed RCaMP.212 These expansions of the palette of Ca2+ sensors open up new opportunities for multiplexing signals and enable improved in vivo or tissue-based imaging, especially with multiple choices for red-shifted probes. R-GECO-series sensors tend to have superior brightness and kinetics, though being based on mApple, they exhibit notable photoactivation with blue light.344,345 Instead, the RCaMP series is generally more suited for multiplexing with blue-shifted probes, as demonstrated with the development and comparison of jRCaMP1a, jRCaMP1b, and jR-GECO1a.344 In addition to red-emitting GECIs, the discovery and engineering of FPs that emit in the NIR region has resulted in growing interest in developing IR biosensors. In 2019, Qian and co-workers reported NIR-GECO1, which inserts CaM and the CaM binding peptide into mIFP, generating a GECI that emits in the NIR region.205 While NIR-GECO1 demonstrated the power of an IR-emitting GECI, with improved tissue penetration and multiplexing capability, it has several limitations, namely a quenching or “turn off” response to Ca2+ stimulation and a relatively small response compared to other GECIs. The more recently reported NIR-GECO2 and NIR-GECO2G demonstrate improvements in the response amplitude, improving SNR in vivo.216 Further development, as well as the discovery of novel NIR FPs, is expected to facilitate future improvements to NIR imaging of Ca2+, especially for in vivo applications.
Alongside spectral improvements, the GECO and GCaMP series have also been optimized for improved kinetics and brightness to facilitate imaging in neurons, where Ca2+ responses quickly follow action potentials. To this end, brighter sensors with greater dynamic range, such as NCaMP7 and mNG-GECO1, both based on the brighter, Branchiostoma lanceolatum-derived fluorescent protein mNeonGreen, have been developed for in vivo imaging applications, including in zebrafish. Leveraging the brightness of mNeonGreen, mNG-GECO1 has greater molecular brightness than both GCaMP6 and GCaMP7.204,346,347 Although no direct comparison between NCaMP7 and mNG-GECO1 has been reported, mNG-GECO1 has superior molecular brightness while NCaMP7 shows slightly better reported dynamic range.204 The dynamic range of mNeonGreen-based sensors was further improved with the development of NEMO sensors, which exhibited a dynamic range of over 400-fold as compared to 15.8-fold for NCaMP7.348 While these sensors have demonstrated the great improvements in brightness and dynamic range that can be achieved with this novel FP, the latest generation of GCaMP sensors, jGCaMP8s, GCaMP8f, and GCaMP8m, still show great improvements in sensitivity and kinetics over their cpGFP-based predecessors. These new GCAMP sensors exhibit comparable brightness to GCaMP7 and retain superior off-kinetics versus mNG-GECO1, while the latter still has greater molecular brightness.196 Both of these recently developed sensors highlight continued routes for evolution of single-FP Ca2+ sensors: to continue directed evolution for improved sensitivity and kinetics, primarily modifying the sensing and linker regions of the probe, and to seek novel FPs that may provide improved starting points for sensor development.
5.1.3. Applications in Absolute Calcium Ion Measurement
The growth of Ca2+ sensors in the last couple of decades has led to numerous improvements in the kinetics, sensitivity, and response amplitude of GECIs. Alongside advances in these areas, however, a new goal has been set: achieving improved absolute quantification of Ca2+ concentrations in living systems. Absolute quantification can already be accomplished using FRET-based sensors but requires careful calibration and avoidance of photobleaching, as the two FPs in a FRET sensor may bleach at different rates. On the other hand, single-color intensiometric sensors are difficult to utilize for absolute measurements, as intensity can vary with local sensor concentration and illumination intensity. To remedy this, novel techniques that leverage FP photophysics have been developed for absolute quantification of analyte concentrations using single-color Ca2+ sensors.
In contrast to the apparent intensity of a fluorophore, which can be strongly influenced by experimental factors such as probe expression and excitation power, excited-state lifetime is an intrinsic property that allows for absolute determination of fluorophore state. With this in mind, Linden and colleagues recently developed Tq-Ca-FLITS, an mTurquoise2-based single-FP Ca2+ sensor optimized specifically for lifetime-based Ca2+ sensing. Tq-Ca-FLITS shows a 1.3 ns change in fluorescence lifetime in response to intracellular Ca2+ elevation using the Ca2+ ionophore ionomycin.201 The Ca2+-lifetime relationship was determined in vitro and then applied to Ca2+ imaging in subcellular compartments and organoids, using frequency-domain FLIM. The relatively fast acquisition speeds of frequency-domain FLIM enabled Ca2+ monitoring with quantification during trans-endothelial migration of leukocytes, with a time-resolution of around 13 s.
PEAQ (photochromism-enabled absolute quantification) biosensing is a technique that leverages the photochromic behavior of a single-FP based Ca2+ sensor (GCaMP6s-Q) to determine absolute Ca2+ concentrations in parallel with imaging Ca2+ dynamics. Collection of a PEAQ cycle for quantitative imaging involves image acquisition at multiple wavelengths, turning fluorescence “on” and “off” in a manner dependent on Ca2+ concentration. While the method requires multiple acquisitions for each PEAQ cycle, limiting temporal resolution, alongside careful in vitro calibration (Figure 7c), it represents a unique alternative method for performing absolute quantification using single-color biosensors while preserving an intensiometric readout, rather than having to directly optimize or engineer probes for lifetime imaging349 That said, the single-FP biosensor must still be carefully selected for PEAQ, as this technique relies on the intrinsic photophysics of traditionally intensiometric probes, specifically those that exhibit photoswitching between a bright “on” state and a dim “off” state when exposed to different illumination wavelengths (Figure 7d). With careful FP selection or probe design, however, this method can prove a powerful way to measure absolute Ca2+ concentrations with an intensiometric sensor, as demonstrated with the recently described NEMO sensor, based on mNeonGreen.348
Balancing temporal resolution and absolute quantification is a longstanding tension in the field of optical biosensors, and future developments of probes and methods to bring these closer together will greatly improve our understanding of both analyte dynamics and concentrations.
5.1.4. Calcium Integrators
Sometimes it is of interest not just to know the changes in an ion concentration in the moment the dynamic signals are occurring but also to understand where signals have been sent in the past. For instance, it is useful in understanding neuronal activity to know not just which cells are exhibiting Ca2+ transients in real time, but to know which cells or cell types have shown Ca2+ activity previously, or which cells have shown more Ca2+ activity during a given time period. A notable example is determining which neurons within a particular brain circuit fire during a given behavior, which is challenging to monitor in real time. In this case, a reporter of Ca2+ dynamics is not sufficient, but rather, a Ca2+integrator is desired, which records a history of Ca2+ responses.
This brings about a unique class of Ca2+ reporter, CaMPARI, in which the photoconvertible FP mEos2 is circularly permuted and coupled to a CaM/M13 Ca2+-binding switch.350 Like traditional cpFP-based GECIs, CaMPARI exhibits Ca2+-dependent changes in fluorescence intensity, although it shows an inverse response, resulting in a decrease in green fluorescence in the presence of Ca2+, unlike most green GECIs. However, CaMPARI also displays the green-to-red photoconversion behavior of mEos2 when exposed to violet light, but only in the presence of Ca2+. Thus, a readout of red fluorescence can be used to provide an integrated record of Ca2+ signaling events that occurred over the course of the experiment time, defined by violet illumination. This integrator has since been modified to create CaMPARI2 in 2018, with the goal of reducing Ca2+-independent photoconversion to improve contrast in vivo. The new CaMPARI2 was demonstrated in mice and larval zebrafish. Additionally, antibodies specific to the red form of CaMPARI2 were developed and validated in immunohistochemical assays for Ca2+ integration.351 However, recent work by Das et al. has suggested that the modifications made in generating CaMPARI2 resulted in not only in lower basal photoactivation rates but also lower Ca2+-induced photoactivation in vivo as compared to CaMPARI.352 This work suggests that CaMPARI2 is thus actually less effective as a Ca2+ integrator than the original construct and stresses the importance of including in vivo validation earlier in the sensor development pipeline for tools intended for use in animals. Along with CaMPARI, a few classes of transcription-based Ca2+ integrators have also been developed. These sensors feature a more intricate, multicomponent design and are discussed in more detail later on in the text (see section 13, “Multistep Reporting Systems”).
5.2. Zinc Sensors
The zinc ion (Zn2+), like Ca2+, is a crucial ion for cellular function. Most intracellular Zn2+ is tightly bound in enzymes or other proteins as a cofactor or structural ion, with labile Zn2+ populations carefully controlled in the cell and across subcellular compartments. “Free” Zn2+ concentrations are thus in the picomolar range, from low picomolar in the ER to hundreds of picomolar in the nucleus. Changes in this “free” Zn2+ pool can occur in response to stimuli such as synaptic vesicle release or insulin secretion from pancreatic beta cells. Numerous tools to both manipulate and monitor intracellular Zn2+ have been developed, including small-molecule sensors, genetically encoded sensors, DNA-based sensors, and proteomic tools and methods. These tools have been recently and capably reviewed elsewhere.353,354 Here, we will focus on a subset of the most influential genetically encoded Zn2+ sensors, as well as some recently developed sensors that show promise for the future of the field.
5.2.1. FRET-based Zinc Ion Sensors
The first genetically encoded Zn2+ sensors adopted FRET-based designs, following the successful demonstration of these kinds of scaffolds for Ca2+ sensing. Three early scaffolds utilized different sensing units, producing three “families” of FRET-based Zn2+ sensors: the ZinCh, CALWY, and ZapCY (also including the ZifCY sensors) families.
In 2001, Jensen and co-workers observed that FP dimerization increases in the presence of Zn2+, leading them to design improved CFP-YFP FRET pairs by engineering a higher-affinity Zn2+-binding site on each FP. This effort resulted in tighter binding of the two FPs and improved FRET efficiency in the presence of Zn2+.355 While not directly yielding a Zn2+ sensor, this study laid the groundwork for what would become an early genetically encoded zinc indicator (GEZI), ZinCh. The ZinCh sensor was developed based on this strategy of building the Zn2+-binding domain directly into both FPs, along with introducing a long flexible linker between the FRET pair. This design would ensure the FPs started far away, resulting in a low-FRET basal state, and producing a large FRET change upon association, directly linked by Zn2+.356 This scaffold has since been adapted and improved for greater Zn2+ affinity and emission ratio change in the eZinCh series, with eZinCh-2 exhibiting a ΔR/R0 of 4 and a Kd of ∼1 nM.357 However, the eZinCh sensors are prone to aggregation, demonstrated especially in the case of ER-targeted sensors, so other sensor designs may be more amenable to measuring organellar Zn2+.358
The CALWY class of Zn2+ sensors leverages two metal-binding domains (Atox1 and WD4) tethered to a FRET pair by a long, flexible linker. The sensor initially exists in a high-FRET state, unbound to Zn2+, and then undergoes a conformational change upon Zn2+ binding that results in decreased FRET efficiency. The scaffold was initially intended as a copper sensor but had significant affinity for Zn2+. Upon engineering to improve this quality, a FRET-based sensor with subnanomolar affinity for Zn2+ was developed.359 An enhanced version, eCALWY, was subsequently produced that improved the FRET response by using weakly associating, nonmonomeric FPs to stabilize the Zn2+-free high-FRET state. This modification resulted in a sensor with slightly lower Zn2+ affinity but a 2.4-fold emission ratio change upon Zn2+ binding.360
The Palmer lab subsequently developed two closely related families of Zn2+ biosensors, the ZifCY and ZapCY series of probes, using FRET between cyan- and yellow-emitting FPs for reporting and zinc-finger domains as the unimolecular sensing unit (Figure 7b, bottom). ZifCY utilizes the Cys2His2 zinc-finger domain from the mammalian Zif268 transcription factor, or a His4 variant. These two variants of the ZifCY sensor exhibited different dynamic ranges and Zn2+ affinities. The Cys2His2 version demonstrated a 2.2-fold change in emission ratio with an apparent affinity of 1.7 μM, while the His4 version showed a 4-fold ratio change and had a 160 μM Kd.361 These sensors were used to investigate the connection between glutamate uptake and mitochondrial Zn2+ sequestration.
Another zinc-finger-based strategy uses the Zap1 transcription factor from Saccharomyces cerevisiae. Qiao and co-workers initially used zinc fingers 1 and 2 from Zap1 to create a FRET sensor using CFP and YFP362 Qin and co-workers subsequently optimized this sensing scaffold by changing the linkers to be more like those from Ca2+ sensors, in addition to swapping YFP for Citrine to make the sensor more robust to pH changes, generating the ZapCY1 and ZapCY2 sensors.207 This more sensitive sensor has been used for determining ER Zn2+ levels. While ZifCY was unable to detect changes in Zn2+ in the ER, the more sensitive ZapCY could do so, although it was basally saturated when expressed in the cytosol. This contrast illustrates the need to carefully tune biosensor affinity toward the analyte of interest as well as the application of interest.
More recent work on FRET-based Zn2+ biosensors has focused on tuning the existing widely used eCALWY, ZapCY, and ZifCY scaffolds either to improve the photophysics and achieve greater dynamic range or to modify them specifically for subcellular Zn2+ sensing. The Palmer lab has improved the ZapCY series of sensors by replacing the YFP acceptor with cpVenus, generating ZapCV. ZapCV2 additionally exhibits a Zn2+ affinity that allows it to be partially saturated at rest in the cytosol of most mammalian cells, enabling this sensor to detect both increases and decreases in Zn2+.363 ZapCV2 has subsequently been used to correlate Zn2+ dynamics with ERK and Akt signaling.364 Slocum and co-workers used an anisotropy and dynamic light-scattering-based assay to determine that the eCFP and Venus FRET partners in ZifCV1.173 dimerized in the absence of Zn2+, prompting efforts to rationally design variants that increase or decrease dimerization affinity and improve dynamic range.365
Another axis of recent improvements lies in organellar targeting and quantitative measurement. Robust Zn2+ measurements in organelles and vesicles remain difficult, in part because in situ calibration is nontrivial given that pH, which can vary across cellular compartments, can also affect FP fluorescence. Recent work by Pratt and co-workers addresses this problem in part by using the acceptor FP in the FRET-based ZapCY1 and eCALWY-4 sensors as a pH sensor, enabling pH corrections to Zn2+ measurements in populations of vesicles.366
5.2.2. Single-FP Zinc Ion Sensors
While the majority of Zn2+ biosensors use a FRET-based reporting unit design, a number of novel single-color probes have been developed based on cpFPs in recent years, improving the multiplexing capability and dynamic range of Zn2+ sensors. Sensors using Rad50-derived zinc hook peptides as the sensing unit, including ZnGreen2 and ZIBG2, have been engineered to enable extracellular targeting of sensors to detect Zn2+ secretion, as this has previously been difficult with Zap1-based probes.367,368 However, a recent expansion on the Zap1-based GZnP series from the Qin lab, termed GZnP3, uses the Zap1 zinc finger domains around a cpGFP reporting unit and expresses well on the extracellular face of the plasma membrane. GZnP3 has been used to report on Zn2+ signaling in neurons in relation to TRPML1 channel activation.369
The development of these single-color Zn2+ sensors has continued to expand, especially as more far-red FP-based biosensors come onto the scene. The FRISZ biosensor, developed by the Ai lab, follows on the advancements of ZnGreen2 and ZIBG2 but seeks to improve the dynamic range of ZIBG2 and avoid the photoswitching behavior of ZnGreen2, while moving into more far-red emission for in vivo imaging. FRISZ is based on cpmMaroon185–186, with two zinc hooks appended to each of the new termini. This sensor has been utilized to detect synaptic Zn2+ release in both brain slices and awake behaving mice.370 Other red-shifted Zn2+ sensors are also actively being developed, including one based on cpmApple, which was demonstrated for the sensing of Zn2+ alongside Ca2+ dynamics in the cytosol of rat hippocampal neurons.371 Issues of pH sensitivity remain and are of particular concern for single-FP sensors, as they cannot use a second FP for pH correction. Further advancements and usage of less pH-sensitive FPs will undoubtedly expand Zn2+ sensing capabilities.
5.3. Potassium Biosensors
Despite the ubiquity of the potassium ion, K+, in the cell, with its known role in maintaining cellular electrochemical gradients, along with putative roles in many other processes, no genetically encoded sensors of K+ had been developed until relatively recently. The first entry in this new class of biosensor was developed by Bischof and co-workers. They based their sensor on a bacterial K+ binding protein, Kbp, which contains a K+-binding BON domain and a LysM domain that binds to the BON domain in the presence of K+. The sensor, named GEPII 1.0 (genetically encoded potassium ion indicator), is a FRET-based sensor, with the Kpb domains sandwiched between the FRET pair mseCFP and cpVenus.372 GEPII 1.0 was able to detect endogenous K+, with selectivity for K+ over other monovalent cations like the sodium ion, Na+. Ammonium, however, interfered with the signal at high concentrations. Shortly thereafter, the pool of K+ sensors available to biologists was expanded with the development of the KIRIN1 and KIRIN1-GR sensors. However, while these sensors increase the spectral palette of K+ sensors, they have lower dynamic ranges and similar selectivity compared with GEPII 1.0.373
Concurrent with the development of the FRET-based KIRIN1, the Kbp scaffold was inserted into eGFP for the first single-FP K+ biosensor. This sensor, termed GINKO1, can be used as either an intensiometric or excitation-ratiometric probe, with greater dynamic range and affinity for K+ than either FRET-based sensor. However, it suffers from additional sensitivity to Na+ as compared to the KIRIN and GEPII scaffolds.373 The GINKO scaffold was rapidly improved upon using structure-guided optimization and directed evolution, yielding GINKO2, which exhibits 20-fold ΔR/R0 and improved selectivity for K+ over Na+ (at the cost of K+ affinity).203 GINKO2 has been applied in numerous biological systems, including bacteria, Arabidopsis, mice, and Drosophila.
Another single-color K+ sensor, KRaION1, has recently been developed by the Piatkevich and Boyden laboratories, this time inserting Kbp into mNeonGreen. A combination of NMR and genome mining was used to refine and produce multiple KRaION sensors in a series with varied affinities and excitation-ratiometric responses to K+.374 Crucially, for the future of the field, these authors used their KRaION sensors as scaffolds to identify the ion-binding site of E. coli Kbp. They also presented several homologues of Kbp from other organisms, some of which they exchanged into the KRaION1 scaffold. Some of these displayed similar behavior and K+ sensitivity, suggesting that with further investigation and optimization, these homologues could provide future avenues for K+ sensor development. As more of these sensors are developed, we are likely to uncover new roles for its in various organisms and gain greater understanding of K+’s role in signaling and homeostasis.
5.4. Other Metal Ions
While Ca2+ and Zn2+ are two of the more highly studied biological cations and the field of K+ sensors is rapidly growing, other metal ions also play their parts in cellular signaling and homeostasis, from the relatively ubiquitous magnesium ion, Mg2+, to some rarer albeit still critical metals. Some of these sensors, focusing on those that detect magnesium, copper, and select lanthanides, have been reviewed in detail by Baek and colleagues.375 A few of these other, less-studied metals have notable FP-based biosensors or present promising new avenues for biosensor development and will be discussed here as well.
Like K+, Mg2+ is a relatively abundant intracellular cation that is, paradoxically, understudied at least in part due to a lack of tools. The first genetically encoded Mg2+ indicator was reported by Lindenburg and co-workers in 2013. Dubbed MagFRET, this sensor is based on a truncated form of the human centrin 3 protein (HsCen3), containing EF-hand metal binding sites, and one of very few of these motif types with similar preference for Mg2+ to Ca2+. This Mg2+-binding domain was fused to Cerulean and Citrine to form the FRET pair.376 Although this sensor remains more sensitive to Ca2+ than to Mg2+, its Mg2+ sensitivity falls within a physiologically relevant concentration range, whereas its Ca2+ sensitivity does not. Koldenkova et al. developed a non-FRET ratiometric probe, composed of a fusion between a reference mCherry and a Mg2+-sensitive variant of cpVenus, termed MagIC.377 Unlike MagFRET, this construct could enter the nucleus and was more amenable to subcellular targeting.377 Most recently, in 2018, the Nagai lab developed a new Mg2+ sensor based on the Cameleon scaffold, returning to a FRET-based design. Instead of CaM/M13, the Mg2+-binding domain from the CorA E. coli Mg2+ transporter was incorporated between ECFP and Venus.378 As more Mg2+-binding domains are identified and characterized, more options for sensor development may open up, leading to new sensors for this biologically important ion.
The copper ion, in both its monovalent and divalent forms, is critical as a cofactor in enzymes, but is also toxic in excess and can produce reactive oxygen species (ROS). Thus, copper ion levels are tightly controlled in the cell. However, this same tight control can also make the study of its function and influence difficult. Indeed, methods to visualize copper ions using genetically encoded tools remain limited, albeit growing. As noted above, the earliest attempt at developing a FRET-based divalent copper, Cu(II), biosensor was made by van Dongen and co-workers based on Atox1. However, this sensor showed significantly more sensitivity to Zn2+ than to Cu(II) and was further refined and optimized into the CALWY series of Zn2+ sensors.359 A later-generation sensor of monovalent copper, Cu(I), Amt1-FRET, is based on a Cu(I)-binding transcriptional regulator protein derived from Candida yeast.379 This scaffold was subsequently expanded to use homologous copper binding domains from S. cerevisae and has been applied to investigate the regulation of free copper in yeast.380 More recently, Zou and co-workers have turned to using flavin mononucleotide (FMN)-based FPs as the reporting unit with bacterial-derived light-oxygen-voltage (LOV) domains as the Cu(II)-binding domain in the sensor. This CreiLOV based sensor has been demonstrated as a Cu(II) reporter in E. coli cultures. However, this scaffold has not yet been validated in mammalian cells and may be limited to bacterial investigations of Cu(II) activity.381,382 While single-FP copper ion sensors are currently limited in scope, miRFPs have recently been demonstrated to exhibit a change in fluorescence intensity upon binding with many types of divalent metal cations. The most pronounced change in intensity so far has been demonstrated with Cu(II) binding. While not currently adapted into a sensor, these miRFPs may provide a promising scaffold for future FP-based metal biosensors, especially for Cu(II).383
A few metals far less common in biology have also recently been investigated for the first time using FRET-based sensors, including the toxic metal arsenic, as well as manganese, which is critical in much of plant biology as a component of photosynthesis. The novel arsenic sensor SenALiB uses an arsenic binding protein, ArsR, as the sensing unit and has been demonstrated initially in sensing toxic levels of arsenic in HEK293T cells.384 Two manganese sensors, MnLaMP1 and MnLaMP2, combine an eCFP-Citrine FRET pair with lanmodulin (LanM) as the manganese ion binding domain. These sensors have been developed and demonstrated in E. coli, but future optimization could lead to applications enabling the study of manganese dynamics in plant biology.385 These novel sensors can enable better understanding of the roles these rare metal ions play in biology, and further expansion of fluorescent biosensors to new ionic analytes is an area ripe for growth.
5.5. Halide Biosensors
Chloride, Cl–, is critical in several subcellular functions, including regulation of pH and stabilization of membrane potential, as well as playing a role in synaptic inhibition. For this reason, sensors to enable visualization of Cl– balance and changes in cells, especially neuronal cell populations, can help unravel the role this ion plays in signaling. Unlike many other ion biosensors, halide sensors do not use separate sensing and binding domains but rather use an inherent halide-binding site in the FP itself, which has been engineered over time to produce sensors for halide ions, especially chloride, the most biologically relevant and abundant monovalent anion.
The phenomenon of FP sensitivity to halides, in particular Cl–, was first reported in 1999, with the observation that the pKa of the YFP variant of GFP (T203Y/S65G/V68L/S72A) was dependent on the concentration of Cl– and nitrate anions, with YFP fluorescence quenched in the presence of Cl– (Figure 7a, bottom).386 Based on these findings, the first YFP-based Cl– sensor, YFP-H148Q, was engineered in 2000 and used to monitor Cl– changes in a cystic fibrosis phenotype model.387 This early sensor was also used to examine the mechanism of halide sensitivity, which was hypothesized to be due to the ion binding near the chromophore and affecting protonation, resulting in fluorescence quenching. These observations have since been used to guide the development of further halide sensors, including the FRET-based Clomeleon (and subsequent SuperClomeleon), and the dual Cl–-pH sensor ClopHensor.388−390
Recent developments in genetically encoded halide sensors have focused largely on improvements along two avenues: red-shifted sensors and single-color probes with “turn-on” responses, rather than the quenching-based responses of the original YFP sensors. Two unique scaffolds for red-shifted Cl– sensor have been recently reported. The first is mBeRFP, which exhibits a moderate sensitivity to Cl– on its own. Salto and co-workers performed site-directed mutagenesis to produce mBeRFP-S94V/R205Y, which exhibits improved Cl– affinity and a “turn-off” fluorescence response. There is also the potential for a ratiometric readout with this sensor.391 The second scaffold, developed by Tutol and co-workers, is based on a fluorescent proton-pumping rhodopsin from Gloeobacter violaceus, created by mutating a crucial Asp to Val. This substitution introduces a Cl–-binding pocket while also ablating proton-pumping activity. The resulting red-shifted, turn-on Cl– sensor, named GR1, provides a promising scaffold for future Cl– biosensors derived from rhodopsin.392
As turn-on sensors often exhibit better SNR, the desire to engineer sensors that become brighter in the presence of the analyte of interest, rather than dimmer, has driven much research into Cl– sensors in recent years. Two 2019 reports from the Dodani lab have both resulted in additions to the roster of turn-on Cl– sensors available to researchers, in addition to the red-shifted GR1. Examination of the crystal structure of mNeonGreen revealed a Cl–-binding pocket, unique compared to many other YFP scaffolds. Further examination via spectroscopic characterization demonstrated that mNeonGreen can function as a turn-on sensor of Cl– in a pH-dependent fashion. These discoveries set the stage for future engineering of mNeonGreen as a Cl– sensor.393 In the same year, Tutol, Peng, and Dodani reported a novel, naturally occurring Cl–-sensitive YFP, derived from jellyfish. This YFP, termed phiYFP, appears to undergo pH-dependent excited-state proton transfer, resulting in turn-on fluorescence in response to Cl–.394 These two novel scaffolds have expanded the options for turn-on halide sensors and will serve as starting points for further Cl– sensor development. However, the primary limitation of many Cl– sensors, which is an innate pH-sensitivity, still plagues these scaffolds as well, making absolute calibrated measurements in cellulo and in vivo difficult, along with the nonphysiological Cl– affinities of many sensors.375,395 Efforts to engineer sensors with improved affinities compatible with in vivo imaging and address the challenge of pH sensitivity will be necessary in the coming years to move the field forward.
5.6. Phosphate Biosensors
Inorganic phosphate is an important nutrient for many branches of life; however, very few methods to monitor or measure phosphate in living cells have been developed. The sole entry in the field of FP-based phosphate biosensors remains the FLIPPi class of sensors, developed by Gu et al. in 2006.396 The original FLIPPi sandwiches a phosphate-binding protein (PiBP) from Synechoccus between eCFP and Venus to produce a FRET-based sensor for inorganic phosphate. While this sensor was initially demonstrated in CHO cells and used to examine the relationship between phosphate starvation and cell migration, further use and development of FLIPPi-based sensors in mammalian cells has stagnated.
The FLIPPi sensor has found new life recently, however, in investigating phosphate in plants. The sensor was improved and optimized for plant model systems by Mukherjee and co-workers in 2015, replacing the acceptor with cpVenus.397 This improved FLIPPi has recently been applied to monitor phosphate usage in wild-type Arabidopsis, as a proof of concept for monitoring phosphate usage in plants to aid in the engineering of more efficient plants and fertilizer.398 Its utility in this matter has been further demonstrated in a model of cereal grains and biofuel switchgrass to monitor phosphate sourced from mycorrhizal symbiosis.399 As this older sensor is optimized and developed more specifically for its new application in plants, we hope to see the development of new phosphate sensors as this area of research continues to blossom.
6. Cell Analytes
As life evolved, cells learned to utilize molecules more complex than ions to build cellular structures to support life and sense the state of their rapidly changing environment. These molecules range from simple compounds such as hydrogen peroxide, to more complex molecules such as nucleotides and sugars, that carry out multifaceted functions including acting as second messengers in signal transduction and energy storage in metabolism. The concentrations of these molecules, broadly referred to here as cellular analytes, are an indicator of organism health, and dysregulation of their dynamics often leads to severe diseases including cancer and diabetes. Owing to their critical roles in various biological functions, these cellular analytes have been a focus in biosensor development for several decades. Genetically encoded fluorescent biosensors have unique advantages in monitoring cellular analyte dynamics in real-time within their original biological context, compared with other biochemical methods which often isolate cellular analytes from their native environment. Across all cellular analytes, a critical consideration for biosensor design is to identify unique binding domains that can distinguish analytes of interest from background molecules, including structurally related compounds, enabling the resulting biosensor to faithfully report accurate changes and reveal the true biological processes of interest. Because of the universality of cellular analytes across different domains of life, the search for an ideal binding domain has expanded to include both prokaryotes and eukaryotes. Aside from binding domains, new FPs are also being explored to obtain better sensors with improved dynamic range, sensitivity, and spectral compatibility. Recent developments are discussed in more detail in the following sections, for a variety of cellular targets.
6.1. Cyclic Nucleotides
Cyclic nucleotides, or cyclic nucleotide monophosphates (cNMPs), are a group of single-phosphate nucleotides in which the phosphate is covalently attached at both the 3′ and 5′ hydroxyl positions of the sugar moiety, resulting in a “cyclic” bond arrangement. An important biological function of cyclic nucleotides is their ability to relay biological cues in signal transduction as second messengers in both hormone- and ion-channel-induced signaling. Cyclic adenosine monophosphate (cAMP) and cyclic guanosine monophosphate (cGMP) are the most documented cyclic nucleotides and are also the focus of cyclic nucleotide sensor development. Cyclic nucleotide levels have been found to vary dynamically at different cellular compartments, and this compartmentalization plays a critical role in regulating downstream signaling activities. Genetically encoded fluorescent biosensors serve as ideal tools to dissect the underlying molecular mechanisms in subcellular compartments and significantly contribute to resolving long-lasting controversies surrounding the role of these molecules in living systems.
6.1.1. Cyclic AMP (cAMP) Indicators
cAMP is a derivative of ATP. In early studies, measurements of cellular cAMP concentrations required cell disruption, such as lysing cells for radioactive detection of cAMP.400 Although such approaches provide valuable information about total intracellular cAMP levels, they obscure the native and dynamic behavior of free intracellular cAMP, which plays a critical role in cAMP-dependent cell signaling. Genetically encoded cAMP indicators were thus developed to probe the dynamics of cAMP in live cells.
Typically, a cAMP indicator is constructed based on the interaction between cAMP and a cAMP-binding effector protein/domain, which acts as the sensing unit. The two types of effectors most commonly used in designing cAMP indicators are exchange proteins directly activated by cAMP (EPACs) and cAMP-dependent protein kinase (PKA). EPACs are a family of cAMP-regulated proteins that act as guanine exchange factors (GEFs) for monomeric GTPases such as Rap1 and Rap2. PKA is another cAMP-regulated effector protein, which comprises a tetrameric holoenzyme containing a regulatory subunit dimer bound to a pair of catalytic subunits. cAMP binding to the PKA regulatory (PKA R) subunits promote activation and release of the PKA catalytic (PKA C) subunit. Utilizing the cAMP-binding-induced conformational changes in these proteins as the sensing unit, both FRET-based and single-FP-based cAMP indicators have been constructed, improved, and applied in various biological investigations (Figure 8a).
Figure 8.

Genetically encoded fluorescent indicators for detecting various cellular analytes. (a) Most FRET- and single-FP-based cAMP indicators have been developed using cAMP-binding domains derived from either EPAC or PKA. A cAMP-binding domain from the bacterium Mesorhizobium loti (mlCNBD) was recently used to generate a highly responsive single-FP cAMP indicator, G-Flamp1. cGMP indicators are constructed similarly to cAMP indicators, using a cGMP-specific binding domain derived from PKG. (b) Translocation-based phosphoinositide (PtdIns) indicators (upper) are constructed by directly fusing an FP to a PtdIns-binding domain, such as a pleckstrin homology (PH) domain. When expressed in cells, PtdIns indicators will translocate to (or from) the endogenous location where the target PtdIns is produced (or degraded). The FRET-based FLLIP PtdIns indicator (middle) uses a hinge-like linker and a specific PtdIns-binding domain (e.g., PH domain from GRP1) inserted between a FRET pair and can report changes in plasma membrane PtdIns levels through changes in FRET. InPAkt (lower) utilizes the PH domain from Akt and a negatively charged pseudoligand as a molecular switch to drive PtdIns-dependent FRET changes and can be targeted to different subcellular compartments to examine local PtdIns dynamics. (c) OxyFRET (upper) and PerFRET (middle) use different sensing units for H2O2 and show opposite FRET changes upon H2O2 increases. The Hyper series of single-FP-based H2O2 indicators use E. coli transcription factor OxyR, which can be specifically oxidized by H2O2, resulting in dramatic conformational changes that shift the cpYFP excitation peak from 420 nm to 500 nm (lower).
To find the most efficient FRET pair, various donor and acceptor FPs fused to PKA regulatory and catalytic subunits were tested. Among these tested pairs, a variant with type II PKA R subunit fused to a blue-emitting GFP mutant (R2-EBFP) and PKA C subunit fused to an improved GFP mutant. This was later updated and optimized using the newly available cyan-and yellow-emitting FPs.401,402 However, the responses from a bimolecular FRET reporter system can be difficult to reliably quantify due to uneven expression of the donor and acceptor components, restricting their broader application. This problem was resolved by the concurrent introduction of several unimolecular FRET-based cAMP indicators that use EPAC as the sensing domain scaffold, which is sandwiched between a FRET pair. These sensors contain either full-length EPAC403,404 or a truncated cyclic nucleotide-binding domain (CNBD)405 as the sensing unit, which switches from a closed to a more open conformation upon cAMP binding. This conformational change alters the distance and orientation between the FRET pair, allowing changes in FRET to reflect cAMP dynamics. Over the past 20 years, EPAC-based designs have largely come to dominate the field of FRET-based cAMP indicators.406 One exception comes from the work of Surdo et al., who generated the unimolecular FRET-based cAMP indicator cAMP universal tag for imaging experiments (CUTie)407 to address a common problem where subcellular targeting can negatively impact biosensor sensitivity, making it difficult to directly compare responses at different intracellular sites. To overcome this problem, CUTie adopts an unconventional sensor configuration in which YFP is inserted into the middle of a CNBD from type IIβ PKA regulatory subunit and CFP is fused to the C-terminus. CUTie showed almost identical response performance regardless of its localization to different subcellular compartments, and was thus used as a “universal tag” for imaging of various cAMP microdomains in cardiomyocytes.407
The success and popularity of the Epac-based cAMP indicators is underscored by the continuous efforts that have been invested in making these sensors better. For example, both EPAC1 and EPAC2 have been used in cAMP indicator backbones, but sensors containing EPAC1 were found to display significantly larger dynamic ranges and faster activation kinetics in a side-by-side comparison.405 Different variants of the Epac-based sensors have also been developed to improve their performance. For example, while full-length EPAC was successfully used as the sensing unit in early generation sensors,403,404 later variants adopted sensing units in which EPAC1 was truncated to remove a portion of the N-terminus that encodes a DEP domain and is also responsible for Epac membrane and mitochondrial localization,408 which improved the sensor’s sensitivity and general targetability.409−412 More recently, cAMP sensor performance has been improved by tuning the cAMP binding affinity of the sensing unit. Specifically, EPAC1 mutants harboring a Q270E mutation show an approximately 2.4-fold increase in their cAMP binding affinity in vitro,413,414 leading to improved cAMP sensor performance in live cells.409,415
In addition to the sensing unit, several advances in cAMP sensor performance have been achieved by optimizing FP choice. For example, early FRET-based cAMP indicators often used ECFP and EYFP as donor and acceptor, respectively. However, both ECFP and EYFP are sensitive to environmental factors such as pH or ions. When introduced into excitable cells such as neurons or pancreatic β-cells, FP behavior, especially EYFP brightness, was found to be affected by subtle changes in pH and ion concentrations, generating biosensor artifacts.416,417 To solve this problem, some groups opted to construct modified sensors using Cerulean and Citrine, newer FPs that are less sensitive to environmental changes, enabling more consistent measurement of cAMP concentrations under various physiological conditions,417 including better visualization of depolarization-induced cAMP elevations in MIN6 cells.416 cAMP sensor performance has frequently been improved by incorporating newer FPs with superior properties. The third-generation Indicator of cAMP using EPAC (ICUE3) replaced Citrine with cpVenus as the FRET acceptor, which not only increased brightness but also reoriented the acceptor chromophore to increase FRET efficiency and dynamic range.411 mTurquoise2, one of the brightest and most photostable cyan-emitting FPs available, has also been incorporated into new generations of the Epac-S family of FRET-based cAMP indicators, along with another innovation of using tandem copies of cpVenus as the FRET acceptor,409,418 a strategy that yielded some of the best-performing FRET-based cAMP indicators available. The cleaner fluorescence lifetime decay of mTurquoise2 compared with other CFPs is also suitable for FLIM applications. This has helped in the development of FLIM-FRET cAMP sensors, where dark FRET acceptors are preferred to minimize spectral contamination of the donor signal and allow more robust multiplexing, yielding sensors with tandem dark cpVenus acceptors and large cAMP-induced lifetime changes.409
6.1.1.2. Single-FP-Based cAMP Indicators
The last 10 years have also seen rapid development of multiple single-FP cAMP indicators. Many of these sensors exhibit greater responses than FRET-based cAMP indicators and more readily allow for simultaneously monitoring the dynamics of cAMP and other related signaling molecules, such as PKA. The first single-FP cAMP indicator, Flamindo, was constructed by inserting the CNBD of murine EPAC1 into the yellow-emitting FP Citrine.1000 cAMP binding to Flamindo induces conformational changes near the FP chromophore that decrease fluorescence intensity, which serves as a readout of cAMP dynamics. To increase the brightness and dynamic range of this first-generation sensor, Odaka et al. optimized the amino acid composition of the linkers joining the EPAC CNBD to the Citrine β-barrel,419 specifically adding four amino acids (ALKK) to the N-terminal linker. Compared to its parent, Flamindo2 showed 8-fold higher basal brightness, along with a 2-fold dynamic range improvement. In contrast to Flamindo, where the EPAC CNBD is inserted into Citrine, Tewson and colleagues developed cAMP Difference Detector in situ (cADDis) following a GCaMP-like design by inserting cpmNeonGreen between the signaling and catalytic domains of EPAC2. As with Flamindo, binding of cAMP to cADDis induces a conformational change that decreases mNeonGreen fluorescence intensity.2000 However, cADDis is only available commercially and exhibits a relatively low affinity for cAMP that may only be suitable for application under high-cAMP conditions, both of which limit the wider use of this sensor. Single-FP cAMP sensor-designs have also proven to be less reliant on EPAC than FRET-based cAMP sensors. For example, in a design reminiscent of the earliest cAMP sensors, Hackley et al. developed a PKA-based single-FP cAMP indicator, cAMPr, by sandwiching cpGFP between the PKA C subunit and a truncated fragment of PKA RIα (91–244) containing only one CNBD.420 cAMPr shows a greatly increased in vitroKd for cAMP of 10 nM, compared with 1 μM for cADDis, along with a broader linear dose response, extending the range of cAMP concentrations that can be detected.
Red-shifted single-FP cAMP sensors are also being developed to empower greater multiplexed imaging in various conditions. In Pink Flamindo, for example, the mEPAC1-derived CNBD used in Flamindo was further truncated and inserted into a red-emitting FP mApple.421 A similar linker-engineering approach to that used to obtain Flamindo2 was also applied to optimize Pink Flamindo performance, yielding a >200% increase in red fluorescence intensity in live cells upon cAMP elevation. Pink Flamindo is compatible with blue-shifted sensors or optogenetic tools and was shown to be effective in monitoring the spatiotemporal dynamics of cAMP generated by photoactivated adenylyl cyclase (AC) in response to blue light, as well as in dual-color imaging experiments with the green Ca2+ indicator G-GECO.421 Soon afterward, Ohta et al. used an insertion-screening approach, where they inserted cp146 mApple at various positions within the N-terminal CNBD of PKA RIα.422 The resulting sensor, named R-FlincA, showed increased affinity and dynamic range compared with Pink Flamindo, with a reported 8-fold maximum fluorescence intensity increase upon cAMP addition in vitro, thus allowing for easier detection of subtle cAMP changes.422 Although cAMP sensors have been introduced into transgenic animal models such as fruit fly423 and zebrafish,424 transgenic mice for cAMP sensor imaging are rare, partly due to the fact that imaging fluorescent sensors in larger animals requires deeper penetration. The red-shifted excitation of these cAMP indicators is therefore expected to facilitate future in vivo cAMP imaging in mice.
6.1.1.3. Recent Advances in cAMP Indicator Development
Given the large number of available cAMP biosensors, direct, side-by-side comparisons of different biosensors are greatly beneficial for both new and long-time users. Recently, Massengill and colleagues compared eight genetically encoded cAMP biosensors, including both FRET-based and single-FP designs based on EPAC- or PKA-derived switches, with regards to their dynamic range and response sensitivity.425 Among these, the EPAC-S variant H187 (EPAC-SH187) stood out for its high dynamic range and fast response. Like most Epac-based cAMP sensors, EPAC-SH187 lacks the N-terminal Dishevelled/Egl-10/Pleckstrin (DEP) domain that confers PM localization426 but retains an intact C-terminus and thus shows a tendency to mislocalize to the nuclear periphery, owing to the presence of a nuclear pore localization (NPL) sequence.427 Massengill et al. corrected the uneven cellular localization of EPAC-SH187 by disrupting the NPL using a pair of point mutations and further mutated the CNBD to tune the cAMP sensitivity, resulting in a series of improved cAMP sensors called cAMPFIREs.425 These sensors were shown to be compatible with both emission-ratiometric FRET and FLIM-FRET imaging and were used to examine tonic cAMP dynamics in cortical neurons in awake mice, revealing that forced locomotion elicited neuron-specific, bidirectional cAMP dynamics.425
cAMP sensors based on mammalian CNBDs often exhibit small fluorescence changes, and many are dim when expressed in cells. Overexpression of mammalian CNBD-containing proteins may also potentially interfere with endogenous cAMP signaling. New efforts are thus being aimed at generating sensors utilizing CNBDs from other species. For example, using a bacterial cAMP receptor protein (CRP) with only around 30% sequence homology to mammalian CNBDs, Kawata and colleagues developed a green fluorescent cAMP receptor protein-utilizing validated indicator (gCarvi).428 Wang et al. similarly used a CNBD derived from the bacterial MlotiK1 channel (mlCNBD) to developed G-Flamp1, a highly responsive cAMP sensor in which cpGFP is inserted into mlCNBD, followed by extensive screening. G-Flamp1 exhibits a 9- to 47-fold greater fluorescence change than existing single-FP cAMP sensors.429 Both the basal fluorescence and the fluorescence change were further increased via linker screening to yield G-Flamp2, which facilitated sensitive cAMP imaging and detection in subcellular compartments such as the mitochondrial matrix.430 Although a previous work using mitochondrially targeted ICUE1 showed a response to β-adrenergic receptor stimulation, the limited dynamic range of ICUE1 makes it necessary to reexamine cAMP signaling at this location.404 Emerging evidence has suggested that mitochondrial cAMP plays a key role in regulating oxidative phosphorylation (OXPHOS). Mitochondrial targeting of G-Flamp2 revealed robust cAMP increases induced by forskolin stimulation or by photoactivatable AC,430 reaffirming the previous results and illuminating a new way by which cAMP can influence metabolism. However, whether mitochondrial cAMP signaling involves transport of cytosolically generated cAMP into the mitochondrial matrix or local cAMP production inside mitochondria is still under debate.431
Another recent innovation in the study of local cAMP signaling is the development of Fluorescent Sensors Targeted to Endogenous Proteins (FluoSTEPs). This technology leverages spontaneously complementing split GFP (see section 2.1.5) to target FRET-based biosensors to endogenously expressed POIs.415,432,433 Briefly, GFP1–10 is incorporated into a FRET-based sensor backbone as a partial donor FP, while GFP11 is tagged to the POI via CRISPR/Cas9 genome editing, such that spontaneous FP reconstitution will recruit the sensor to the POI. By tagging endogenously expressed type I PKA regulatory subunit α (RIα) with GFP11 and expressing either GFP1–10 or a FluoSTEP-ICUE sensor, Zhang et al. were able to visualize the formation of phase-separated biomolecular condensates by endogenous RIα and to directly probe cAMP dynamics within these condensates to understand their role in the spatiotemporal regulation of cAMP signaling.415 The ability of cells to restrict cAMP elevations to discrete signaling compartments (i.e., cAMP compartmentation) is critical for the specific regulation of cellular processes. While the conventional wisdom has long held that local activity of cAMP-degrading phosphodiesterases (PDEs) is principally responsible for cAMP compartmentation,434 more recent studies have raised questions about this model.435−438 Using FluoSTEP-ICUE, Zhang and colleagues observed that RIα condensates act as a dynamic buffering system to recruit and retain cAMP, acting in conjunction with PDEs to maintain highly compartmentalized cAMP signaling.435
6.1.2. Cyclic GMP (cGMP) Indicators
Cyclic guanosine monophosphate (cGMP) acts as a second messenger similar to cAMP. cGMP regulates complex signaling cascades through immediate effectors such as protein kinase G (PKG), PDEs, and cyclic nucleotide-gated ion channels. It plays a central role in diverse physiological and pathological conditions, including vascular smooth muscle relaxation and retinal phototransduction.439 Currently used cGMP sensors are based on the cGMP binding domains from two proteins: cGMP-dependent protein kinase I (PKGI/cGKI) and PDE5. The general design strategy is the same as that for cAMP indicators, with binding of cGMP to the sensing unit resulting in a change in fluorescence intensity or emission ratio. The most widely used cGMP sensors follow a FRET-based design. The cGMP binding domain is flanked by CFP and YFP; binding of cGMP induces a conformational change in the sensor, thus altering FRET efficiency. The first FRET-based cGMP sensor, CGY-del1, utilized truncated PKGIalpha (delta 1–47), which removes the dimerization sequence, as the sensing unit.440 Further mutation of the catalytic domain (T516A) silenced the intrinsic kinase activity of PKGI within the sensor, resulting in the cygnet series of cGMP indicators. These sensors reversibly responded to cGMP levels stimulated by nitric oxide (NO) in RFL fibroblasts.441 Optimization of the FP pair and linker sequences has generated improved versions of PKG-based sensors.442−444 At the same time, the cGMP binding domain from PDE5 was also used to construct the cGES-DE5 cGMP sensor,445 which was improved by similar methods to those that have been used to improve cAMP sensors, including optimizing linker sequences and choosing different FRET pairs.446−448 The PDE5-based cGMP sensor Cygnus has a dark acceptor and thus also serves as an intensity-based sensor.448 Tuning the ligand affinity of the cGMP nucleotide binding domain (cGNBD) also provides a way to engineer cGMP sensors suitable for specific applications. To probe low cGMP levels in cells such as cardiomyocytes and stellate ganglion (SG) neurons, the cGNBD from PKG of the protozoan parasite Plasmodium falciparum (PfPKG) was sandwiched between CFP/Venus and T-Sapphire/Dimer2 FRET pairs to generate yellow PfPKG and red PfPKG, respectively. Both sensors showed similarly high affinities for cGMP.449
An important development in cGMP imaging has been the generation of transgenic mice expressing cGMP sensors. For example, transgenic mice have been engineered using the cGi series of FRET-based cGMP indicators, which comprise the tandem cGNBD of cGKI flanked by CFP and YFP. In accordance with their tuned cGMP affinities, the sensors are named cGi-500, cGi-3000, and cGi-6000 (for cGMP indicator with an EC50 of 500, 3000, and 6000 nM, respectively). This wide range of cGMP-binding affinities allows the detection of physiologically relevant cGMP changes for various cell types in transgenic mice. Cells isolated from these transgenic mice were used to study cGMP dynamics under various conditions, revealing important roles of cGMP in different cardiovascular cell types.443,450 A transgenic mouse line expressing red cGES-DE5 has also been developed, which revealed very low basal cGMP levels in adult mouse ventricular myocytes.451
Single FP-based cGMP sensors have also been developed, such as FlincG, which directly fuses a cGNBD derived from PKG to cpEGFP. cGMP binding to the regulatory domain of PKG induces substantial conformational changes. FlincG was shown to successfully detect changes in cGMP levels in HEK293T cells and cardiac fibroblasts, but not in other cells such as neurons.452 A systematic exploration of rational mutations from the original FlincG also yielded improved cGMP indicators, FlincG2 and FlincG3, which showed 230-fold selectivity over cAMP, although they showed lower affinity for cGMP, suggesting they are preferable in applications where higher cGMP concentration is observed.453 In an effort to improve upon the labor-consuming trial-and-error approach that is typically used for sensor optimization, a computational method was developed that effectively combines modeling techniques with coarse-grained simulations to quantitatively predict FRET efficiency. This model led to the development of an improved cGMP sensor, CUTie2. The sensor showed a moderate cGMP affinity and over 400-fold higher selectivity for cGMP over cAMP,454 providing a new opportunity for using computational methods for future sensor improvements
6.2. Lipids
Lipids are crucial building blocks of cells, as they make up the membranes enclosing the cell and various intracellular organelles while also serving as key signaling molecules.455,456 Biosensors for various lipids, such as cholesterol and diacylglycerol,457,458 have been developed over the years.459 Many of these biosensors consist of a lipid-binding domain fused to an FP, although advances have been made in the development of FRET-based lipid biosensors, as well. A particular focus in the field has been on the development of sensors for detecting phosphatidylinositol (PtdIns) lipids, which are a ubiquitous class of membrane phospholipids that can be phosphorylated on their 3-, 4-, and 5-hydroxyl groups by phosphoinositide kinases to yield a variety of lipid species. The reverse reaction, the removal of the phosphate group at these positions, is catalyzed by lipid phosphatases.460 The various phosphoinositides generated through combinatorial phosphorylation at these positions are not only important for determining membrane identity but also play key roles in intracellular signaling and membrane trafficking.461 Phosphoinositide levels are dynamically regulated in live cells, and fluorescent biosensors serve as great tools to monitor the spatiotemporal regulation of these molecules.
6.2.1. Translocation/Localization-Based Phosphoinositide Indicators
Phosphoinositides reside in membranes throughout the cell, and the presence of a particular phosphoinositide species is usually an indicator of the identity of the specific membrane compartment.461 Knowing the localization of endogenous phosphoinositides can thus provide valuable information on biological processes. It is straightforward to use FP-labeled phosphoinositide-binding proteins as indicators to examine the localization of phosphoinositides (Figure 8b). Generally, phosphoinositide indicators are constructed by directly fusing an FP to a phosphoinositide-binding protein or domain, which translocates to or from specific compartments in response to the production or degradation, respectively, of the target. The specificity of phosphoinositide indicators is determined by the differential binding affinities of different binding domains for different phosphoinositides. Several highly specific phosphoinositide-binding proteins have been used to examine the localization of endogenous phosphoinositides. For example, a GFP-labeled FYVE domain showed that PI(3)P was predominantly localized to endosomes,462 whereas PI(4)P was shown to exhibit a wider distribution, including to the Golgi, plasma membrane, and endosome/lysosome, according to a GFP-labeled P4M domain derived from the bacterial pathogen-secreted effector protein SidM.463 Pleckstrin homology (PH) domains from a variety of proteins with specificity toward different phosphoinositides have been used to engineer such translocation-based sensors, such as the PH domain from a tandem PH domain-containing protein, TAPP1, for detecting PI(3,4)P2,188 and the PH domain from phospholipase C (PLC) δ1 (PHPLCδ1) to sense PI(4,5)P2.464,465 For example, a PI(4,5)P2 localization reporter based on PHPLCδ1 revealed that PI(4,5)P2 also localizes to the outer leaflet of the plasma membrane in addition to its well-established presence on the inner compartment.466 However, because PHPLCδ1 also binds to inositol-1,4,5-triphosphate (IP3), a more selective probe for detecting PI(4,5)P2 with greater specificity was generated using an Epsin1 N-terminal homology domain.467 Many other phosphoinositide localization reporters have been developed and they continue to provide valuable information on the spatial distribution of these important molecules.
6.2.2. FRET-Based Phosphoinositide Indicators
While translocation-based phosphoinositide sensors have the ability to localize to native compartments, there are some drawbacks to their use: first, intensity fluctuations caused by drifting of the focal plane or changes in cell morphology can drastically affect quantification of probe fluorescence, which may lead to inaccurate conclusions; second, some lipid-binding domains may localize to certain regions of the cell in a lipid-independent manner; third, these sensors cannot be targeted subcellularly to study specific pools of phosphoinositides. To overcome some of these limitations, FRET-based phosphoinositide sensors have been developed. A PI(4,5)P2 biosensor used cotranslocation as the sensing mechanism and FRET changes as the readout to detect changes in membrane PI(4,5)P2 levels. In this bimolecular design, PHPLCδ1 was fused to either CFP or YFP, with domains fused to either FP being coexpressed in cells and bound to the plasma membrane PI(4,5)P2. Upon decreases in membrane PI(4,5)P2 levels caused by PLC-mediated conversion to IP3 and DAG, both CFP-PHPLCδ1 and YFP-PHPLCδ1 are released from the plasma membrane, decreasing the proximity of CFP and YFP and causing a change in intermolecular FRET.468 Although the FRET-based readout addressed some of the limitations in quantification, this sensor still uses a translocation-based reporting mechanism and thus cannot be targeted subcellularly. In addition, the expression levels of the two FP-tagged PH domains must be carefully optimized to achieve the desired sensitivity, although a unimolecular version, named CYPHR, was constructed by both linking CFP and YFP to a single PH domain.469
To fundamentally address the limitations of translocation-based biosensors, another series of phosphoinositide sensors use a FLLIP design (fluorescent indicator for a lipid second messenger that can be tailor-made), which contain a membrane targeting motif, phosphoinositide-binding domain and hinge linking the FRET FP pair. The sensor PH domain binds or releases the membrane depending on the presence of the corresponding phosphoinositide, inducing a conformational change that drags the FRET pair into or out of proximity and altering FRET.470 This method has been applied to design the Pippi sensor series for probing PI(3,4)P2 and PI(4,5)P2.471,472 This design requires targeting the sensor to the membrane compartment of interest and is ineffective in detecting phosphoinositides in nonmembrane compartments. The InPAkt (Indicator of Phosphoinositides using Akt) FRET biosensor that detects cellular PI(3,4)P2 and PI(3,4,5)P3, collectively known as 3-phosphoinositides (3-PIs), introduced a pseudoligand into the design to constitute a molecular switch with the PH domain. The pseudoligand sequence is designed to bind with low affinity to the PH domain in the basal state and be competed off when the specific phosphoinositide is generated and binds the PH domain instead. This competitive binding causes a global conformational change in the sensor, leading to a change in FRET.473 In NIH3T3 cells, PDGF triggered immediate and transient production of 3-PIs at the plasma membrane, as revealed by plasma membrane-targeted InPAkt. Nuclear-localized InPAkt, however, showed no response, despite the presence of nuclear Akt activity,473 suggesting that a pool of Akt can disassociate from the plasma membrane and translocate to the nucleus. More recently, 3-PIs were found to also accumulate on the lysosome membrane through endocytosis to locally activate the downstream Akt/mTOR pathway.474 The pseudoligand design pioneered by InPAkt has since been applied to detect other 3-PIs. For example, by pairing PHPLCδ1 with the InPAkt pseudoligand sequence, Hertel et al. generated the FRET-based reporter PlcR to detect PI(4,5)P2 dynamics.475
We anticipate that the development of more phosphoinositide sensors with higher sensitivity and specificity will foster a better understanding of the detailed mechanisms through which phosphoinositides regulate compartmentalized signaling.
6.3. Energy, Redox, and Metabolites
Monitoring the energy and redox status of living cells or within subcellular compartments can be an important indicator of stress response or altered energy homeostasis under various conditions. Numerous FP-based biosensors have been developed to detect cellular nucleotides, ROS, reducing agents, and metabolites that will be critical to improving our understanding of cellular energy production and regulation with spatiotemporal precision.
6.3.1. Nucleotide Sensors
Nucleotides are essential building blocks of nucleic acids and crucial signaling molecules in cells. Understanding the dynamic flux of these molecules can provide information on a wide range of processes, including cellular energy status, signal transduction, and purine/pyrimidine synthesis and metabolism. Several biosensors have been developed to detect a variety of nucleotides.
6.3.1.1. Adenosine 5′-Triphosphate (ATP)
Adenosine 5′-triphosphate (ATP) is the energy currency of the cell and required for the vast majority of cellular processes and functions. Changes in ATP levels can reflect metabolic and energy fluxes in the cell, indicating changes in glycolysis or oxidative phosphorylation, which in turn affects downstream energy- and stress-sensitive signaling pathways, such as AMPK signaling.476 The first reported ATP sensor was ATeam, a FRET-based ATP sensor that incorporates an ATP-binding protein as the sensing unit. Specifically, ATeam incorporates the epsilon subunit of Bacillus subtilis F0F1-ATP synthase, which has two α-helices on the C-terminus that interact with an N-terminal β-sandwich upon binding ATP.477 The ATeam reporting unit consists of mseCFP and cpVenus, a cyan-yellow FRET pair. Upon binding ATP, a conformational change in the epsilon subunit domain allows the two FPs to achieve a more suitable orientation for FRET, increasing the yellow/cyan emission ratio. Variants of ATeam were developed by incorporating mutations in the sensing unit which altered the Kd. ATeam1.03 showed a Kd of 3.3 mM, making it suitable for sensing intracellular ATP concentrations, which are in the millimolar range. A higher-affinity variant, ATeam3.10, was also developed using the ATP-sensing subunit of the ATP synthase from Bacillus PS3, with a Kd of 7.4 μM. The sensing units of these biosensors have served as the basis for several other iterations. For instance, the Queen ATP sensors were developed as excitation-ratiometric sensors based on cpGFP and the sensing units from ATeam1.03 and ATeam3.10, resulting in variable Kd values. The Imamura lab developed Queen sensors to enable ATP sensing in bacteria, which is complicated by sensors which incorporate multiple FPs with variable maturation times. By coupling the ATP-sensing unit to a single FP, cpGFP, Yaginuma, et al. were able to avoid this problem.478 Further iterations of single-color ATP sensors, namely, MaLionRed (mApple-based), Green (Citrine-based), and Blue (BFP-based), were developed using the Bacillus subtilis sensing unit coupled to different FPs to provide single-color intensiometric readouts of ATP dynamics in a manner suitable for multiplexed imaging in mammalian cells.479 Later, iATPSnFR, an intensiometric ATP sensor using cpsfGFP as the reporting unit, was developed with a Kd of 120 μM, which is more suitable for extracellular imaging applications. iATPSnFR uses the ATP synthase epsilon subunit from Bacillus PS3, as in ATeam3.10. A variant of iATPSnFR has also been developed incorporating an mRuby fusion to provide a ratiometric response, with mRuby serving as a static reference fluorophore.478,480
Each of these available ATP sensors presents distinct advantages or disadvantages when applied to different contexts. For instance, picking the correct sensor that can detect the physiological range of ATP for each experimental context is an important consideration, as the ATP-binding affinity (Kd) varies for different sensors. For instance, the MaLion series bind ATP with affinities ranging from 0.34 to 1.1 mM, whereas ATeam1.03 has a 3.3 mM Kd and Queen variants show Kd values of 7 μM and 2 mM. Another consideration for ATP sensors is pH sensitivity, since conditions that drastically change cellular ATP levels can also lead to changes in pH.481 For example, the green and red MaLion sensors demonstrate pH sensitivity, whereas the blue variant is relatively pH insensitive and therefore may be more suitable for application under conditions associated with drastic changes in ATP levels.479
6.3.1.2. Adenosine Diphosphate (ADP)
Adenosine diphosphate (ADP) can be generated upon dephosphorylation of ATP. ADP serves as both an energy carrier and a signaling molecule, the importance of which is highlighted by the presence of ADP receptors.482 Thus, several ADP sensors have also become available to probe the dynamic flux of this molecule in live cells. ADPrime was developed for detecting ADP483 and exhibits very low affinity for ATP. This FRET-based biosensor uses a bacterial protein ParM from E. coli as the sensing unit, as it exhibits a large conformational change upon ADP binding. The sensing unit is sandwiched between mTFP1 and mVenus. A single-FP sensor, termed Perceval, reports on cellular ATP/ADP ratios using the bacterial GlnK1 protein, which can bind both ATP and ADP, leading to conformational changes that affect the intensity of the fused cpmVenus, producing an excitation-ratiometric response.484 An improved version was also developed in 2013, called Perceval HR, which exhibits a higher dynamic range than the original Perceval (∼70% excitation-ratio change to glycolysis inhibition in mammalian cells).197
6.3.1.3. Guanosine-5′-Triphosphate (GTP) and Guanosine-5′-Diphosphate (GDP)
Guanosine-5′-triphosphate (GTP) and guanosine-5′-diphosphate (GDP) biosensors have also been developed to reveal more information about the spatiotemporal distribution of these nucleotides as major regulators of cellular signaling, including monomeric GTPases (discussed in section 11). GEVAL, for instance, is an excitation ratiometric biosensor that uses cpYFP as the reporting unit inserted into a region of the bacterial FeoB G-protein, which undergoes a conformational change upon GTP binding. GEVAL exhibits greater sensitivity for GTP and dGTP over GDP and no sensitivity to other similar nucleotides like ATP.485 Two variants were developed, GEVAL30 and GEVAL530, which have different GTP and GDP Keff values to match different physiological ranges of cellular GTP levels, as well as a negative-control GEVALNull biosensor that binds neither GTP nor GDP. Another excitation-ratiometric biosensor was developed to detect GTP to GDP ratios called GRISerHR (High Response of GTP:GDP Ratio Sensor).486 This sensor also utilizes cpYFP as the reporting unit, inserted into eIF5B from Chaetomium thermophilum, which changes conformation depending on its binding state (to GTP or GDP). GRISerHR was validated for use subcellularly in mitochondria and in the nucleus of HEK293T cells to reveal modulation of mitochondrial GTP:GDP ratios independent of cytosolic nucleotide pools.
Further expanding the palette of nucleotide sensors will enable more complex and simultaneous characterization of subcellular nucleotide levels in multiplexed imaging formats as they relate to other important signaling molecules.
6.3.2. NAD+/NADH/NADP+/NADPH
NAD+ and NADP+ are involved in several metabolic pathways and can be used to report the redox, energy, and anabolic metabolism status of cells.487 NAD+ is an essential substrate for PARPs (poly(ADP-ribose) polymerases), which consume NAD+ and can affect downstream cellular signaling events in various regions of the cell. Biosensing of NAD+ with spatiotemporal resolution can help reflect downstream changes in NAD+-dependent enzyme activities in various cellular compartments such as mitochondria or the nucleus. The currently available excitation-ratiometric NAD+ sensor LigA-cpVenus, which incorporates a bipartite NAD+ binding domain based on a bacterial DNA ligase, LigA, and cpmVenus, was used to probe nuclear, cytosolic, and mitochondrial changes in NAD+.488 Another yellow sensor called FiNad was developed to detect changes in the ratio of NAD+ to ATP and ADP. Despite reduced specificity for NAD+, this sensor introduces significant improvements in dynamic range using the cpYFP as the reporting unit and the Thermus aquaticus Rex protein (T-Rex) as the sensing unit. To improve specificity of the sensor for NAD+ over NADH, Zou and colleagues generated a library of constructs with randomized linkers of 1–3 amino acids in length to be inserted between the cpYFP and T-Rex domain. Several variants exhibited enhanced sensitivity for NAD+ over NADH, with the best performing variant, FiNad, exhibiting selectivity for NAD+ over ADP and ATP binding to T-Rex.489 To examine NADH rather than NAD+, an NADH sensor was also developed called Frex, which is another excitation-ratiometric sensor incorporating cpYFP and the B-Rex NAD+ binding domain, which underwent site-directed mutagenesis to increase sensitivity to NADH and reduce NAD+ sensitivity.490
While several sensors aim for specificity in reporting either NAD+ or NADH levels in cells, there are also tools to detect both. Because the cytosolic NADH-to-NAD+ redox state is a significant factor in glycolysis, detecting spatiotemporal changes in this parameter can be highly informative of how it is regulated in live cells. Peredox is an example of this type of sensor, which uses the bacterial NADH-binding protein Rex fused to cpT-Sapphire, an LSS green-emtting FP, and mCherry to enable ratiometric imaging. NAD+ and NADH compete for binding to the sensor, and this results in variable intensity of cpT-Sapphire.491 RexYFP is another example that has been utilized to report on subcellular changes in the NAD+-to-NADH ratio. RexYFP, like FiNad, uses T-Rex as the sensing domain, which is fused to cpYFP and yields an intensiometric response. However, a pH-dependency was reported for the sensor response, and it is recommended to coimage with a pH sensor to correct for pH effects.492 pH sensitivity may also pose a problem for similar sensors that also use cpYFP, as most NAD sensors do. The current best-performing biosensor for detecting the ratio of NAD+ to NADH is SoNar, which exhibits higher brightness, a larger dynamic range, and a faster response compared to Frex and Peredox. SoNar is an excitation-ratiometric biosensor that uses cpYFP fused to a truncated variant of the T-Rex protein and increases in 485 nm excited fluorescence intensity over 420 nm excited fluorescence intensity upon binding NAD+.493 The utility of SoNar was demonstrated in a screen to identify compounds targeting tumor metabolism, where the sensor detected variable NAD+-to-NADH redox states in different tumor cell lines. Although SoNar also uses cpYFP, a pH-sensitive FP, Zhao and colleagues observed the sensor to be relatively insensitive to pH changes from 7.0 to 7.8 when the sensor was excited with 420 nm light, as well as negligible effect of pH changes from 7.0 to 8.0 on the dynamic range of the sensor.
The sensing unit of SoNar was later adapted to generate the ratiometric, pH-resistant, and high-dynamic-range NADPH sensor series iNap.494 These sensors exhibit variable affinities for NADPH, namely, iNap1 for low-abundance cytosolic NADPH, iNap3 for high-abundance mitochondrial NADPH, and a nonbinding control sensor. This family was designed using the T-Rex domain from SoNar, to which Tao and colleagues introduced mutations to alter the charges of amino acids in the NADP-binding loop, reduce loop rigidity, and increase the polarity of the adenine binding pocket to make it sensitive to NADPH over NADH. The cpYFP reporting design was retained from SoNar, and after structure-guided engineering, excitation-ratiometric NADPH sensors were developed. The sensors were validated for imaging of NADPH fluctuations in live cells during macrophage activation or wound response in vivo, revealing differences in cytosolic and mitochondrial NADPH levels in live cells. iNap was also used to visualize NADPH dynamics in cells undergoing oxidative stress or multiplexed in vivo in zebrafish along with HyPerRed, a red H2O2 sensor. The development of more color variants would be helpful for coimaging with SoNar to simultaneously track NADH and NADPH dynamics in live cells.
Two NADP+ sensors, Apollo-NADP+ and NADPsor, have also been developed. NADPsor is a FRET-based biosensor that was developed to recognize NADP+ using a ketopantoate reductase (KPR)-based sensing unit sandwiched between CFP and YFP, with FRET efficiency decreasing upon binding of NADP+. Using computational protein redesign, KPR was optimized by systematic engineering of protein length and site-specific mutagenesis. This yielded a highly specific sensor with a detection limit of 1 μM in E. coli.495 Apollo-NADP+, on the other hand, was proposed to serve as a spectrally tunable family of sensors for NADP+.496 The design relies on steady-state fluorescence anisotropy measurements to detect homo-FRET, and the sensing domain uses the NADP+-dependent homodimerization of enzymatically inactive glucose-6-phosphate dehydrogenase (G6PD). Due to the capability for many FPs to undergo homo-FRET, this design presents a spectrally tunable system for NADP+ detection and exhibits a 15–20% change in fluorescence anisotropy with the reported proof-of-concept FP, Cerulean.
Most recently, NERNST, a ratiometric biosensor of NADP(H) redox status for use in bacterial, plant, and animal cells was developed and validated for use in various subcellular organelles, including chloroplasts and mitochondria. The sensor uses an NADPH-thioredoxin reductase C fused to the redox-sensitive FP roGFP2 to detect NADP(H) redox state via oxido-reduction of roGFP2.497
Hybrid approaches have also been utilized to detect different NAD molecules, such as the recently introduced NS-Goji, NS-Olive, and NS-Grapefruit NAD+ biosensors that make use of BRET and FRET.498 The FRET-based sensor, NS-Grapefruit, incorporates mScarlet-I (acceptor) and mNeonGreen (donor) flanking EfLigA as the NAD+-binding sensing unit. NS-Grapefruit exhibits a 1.6-fold response to NAD+ and does not have any reported affinity to NADH. NS-Olive and NS-Goji, alternatively, are BRET-based green (mNeonGreen) and red (mScarlet-I), respectively, NAD+ biosensors that incorporate a circularly permuted luciferase (cpNanoLuc) as the energy donor. In addition to expanding the color palette of NAD+ biosensors, these biosensors enabled NAD+ detection in blood and revealed subcellular NAD+ modulators (mitochondrial and nuclear).498
Although there are several biosensors available to detect different NAD molecules, most NAD sensors have yellow or green fluorescence emission, and many thus overlap with the autofluorescence of NADH and FAD. There is still a need to adapt these biosensors to encompass other colors to enable greater multiplexed imaging capabilities, and decrease the contribution of autofluorescence in the signal, which can be more significant in subcellular compartments.490 The hybrid sensing approach presented by the NS-Goji, NS-Olive, and NS-Grapefruit biosensors have started to push the spectral boundary, but these advancements are still limited, and FP-based NAD biosensors are still lacking in spectral diversity.
6.3.3. Pyruvate
Pyruvate is a product of glycolysis and is involved in the citric acid cycle. It is therefore positioned as an important metabolite that can provide information about cellular and mitochondrial metabolism. Pyruvate sensors were first introduced as a method for estimating mitochondrial flux and metabolism specifically related to pyruvate carbon flux. In addition, subcellular tracking of pyruvate may provide insights into the action of pyruvate carriers and transporters. The first pyruvate sensor, Pyronic, was generated using the transcriptional regulator PdhR from E. coli, which can bind pyruvate directly. PdhR was sandwiched between an mTFP-Venus FRET pair to achieve yellow/cyan emission ratio changes upon recognition of pyruvate. Upon exposure to 5 mM pyruvate, the sensor exhibited an approximately 20% response and showed high specificity to pyruvate over lactate, acetate, and glucose. However, the sensor exhibited a slight response to citrate. The biosensor was tested in HEK293 cells, astrocytes, and neurons.499 A mouse line with stable expression of a FRET-based pyruvate sensor, termed Pyrate, was also used to study pyruvate flux during embryonic development in mice. The sensor incorporates the mTurquoise and cp173Venus cyan-yellow FRET pair flanking the PdhR pyruvate sensing domain. The sensor was imaged in ex vivo assays recapitulating the embryonic patterning in primary cells through two-dimensional cell culture.500
PyronicSF, a GFP-based sensor with improved dynamic range compared to Pyronic, was more recently developed in 2020 and utilized for in vivo imaging. PyronicSF takes the same sensing domain as Pyronic, but instead fuses it to cpGFP to yield an intensiometric response to pyruvate. Because this version of the sensor exhibits slight pH sensitivity, a pyruvate-binding-deficient variant was also developed to serve as a negative control. PyronicSF was used to perform subcellular imaging of pyruvate in the cytosol, nucleus, and mitochondria in cultured cells and to visualize pyruvate dynamics in vivo in live fruit fly larvae.501 Another intensiometric green pyruvate sensor, termed Green Pegassos, was reported the same year as PyronicSF and uses the same sensing unit and cpGFP reporting unit. Green Pegassos exhibited a 3.3-fold response to pyruvate and was also validated for dual-color multiplexed imaging with a Ca2+ sensor.502
Some of the constraints facing current pyruvate sensors include citrate sensitivity of the sensing domain and a lack of color variants. Red-shifting the palette of pyruvate sensors will be more suitable for in vivo and multiplexed imaging applications.
6.3.4. Lactate
Lactate is a metabolite produced in glycolysis that is an important player in cellular and mitochondrial metabolism. In addition, lactate has recently been implicated as a signaling molecule involved in neuronal plasticity and metabolism, immune escape, and cancer metastasis.503−505 Lactate biosensors can therefore address emerging questions involving the role of lactate as a signaling molecule in varied cellular processes.
The first lactate sensor was generated in 2013, termed Laconic (Lactate optical nano indicator from CECs).506 This FRET-based biosensor utilizes the bacterial transcription factor LIdR to bind lactate with high affinity and specificity over other similar metabolites such as glucose, glutamate, or acetate. The sensing unit is flanked by mTFP and Venus, and upon lactate binding the FRET efficiency is decreased. The sensor was validated in HEK and T98G glioma cells and revealed lactate flux induced by MCT (monocarboxylate transporter) inhibition. A green lactate biosensor called Green Lindoblum was also developed by the same group that generated the pyruvate biosensor Green Pegassos (section 6.3.3). This sensor utilized the same sensing unit as Laconic, LIdR. The reporting unit is cpGFP, and the sensor yields a 5.2-fold response to changes in lactate, demonstrating a high dynamic range, and was validated for multiplexed imaging with a Ca2+ sensor.502
A sensor has also been developed to probe both lactate and pyruvate. Lapronic is a biosensor that detects changes in the lactate-to-pyruvate ratio.507 This FRET-based sensor utilizes the B. licheniformus orphan transcription factor LutR, which is responsive to both pyruvate and lactate. This sensing domain is placed in between mTFP and Venus. Upon recognition of pyruvate, FRET between mTFP and Venus is increased, whereas lactate binding results in decreased FRET.
In testing a novel mammalian screening approach, the Yellen lab developed a lifetime-based lactate sensor called LiLac.218 The screening system, BeadScan, takes advantage of 2pFLIM combined with droplet microfluidics to identify high-performance lifetime-based biosensors. LiLac was designed using the dCACHE extracellular domain from the bacterial chemotaxis protein TIpC, which is a lactate-binding protein from Helicobacter pylori. This sensing domain, which is highly specific for lactate, was fused to cpT-Sapphire. In the presence of lactate, the sensor exhibits a decrease in fluorescence lifetime, and was validated in HEK293T cells as well as acute hippocampal brain slices.
As is the case with many other metabolite sensors, there is still a limited palette of sensors available for detecting lactate. The Campbell lab recently developed single-color green and red lactate sensors, eLACCO1.1 and R-iLACCO2 series biosensors, which exhibit high dynamic range in cells and are suitable for multiplexed imaging.508,509 The first sensor of the LACCO series, eLACCO1.1, was designed as an extracellular sensor of lactate consisting of the lactate-binding periplasmic protein TTHA0766 from Thermus thermophilis as the sensing domain, split into two fragments flanking cpGFP.509 This was further improved by the incorporation of several residues within the coding region of the sensor, tuning for lactate affinity and dynamic range. An intracellular red lactate sensor was also developed, called R-iLACCO2, which incorporates a split LIdR lactate sensing domain flanking the reporting unit cpmApple. These sensors were imaged in the brains of mice as proof of concept for in vivo imaging applications. They were also multiplexed to image subcellular lactate fluxes extracellularly, in mitochondria, in the cytosol, and in the ER. These initial studies, as well as the whole suite of lactate biosensors, have laid a foundation for a better understanding of the spatiotemporal regulation and usage of lactate at various cellular compartments.
6.3.5. Citrate
Citrate is the first major intermediate in the TCA cycle and plays roles in inflammation, insulin secretion, and cancer.510 Therefore, citrate biosensors could provide crucial insights into the spatiotemporal regulation of this metabolite in various disease states.
An early FRET-based citrate sensor was developed by Ewald and colleagues, who incorporated the citrate-sensitive CitAP domain of CitA, a sensor histidine kinase from Klebsiella pneumoniae, which undergoes a conformational change in response to citrate binding,511 between a CFP-Venus FRET pair.512 This sensing unit served as the basis for subsequent iterations of citrate sensors as well. For example, the green citrate sensor CF98 was developed for use in bacteria inserting a cpGFP reporting unit into the CitAP domain of CitA between residues 98 and 99 to yield an intensiometric response to citrate.513 Using structure-guided mutagenesis and directed evolution, Zhao and colleagues developed the improved Citron and Citroff biosensors, which are direct- and inverse-response biosensors that increase and decrease in fluorescence intensity, respectively, upon citrate binding. These sensors insert the CitA-based sensing unit into GFP and demonstrate Kd values for citrate that fall within a more physiologically relevant range for mammalian cells compared to CF98 (Citron1 Kd = 1.1 mM, CF98 Kd = 9 mM).514 Although there are now several options for citrate biosensors, there is still a need for developing higher-sensitivity citrate biosensors that are optimized for use in mammalian cells.
6.3.6. ROS and Peroxide
Reactive oxygen species (ROS) are produced continuously throughout the cell as byproducts of various redox reactions during metabolism. Although these highly reactive radicals are short-lived, they react with different biomolecules to influence biological processes, such as inhibiting phosphatases, activating protein kinases, and modulating pPPIs. Spatiotemporal equilibrium of ROS is important for the many physiological roles of these small molecules.
6.3.6.1. H2O2 Biosensors
Hydrogen peroxide (H2O2) is generated endogenously within cells either directly or through the dismutation of superoxide anions (O2–). H2O2 functions as a second messenger and plays a crucial role in signal transduction.515 Monitoring H2O2 concentrations/dynamics provides clue to understanding cellular redox biology.516 Although one may replace the Tyr66 in GFP with an H2O2-sensing unnatural amino acid to probe cellular H2O2,517 this approach requires additional genetic manipulation for efficient unnatural amino acid incorporation. Genetically encoded fluorescent biosensors are more widely accessible, with their easier experimental setups. There are two major types of genetically encoded fluorescent H2O2 biosensors, including FRET-based biosensors and excitation ratiometric single-FP-based biosensors (Figure 8c). pH sensitivity is particularly relevant in ROS production, as NADPH oxidase leads to the release of a proton which can affect the local pH environment.515 One way to construct a pH-insensitive H2O2 sensor is through a FRET-based design incorporating relatively pH-insensitive FPs. Two FRET-based H2O2 biosensors have been constructed to date: OxyFRET and PerFRET. Both sensors used the same pH-insensitive donor FP, namely, Cerulean-delta11 with cp173Venus as the acceptor, resulting in two sensors resistant to pH changes, particularly alkalinizing changes. However, the sensing units of these two biosensors are constructed differently: OxyFRET uses the N- and C-terminal regions of the cysteine-rich domain (cCRD) of Yes-associated protein 1 (Yap1) while PerFRET uses oxysterol binding protein-related protein 1 (Orp1) and the cCRD of Yap1. H2O2 production induced an increase in the yellow/cyan emission ratio in OxyFRET-expressing HeLa cells, whereas PerFRET responded with an increase in the cyan/yellow emission ratio, reflecting the different conformational changes in these sensors.518
6.3.6.2. Single FP-Based H2O2 Biosensors
The reduction–oxidation-sensitive GFP, roGFP, serves as a candidate to develop single-FP H2O2 biosensors.519 Redox-sensing GFP2 (roGFP2) was coupled with peroxidase from yeast (Orp1) or mammalian cells (Gpx4). H2O2-specific redox reactions in the vicinity of the peroxidase cause roGFP to shift its excitation peak, yielding an excitation-ratiometric response that reflects elevated H2O2 levels in stimulated cells. However, this sensor was not sensitive enough to assess basal metabolic H2O2 levels.520 To quantify baseline levels of H2O2, an improved, ultrasensitive H2O2 sensor based on the yeast peroxiredoxin Tsa2 was developed (roGFP2-Tsa-delta-CR). Mutating the peroxidatic cystine (delta-CR) prevents thioredoxin (Trx1/2) from competing with roGFP2 to oxidize the Tsa2 moiety, which maintains the sensor in a 50% oxidized state at basal levels, allowing the detection of both increases and decreases in H2O2.521
The prokaryotic (E. coli) transcription factor OxyR has several unique structural features that allow residue Cys199 to be selectively oxidized by H2O2, but not other oxidants. Using the Ca2+ indicator Pericam as a prototype, the specific H2O2 indicator HyPer was generated by inserting the regulatory domain of OxyR (OxyR-RD) into cpYFP. Exposure of OxyR-RD to H2O2 converts Cys199 to a sulfenic acid derivative that subsequently forms an intramolecular disulfide bond with Cys208 in OxyR-RD, causing a dramatic conformational change that shifts the cpYFP excitation peak from 420 to 500 nm. This allows the measurement of cpYFP fluorescence intensity at different excitation wavelengths and calculation of the excitation ratio change to represent changes in H2O2 levels.522 HyPer serves as a reversible H2O2 sensor and has been widely used in the field. Improvements have been made by engineering the dimer interface of HyPer. A point mutation, A406V (A233V in OxyR-RD) is hypothesized to stabilize the dimer and expands the dynamic range of HyPer-2 compared to the original HyPer sensor.523 Following a similar theory of mutating the dimer interface (H34Y), HyPer-3 further improved the dynamic range and is compatible with FLIM imaging.524 Analysis of the photostability of cpYFP-based HyPer-2 and other YPFs revealed that HyPer-2 had surprisingly high photostability, making it possible to use HyPer-2 in super-resolution imaging. Using stimulated emission depletion (STED) microscopy,525 microtubule localized HyPer-2 sensor showed different dynamics in neighboring filaments that were as close as 100–200 nm in linear size, suggesting cells control the location of the oxidant required for cell signaling with high spatial precision, thus reducing the possibility of mislocalized oxidant to cause adverse effects.526
Exchanging the FP within HyPer resulted in H2O2 indicators with different optical properties. Changing cpYFP to mNeonGreen yielded NeonOxlrr, which exhibits high brightness and reduced pH sensitivity, as well as faster oxidation rate and chromophore maturation.527 While HyPer-based sensors are more likely to be affected by pH changes, this issue has largely been overcome by the newest member in the HyPer series. HyPer-7 is a cpGFP-based ultrasensitive H2O2 biosensor that exhibits over 15-fold higher brightness than HyPer-3, a preferrable property for super-resolution microscopy, and responds to nanomolar external H2O2 addition and likely subnanomolar H2O2 intracellularly.528 Additionally, swapping cpYFP for cpmApple yielded a red-shifted indicator, HyPerRed.529 Recently, an engineered cpmScarlet that is minimally affected by blue-light-induced photoactivation was also used to construct an H2O2 biosensor, SHRIMP, which exhibited a 5-fold response to H2O2 production.530
6.3.6.3. Development of Other ROS Sensors
Although H2O2 is one of the most extensively studied ROS, other ROS are equally important in maintaining cellular homeostasis. Nevertheless, the development of biosensors for these molecules has lagged. Only a few biosensors have been developed to monitor other ROS. For example, a sensor for visualizing organic hydroperoxide (OHP), OHSer, was generated based on OhrR, a bacterial transcriptional regulator in control of the OHP detoxification apparatus. OHSer was constructed by inserting cpVenus into the α5 helix of OhrR and results in increased yellow fluorescence intensity in the presence of OHP.531 Continued development of sensors for detecting additional ROS beyond H2O2 is greatly needed to better understand the dynamics of intracellular and intraorganellar redox environments.
6.3.7. Sugars and Other Analytes
As an important component of the human diet, sugar is the most important source of energy. However, excessive intake of sugar is associated with adverse health conditions, including obesity, metabolic syndrome, and inflammatory diseases.532 Biochemically, carbon, oxygen, and hydrogen form most of the simple sugars, also called monosaccharides, which are the building blocks of essential biological carbohydrate polymers such as DNA and RNA. Monosaccharides such as glucose can form long chains via anabolism to store energy, and when needed, glucose can be generated via catabolism to fuel the body. The intracellular level of sugars is thus an important indicator of the energy status of the cell.533,534 Monitoring the dynamic changes in cellular sugar levels can provide valuable information on metabolic homeostasis.
Glucose, as the direct energy source, has been a major focus in the past two decades. Early on, Tolosa et al. mutated the E. coli glucose binding protein (GBP) to introduce a single, surface-exposed Cys residue which provided a chemical handle for attaching an environmentally sensitive organic fluorophore.535 Glucose binding produced a roughly 2-fold decrease in fluorescence intensity, suggesting that the conformational changes induced by glucose binding could be utilized to develop a genetically encoded fluorescent reporter. A glucose indicator protein (GIB) was thus developed by sandwiching GBP between a FRET pair, which showed glucose sensitivity in vitro using a dialysis hollow fiber.536 A very similar design named fluorescent indicator protein (FLIP), which was originally used to construct a FRET-based maltose reporter working in yeast,537 showed effectiveness in building a glucose reporter, FLIPglu.538 Many mutations were introduced to tune the glucose-binding affinity of the reporter, of which FLIPglu-600u was capable of monitoring glucose concentration in COS-7 cells.538 The FLIP design is generalizable and has been used to construct reporters for other sugars, including arabinose,539 sucrose,540 ribose,541 and trehalose.542 Performing a systematic optimization of the linker sequences connecting FP and GBP543 and switching to a less pH-sensitive YFP variant has yielded reporters with improved sensitivity and dynamic range, which were used to perform an siRNA screen for factors involved in maintaining steady-state glucose levels in HepG2 liver cells.544
Recently, single-FP glucose reporters have also been successfully constructed. In a reporter named fluorescent glucose binding protein (FGBP), cpYFP was inserted into the flexible region of GBP, with glucose binding resulting in an excitation-ratiometric fluorescence response.545 In another design named green glucose indicating fluorescent protein (Green Glifon), bacterial d-galactose-binding periplasmic protein (MglB) was inserted into the yellow-emitting FP Citrine. Green Glifon showed a large increase in fluorescence intensity in response to increased intracellular glucose concentrations upon feeding with extracellular glucose.546 A red-shifted probe, Red Glifon, was also generated using mApple to facilitate coimaging of glucose with other metabolites.547
These glucose-binding periplasmic proteins have also been used to generate the iGlucoSnFR series of sensors, resulting in tools that have expanded the capabilities of glucose sensing. Combining the Thermus thermophilus GBP with a cpT-Sapphire, Diaz-Garcia, and co-workers created the glucose sensor iGlucoSnFR-TS (originally presented as SweetieTS). Glucose binding to this sensor modulates not only the fluorescence intensity of the cpT-Sapphire reporting unit, but also its fluorescence lifetime. Researchers in the Looger and Yellen laboratories used this property to calibrate the fluorescence lifetime of iGlucoSnFR-TS to absolute glucose concentrations, and then report on glucose concentrations in mouse hippocampal brain slices and in vivo in awake mice.548 Keller and co-workers subsequently adapted this scaffold into an intensiometric sensor, utilizing cpGFP rather than cpT-Sapphire.549 This sensor, simply termed iGlucoSnFR, was modified to create a series of sensors with varying affinities for glucose and then applied to several model systems, including cultured rat hippocampal neurons, Drosophila brain explants, and in vivo in zebrafish larvae, expanding the biological scale at which glucose imaging is possible.
The naturally existing binding proteins for various cellular analytes are a treasure trove for developing different fluorescent biosensors. For example, using the FLIP design for sugars, reporters for many other biomolecules have been made, such as citrate,512 histamine,550 and glutamine.551 Single-FP reporters for metabolites are superior in their ability to facilitate multiplexed imaging to understand the complex interplay between different metabolic changes. The linker sequences joining the FP and the sensing domain are among the most important factors that affect biosensor performance. With the development of new techniques to construct sensor candidate libraries552 and new methods to screen biosensor candidates, such as sort-seq, which was recently used to successfully demonstrate the rapid construction of single-FP biosensors for maltose and pyruvate,553 the pace of biosensor development is expected to accelerate to further our understanding of the intracellular environment.
7. Neurotransmitters and Neuromodulators
Signaling in the brain is a complex process regulated by numerous messengers, including the aforementioned membrane voltage (section 4.5) and ions (section 5). Additionally, more complex molecules are secreted by synaptic vesicles and taken up by postsynaptic terminals. These molecules, termed neurotransmitters (for those that directly affect ion channel function) or neuromodulators (for those that work through slower G-protein based mechanisms and modulate the actions of neurotransmitters), include molecules like acetycholine, serotonin, dopamine, and oxytocin. These chemical messengers are critical for neurotransmission, but their influence on neuronal health, disease, and signaling are intricately intertwined with each other and with other signals. Dysregulation of these molecules can be disastrous, resulting in neurodegeneration or other diseases. For a complete picture of communication in the brain, we need tools to visualize all of these multiple avenues of neurotransmission: ions, voltage, and neurotransmitters.
Early attempts at developing optical methods to monitor neurotransmitters included the cell-based CNiFERs, which are covered later on in the text (see section 13, “Multistep Reporting Systems”). However, these systems are complex and exhibit poor temporal resolution. Direct coupling of FPs to a fast-responding sensing unit has thus been actively pursued to enable robust reporting on neurotransmitter and neuromodulator dynamics. Over time, two primary scaffolds for neurotransmitter sensing have emerged: GPCR-based scaffolds, which use engineered versions of native, neurotransmitter-binding GPCRs, and bacterially derived periplasmic binding proteins (PBPs).
7.1. GPCR-Based Biosensors
Many endogenous mammalian neurotransmitters receptors are GPCRs, which contain seven transmembrane helices, three extracellular loops, three intracellular loops, an N-terminus containing the ligand-binding site, and a C-terminus that couples to intracellular proteins to affect downstream signals. In creating GPCR-based biosensors, the third intracellular loop (IL3) is of the most interest, as this region undergoes a large conformational change upon ligand binding (Figure 9a). GPCR-based sensors use modified versions of the native receptors that detect and respond to neurotransmitter release. Within this scaffold, there are two primary sensor classes: the dLight series and the GRAB series. The progenitors of both biosensor families were developed and characterized to report dopamine transmission and were later expanded to several other neurotransmitters that bind natively to GPCRs.
Figure 9.

Neurotransmitter sensors. (a) GPCR-based sensors respond to neurotransmitter binding, resulting in a conformational change in the receptor that is transmitted to the coupled cpFP, giving a change in fluorescence intensity. (b) Periplasmic-binding protein (PBP)-based sensors consist of the PBP coupled to a cpFP and tethered to a transmembrane helix, which presents the sensor on the extracellular face of the plasma membrane. Neurotransmitter binding to the PBP results in a change in cpFP fluorescence. (c) Neurotransmitter sensors localize to the neuronal plasma membrane and enable imaging of neurotransmitter detection at a single synapse in response to a single action potential.
The dLight series replaces the third intracellular loop of a dopamine receptor GPCR with cpGFP. Sites in the intracellular loop were screened and specifically chosen to generate a positive response to dopamine binding.554 The scaffold typified by the original dLight sensor has proven to be highly versatile, and since 2018 has been extended to numerous other neurotransmitters, including serotonin, melatonin, two opioid receptor types, and adrenergic receptors (β1AR, β2AR, and α2AR) (reviewed in ref (555)). The sensor has also been successfully red-shifted by using cpmApple in place of cpGFP, enabling improved in vivo imaging. Recent work has further expanded the dLight GPCR sensor scaffold to develop a biosensor for the orexin neuropeptides. Using the orexin receptors OX1R and OX2R, Duffet and co-workers placed cpGFP in the analogous position as in dLight on these new receptor scaffolds, allowing detection of these neuropeptides, which are implicated in narcolepsy.556
The GPCR-activation-based (GRAB) sensor class uses a similar approach to the dLight series, namely, modifying IL3 of the GPCR of interest with an FP to achieve a fluorescence change upon ligand binding. The core difference in this system as compared to the dLight scaffold is that instead of replacing the entire intracellular loop, the GRAB scaffold inserts cpGFP into the loop, maintaining portions of it, and incorporating different linkers compared to dLight. Like dLight, the original GRAB sensor, GRABDA, detects dopamine.557 The GRAB scaffold has also been extended to numerous other neurotransmitters, including acetylcholine (initially developed as GACh, before optimization and renaming as GRABAch) and serotonin.558−560 Red-shifting of these sensors has also been accomplished and demonstrated using cpmApple as the reporting unit.561 Recently, this class of sensors has been expanded to targets that have previously been difficult to monitor, namely the neuromodulator oxytocin and endocannabinoids.562,563 The versatility of this sensor design has been further proven with even more recently developed sensors for such targets as somatostatin, neuropeptide Y, and neurotensin, among others.564
The utility of these sensors has been expanded beyond their original application of reporting endogenous activity. Recently, GPCR-based neuromodulator sensors have been applied to facilitate the screening of a library of psychedelic drugs to identify putative new neuromodulators, in “psychedelic-inspired drug discovery.” This type of screening may enable the discovery of new targets for known drugs, as well as the discovery of new drugs based on known psychedelic scaffolds.565 This screening application demonstrates one of the utilities of this kind of flexible biosensor scaffold.
7.2. Periplasmic Binding Protein-Based Biosensors
Sensors based on bacterial PBPs offer an orthogonal strategy to GPCR-based systems and are particularly applicable to neurotransmitters for which the endogenous receptors are not GPCRs. Notably, glutamate and gamma-amino butyric acid (GABA) are critical neurotransmitters that primarily bind to ionotropic receptors, and thus have been intractable to GPCR-based biosensors.
7.2.1. Glutamate Biosensors
The initial demonstration of the PBP scaffold for neurotransmitter sensing used the E. coli-derived ybeJ, also known as GltI, a PBP that can bind glutamate and subsequently undergo a hinge-like conformational change. This protein was paired with a CFP-YFP FRET pair, in which the conformational change of the PBP would alter FRET efficiency upon glutamate binding. This scaffold was initially demonstrated with GluSnFR, and shortly followed with FLIPE.566,567 Both scaffolds were further optimized, including by circularly permuting the PBP in the FLIP series and optimizing linker sequences and glutamate binding affinities, resulting in SuperGluSnFR.568,569
In 2013, Marvin and co-workers modified the SuperGluSnFR PBP scaffold to produce a single-FP, intensiometric glutamate reporter rather than a FRET-based sensor. To do this, cpGFP was inserted into the interdomain hinge region of GltI (Figure 9b), followed by linker optimization via high-throughput screening. This resulted in a fast and sensitive single-color biosensor that reports on glutamate release in a manner that correlates with voltage responses and is amenable to multiplexing.570 This sensor, termed iGluSnFR, has formed the basis for the majority of glutamate sensor development in the past decade. This single-color scaffold has been optimized for improved kinetics, using sfGFP, to create SF-GluSnFR, along with blue, turquoise, and yellow spectral variants.571 Most recently, iGluSnFR3 was reported in 2023, with greatly improved kinetics and superior localization. Validated by simultaneous electrophysiology and glutamate imaging at a single synaptic bouton, iGluSnFR3 can reliably report glutamate release triggered by single action potentials with high fidelity (Figure 9c).572
7.2.2. Other PBP-Based Biosensors
With the success of PBP-based scaffolds for imaging the previously intractable glutamate, a suitable binding protein was sought for GABA, the difficult to sense downstream inhibitory neurotransmitter of glutamate. A novel PBP derived from Pseudomonas fluorescens was identified and cpsfGFP inserted into the hinge region, using the same design scheme as iGluSnFR, to produce the single-color iGABASnFR. iGABASnFR has been demonstrated in vivo in zebrafish, and for tracking mitochondrial GABA.573 While iGABASnFR currently remains the only protein-based GABA sensor, the PBP-based scaffold could be improved to reduce off-target binding and modified to offer an expanded color palette like the previous glutamate sensors. Additionally, the PBP-based sensor scaffold holds promise for providing orthogonal sensing modalities for other neurotransmitters. This potential has so far been demonstrated with a PBP-based serotonin sensor, iSeroSnFR, but could in the future be expanded to other ligands.574
8. Biosensors of GPCR-Mediated Signaling
GPCRs are a massive and diverse group of cell-surface receptors involved in a wide variety of cellular processes in many cell types. These receptors are common drug targets, making up nearly a third of the drug market, and so understanding of their function and activation is crucial but is complicated by the numerous receptor types and varied downstream effectors. GPCR signaling occurs through multiple stages, beginning with ligand binding or another activating signal that leads to a conformational change in the receptor. Heterotrimeric G-proteins, consisting of Gα, Gβ, and Gγ subunits, bound to the receptor then change in response to receptor activation. The Gα subunit, which can come in several types including Gαs, Gαi, Gαq, and Gα12, binds GTP and becomes active in response to GPCR activation, while the Gβ/γ dimer dissociates from Gα, leading to downstream signaling. Some GPCRs undergo additional changes during signaling. Some receptors oligomerize, and still others bind to beta-arrestins and undergo subsequent internalization. In biosensors of GPCR activity, there are a few common strategies, divided by what aspect of GPCR signaling is being directly reported: conformational change and ligand binding (Figure 10a), G-protein recruitment (Figure 10b), or β-arrestin recruitment (Figure 10c).
Figure 10.

Biosensors for monitoring various stages of GPCR-mediated signaling. (a) Receptor activation: Analyte binding to a GPCR causes a conformational change that results in decreased FRET between donor and acceptor FPs tethered to the GPCR. (b) G-Protein recruitment: An FP-tagged G-protein complex is recruited to activated, FP-tagged receptor. Increased proximity between the GPCR and the recruited G-protein leads to increased FRET. (c) β-arrestin recruitment: Luciferase-tagged β-arrestin produces bioluminescence in the presence of substrate. Upon recruitment of β-arrestin to an activated GPCR, the luminescence signal is quenched due to the occurrence of BRET between the luciferase and a membrane-targeted acceptor FP, leading to increased fluorescence. The increased BRET signal can persist upon GPCR internalization and trafficking to endosomes.
8.1. Reporters of Conformational Change and Ligand Binding
Reporters of GPCR activation that rely on conformational changes within the receptor as the molecular switch are generated by incorporating FPs at the site(s) of the greatest conformational change. This is generally between transmembrane domains (TMs) 5 and 6, which are linked by IL3. In FRET-based sensors, one FP will often be fused to the receptor C-terminal tail and a second inserted within or even entirely replacing IL3 (Figure 10a). Alternatively, in a single-FP sensor, a cpFP can be inserted into or replace IL3. Similarly, GPCR-based sensors that report ligand binding are often more directly reporting the conformational change that occurs upon ligand binding. This is the design rationale behind the GPCR-based neurotransmitter biosensors, which are covered in section 7.1. In this section, we will thus focus more on those GPCR sensors intended to report directly on conformational changes, with the goal of sensing GPCR activity rather than ligand dynamics.
One of the most common targets of conformational change-based GPCR sensors are adrenergic receptors. Early examples of FP-based sensors for ligand-induced conformational change are a FRET-based probe for αA2AR activity, along with a second sensor for monitoring parathyroid hormone receptor (PTHR) activation developed in the same study. These sensors incorporated CFP inserted into IL3 and YFP appended at the C-terminus. The development of these sensors revealed that receptor activation occurs on a much faster time scale than had been previously assumed, in addition to identifying the conformational changes associated with agonists, partial agonists, and antagonists of these receptors.575
Another frequently used platform for developing FRET-based reporters of GPCR conformational change is the systematic protein affinity strength modulation (SPASM) scaffold. In this system, a C-terminal peptide fragment from a Gα subunit of interest is fused to an FP (FRET donor), with a second FP (FRET acceptor) fused to the receptor C-terminal tail. The Gα peptide-FP fusion is tethered to the GPCR-FP chimera by a flexible linker, such that when the GPCR undergoes a conformational change, the Gα peptide inserts into a groove between the transmembrane domains, bringing the FP pair into proximity and resulting in a FRET ratio increase. This strategy was initially demonstrated with the β2AR, along with α2 and α1ARs, as well as being expanded to opsin-Gα.576 While the SPASM strategy has been modified in some ways, it remains in use, including in a recent investigation of muscarinic receptors. This reporter of muscarinic receptor conformational change, developed by Kim and co-workers in 2023, reveals a two-step conformational change during muscarinic receptor activation, which first involves association of the Gq heterotrimer, followed by dissociation of the Gα and Gβ/γ subunits.577
Another approach uses nanobodies as the sensing unit to probe GPCR conformations. Nanobodies, which are derived from the variable regions of single-chain antibodies found in camelid species, have been identified and engineered to bind with great specificity to specific conformations of specific receptors. These, along with other sensors of conformational change, have been reviewed capably elsewhere, but highlighted here are some foundational studies alongside a few recent and exciting examples.578,579 An early example of nanobody-based biosensors for GPCR conformation leveraged the fact that nanobodies, due to their selectivity and affinity for particular conformations, can enable visualization of an activated receptor even when its cellular concentration is low. Irannejad and co-workers utilized an FP-tagged nanobody to reveal that GPCR signaling occurs not only at the plasma membrane but also intracellularly from endosomes.580 The nanobodies Nb6 and Nb39 were developed for use as BRET-based biosensors for κ-opioid receptor (KOR) activity, with KOR-fused to Rluc and the nanobodies fused to mVenus. These two nanobodies, of which Nb6 is associated with the inactive receptor conformation and Nb39 with the active conformation, were able to report on the real-time dynamics of KOR activation upon stimulation, in two different directions, alongside their utility in stabilizing those states for crystallographic studies.581 This demonstration is promising for continued work with nanobodies as sensing or binding units in future biosensor platforms.
8.2. Reporters of Heterotrimeric G Protein Recruitment
Heterotrimeric G proteins, also known as large G proteins, are recruited to activated GPCRs after ligand binding. These G proteins activate further downstream signaling as they lead to the production of numerous second messengers upon subunit dissociation and GTP loading. Understanding G protein recruitment and the resulting pathways is crucial for achieving a full picture of GPCR-mediated signaling.
The earliest examples of biosensors for heterotrimeric G protein recruitment feature FRET-based designs. The first of these was initially demonstrated in Dictyostelium slime mold, an important model organism for studying GPCR signaling, especially in the early days of the field. This initial demonstration of a G-protein recruitment sensor began to further illuminate the steps in the G-protein signaling pathway and presciently predicted that a similar scaffold could be applied to mammalian cells.582 This was accomplished by Hein and co-workers in a system that tagged the C-terminal tail of the relevant GPCR and the heterotrimeric G protein with two FPs to form a FRET pair (Figure 10b). Examining the ratio change between the two FPs indicated G-protein recruitment. This enabled the authors to examine the kinetics of G protein interaction and revealed that G proteins did not appreciably associate with GPCRs prior to activation.583
More modern sensors of G-protein recruitment to GPCRs have turned to BRET-based assays, for their lower background and higher SNR. The TRUPATH system, reported by Olsen and co-workers in 2020, is unusual in that rather than reporting on the association of individual G protein subunits with particular GPCRs, it reports on G protein heterotrimer formation or dissociation. This is accomplished using an RLuc8-tagged Gα subunit, alongside GFP-tagged Gβ/γ. This system has been optimized with BRET pairs for 14 different human G proteins, a major contribution to the field.584 Another recent BRET-based system is the G CASE group of sensors (G protein-based, tricistronic activity sensors), in which all components of the system, including Gβ, cpVenus-tagged Gγ, and NLuc-tagged Gα, are encoded on a single plasmid to ensure uniform transfection and expression. This approach allows for more effective imaging of constitutive GPCR signaling.585 However, all the sensors in this class are limited by the need to overexpress all of the relevant G proteins, which can affect endogenous signaling.
8.3. Gα Subunit Reporters
To overcome the difficulties associated with overexpression of the entire G-protein complex, individual subunits or pairs of subunits can be tagged and overexpressed to report on G-protein complex formation or dissociation. This tagging most commonly occurs on the Gα subunit.
An early example of this strategy comes from work by Gibson and Gilman, who tagged Gαi and Gβ subunits with a CFP-YFP FRET pair. Changes in FRET were observed upon G protein complex dissociation, reporting the activation of the relevant GPCR, and its affinity for particular isoforms of Gβ subunits involved in α2AR signaling.586 A more modern, BRET-based strategy for Gα-based GPCR activity reporting is the BRET biosensor with ER/K linker and YFP (BERKY) system of reporters. The BERKY system is a series of unimolecular reporters with a common design, distinguished by the inclusion of the bistable ER/K linker and their ability to report endogenous G-protein activity. The reporters are built with a membrane anchor fused to a luciferase as the BRET donor, joined to the YFP acceptor via the ER/K linker. The YFP acceptor is fused in turn to a reporter module that binds to Gα proteins in the active conformation. The ER/K linker is an α-helical peptide that exists in an equilibrium between a “bent” and an “open” conformation. The “bent” conformation is stabilized when the reporter binds to active G-proteins, resulting in increased BRET between the donor and acceptor.587
A more minimal version of this strategy is the so-called Mini-G system, which uses an engineered Gα subunit containing only the portion necessary for coupling to the GPCR. This provides a measure of GPCR activation without involving the entire heterotrimeric G protein system and potentially perturbing downstream signaling. These Mini-G proteins are coupled to either an FP or luciferase, and GPCR activation is read out by monitoring the BRET signal. Mini-G variants have been developed for the several families of Gα subunit and have allowed interrogation of different GPCR subtypes.588
8.4. Beta-Arrestin Recruitment Reporters
Arrestin recruitment is a crucial part of GPCR signaling, as GPCRs are phosphorylated in response to persistent signals, enabling arrestin recruitment and binding. Upon binding, GPCRs can be internalized, and arrestin signaling pathways initiated, with plasma membrane-GPCR signaling ceasing from that particular receptor. Understanding the dynamics of this recruitment pathway, as well as the ability to pair it with monitoring of other GPCR signaling measurements, enables better understanding of this crucial signaling modality.
Sensors for β-arrestin recruitment include FRET-based designs using FP-labeled arrestin and GPCR, as used by Vilardaga and co-workers to examine the time delay between PTH1R activation and beta-arrestin recruitment.589 BRET has also been utilized to assess arrestin recruitment. One particular example leverages the natural BRET pair of Rluc and rGFP for enhanced bystander BRET (ebBRET) (Figure 10c). This ebBRET assay was used to more efficiently generate a BRET signal upon protein association between beta-arrestin and two GPCRs, AT1R, and β2AR.590 This strategy was later applied to examine arrestin recruitment dynamics at early endosomes.591
An alternative strategy for reducing background and revealing GPCR/arrestin dynamics is to use a fragment complementation-based assay. The Trio assay is a fluorogenic assay for β-arrestin recruitment to GPCRs that utilizes a tripartite split-GFP system (as discussed in section 2.3.1). This tripartite split FP consists of GFP strands 1–9 freely diffuse in the cell, strand 11 fused to the C-terminus of the GPCR of interest, and strand 10 fused to the N-terminus of β-arrestin. This assay exhibits very low background, even lower than traditional BiFC assays, because strands 1–9 will not reconstitute with either strand 11 or 10 alone but only with both strands when they are within sufficient proximity, that is, when beta-arrestin is recruited to the GPCR.592 Another alternative strategy for measuring arrestin recruitment uses only a single FP, in which the entirety of β-arrestin is inserted into the seventh strand of mNeonGreen, such that β-arrestin recruitment alters mNeonGreen fluorescence intensity.593 The high temporal resolution of this bright and responsive biosensor enables quantitative kinetic analysis of different agonist efficacies.
9. Proteases
Proteases are enzymes that cleave peptide bonds and lead to the breakdown of proteins within the cell, and are thus critical for numerous biological processes, including cell death, cancer proliferation, and viral infectivity. For this reason, the ability to monitor protease activity in real-time is important for understanding these processes. To better understand how protease function ties into broader biological pathways in health and disease, several biosensors of protease activity have been developed over the years using numerous strategies. Many of the earliest and most numerous sensors were designed to detect caspase activity as a method to investigate the processes associated with that family of proteases, namely, autophagy, apoptosis, and other cell death mechanisms. However, the biological targets in the field of protease biosensing have expanded in recent years, with a particular focus on viral function and infectivity, especially in the wake of the COVID-19 pandemic, as protease function is crucial for SARS-CoV2 function.
SARS-CoV2, the virus responsible for COVID-19, relies on its protease MPro, also known as 3CLPro, for its life cycle and host immune evasion. Thus, it is a highly sought-after target of potential antiviral drugs to deal with future COVID outbreaks. Assays of MPro activity are crucial both for understanding viral protease function and in drug discovery efforts to identify relevant protease inhibitors. Much of the last several years of work on protease biosensor development and improvement has been driven by the need to have a greater understanding of these viral proteases, and so it would be remiss not to include a small selection of that work here.
9.1. RET-Based Protease Sensors
Many of the earliest protease biosensors, like many other classes of biosensor, were FRET-based probes. One of the earliest examples comes from Roger Tsien’s lab and began as a proof-of-concept for FRET between FPs. Energy transfer was demonstrated through the trypsin- and enterokinase-mediated cleavage of a linker between GFP and BFP, resulting in the sensor transitioning from a high-FRET to a low-FRET state after protease cleavage (Figure 11a).594 This demonstration laid the groundwork for a general scaffold to monitor protease activity in living cells. The conceptual framework of this original sensor was adapted into Atg4 sensors, to determine if there was a clear role for Atg4 in autophagy. Different cyan-yellow FRET sensors were developed with two different cleavage systems that work as different substrates for different isoforms of Atg4. While these sensors did not demonstrate an increase in activity for either isoform during autophagy, they do set a promising precedent for the use of FRET-based protease activity sensors in high-throughput screening assays, as they were assessed to have favorable Z-scores.595 While FRET-based probes for protease activity have not been developed much further, their potential for screening should be considered in future applications.
Figure 11.

Protease biosensor designs. (a) Two FRET-compatible FPs are connected by a linker that contains a protease recognition and cleavage sequence. When the protease cleaves the recognition sequence, the distance bewtween the FPs increases, leading to decreased FRET. (b) A similar design incorporates the two components of a ddFP pair, whereupon protease-medated cleavage leads to a decrease in fluorescence intensity. (c) A split-FP is physically constrained from undergoing reconstitution by the insertion of linkers containing a protease cleavage sequence. In the presence of protease activity, the linker is cleaved, alowing the split-FP to reconstitute, shown in more detail in (d). (d) Flip-GFP involves β-strands 11 and 10 of cpGFP tethered to one another by a linker sequence as well as E5 and K5 peptides. This keeps the two strands locked in a parallel conformation, rather than their natural antiparallel state. The linker contains a protease cleavage sequence which, in the presence of an active protease, enables a return to the antiparallel conformation and GFP reconstitution and fluorescence. In the absence of protease, no reconstitution occurs.
The general scaffold for FRET-based protease sensors has also been extended to BRET-based sensors, replacing one of the FPs with a luciferase, to take advantage of lower background and greater SNR of BRET. This strategy has been demonstrated by Li and co-workers using a sensor incorporating hGluc and tdTomato as a BRET pair to report on enterokinase activity with good tolerance for pH variability and buffer composition.596 This BRET-based scaffold has been enhanced with the use of the GFP-Rluc pair and applied recently to investigations of bacterial metalloproteinases in milk for food safety investigations, and to examine the activity of the 3CLPro protease, which is crucial to SARS-CoV2 infectivity.597,598 NanoLuc and mNeonGreen have also been paired in a BRET-based assay to screen for drugs that inhibit MPro activity in a model of SARS-CoV2 infectivity. This sensor has been demonstrated to recapitulate the effectiveness of a known MPro inhibitor, and the results with this assay suggest that molecular crowding may also affect the rate of MPro activity.599
9.2. ddFP-Based Protease Sensors
ddFPs are fluorogenic protein pairs in which a modified FP becomes fluorescent only when in proximity with a nonfluorescent “partner” (discussed in section 3.1). This property has been leveraged to detect protease activity, as upon cleavage of a linker, a ddFP could diffuse away from its partner protein and lead to a substantial fluorescence change (Figure 11b). Ding and co-workers reported that green and red ddFPs could associate with the same partner protein to induce fluorescence, and this flexibility enabled the development of fluorescent protein exchange, FPX. In the FPX strategy for examining caspase activity, a green ddFP and partner protein were tethered by a cleavable DEVD sequence. Upon induction of caspase activity, the linker becomes cleaved, allowing the partner protein to diffuse away from the green ddFP and competitively associate with the red ddFP. This system also enabled the development of a protease-dependent translocation assay. However, FPX is limited to qualitative assessments of caspase activity and association, due to differential affinities for the dimerization partner protein with red and green ddFPs.600 Using only a single type of ddFP removes the difficulty in quantification, and thus ddFPs have been used to quantitatively assess protease activity, as in the ddRFP-based system reported by Mitchell and co-workers to track matriptase activity in a variety of human cancer cell lines.601 Yan and co-workers have also leveraged ddRFPs to produce a low-cost fluorescence assay to screen for MPro activity.602
9.3. Single-FP Protease Sensors: Split FPs and Intein-Based Sensors
Single-color protease reporters follow a different design strategy compared to many other single-color biosensors, since they must report activity, and the activity of a protease necessitates splitting something apart. To this end, a number of fluorogenic strategies have been developed for protease sensing, many based on a split-GFP scaffold (Figure 11c). This basic scaffold involves splitting GFP and tethering the missing strand in such a way that protease activity is required to release the tethered β-strand to enable GFP reconstitution.
An early example of this strategy is a split-GFP and split-intein caspase reporter developed by Sakamoto and co-workers. In this design, a fragment of a split-GFP is included in a split-intein, along with a DEVD caspase cleavage substrate sequence. After translation, the split-intein will be spliced to produce a cyclized GFP fragment, held in the cyclized conformation by the DEVD sequence. When caspase activity occurs in apoptotic cells, the DEVD substrate sequence is cleaved, allowing the GFP fragment to uncyclize, enabling reconstitution of the split-GFP and producing fluorescence.603 This and other early split-GFP based reporters showed low fluorogenicity in vivo in systems such as zebrafish. To remedy this deficiency, To and co-workers developed a novel strategy for a fluorogenic split-GFP, which they termed ZipGFP. In this design, the 11th strand is separated from GFP1-10 by two coiled-coil motifs connected by a TEV protease substrate sequence. In response to TEV (or later, other protease) activity, the substrate sequence is cleaved and the 11th strand “unzipped”, enabling FP reconstitution and fluorescence.604 Further improvements to this scaffold were made with a successor sensor from the same lab, termed FlipGFP. The crucial design improvement relative to the previous ZipGFP was repositioning the split 11th strand from an antiparallel to a parallel orientation, which was still locked in place by the heterodimerizing coiled coils. Switching to a parallel orientation prevents any fluorescence in the uncleaved form, lowering background and increasing fluorescence turn-on. Once protease activity occurs, the parallel 11th strand gains the conformational flexibility to “flip” back around to an antiparallel configuration and reconstitute the GFP (Figure 11d). In an initial demonstration using TEV protease, this method achieved a 77-fold fluorescence increase upon protease treatment.605
FlipGFP in particular has found numerous applications for examining SARS-CoV2 protease activity since its publication. Froggatt and co-workers used the scaffold to design a protease assay for MPro that would be amenable to future high-throughput screens. With this assay, they determined that inhibition of protease activity as reported correlated with lowered infectivity in their model, supporting MPro as a therapeutic target.606 FlipGFP has also been used to develop an assay for screening known and putative antiviral drugs against MPro to identify possible therapies for SARS-CoV2.607
While most single-FP protease sensors are based on a split-GFP strategy, To et al. utilized rational design of a bacterial phytochrome infrared FP to generate a fluorogenic protease sensor platform, termed iProtease.608 This strategy involved circular permutation of an infrared FP and insertion of a protease cleavage sequence as a spacer between the biliverdin-binding site and a cysteine critical for the incorporation of biliverdin to the FP. In the presence of the relevant protease, the spacer sequence is cleaved, resulting in infrared fluorescence. While the sensor itself is a single FP, a split GFP is used to ensure the cleaved cp-iFP remains together, as well as to provide a transfection control and green fluorescence signal for normalization of infrared fluorescence turn-on. This iProtease strategy was demonstrated with TEV protease (iTEV) and caspase (iCasper) and has since been adapted to report granzyme B activity. Kula and co-workers utilized granzyme B activity as a readout of T-cell activation, and thus the iProtease scaffold was adapted to generate IFPGZB and the TScan method to screen for T-cell epitopes.609 This has recently been further expanded to develop TScan-II, an improved and expanded version of the platform to facilitate de novo antigen discovery.610
10. Protein Kinases
Since the discovery of reversible phosphorylation in cells, protein kinases, as the enzymes responsible for catalyzing the phosphoryl-transferase reaction, have been among the most important regulatory proteins studied by researchers. The human kinome includes over 500 kinases that are grouped into more than 8 families and 13 atypical families based on sequence homology within their catalytic domains.611 Protein kinases are crucial components in cellular signal transduction pathways, in which phosphorylation of various substrates alters protein function and regulates cell behavior, dysregulation of which is involved in a variety of pathophysiological conditions, including cancer, diabetes, and cardiac diseases.612 Understanding the dynamics of protein phosphorylation by protein kinases is thus crucial for developing therapeutic approaches targeting these key signaling nodes.613 Western blot or immunofluorescence assays are often used to study kinase activity, but neither method is able to capture the full biological context of dynamic kinase signaling, as they lack the high spatiotemporal resolution that can be achieved by live-cell imaging approaches. Genetically encoded kinase activity biosensors overcome the limitations of traditional biochemical methods and are capable of monitoring kinase activity or activation in the native cellular environment, making them favorable tools to dissect kinase signaling pathways.
Depending on the components of the sensing unit, kinase biosensors can be defined as kinase activity reporters (KARs) or activation biosensors. KARs act as surrogate substrates, employing a specific substrate sequence that can be phosphorylated by the endogenous kinase of interest (Figure 12a). The substrate is typically linked to a phosphoamino-acid binding domain (PAABD), with the introduction of a negatively charged phosphate group inducing binding between the substrate and PAABD, resulting in a conformational change that reflects kinase activity. Kinases also often possess critical regulatory sites susceptible to post-translational modifications, which often modulate kinase activity by directly altering the conformation of the kinase itself. Kinase biosensors that incorporate the full-length or part of the kinase utilize this conformational change to reflect the activation process or state of the kinase, and thus are defined as “activation sensors” (Figure 12b). Different readouts can then be used to quantify the sensor response, such as FP translocation, FRET, or spectral changes in a single FP, depending on the configuration of the reporting unit. Such varied strategies have enabled the development of biosensors for much of the mammalian kinome, although further advancements are still necessary (Figure 12c).
Figure 12.

Illuminating the kinome using genetically encoded fluorescent biosensors. (a) Kinase activity reporters incorporate a substrate sequence for the kinase of interest to report endogenous kinase activity. Different design strategies for kinase activity reporters are shown. (b) Kinase activation sensors typically utilize native conformational changes with a full-length kinase of interest and report the activation dynamics of the kinase itself, which is overexpressed as part of the sensor. (c) An overview of currently available kinase biosensors (marked by pentagons) across the kinome tree (generated by KinMap, illustration reproduced courtesy of Cell Signaling Technology, Inc. (www.cellsignal.com)).611 Different design strategies are color-coded, and selected kinases are used as examples to show the available designs for kinase sensors.
Some popular kinases, such as PKA, PKC, and Erk, have been used to demonstrate various designs, but other important kinases lack such variety. Thus, the choice of reporter limits the ability to investigate the spatiotemporal dynamics of these kinases. Although kinase reporters exist for members of nearly all major subfamilies, there are still large portions of the kinome that remain untouched by genetically encoded fluorescent reporters. Future efforts can be targeted specifically to these areas to discover new kinase biology.
10.1. AGC-Family Kinases
AGC family kinases are serine/threonine kinases that were originally defined based on the sequence similarity of the catalytic domains of PKA, PKG, and PKC. The AGC subfamily controls critical biological processes, such as cell growth, differentiation, and cell survival, and is subject to tight spatial and temporal regulation.614 Numerous biosensors have been developed to investigate the spatiotemporal regulation of members of the AGC subfamily.
KARs were first developed to visualize cellular PKA activity.615 PKA is an important protein kinase and also a signaling hub regulating many fundamental cellular processes. cAMP binds PKA R, causing it to release active PKA C.616 Spatiotemporal regulation is critical to PKA signaling. Microdomains assembled by A-kinase anchoring proteins (AKAPs) and phase-separated RIα condensates (see section 6.1.1.3) have both been reported to underlie PKA regulation.415,617 To investigate the exquisite spatiotemporal regulation of PKA signaling in its native biochemical environment, numerous genetically encoded PKA reporters have been generated and applied in various biological systems.
Inspired by the design of Cameleon (see section 5.1.1), the very first PKA activity sensor, or A-kinase activity reporter (AKAR), was engineered as a four-part chimeric protein consisting of a FRET donor (ECFP), a 14–3–3τ domain, a PKA consensus phosphorylation sequence and a FRET acceptor (Citrine). In this design, phosphorylation of the substrate by PKA triggers binding to 14–3–3τ, inducing a conformational change that alters FRET between ECFP and Citrine. Different PKA substrate sequences, based on the in vitro “kemptide” substrate, were tested, and the best performer was designated AKAR1. Diffusible AKAR1 showed a maximum yellow/cyan emission ratio change of 40% in response to cellular cAMP elevation, and subcellularly targeting AKAR1 to different compartments or microdomains revealed distinct kinetics, implying an important role for spatial compartmentation in PKA signaling.615 This initial design served as the prototype for developing additional KARs, including for other AGC family kinases such as PKC469 and Akt.618,619 Both FRET-based PKC and Akt activity reporters (CKAR and AktAR) have been generated to study the spatiotemporal regulation of these signaling enzymes. Based on this first generation of sensors, many optimizations have been performed to improve KAR performance for various experimental purposes. For example, replacing the 14–3–3τ domain of AKAR1 with a forkhead-associated 1 (FHA1) domain, which recognizes phophorylated peptides with relatively weaker affinity, yielded a second-generation AKAR (AKAR2) whose response could be effectively reversed by cellular phosphatases, enabling faithful reporting of dynamic PKA activity.620 Taking advantage of enhanced CFP and YFP variants as the FRET donor and acceptor, as well as replacing the original FHA2 domain with FHA1, together with a modified PKC substrate, CKAR2 shows a four-times larger dynamic range than the original CKAR.621 Optimizing the PAABD and substrate choice, as well as the linkers tethering these components has also produced increasingly improved AktARs222,622,623 that have helped illuminate differences in the kinetics and magnitude of Akt activity between raft and nonraft plasma membrane regions in a cell-type-dependent manner, implying the fine-tuning of Akt activity with nanometer-scale spatial precision.623
Additionally, when selecting the FRET pair in kinase reporters, more red-shifted FPs are preferable, as on the one hand, blue light can cause greater phototoxicity to the cell and red light enables less scattering and deeper penetration, which is favorable for applying sensors in vivo; on the other hand, red-shifted reporters will allow more spectral space for multiplexed imaging or blue light-enabled optogenetic tools. For example, such a red-shifted AKAR was developed utilizing the NIR-FPs miRFP670 and miRFP720 as the FRET donor and acceptor, respectively, making it suitable for multiplexed imaging.624 Along with the development of red-shifted FPs, 2P microscopy is increasingly being applied as an alternative approach to achieve deeper tissue penetration for in vivo biosensor imaging.625 This technique leverages the process of multiphoton absorption, where fluorescence is excited by the absorption of two (or more) long-wavelength photons that reach the fluorophore almost simultaneously (i.e., within <1 fs). However, the broad 2P absorption and poorly understood 2P photobleaching behavior of most FPs makes it challenging to implement 2P microscopy for ratiometric FRET measurements.626 Instead, sensor responses are typically visualized by FLIM-FRET imaging (see section 2.2.2.2), which is largely insensitive to probe intensity and where only donor fluorescence needs to be measured. However, the FP choice for the FRET pair should be tested specifically in order to maximize compatibility with 2pFLIM. In particular, several properties of the donor fluorophore need to be taken into account, including the 2P cross-section, which determines the efficiency of 2P absorption for a given fluorophore, as well as both the donor lifetime length and decay kinetics, as a long donor lifetime with a monoexponential fluorescence decay is the most desirable for FLIM. Following these principles, 2pFLIM-compatible AKARs have been developed and used to image PKA activity in response to neuromodulatory inputs and during synaptic plasticity in acute brain slices627 as well as to visualize in vivo neuromodulatory PKA activity in the brains of awake mice.628 More recently, PKA activity was imaged at cellular resolution in the striatum of behaving mice for the first time, revealing that two important neuromodulators, dopamine and adenosine, play opposing roles and form a “push–pull” system that acts through PKA to balance the direct and indirect striatal pathway to control “go and no-go” locomotor decisions in animals.629
A single-FP-based KAR design has also been developed that achieves extremely high dynamic range and sensitivity compared with FRET-based KARs. This design was initially applied to develop a single-FP AKAR, where cpGFP is inserted between the established PKA substrate and FHA1 domain. The resulting sensor displays reciprocal changes in fluorescence intensity at two excitation wavelengths, such that changes in the excitation ratio (e.g., excitation-ratiometric AKAR, or ExRai-AKAR) reflect changes in PKA activity.63 ExRai-AKAR showed very sensitive responses to PKA activity changes, along with a much higher dynamic range and an improved SNR compared to the FRET-based PKA reporters. Additional single-FP AKARs with different spectral profiles were also generated by swapping cpGFP for cpT-Sapphire or cpBFP, providing more options for multiplexed imaging experiments. A second-generation sensor (ExRai-AKAR2) was later obtained by optimizing the linker sequences on either side of cpGFP via high-throughput screening (see section 3.4.2), which was capable of detecting extremely subtle changes in PKA activity in the brains of awake mice.213 As with the modular design of FRET-based AKAR, the ExRai-AKAR design has been generalized to construct single-FP sensors for both PKC (ExRai-CKAR) and Akt (ExRai-AktAR).63,474 Optimization of ExRai-AktAR subsequently allowed for investigation of subcellular Akt activity on the lysosome surface, revealing an important role for lysosomally localized 3-PIs in regulating growth factor-induced localized Akt signaling.474
A major gap in the single-FP KAR toolkit is the notable lack of red-shifted sensors because intrinsic differences in many properties and characteristics of GFP and RFP pose a challenge to simply swapping cpRFPs for cpGFP. However, alternative designs can also be pursued to develop red-shifted single-color KARs. For example, an intensiometric red AKAR has previously been developed using ddRFP as the reporting unit.63 In addition, single-color KARs have been developed based on homo-FRET (see section 2.2.2.2) to supplement the multiplexed imaging toolkit. These sensors take advantage of changes in the polarization of fluorescence emission that occur during FRET to report biosensor conformational change and thus do not require the donor and acceptor to have distinct fluorescence spectra (e.g., CFP and YFP). Instead, the donor and acceptor can be the same FP, such as mCherry. Such FLuorescence Anisotropy REporters (FLAREs) have been developed for PKA (FLARE-AKAR), PKC (FLARE-CKAR), and Akt (FLARE-AktAR) and successfully used for multiplexed imaging.621 Although this design is generalizable, fluorescence polarization microscopy is needed to image FLARE sensors, limiting their broader application. Considering the uniquely superior performance of single-FP-based KARs, future efforts aimed at identifying and engineering new cpRFPs should help accelerate the development of red-shifted single-FP KARs to enhance both multiplexed and in vivo imaging of signaling pathways.
There are also PKA biosensor designs based on the special properties of certain FPs. For example, the ability of the green-emitting FP Dronpa to induce proximity-dependent fluorescence intensity fluctuations in the red-emitting FP TagRFP-T has enabled the development of fluorescence fluctuation induced by contact (FLINC)-based biosensors.52 As noted earlier in the text (see section 2.1.3), fluctuations in FP intensity are critical for super-resolution imaging techniques such as pcSOFI.630 Thus, by constructing FLINC-AKAR1, Mo et al. were able to directly examine plasma membrane PKA activity microdomains in super-resolution. Specifically, FLINC-AKAR1 imaging via pcSOFI revealed that PKA activity is strictly confined to nanometer-scale domains (∼350 nm diameter) that substantially overlapped with clusters formed by AKAPs. Direct AKAP-PKA interactions were also found to be required to form the observed PKA activity nanodomains. In migrating Chinese hamster ovary (CHO) cells, highly active PKA nanodomains were only found along the leading edge while absent in the trailing end, with filipodia exhibiting significantly higher PKA activity in nanodomains.52 Future development of AKARs utilizing recently discovered or engineered FPs might produce more interesting designs and be used in various conditions to address lingering biological questions, as recently demonstrated through the engineering of Dronpa-removed (Dr) FLINC AKAR, which introduces a mutation that abolishes Dronpa fluorescence to enableed dual-color super-resolution imaging to correlate PKA activity nanodomains with subcellular structures.631
Alongside the use of KARs to visualize kinase activity dynamics, biosensors that directly report on the activation of specific kinases can also provide crucial insights into signaling regulation. Kinase activation biosensors have shined brightly in elucidating the regulation of isoform-specific PKC signaling. Mammalian PKC comprises 10 major isozymes, which fall into three main classes that are differentially regulated by upstream signals. Dysregulation of PKC signaling is involved in many pathophysiological conditions such as cancer and neurodegeneration,632 and dissecting the contributions of individual PKC isoforms is essential to understanding how cells precisely balance PKC signaling to achieve homeostasis. Despite their distinct modes of regulation, however, all PKC isoforms share highly conserved catalytic domains and can phosphorylate many of the same substrate sequences and are indistinguishable by kinase activity reporters. Although an isozyme-specific CKAR was previously developed using an atypical PKC-specific phosphorylation sequence derived from insulin-regulated membrane aminopeptidase (IRAP),633 this approach is difficult to generalize, and PKC isozymes remain largely indistinguishable to KARs. In this scenario, kinase activation biosensors, which often contain the full-length kinase, are more advantageous because isoform specificity is intrinsic to the biosensor design. For example, Colgan et al. leveraged the fine-tuned, multistep conformational dynamics associated with PKC activation634 to develop a pair of biosensors to probe isoform-specific PKC signaling in synaptic plasticity.635 While the role of PKC isozymes in synaptic plasticity has long been recognized, whether PKC is activated in dendritic spines and which PKC isozyme encodes synaptic plasticity was unknown.636,637 Colgan and colleagues therefore constructed the FLIM-FRET sensors ITRACK and IDOCKS to study this question. Both sensors use a bimolecular design where one component fuses a specific PKC isozyme to EGFP as the FRET donor and the second component contains mCherry as the FRET acceptor, either directly targeted to the plasma membrane (ITRACK) or fused to a PKC pseudosubstrate domain (IDOCKS). Once the EGFP-tagged PKC is activated, it translocates to the plasma membrane (ITRACKS) or binds to the pseudosubstrate domain (IDOCKS), inducing a change in the donor fluorescence lifetime. This approach revealed that only PKCα was required for synaptic plasticity in dendritic spines of hippocampal neurons.635
In another example, the Akt activation sensor ReAktion1, which was constructed by sandwiching full-length Akt isoform 1 (Akt1) between CFP and YFP, revealed that interdomain interactions between the PH and catalytic domains play a central role during the Akt1 activation cycle by controlling disassociation of active Akt1 from the plasma membrane.638 A recent study suggested that Akt isoforms exhibit spatiotemporally distinct activation patterns, with endosomal PI(3,4)P2 selectively activating Akt2, whereas PIP3 selectively turns on Akt1 and Akt3 at the plasma membrane.639 Thus, Akt2- and Akt3-specific ReAktion vartiants will likely prove useful in detailing these distinct activation mechanisms. Indeed, we anticipate that broader development of kinase activation sensors will yield similar insights for other kinases, providing a crucial window into isoform-selective kinase regulation.
10.2. CMGC- and STE-Family Kinases
The cyclin-dependent kinase (CDK)/mitogen-activated protein kinase (MAPK)/glycogen synthase kinase/CDK-like (CMGC) and Sterile 7/11/20-related (STE) kinase families encompass numerous components of the MAPK/ERK pathway, which is frequently activated downstream of receptor tyrosine kinase (RTK) signaling and governs cell proliferation, differentiation, and migration.640,641 The MAPK/ERK pathway is exquisitely regulated, but crosstalk between different branches of the pathway is common.642 Fluorescent biosensors to monitor the spatiotemporal regulation of different signaling activation and distinguish downstream signaling bias between the branches have unique advantages. Due to the important role of ERK, many efforts have been focused on developing ERK activity reporters. Just like the kinases of the AGC family, various design strategies have been employed in developing ERK biosensors with high performance.
Current popular ERK activity sensor designs are mostly based on the original FRET-based ERK activity reporter (EKAR), which is composed of YFP and CFP flanking a molecular switch containing a WW domain, a Gly linker, and an ERK-specific substrate sequence which contains an ERK docking motif. The docking motif is important for all MAPKs, including ERK, to specifically recognize and phosphorylate their substrates. EKAR exhibits an increased yellow/cyan emission ratio upon ERK activation.643 To improve EKAR, Komatsu et al. modified the original sensor by incorporating a long, flexible EV linker, as discussed in section 3.3.2, along with a nonmonomeric FP pair to ensure that the FRET response was completely distance dependent, which greatly improved the dynamic range of the resulting EKAR-EV sensor.211 This general EV linker was also used in many other kinase reporters to improve their dynamic range.211 Meanwhile, optimization of the FRET pair or the arrangement of the sensor components has yielded a series of improved EKARs (EKAR2G, EKAR-TVV, EKAR3, EKAR4).644−647 A later study found that the Cdc25-derived substrate sequence in EKAR can be phosphorylated by Cdk1, generating a nonspecific signal. But introducing two mutations into the substrate peptide resolved the issue (EKAREN4, EKAREN5).648
Alongside FRET-based EKAR, the ERK kinase translocation reporter (ERK KTR) is another widely used sensor design that has yielded important insights into ERK/MAPK signaling. KTR technology was originally developed for another MAPK, c-Jun N-terminal kinase (JNK), following a comprehensive search for a phosphorylation-dependent nuclear NES derived from c-Jun, which is positively regulated by JNK. This was combined with a negatively phospho-regulated NLS and fused to the green-emitting FP mClover to generate JNK KTR.190 Although the nuclear translocation of FP-tagged full-length ERK has previously been used to monitor ERK activation,649 the overexpression of functional ERK may lead to undesired signaling perturbations. Thus, an ERK sensor following the KTR design was generated by fusing an ERK substrate sequence from Elk1 to an NLS and NES alongside an FP. As with other KTRs, phosphorylation alters the substrate charge, which inhibits the NLS and promotes nuclear export of the KTR, redistributing the fluorescence signal into the cytosol.190 A similar KTR for p38 MAPK was constructed utilizing an endogenous p38 substrate, MEF2C, enabling specific detection of p38 activity.190 Importantly, KTRs are single-color sensors, which can be easily coimaged with other KTRs to achieve multiplexed visualization of MAPK signaling. Such simultaneous analysis of different branches of the same upstream signaling pathway could provide valuable information on signaling crosstalk, which plays an important role in feedback regulation.650 The generalizable KTR design has been used to develop biosensors for other kinase families besides MAPKs, including CDKs and AGC kinases.651,652 For example, a translocation-based activity reporter for cyclin-dependent kinase 2 (CDK2) revealed that cells immediately build up CDK2 activity before entering the next cell cycle.653 The CDK2 reporter has been used along with another translocation based CDK4/6 reporter to simultaneously monitor CDK2 and CDK4/6 activities in human mammary epithelial cells, revealing that rapid elevation of CDK4/6 precedes a gradual increase in CDK2 activity, and temporary CDK4/6 inactivation was found to regulate the length of G1 phase.654 For additional discussion of cell cycle-related biosensors, please see section 13.1.
Many other generalizable designs have also been used to develop effective ERK activity reporters, including ddFP-based FPX63 and a bimolecular FRET sensor.655 Some newer ERK activity reporter designs include the Fra-1-based integrative reporter of ERK (FIRE), which is a degradation-dependent ERK activity reporter. FIRE is constructed by fusing mVenus to the PEST domain of the ERK target Fra-1. Phosphorylation of the Fra-1 PEST domain stabilizes the fusion protein, leading to sustained expression, otherwise, the fusion protein undergoes rapid degradation. ERK activity thus affects sensor fate, whether or not it escapes from degradation, in cells, and the fluorescence intensity of FIRE can be used to monitor ERK dynamics.656 Recently, liquid–liquid phase separation (LLPS) of signaling proteins has drawn lots of attention. The dramatic and reversible formation of intracellular “droplets” through this biophysical process has also inspired a novel reporting strategy for monitoring kinase activity. Zhang and colleagues developed the separation of phases-based activity reporter of kinase (SPARK) design by incorporating two coiled coil homo-oligomeric tags (HOTags), HO-tag3 and HO-tag6, fused to a kinase substrate and FP reporter and a PAABD, respectively. Using an ERK substrate and WW domain, they generated SPARK-ERK, wherein ERK activation induces binding between the phosphorylated ERK substrate and WW domain, thereby promoting multivalent interactions between HO-tag domains to form liquid-like fluorescent droplets. By measuring droplet fluorescence intensity with respect to total cellular fluorescence, Zhang et al. used SPARK-ERK to achieve sensitive imaging of ERK activity in live Drosophila.657 Although these new types of ERK biosensors may not be used explicitly to measure subcellular ERK activity, these designs only contain one fluorescent protein, potentially allowing for multiplexed imaging.657
In parallel to ERK activation by MAPKK, JNK and p38 are different MAPKs that act downstream of RTKs. p38 regulates the expression of many cytokines and plays a crucial role in immune responses, and p38 signaling is thus an important target of anti-inflammatory drugs.658 Regulation of the JNK signaling pathway is extremely complex. Multiple upstream regulators are known to activate JNK;659 thus, constructing a JNK biosensor can help elucidate the complicated spatiotemporal regulation of this pathway. Many principles that apply to the development of ERK biosensors are also instructive in developing JNK and p38 MAPK reporters, including the requirement for a docking motif near the substrate sequence for JNK and p38 to specifically recognize and phosphorylate their corresponding activity reporter.660 For example, Fosbrink et al. tested several different JNK docking motifs to construct a JNK activity reporter (JNKAR), including a JNK binding sequence corresponding to amino acids 33–43 of the N-terminal transactivation domain of c-Jun, a unique binding motif immediately C-terminal to the phosphoacceptor site Thr148 in Jun dimerization protein 2 (JDP2), and a well-characterized docking domain from JIP1.661 The resulting sensing unit consisting of substrate domain, docking domain and PAABD forms a FRET reporter in conjunction with a CFP/YFP pair. The substrate/docking sequence from JDP2, incorporating an Asp substitution at +3 relative to the phosphoacceptor Thr of JDP2, showed the largest change after JNK activation.661 A NIR-FRET pair was also used to generate a JNKAR for multiplexed imaging.624 The FRET-based p38 reporter PerKy-38 contains a synthetic substrate peptide that combines a p38 docking motif derived from the MEF2A protein, an endogenous p38 substrate, with a p38 substrate sequence spanning residues 54–73 of c-Jun, both of which ensure the specific response to p38 activity. Real-time monitoring of p38 activity using this FRET reporter revealed an oscillatory pattern of p38 activity, which is necessary for efficient expression of pro-inflammatory genes, such as IL-6, IL8 and COX-2.662
A notable gap in the biosensor toolbox for MAPK/ERK activity is the lack of single-FP based activity reporters, which will be valuable for achieving highly sensitive in vivo and multiplexed imaging to monitor different signaling pathways downstream of RTK activation with subcellular precision, ultimately helping to better understand the interwoven crosstalk.
10.3. CAMK-Family Kinases
The Ca2+/CaM-dependent protein kinases (CAMKs) are represented by downstream effectors of the versatile second messenger Ca2+.663 The activity of these effector kinases is often directly regulated by Ca2+-bound CaM or by an intermediate CaM-binding protein,664 with some members such as protein kinase D (PKD) not affected by Ca2+ signaling. CAMK-family kinases regulate myriad cellular processes, including dendritic spine morphology, hematopoietic stem cell maintenance, cell proliferation, and apoptosis, among others.663 Unlike the extraordinary efforts spent in developing Ca2+ indicators, however, sensor development for this downstream kinase family has been relatively limited.
CaMKII belongs to the CAMK2 subfamily and was one of the first Ca2+/CaM-regulated kinases to be discovered. CaMKII has four highly homologous isoforms and plays a critical role in brain development and neuronal activity.665 In the basal state, CaMKII is kept inactive by an autoinhibitory domain that masks the catalytic site. Binding of Ca2+/CaM to the CaM-binding domain induces a conformational change that relieves autoinhibition, activating CaMKII.666 CaMKII activation sensors based on this conformational change have been widely used to elucidate the role of CaMKII in many biological systems. The first of these, Camuiα, was constructed by sandwiching the full-length CaMKIIα isoform between YFP and CFP. Ca2+/CaM induced conformational changes in Camuiα alter the proximity and orientation of YFP and CFP, thus coupling CaMKII activation to changes in FRET. Camuiα was used to detect autophosphorylation-dependent CaMKII activation in living neurons at single-dendrite and spine resolution.667 The impact of Camuiα has been felt far beyond neuroscience. This design has also been adapted to study other CaMKII isoforms in additional systems such as cardiomyocytes.668
One relatively straightforward way to improve FRET sensor performance is to incorporate a better-performing FRET pair. For example, Clover and mRuby2 were introduced to Camuiα to generate Camui-CR, which showed increased dynamic range and SNR. Furthermore, because Camui-CR incorporates a red-shifted FRET pair, it also exhibited reduced photobleaching and phototoxicity.669 Typically, optimizing the distance between the donor and acceptor FPs is achieved by incorporating extended linkers between sensing unit components (see previous sections), a perspective informed by the protein secondary structure. Alternatively, by examining the three-dimensional structure of the CaMKII holoenzyme, Fujii and colleagues were able to reposition the FRET pair so that both FPs are closely positioned and exposed at the surface in the multimeric holoenzyme structure, yielding an overall improvement in performance compared with Camuiα.670 The authors generated multiple versions of their CaMKII activation sensor, K2α, with different FRET pairs, including CFP/YFP, mCherry/Sapphire and mCherry/YFP, which they coimaged with a spectrally compatible calcineurin activation sensor. Simultaneous imaging of CaMKII and calcineurin activation in response to glutamate input revealed that CaMKIIα activation was mostly restricted to the stimulated spine, while calcineurin activity was mainly observed in the adjacent shaft, suggesting that a single spine was able to transform the glutamatergic input sequence into well resolved spatiotemporal signaling activation patterns.670
CaMKII activation sensors have also been developed for FLIM readouts. One advantage of the lifetime-based readout is that quantification is independent of FP/sensor concentration. However, the CFP/YFP FRET pairs that are widely used in many emission-ratiometric FRET sensors are often not ideal for FLIM due to the complex lifetime decay kinetics of many CFPs.671 Furthermore, because FLIM only requires measuring donor fluorescence, nonradiative acceptors are often preferred for FLIM-FRET applications, as eliminating acceptor fluorescence not only reduces bleedthrough contamination of the donor channel but also effectively yields a single-color sensor that is more compatible with other fluorescent tools. In line with this purpose, a few FLIM-compatible CaMKII activation sensors have been generated using newly engineered FPs. For example, Green-Camui was developed using REACh (Resonance-Energy-Accepting Chromoprotein), a very low-emitting derivative of YFP, as the FRET acceptor. The resulting sensor has high sensitivity and brightness.672 Another dark acceptor, ShadowG, which has even lower emission than REACh, was used to generate ShadowG-Camui, an improved FLIM-FRET sensor that showed very low cell-to-cell variation.673 A red-shifted FLIM-FRET sensor that pairs mRuby2 with a dark mCherry mutant has also been developed for multiplexed imaging and is compatible with blue-light optogenetic tools.674
An important caveat of using Camui and similar probes is that they require overexpression of the active kinase. To reduce interference and complement the information obtained with activation sensors, CaMKII activity sensors have recently been developed. Ardestani et al. constructed the first CaMKII activity reporter, FRESCA (FRET-based Sensor of CaMKII Activity), by sandwiching a synthetic CaMKII substrate peptide (syntide) and FHA2 domain between mTurquoise2 and mVenus.675 Side-by-side comparison with Camuiα demonstrated that the Camuiα response would abruptly terminate during prolonged Ca2+ oscillations, whereas FRESCA continued to respond, suggesting that FRESCA is more suitable for long-term imaging than Camuiα.675 Indeed, as an activation biosensor, Camui-alpha reflects the conformational change of CaMKII itself. CaMKII is suggested to remain in the “on” state following stimulus-induced autophosphorylation of the kinase, even if the stimulus is removed. On the other hand, a kinase activity reporter for CaMKII is a proxy for CaMKII-mediated signaling, although it is also influenced by cellular phosphatase activities. More recently, Gaido and colleagues reported the development of a single-FP-based CaMKII activity reporter (CaMKAR), which was constructed following the aforementioned ExRai-KAR design (see section 10.1) by sandwiching cpGFP between a substrate peptide containing a CaMKIIδ autophosphorylation sequence and FHA1 domain. CaMKAR showed a 100% excitation-ratio increase in response to Ca2+ elevation in HEK293T cells and was sensitive enough to be used in a high-throughput drug repurposing screen and identified several previously unrecognized CaMKII inhibitors with clinically relevant potency.676
Another important member of the CAMK family that is indirectly regulated by Ca2+ /CaM is the AMP-activated protein kinase (AMPK), which functions as a master regulator of cellular energy homeostasis. Composed of α, β, and γ subunits, AMPK can be activated in response to various stimuli, such as starvation and oxidative stress. Complete AMPK activation involves the phosphorylation of Thr172 within the α subunit activation loop, which is mediated by the tumor-suppressor kinase LKB1 as well as by CaMKK2.677 The first AMPK activity reporter (AMPKAR) was constructed by Tsou and colleagues, who identified an AMPK-specific phosphorylation sequence using a positional screening peptide library, which they then substituted into the AKAR3 sensor backbone.678 Using AMPKAR, Tsou and colleagues were able to observe stimulus-specific spatial differences in AMPK activity: energy stress was found to induce cytosolic AMPK activity, whereas Ca2+ induced AMPK activity in both the cytosol and nucleus.678 However, plasma membrane AMPK activity was difficult to detect, even using an improved sensor (ABKAR) with twice the dynamic range of AMPKAR.679,680 This was instead achieved using a different design that separates ABKAR into a bimolecular sensor, bimAMPKAR. Switching to a bimolecular design greatly increased the dynamic range of the plasma membrane-targeted sensor, which allowed Depry and colleagues to investigate the bidirectional regulation of plasma membrane AMPK activity by PKA signaling.655 More recently, Schmitt et al. were able to extend the emerging single-FP-based ExRai-KAR design to AMPK and achieve even further improvements in dynamic range and sensitivity.681 Using ExRai-AMPKAR, which showed a rougly 2-fold maximum excitation ratio change in response to AMPK activation, the authors were able to dissect spatial AMPK signaling in greater detail, illuminating the dynamics and regulation of AMPK activity at mitochondria, the lysosome, and in the nucleus.681
Cellular energy stress triggers AMPK activation through the binding of AMP or ADP to the AMKPγ subunit, which induces conformational changes that promote phosphorylation and block dephosphorylation of Thr172.677,682 Recently, Pelosse et al. constructed an AMPK activation sensor, AMPfret, to probe AMPK activation dynamics.682 The author systematically fused CFP and YFP to all combinations of the N- and C-termini of any two AMPK subunits and obtained a pair of sensors with CFP located at the C-terminus of AMPKα and YFP at the C-terminus of either AMPKγ (AMPfret1.0) or β (AMPfret2.0). Structure-guided engineering was also performed to maximize adenylate-induced FRET change while preserving the wild-type binding affinity. AMPfret successfully reported conformational changes induced by AMP/ADP binding. Notably, AMPfret respones were unaffected by the Thr172 phosphorylation state, suggesting that adenylate-induced conformational switching is independent of activation loop phosphorylation.682
10.4. TK- and TKL-Family Kinases
Unlike other kinase families, members of the large and diverse tyrosine kinase (TK) and tyrosine kinase-like (TKL) families are found only in metazoans.683 Many of these kinases are membrane-bound receptors, such as RTKs, containing transmembrane and cytoplasmic domains. RTKs are involved in sensing extracellular ligands such as growth factors and insulin. Once bound to a ligand, the receptor undergoes dimerization, which brings the cytoplasmic domains of each receptor monomer into proximity, resulting in receptor trans-autophosphorylation. Phosphorylation of specific Tyr residues in the cytoplasmic domain creates binding site for Src-homology 2 (SH2) domains or other phosphotyrosine binding (PTB) domains found in effector proteins, initiating downstream signaling such as ERK signaling and Akt/mTOR signaling.684
TK reporters share the same design strategy as Ser/Thr KARs, with a sensing unit containing a phosphotyrosine-binding PAABD, often an SH2 domain, and kinase-specific substrate coupled to a FRET pair. Using this design, biosensors for monitoring epidermal growth factor receptor (EGFR) signaling, including EGFR, Src, and Abl activities have been developed.685−687 Notably, the Abl kinase sensor used a sensing unit derived from endogenous Crk, which contains both a substrate sequence and an SH2 domain, and also responded to Src and EGFR activity.685 Biosensors for monitoring platelet-derived growth factor receptor (PDGFR) signaling have also been developed. PDGFR is activated by binding to its ligand, PDGF and is involved in a variety of cellular progress, such as proliferation, migration, and survival. Autophosphorylation of PDGFR at Tyr751 recruits SH2-containing effector proteins, which was utilized to build a PDGFR reporter. A PAABD for binding to phosphorylated Tyr751 was selected from various SH2 domains from different effector proteins. This work revealed that the source of the SH2 domain is crucial to the selectivity of the PDGFR biosensor, as SH2 domains from Nck-2 and Shp-2 but not Src specifically bound the activated PDGFR reporter.688
The Src subfamily of TKs, including Src, focal adhesion kinase (FAK), and Fyn, among others, play key roles in signal transduction by a variety of cell surface receptors in response to diverse stimuli.689 Src kinase is involved in many intricate strategies to regulate signaling that controls fundamental cellular processes, including cell growth, differentiation, migration, and cell survival.690 The first Src activity reporter was developed by Ting and colleagues in 2001, featuring a design similar to that of other TK reporters and using a substrate sequence derived from an in vitro library screen. However, validation experiments revealed that the reporter was also phosphorylated by Abl, Lck, and EGFR, casting doubt on the specificity of this reporter.685 Wang et al. later replaced the substrate with a sequence derived from the endogenous c-Src substrate p130cas, which resolved this issue.687 Color variants of this Src reporter, featuring different donor and acceptor FPs, have since been generated to improve its dynamic range.184,691,692 In addition to exchanging the FRET pair, introducing a single mutation within the phosphotyrosine-binding pocket in the SH2 domain, which was predicted to affect the binding affinity and reduce basal FRET, was also found to significantly increased the dynamic range of the sensor.693 Using this method, Ouyang et al. were able to construct and optimize a biosensor for Fyn, another Src-family TK, which they further targeted to plasma membrane microdomains.694 The authors observed different growth factor-induced FRET responses from sensors tagged with targeting motifs from either Lyn kinase or Fyn kinase itself, suggesting the presence of functionally distinct subtypes of plasma membrane rafts. Relatively high levels of Fyn activity were also detected in the perinuclear region, further highlighting the importance of the native subcellular environment in regulating biochemical activities.694 Unlike Src sensors that typically require different targeting motifs to report localized signaling due to fast diffusion of the untargeted sensor molecules, FAK-SPARK biosensors can detect subcellular FAK activity without being targeted to subcellular locations, as FAK-SPARK droplets only form in places where active FAK is present, achieving visualization of FAK activity within single focal adhesions.695
ZAP70 (zeta-chain-associated protein kinase 70) activation is an essential step in T-cell receptor (TCR) mediated signaling.696 ZAP70 is recruited to TCR upon receptor engagement and is responsible for phosphorylating the adaptor protein LAT (linker for activation of T cells) that further recruits a critical signalosome.697 Randriamampita et al. therefore developed Reporter of ZAP70 Activity (ROZA) to examine the spatiotemporal activity of ZAP70 at the immune synapse.698 The authors tested substrate peptides corresponding to three ZAP70-specific phosphorylation sites within LAT, which they paired with the corresponding SH2-containing binding partner. Ultimately, they constructed ROZA using the Grb2 SH2 and a substrate peptide spanning Tyr175 from LAT as the molecular switch.698 Improved Fyn and ZAP70 sensors were also recently developed using a systematic optimization approach. Specifically, Liu and colleagues developed a method called FRET-seq to rapidly identify improved sensors directly in mammalian cells using high-throughput sequencing.220 Libraries of “self-activating” (sa)FRET biosensors are screened according to their FRET signal via FACS using kinase biosensor variants tethered to an active kinase or a negative control, and biosensor sequences recovered by high-throughput sequencing. Liu et al. applied FRET-seq to screen for optimized substrate sequences and obtain Fyn and ZAP70 biosensors with improved dynamic ranges.220 Although so far only applied to TK sensors, FRET-seq shows tremendous promise for improving the performance of other kinase activity reporters.220
Activation sensors for TKs have also been developed but are less common than Ser/Thr kinase activation sensors. Cai et al. developed an FAK activation sensor by taking advantage of the autophosphorylation-dependent change in the intramolecular interaction between the FERM domain and the catalytic domain of FAK, which is a major mechanism of FAK activation.699 The positions of CFP and YFP in the sensor were determined based on structural studies: CFP was fused to the N-terminus of FAK, in front of the FERM domain, and YFP was inserted at residue 413 in the linker between the FERM and catalytic domains, yielding CYFAK413. FAK activation induces dissociation of the FERM and catalytic domains, changing the conformational positioning between the FRET pair, and thus the emission ratio. Using CYFAK413, the authors found that PIP2-containing vesicles induced a conformational change and activated FAK in vitro, with PIP2 binding a basic patch within the FERM domain, and that perturbing PIP2 levels altered FAK activation in living cells.699
Despite the broad biological functions performed by TKs, sensor development for this important kinase family has lagged. Many strategies that have been applied to study other kinases, such as AGC-family kinases, have yet to be tested to construct reporters for TKs. Considering the importance of TKs, we hope to see more efforts devoted to increasing the diversity as well as the performance of TK reporters, enabling their broader application in biological investigations.
10.5. Atypical Kinases
Atypical kinases contain kinase domains that are distinct from other protein kinases yet display kinase activity and play indispensable roles in signal transduction.700
Mechanistic target of rapamycin, mTOR, is a Ser/Thr protein kinase whose catalytic domain shares homology with the lipid kinase PI3K (PIKK subfamily). mTOR forms two structurally and functionally distinct protein complexes, mTORC1 and mTORC2, which both regulate various biological functions. mTORC1, as a signaling hub, senses a variety of signaling cues and regulates a wide range of cellular processes including protein synthesis, autophagy, and cell proliferation.701 Spatiotemporal regulation has previously been implicated to play a critical role in the mTORC1 signaling pathway,702,703 yet efforts to visualize mTORC1 activity still fall behind compared with other key regulators, such as PKA and PKC.
Reported in 2015 by Zhou and colleagues, the FRET-based sensor TORCAR (mTORC1 activity reporter) was constructed by flanking the full-length mTORC1 substrate 4EBP1 with a CFP/YFP FRET pair. Phosphorylation of 4EBP1 by mTORC1 induces a conformational change within the biosensor that leads to an increase in the cyan/yellow emission ratio.222 Another similarly designed mTORC1 reporter was developed by Ahmed and colleagues based on S6K1, using EGFP and mCherry as the FRET pair and FLIM as the sensor readout.704 Meanwhile, the translocation-based, single-FP mTORC1 KTR has been generated by utilizing mTORC1-dependent phosphorylation of transcription factor EB (TFEB).705 Currently, mTORC1 sensors show very low dynamic range and sensitivity, limiting their wider use. Nevertheless, TORCAR has revealed location- and stimulus-specific mTORC1 activity patterns in live cells.222 TORCAR imaging was also indispensable for elucidating the noncanonical regulation of newly discovered nuclear mTORC1 activity,702,706 fueling the search for bona fide nuclear substrates and to illuminate the functions of nuclear mTORC1 signaling.
Other atypical kinases can also be investigated using fluorescent biosensors. For example, Johnson et al. developed a FRET-based sensor for monitoring ataxia-telangiectasia mutated (ATM) kinase activity, which is induced in response to DNA double-strand breaks (DSBs).707 They constructed ATOMIC (ATM observation method in cells) by sandwiching an ATM-specific substrate peptide and FHA2 domain between CFP and YFP.707 Recently, the phosphorylation of pyruvate dehydrogenase (PDH) was found to be inversely correlated with neuronal firing activity, revealing PDH phosphorylation as a potential marker of neuronal inhibition.708 Developing fluorescent reporters for monitoring PDH kinase (PDHK) activity could thus provide new tools for investigating neural activity and brain function. As we continue to uncover important new roles for atypical kinases in cellular function, the need for more robust biosensor development will only intensify.
10.6. Histidine Kinases
Histidine kinases represent a class of kinases that are widely used and studied in signal transduction in bacteria. Upon sensing an upstream signal, dimerized histidine kinases are autophosphorylated at a conserved histidine residue and activate a downstream response regulator.709,710
A histidine kinase activation sensor has previously been developed. This FRET-based biosensor includes a sensing domain that incorporates CckA, a bacterial histidine kinase that undergoes a conformational change when active, which is sandwiched between mRuby3 and mClover3. These two FPs undergo increased FRET in the active state of the kinase.711 Using this sensor, Duvall and Childers conducted a screen of histidine kinase inhibitors and monitored histidine kinase conformational changes in bacteria during the bacterial cell cycle.
Although histidine kinases have largely been studied in the bacterial context, mammalian histidine kinases may be more pervasive than previously understood. Some of the few known mammalian histidine kinases include some forms of nucleoside diphosphate kinases (NDPKs) and histone H4 histidine kinases,712 the functions of which are still unclear. The identity and functions of mammalian histidine kinases pose emerging questions in the field of cellular signaling, but our lack of information on histidine phosphorylation and tools to study histidine kinases have been major drawbacks. The development of genetically encodable fluorescent biosensors for monitoring histidine kinase activity can be a huge step toward filling this gap in our knowledge of cellular signaling. The field of mammalian histidine kinases therefore represents a great opportunity to harness the accumulated knowledge of the fluorescent biosensor field for the purpose of expanding our understanding of cellular signaling as it relates to the dynamics and regulation of histidine phosphorylation.
10.7. Phosphatases
Protein phosphorylation, mediated by protein kinases, is reversed by the actions of protein phosphatases. A proper balance between the activities of protein kinases and phosphatases is therefore required to maintain normal cellular function. In principle, the real-time activity readout provided by KARs reflects this dynamic balance between kinases and phosphatases. Nevertheless, sensors that directly report on phosphatases can provide valuable information to help us better understand the dynamics of protein phosphorylation in living cells.
So far, protein phosphatase activity biosensors have only been developed for calcineurin (CaN), a Ca2+/CaM-dependent serine/threonine phosphatase that regulates diverse cellular functions.713 The CaN activity reporter 1 (CaNAR1) and its improved version, CaNAR2, use the N-terminal regulatory domain from the well-studied CaN substrate nuclear factor of activated T-cells (NFAT) as the sensing unit, which is placed between a FRET pair. Dephosphorylation of the NFAT-derived sequence by CaN induces a conformational change that leads to an increase in FRET.714,715 Protein phosphatases have long been regarded as more difficult to study than kinases due to the wide variety of different catalytic mechanisms they use and the challenge of matching specific substrates to specific phosphatases,716 which complicates the development of phosphatase activity reporters. Unlike most kinases, phosphatases utilize docking motifs to achieve specificity instead of recognizing consensus motifs surrounding target phosphoresidues,717,718 although recent work is shedding new light on phosphatase substrate preferences.719 Dephosphorylation is also subtractive, meaning that a biosensor designed to function as a surrogate phosphatase substrate must get basally phosphorylated in cells to properly report phosphatase activity. Given these challenges, development of phosphatase activity reporters has progressed slowly. However, phosphatase activation sensors can be generated as a more straightforward alternative because they directly use the phosphatase itself as the sensing domain. For example, multiple groups have successfully constructed CaN activation sensors by flanking the A subunit of CaN (CaNA) with a FRET pair,670,715 which has been used in multiplexed imaging of CaMKII and CaN activation. A similar design fuses CaNA and the B subunit of CaN (CaNB) with Venus and Cerulean, respectively, to yield both bimolecular (DuoCaN) and unimolecular (UniCaN) sensors to monitor CaN activation in neonatal rat ventricular myocytes and adult guinea pig ventricular myocytes.720
Compared with kinase biosensors, the availability of phosphatase biosensors is greatly limited. Following the development of new technologies, the past two decades have seen huge advances in phosphatase research, and as these emerging methodologies increase our understanding of phosphatases,721 we expect that more and more biosensors will be constructed to investigate the full spectrum of protein phosphorylation dynamics.
11. Monomeric GTPases
Monomeric, or small, GTPases function as molecular switches that control intracellular signaling by cycling between “on” and “off” states depending on their bound nucleotide: the GTP-bound active form interacts with and activates downstream effectors until GTP is hydrolyzed to produce the GDP-bound inactive state. Small GTPases typically exhibit slow intrinsic catalysis. Thus, GTP hydrolysis is generally triggered by association with GTPase activating proteins (GAPs). Conversely, bound GDP is replaced with GTP via guanine exchange factors (GEFs).722 Active small GTPases signal through a wide variety of effectors and are thus critical for numerous biological processes, including cell division, migration, and intra- and intercellular signal transduction.723 Monitoring the dynamics of small GTPase activity is essential for understanding the role of these key signaling enzymes and identifying potential drugs targeting aberrant GTPase signaling in various pathological conditions, particularly cancer.
The best-known small GTPases belong to the Ras subfamily, which contains 36 members primarily classified into three subgroups: Ras, Rap, and Ral. Ras is the founding member of the small GTPase superfamily. Ras homologues include KRas, NRas, and HRas, collectively referred to as Ras protein.724 Different Ras isoforms are enriched in different cell types, and oncogenic mutations in specific isoforms are frequently linked to various cancers.725 Ras isoforms differ in their C-terminal hyper-variable regions and are in part differentially regulated through lipid modification and membrane association.726 Ras GTPases are responsible for mediating mitogenic processes including cell growth, proliferation, and differentiation.727 Aberrant Ras activation leads to serious diseases, including cancer. Research into Ras-mediated signaling remains highly active, including the development of biosensors to monitor the activation of Ras-family proteins. The biosensor design strategies employed to study Ras have been generalized to other GTPase family members and been demonstrated across many applications.
11.1. Translocation-Based GTPase Sensors
Ras translocation sensors consist of an FP fused to a Ras binding domain (RBD), usually derived from a Ras effector protein (Figure 13a). The first such sensors used a GFP-tagged RBD from Raf1 (Raf1-RBD) in conjunction with ectopically expressed HRas, with the GFP-tagged RBD translocating to wherever active, GTP-bound Ras is present in the cell. Oncogenic HRas and NRas were thus found to be active at the plasma membrane, ER, and Golgi with different kinetics and to engage in different signaling pathways.728 However, results obtained using these early translocation-based Ras sensors were often controversial, in part owing to the requirement for Ras protein overexpression.729 One solution was to increase the affinity of the biosensor for Ras by appending multiple tandem copies of the RBD to GFP. This eliminated the requirement of exogenously expressing Ras protein. This approach revealed that active Ras accumulated at the plasma membrane but not the Golgi.730 These discrepancies might also arise from the different experimental setups, cell types and growth factors used, making it difficult to draw firm conclusions.
Figure 13.

Biosensor designs for monomeric GTPases. (a) Translocation-based GTPase indicators (left) contain an RBD, which mediates recruitment of a fused FP to subcellular compartments where activated GTPases are present. ddFP-based GTPase indicators (right) depend on the interaction of a ddFP-A-tagged GTPase (Small G) and ddFP-B-tagged RBD and essentially report the dynamics of endogenous GEF and GAP activities, rather than measuring GTPase activation directly. (b) FRET-based GTPase reporters often similarly use a molecular switch composed of a GTPase and RBD, either in a bimolecular or unimolecular format (e.g., Raichu and Dora), and thus rely on GEF and GAP activity, while a pseudoligand-based design (e.g., RasAR) can be used to directly measure GTPase activity.
Despite these discrepancies, the simplicity of designing translocation-based biosensors makes them easily adaptable to studying other small GTPases, and employing only a single FP also simplifies multiplexing of biosensors, as well as integration with optogenetic tools. For example, translocation-based biosensors have been developed for the Rho-family GTPases RhoA and Cdc42, which regulate cytoskeletal dynamics and therefore play a critical role in cell migration, cell division, and cell morphology and polarity.731 Two types of translocation-based RhoA sensors have been reported: one consisting of the RBD from Anillin732 and another based on the Rhotekin G protein-binding domain (rGBD).733 Over the years, different versions with either different FP color variants or multiple copies of the rGBD or FP have been generated.734−737 Recently, Mahlandt et al. systematically compared different sensor variants by quantifying the relocalization efficiency and specificity for different Rho-family proteins,738 ultimately resulting in the development of an improved translocation-based Rho sensor (dimericTomato-2xrGBD) that was able to visualize a small pool of Rho proteins activated at the Golgi, in addition to previously well-established Rho activation at the plasma membrane. Similarly, early studies used the Cdc42 binding domain from Wiskott–Aldrich syndrome protein (WASP) fused to mEGFP or mRFP to visualize the localization of Cdc42 activation.733,739 Co-imaging Cdc42 and RhoA biosensors during wound healing in Xenopus oocytes revealed that RhoA and Cdc42 form discrete rings around the wound and that the formation, segregation, and movement of these rings depended on microtubules.733
11.2. FRET-Based GTPase Sensors
One potential drawback of translocation-based GTPase sensors is that background fluorescence from unbound sensor in the cytosol may occlude the signal from the bound pool and reduce sensitivity. The ratiometric readout of FRET-based biosensors reduces potential artifacts related to sensor expression levels and should provide more robust signal. The first FRET-based GTPase sensor for live-cell imaging was designed for visualizing Rac GTPase. Despite requiring a fluorescent dye for FRET imaging, this sensor provided the first glimpse of the highly dynamic nature of small GTPase signaling.740 The development of FPs eventually obviated the need for dye labeling in FRET biosensor design. The Ras and interacting protein chimeric unit (Raichu) series was pioneered by the Matsuda group and thereafter served as the prototype for a multitude of GTPase sensors741 (Figure 13b). Using a design similar to the Ca2+ indicator Cameleon, the sensing unit of Raichu-Ras consists of HRas and the Raf1 RBD, which are sandwiched by the CFP-YFP FRET pair. Activation of HRas by GTP binding promotes the interaction between HRas and the RBD, inducing a conformational change that alters the emission ratio readout of the FRET pair. Raichu-Ras exhibited high specificity to Ras over other Ras family proteins.741 By replacing Ras with Rap1, a Raichu-Rap1 sensor was also developed alongside Raichu-Ras, and both Raichu sensors were used to monitor Ras and Rap1 activation in epidermal growth factor (EGF) stimulated COS-7 cells. Spatiotemporal activation images of EGF-stimulated Ras and Rap1 revealed that Ras was activated at the peripheral plasma membrane while Rap1 was activated at perinuclear regions.741 The original Raichu-Ras had a limited dynamic range, but a flexible EV linker was employed to further increase the dynamic range (Raichu-Ras-EV).211 Raichu-based designs for other families of small GTPases have also been developed such as Raichu-RhoA742 and CRIB-Rac,743 a Raichu-like Rac sensor. Notably, Raichu-RhoA features a modified design that differs in the relative orientation of the RBD and RhoA compared with Raichu-Ras or Raichu-Rap1, suggesting that the arrangement of the sensor components is crucial for optimal performance in Raichu-like sensors. Like the RBD, the FP pair can also be improved, such as in Raichu-RhoA-CR.669
Very similar to the Raichu-Ras design, a series of FLAREs (fluorescent activity reporters) have also been developed for small GTPases, including Rap1A, Rap1B,744 RhoA,745 and RhoC.746 Despite their similar names, each of these FLAREs exhibits a different configuration. For example, Rap1A and Rap1B FLAREs feature a bimolecular design, while RhoA-FLARE is unimolecular. The domain structure also differs for each FLARE sensor, again emphasizing the complex conformational change in FRET sensors, which might need trial-and-error optimization. One interesting study aimed to optimize Raichu-Cdc42 by including two p21-binding domains (PBDs) in the sensor: one that interacts with intramolecular Cdc42 to drive the FRET change and a second GTPase-binding-deficient mutant that serves as an autoinhibitory domain for PBD to minimize off-state FRET, thus increasing the overall dynamic range.747
Another FRET-based Ras sensor design, named Dora-Ras (dimerization-optimized reporter for activation) (Figure 13b), was constructed based on the established Raichu scaffold but, inverting the Raichu-Ras design, sandwiches the FRET between the Byr2-derived RBD and wild-type HRas. Structural optimization was performed to couple the weak association of the FPs with the interaction between the RBD and HRas, thus improving the dynamic range of Dora-Ras.748 Dora-RhoA features a similar design, where an RBD from PKN binds to RhoA once RhoA is converted to its GTP-bound form by RhoGEFs. Dora-RhoA contains Cerulean3 as the FRET donor, which displays a simpler lifetime decay curve than many other CFPs and could therefore be measured via either emission-ratio imaging or FLIM-FRET, providing flexibility in choosing the experimental setup.749
Another FRET-based Ras sensor that is also compatible with fluorescence lifetime measurements is the FRas reporter, which utilizes a FRET-based bimolecular design in which the RBD and HRas are tagged with a FRET donor and acceptor, respectively. The interaction between active Ras and the RBD induces proximity between the FRET pair.750 The first FRas sensor used mEGFP and mRFP, and later efforts at FP engineering generated dark acceptors such as ShadowG673 and ShadowY,751 both of which increased the sensitivity and SNR of FRas. ShadowY was paired with the green-emitting FP Clover to achieve reduced cell-to-cell variability in 2pFLIM measurements in small neuronal compartments in mouse brains.751 Additional FLIM-compatible FRET sensors for small GTPases have been developed utilizing novel FPs. For example, mCyRFP is a newly engineered red-shifted FP with a large Stokes shift and monoexponential fluorescence lifetime decay. The optical properties of mCyRFP make it compatible for simultaneous 2P excitation with EGFP. Laviv et al. developed a RhoA sensor using a bimolecular design containing mCyRFP-tagged RhoA as the FRET donor and mMaroon tagged-Rhotekin as the acceptor, which enabled simultaneous, dual-color 2p-FLIM along with an EGFP-based CaMKII reporter, Green-Camui.752 A recent study by Shcherbakova and colleagues also reported an NIR FRET-based Rac sensor, which is compatible for coimaging with popular CFP/YFP FRET-based sensors.624
Although Raichu-Ras was not observed to affect endogenous EGF-induced ERK/MAPK activity,741 by design, the sensor contains full-length wild-type Ras, so expression of the Raichu-Ras biosensor resembles Ras overexpression. In addition, Raichu and similar designs (Dora, FRas) rely on Ras GAP/GEF activity to exchange nucleotides bound to Ras, meaning that these sensors in fact reflect the dynamics of endogenous RasGAPs/GEFs rather than true Ras activity. To overcome this limitation, instead of using full-length Ras in the design, Weeks et al. recently developed a Ras activity reporter (RasAR) that employs a pseudoligand derived from the effector binding region of Ras, which exhibits low-affinity binding to the Raf1 RBD (Figure 13b).753 In the absence of Ras, the pseudoligand engages the RBD, bringing a tethered FRET pair into proximity, while in the presence of active Ras, the pseudoligand is displaced by preferential binding of active Ras to the RBD, leading to a decrease in FRET efficiency. RasAR was shown to successfully detect cellular Ras activity and captured the dynamics of oncogenic KRasG12C in live cells treated with an FDA-approved Ras inhibitor, providing a powerful molecular tool for Ras signaling interrogation and Ras inhibitor development.753
11.3. Other GTPase Sensor Designs
A ddFP-based Ras biosensor, whose single-color readout favors multiplexed imaging, was recently generated by Kim et al. based on a bimolecular design.754 Here, the FP-A and B components of ddGFP are fused to Ras and an RBD, respectively. Interaction between Ras and the RBD brings the FP-A and B proteins together, turning on green fluorescence. This design was shown to be generalizable and was applied to other small GTPases, such as Rac1 and Cdc42.754 The ddFP-based design also enabled optogenetic manipulation of confined local GTPase activation via fibroblast growth factor receptor (FGFR) or tropomyosin receptor kinase B (TrkB) signaling, revealing the importance of spatiotemporal regulation of small GTPases. A red-shifted version of the ddFP-based sensor was also able to detect GTPase activity in the primary motor cortex in awake mice,754 providing powerful tools for future in vivo study.
The current toolbox of small GTPase biosensors is largely made up of sensors that essentially measure the dynamic activities of GEFs and GAPs, though RasAR shows promise for detecting endogenous Ras activity. More sensors for assessing the endogenous activities of small GTPases are eagerly anticipated in the future. The importance of local signaling by small GTPases has been recognized in different pathophysiological conditions such as cancer and neurodegenerative disease.755,756 Information obtained through subcellular imaging of small GTPases using fluorescent biosensors can therefore provide valuable insights for therapeutic development.
12. Biosensors for Other Post-Translational Modifications
In addition to kinases and GTPases, numerous additional enzymes are known to play important roles in cell signaling and function, often by catalyzing different post-translational modifications (PTMs) such as glycosylation, methylation, acetylation, or ubiquitination.757 A number of biosensors have been developed to monitor the dynamics of these PTMs in live cells, though such designs are still fairly uncommon and much work is still needed to expand the toolbox of these sensors. The innovative approaches to visualizing PTMs discussed here could inspire strategies for generating and improving such biosensors in future work.
12.1. Glycosylation
Glycosylation is a PTM that occurs at several subcellular compartments, including the ER, golgi, and cytosol. The glycan sequences added to proteins can be variable in length and glycosylation is often classified according to the residue being targeted, although N- and O-glycosylation are the major types that have been found to play significant roles in protein conformation and activity.758 Changes in the cellular glycome can be indicative of cellular health status and lead to altered inflammatory responses or promote metastasis.759 Furthermore, abnormal glycosylation has been associated with a family of rare inherited metabolic syndromes called congenital disorders of glycosylation (CDGs).760 Developing a better understanding of the functional impacts of glycosylation is limited by our ability to define the glycome.
There is still much to glean about the structure and function of the cellular glycome, the study of which has been difficult to conduct in the live-cell context. Traditional methods to identify changes in glycosylation rely on combined biochemical assays and genetic sequencing approaches. The subcellular regulation of glycosylation is a prime area to be discovered with the use of time- and spatially resolved biosensors. However, only a small number of biosensors have been developed for this purpose. Early on, Carrillo, Krishnamoorthy, and Mahal developed a FRET-based sensor to specifically detect β-O-N-acetyl-d-glucosamine (β-O-GlcNAc), a modification that occurs on Ser or Thr residues and is involved in complex crosstalk with phosphorylation. O-GlcNAcylation is mostly found on nuclear and cytoplasmic proteins, in contrast with the secretory pathway distribution of targets of other types of glycosylation. Furthermore, because the donor for O-GlcNAcylation is generated in a manner dependent on metabolic pathways, O-GlcNAcylation status can be indicative of metabolic state. The sensor developed by Carrillo and colleagues features eCFP fused to the N-terminus of the β-O-GlcNAc-binding protein, GalD, followed by a modified substrate sequence from casein kinase and Venus at the C-terminus. β-O-GlcNAcylation of the substrate sequence induces GalD binding, resulting in a conformational change that increases the yellow/cyan emission ratio.761 This design could be generalized by incorporating substrate sequences derived fom other targets of interest, potentially enabling broader detection of β-O-GlcNAcylation across various proteins in live cells. Another sensor for detecting N-glycosylation site occupancy on POIs was reported in 2012 by Losfeld and colleagues in the Freeze lab.762 The biosensor builds on a previous study in which targeting luciferase to the ER lumen was able to report on the inhibition of N-linked glycosylation by tunicamycin through modifications to the luciferase itself.763 This strategy was adapted to generate an FP-based biosensor wherein a modified GFP containing N-glycosylation sites (Asn-X-Ser/Thr) was targeted to the ER such that glycosylation of these sites will destroy GFP fluorescence. This biosensor was used to obtain end point measurements of steady-state glycosylation levels but did not provide information on temporal dynamics.
A more recent biosensor developed by Li et al. in 2021 was used to detect uridine diphosphate N-acetylglucosamine (UDP-GlcNAc).764 UDP-GlcNAc is crucial for O-linked N-acetylglucosaminylation (O-GlcNAcylation). UDP-GlcNAc concentrations regulate O-GlycNAcylation and so can be useful for gaining insights into glycosylation involved in cellular signaling and metabolism. The sensor, called UGAcS, incorporates cpGFP into an inactive form of the E. coli UDP-GlcNAc transferase murG, yielding a ratiometric response.764 However, UGAcS was also shown to bind and detect UDP and UTP, potentially resulting in nonspecific signals. A variant of the sensor that does not detect UDP-GlcNAc and only detects UDP or UTP should therefore be used as a negative control. A follow-up study introduced a red UDP-GlcNAc sensor called bapaUGAc (boronic acid- and peptide-assisted UDP-GlcNAc).765 This sensor incorporates a genetically encodable and engineered boronolectin, a synthetic lectin mimic, that can bind UDP-GlcNAc. Boronolectin is tagged to Lysine 30 of ecpmApple, an engineered variant of cpmApple that exhibits enhanced folding efficiency, to achieve a turn-off response to UDP-GlcNAc. BapaUGAc exhibited greater sensitivity for UDP-GlcNAc over UDP and UTP compared to UGAcS but exhibited slight sensitivity to a similar molecule, UDP-GalNAc. The sensor was used in the ER and Golgi to probe subcellular changes in UDP-GlcNAc in response to metabolic and pharmacological disruptions. BapaUGAc was also multiplexed with the green UGAcS sensor to probe changes in UDP-GlcNAc levels in the ER and cytosol simultaneously.
These few biosensors have already made possible the characterization of subcellular changes in glycosylation. However, the toolbox for glycosylation biosensors is limited and still needs to be expanded with biosensors that show enhanced sensitivity and selectivity.
12.2. Ubiquitylation
Ubiquitylation is a PTM that signals proteins for degradation and can thereby have great impact on cellular signaling and function. However, there are limited approaches to detecting ubiquitylation in the live-cell context using fluorescent biosensors. Ganesan and colleagues first developed a bimolecular FRET-based approach for detecting protein ubiquitylation in 2006 using REACh (see section 10.3) as a FRET acceptor to EGFP.766 In their approach, REACh is labeled with ubiquitin, and GFP is fused to a ubiquitination substrate. As a proof of concept, Ganesan et al. used a Pro-, Glu-, Ser-, and Thr-rich (PEST) sequence as an efficient ubiquitylation substrate.766 Proximity between REACh and EGFP leads to a decrease in the EGFP fluorescence lifetime (as well as quenching of EGFP emission, but this requires a reference FP for proper quantification) and indicates interaction between ubiquitin and a ubiquitylation substrate, and thus ubiquitylation. Although it has not been utilized for detecting ubiquitylation of other substrates, this approach may be generalizable to other POIs.
A recent paper from the Cappell lab demonstrates another generalizable design for detecting ubiquitylation of POIs by specific E3 ubiquitin ligase complexes. Briefly, a sensor for detecting the activity of β-TrCP, which recruits substrates to the SCF E3 ligase complex, was constructed by fusing a noncanonical degron motif specifically recognized by β-TrCP to YFP. Upon ubiquitylation of the biosensor, YFP fluorescence decreases as the reporter is degraded.767 Such an approach should be adaptable to monitor other E3 ligase complexes by replacing the degron motif. Despite this potentially generalizable approach and the significant biological questions to be studied, there have yet to be many forays into the field of ubiquitylation biosensing. For instance, multiplexed imaging of ubiquitylation biosensors with smart-labels of translation for POIs can provide a more thorough picture of protein regulation and lifetime in the live-cell context. Thus, future developments in this area should ultimately contribute to a better understanding of protein degradation.
12.3. Histone Modifications
Eukaryotic DNA is intricately organized and packaged within chromatin structures that are unwound when genes need to be accessed, whether for DNA replication or transcription. The nucleosome is a core component of this chromatin structure, consisting of DNA coiled around histone proteins (H2A, H2B, H3, and H4) that form an octomer. Access to packed DNA is partially regulated by specific PTMs, namely methylation, acetylation, and phosphorylation, of histone tails to alter chromatin structure. Thus, histone modification sites are crucial players in our understanding of the regulation of chromatin structure and gene expression.768−770
Histone methylation occurs on Lys and Arg residues of histone proteins and serves to silence genes, whereas demethylation can promote activation of gene transcription.771 One well studied site of histone methylation is histone H3 Lys 9 trimethylation (H3K9me3), which is considered a hallmark of heterochromatin and regulated during the cell cycle, although the dynamics of this regulation are not well-defined. The Ting lab first introduced FRET-based reporters of histone H3 Lys 9 or Lys 27 methylation incorporating a histone H3-derived substrate peptide that includes the methlylation site tethered to a chromodomain that senses the desired methylated residues sandwiched between the FRET pair CFP and YFP.772 The chromodomain of heterochromatin protein 1 (HP1) was utilized to sense H3K9 methylation, whereas the polycomb chromodomain was utilized to detect H3K27 methylation. Rather than reporting directly on methylation of endogenous histone H3, methylation of the histone peptide within the biosensor instead serves as a proxy to indicate native regulation of histone methylation by endogenous methylases and demethylases.
To elucidate the dynamic regulation of histone H3 methylation during mitosis, the Wang lab generated a FRET-based biosensor of H3K9 trimethylation. The H3K9me3 reporter consists of a full-length histone H3, rather than a peptide, linked to the HP1 chromodomain, which are flanked by ECFP and YPet. In addition, a flexible EV linker is included between ECFP and HP1. Upon recognition of H3K9me3, HP1 binds H3, leading to a conformational change that increases the yellow/cyan emission ratio. Imaging the H3K9me3 biosensor, which was overexpressed in mammalian cells, revealed dynamic regulation of this PTM during mitosis, with a marked decrease in methylation during the G2 phase of the cell cycle.773
A class of sensors that aim to detect endogenous changes in histone methylation directly were generated by Lungu and colleagues from the Jeltsch lab, named Bimolecular Anchor Detectors (BiADs).774 Available BiAD sensors can detect locus-specific H3K9me3 or DNA cytosine-C5 methylation (5mC), an epigenetic DNA modification that also regulates chromatin accessibility. The BiAD sensors consist of one component composed of a sequence-specific DNA-binding protein fused to the N-terminus of split Venus, and a second component containing the detection domain fused to the C-terminus of split Venus. As in the previously developed sensor, the HP1 chromodomain was used to detect H3K9me3, and the methyl-binding domain of human methyl-CpG binding protein (MBD1) was used to detect 5mC at mouse major satellite repeats or human pan-centromeric sequences. Because the sensor utilizes a complementation-based approach, time-resolved data are difficult to obtain. Currently, there are only a few available biosensors for detecting histone methylation, focusing on H3K9 methylation, but as interest in the dynamic regulation of such modifications increases, new biosensors may be generated to investigate methylation at other sites.
Another PTM commonly found on histones is acetylation, which occurs on Lys residues and neutralizes their positive charge. This is thought to reduce the strength of interactions between DNA and histones and thereby increase accessibility of DNA to transcriptional regulators or factors.775 Although histone acetylation is highly dynamic and significant to gene expression, there are very few reported biosensors for detecting histone acetylation. Sasaki et al. from the Yoshida lab developed the first reported FRET-based sensor of histone H4 hyperacetylation in 2009.776 This early sensor, named Histac, used Venus and CFP as the FRET pair flanking a BRDT bromodomain, which binds acetylated residues, a flexible linker, and full-length histone H4. Upon acetylation of histone H4, the BRDT domain binds, leading to a conformational change that increases in the cyan/yellow emission ratio. Histac was validated in COS7 cells and used to identify changes in histone H4 acetylation during mitosis.776 Histac was later utilized by Dancy et al. to study the activity of the histone acetyltransferase p300/CBP and identify inhibitors of the complex in live cells.777 Sanchez and colleagues later developed a reporter of histone H3 Lys 14 acetylation (H3K14ac) that aimed to eliminate the use of model histones, as introduced by the FRET-based H3K9me3 sensor, and instead detect endogenous histone acetylation. The sensor incorporates tandem copies of the second bromodomain of human poly bromodomain 1 (PB1) tagged to EGFP. H3K14ac is detected by the presence of EGFP signal in the nuclei of transfected cells. Because there is no direct intensity readout in this design, Sanchez et al. proposed using their sensor to generate a spatially resolved map of histone acetylation in live cells under varying conditions.778 Another class of biosensors for detecting histone modifications was introduced by the Kimura lab in 2013. In their approach, Sato and colleagues used a single-chain variable fragment (scFv) antibody, which they called a modification-specific intracellular antibody, or mintbody, fused to EGFP to detect H3K9 acetylation. This approach allowed them to quantify the nuclear-to-cytoplasmic ratio of EGFP as a readout for changes in acetylation.779 The scFV or mintbody-based approach was further expanded to detect H4K20 methylation using another mintbody specific for that residue.774 Due to the dynamic nature of these modifications, a biosensor that can achieve quantitative, time-resolved detection of histone acetylation at the endogenous level would be highly desirable.
12.4. Lipid Modification
Myristoylation promotes the membrane localization of proteins and is therefore important for the subcellular regulation of signaling at the plasma membrane. A study from 2013 introduced NANOMS (NANOclustering and Myristoylation Sensors), which are FRET-based biosensors that can detect plasma membrane nanoclustering of protein sequences of interest. These biosensors incorporate the N-terminal membrane-targeting sequences of Gαi2, Yes, or Src kinases, which encode myristoylation sites, fused to FPs. Biosensor localization to the plasma membrane can serve as the readout for myristoylation, and this approach was utilized to screen for chemical compounds that inhibit myristoyl transferases that enable membrane anchorage.780 Similar design strategies could potentially be used to further probe other lipid modifications in the future.
13. Multistep Reporting Systems
Whereas most genetically encoded biosensors are designed around a single molecular switch that responds to given molecular events, a number of more complex reporting systems have also been devised. These reporting systems are distinguished by their sophisticated use of several biochemical “gates”, such as detection of a biochemical event or exposure to certain illumination wavelengths, to control the sensor readout. Coupling the biosensor responses to multiple cellular processes or events enhances the spatiotemporal information that can be gained when studying complex processes such as the cell cycle.
13.1. Cell Cycle Indicators
Cellular signaling and function can be finely tuned in conjunction with different phases of the cell cycle, implicating it as an important factor in the study of cell biology. Methods to probe the cell cycle have generally been end point assays that are difficult to combine with other techniques to quantify cellular signaling. In an effort to simplify the study of the cell cycle on a population level, treatments to synchronize the cell cycle have been used to reduce variability in cell signaling caused by heterogeneous populations of cells in different states of the cell cycle. However, these protocols do not allow for the characterization of cellular signaling as it relates to the native cell cycle progression of a single cell. To this end, genetically encoded cell cycle reporters have proven to be invaluable tools to understand cell cycle dynamics in various contexts and conditions as they relate to cellular signaling or disease states.
Developed in 2008, FUCCI, or fluorescent ubiquitination-based cell cycle indicator, was the first FP-based cell cycle reporter. FUCCI is a bimolecular system which fuses mKO2, an orange-emitting FP, to human Cdt1 (amino acids 30–120) and, separately, the green-emitting FP mAG1 to the first 110 residues of human Geminin. Cdt1 accumulates in G1, and thus cells in G1 phase are labeled orange as Cdt1 is expressed. As cells transition to S phase, Cdt1, which is a substrate of the SCFSkp2 E3 ligase, is ubiquitinated and degraded. Cells in S/G2/M phases, on the other hand, are labeled green due to Geminin expression, which is then targeted for degradation by the APCCdh1 E3 ligase in G1 phase. The transition from G1/S could be visualized by overlapping of red and green fluorescence. The first version of FUCCI therefore reports on G1 or S/G2/M phases and was used to characterize cell cycle states during epithelial-to-mesenchymal transition and wound healing in cultured cells as well as in the developing neural tissue of FUCCI transgenic mice.781
Several FUCCI variants have been reported in the years since its introduction. Some of these have focused on adapting FUCCI for specific cell systems, such as TNNT2-FUCCI for IPSC-derived cardiomyocytes782 and PLACCI for plant cells.783 Many other sensors were developed to expand the multiplexing capabilities of FUCCI by red-shifting the FP tags. FUCCI-Red was developed as a single-color sensor. This version takes advantage of the distinct fluorescence lifetimes of two red-emitting FPs, mCherry and mKate2,784 while utilizing the same sensing strategy as FUCCI (Figure 14a). The advantage of such a system is the low spectral footprint, making it highly suitable for multiplexed imaging applications. A red/far-red cell cycle indicator named NIR-FUCCI was also developed using the same sensing strategy as FUCCI but switching out the reporting units to smURFP and IFP2.0.180 The sensing system has also been tweaked to enable sensing of different cellular states. Ki67p-FUCCI was developed using a cell cycle-responsive Ki67 proximal promoter that enables expression of the sensor only when cells enter the cell cycle, thereby turning expression off in quiescent and nondividing cells. The sensing components are like the original FUCCI, with Cdt1 and hGeminin tagged to mCherry and mAG, respectively. Through this system, however, cells in the quiescent (G0) state and slowly dividing cells are distinguishable. This group also introduced open-source R-scripts to track cells through the cell cycle over time.782
Figure 14.

Multistep reporting systems. (a) The cell cycle reporter FUCCI-Red incorporates two red-emitting FPs, mKate2 and mCherry, which have distinct fluorescence lifetimes, tagged to hGem (1–110) and hCdt1 (30–120), respectively (left). As the cell progresses through the cell cycle, the observed fluorescence lifetime changes based on expression of mKate2 or mCherry, indicated by the deep red to pink gradient. FUCCI-Red was used to detect cell cycle states in cancer spheroids throughout their growth and revealed increased proportions of cells in the G1 phase compared to G1/S or S/G2/M phases at day 9 of growth compared to day 3 (right).785 (b) The Ca2+ integrator FLiCRE is a dual-gated reporter that, in high-Ca2+ environments and upon blue-light exposure, binds Ca2+ and leads to cleavage of the TEVp cleavage site, freeing the transcription factor to translocate to the nucleus and induce GFP expression. This reporter was used in mice to visualize the history of activated neurons in the nucleus accumbens of the mouse brain upon various inputs.786 (c) CNiFERs are reporters developed to detect the release of various neurotransmitters in vivo. The CNiFER for dopamine includes a dopamine-specific GPCR. Dopamine binding to the receptor triggers cytosolic Ca2+ release, which is detected using the FRET-based Ca2+ indicator TN-XXL.787
Cell cycle indicators have also been developed that take advantage of a sensing system distinct from that of FUCCI. For instance, PCNA-mRuby was developed to achieve single-color cell-cycle tracking in live cells.788 PCNA is natively expressed during S phase, and to endogenously use this gene as a reporter, Zerjatke et al. inserted mRuby in frame with the first exon of one allele of PCNA.788 Using a machine-learning-based approach, the authors classified cell cycle states based on dynamic behavior and expression of PCNA-mRuby. This approach could potentially be adapted for use in living animals with the insertion of a further red-shifted FP for future in vivo applications. Alternatively, CDK reporters, as discussed in section 10.2, are being developed to distinguish different phases of the cell cycle, as these enzymes are finely tuned to cell cycle states.789−792 For instance, a translocation-based CDK sensor that consists of a CDK substrate that traffics from the nucleus to the cytoplasm upon increased CDK activity was developed to distinguish G1 phase from G0 phase in vivo in zebrafish.793 A combined transcriptional reporter and CDK activity reporter took this approach one step further to investigate genetic mechanisms of cell cycle entry or exit. An mcm-4 promoter was incorporated to reveal Rb/E2F-mediated transcriptional control, and the CDK activity reporter was then used to distinguish G1 or quiescent cells in C. elegans. The specific CDK sensing unit was a fragment of human DNA helicase B, a CDK substrate, sandwiched between an NLS and NES and tagged to an FP such as GFP or mKate.793
In addition to sensor improvements, several groups have introduced sophisticated analysis software to segment, track and visualize single cells expressing FUCCI. FUCCItrack, an all-in-one automated software for single-cell cell cycle analysis was recently published.794 Another FUCCI-based analysis software called CellMAPtracer was developed to track single-cell migration and cell cycle phases and can uniquely allow correlation of cell cycle transitions and migration status of single cells.795 Advancements in image analysis techniques are thus integral to expanding applications of fluorescent biosensors and extracting greater information from their use in the live-cell context.
13.2. Calcium Integrator Systems
In contrast to real-time Ca2+ biosensors (discussed in section 5.1), calcium integrators are dual-gated and report on the combined history of increased Ca2+ levels and exogenous light exposure in individual cells to provide an “activity snapshot” of cells in the greater context of an organism or tissue (also discussed in section 5.1.4). One strategy to label these cells with a history of high Ca2+ activity is to use photoconvertible FPs, as in the CaMPARI systems, discussed in section 5.1.4. The other strategy, discussed here, uses the cell’s transcriptional machinery to do the labeling.
Roger Tsien first explored the concept of a Ca2+ memory dye in 2013 when he presented possible designs for the integration of transcription and intracellular Ca2+ levels to transcriptionally label cells with a history of high Ca2+.796 Two integrator systems incorporating the proposed light- and Ca2+-gated transcriptional system to provide a snapshot of Ca2+ in cells were published in the same year: FLARE from the Ting group797 and Cal-Light from the Kwon group.798 Although differing somewhat in their details, both integrator systems are multicomponent designs that include a transcription factor or activator fused to a TEV protease (TEVp) substrate peptide that has a light-sensitive LOV domain blocking the cleavage site, a CaM binding peptide, and a transmembrane helix for targeting to the plasma membrane. The second component is CaM fused to a full-length TEV protease or half of the TEV protease (with the other half incorporated into the plasma membrane-targeted component). Light exposure causes the LOV domain to reveal the TEVp cleavage site, while Ca2+ elevation induces recruitment of TEVp to the TEVp site, or fragment complementation of TEVp, via the interaction between Ca2+/CaM and the CaM-binding peptide. Cleavage only occurs in the presence of both light and Ca2+, releasing the transcription factor to enter the nucleus and induce target gene transcription. Importantly, the output of these systems depends on the identity of the target gene. Transcription of a simple FP reporter, for example, can be used to “permanently” label cells that experienced Ca2+ elevations during illumination, whereas transcription of a biochemical effector can allow precise manipulation of a targeted cell population. This very approach was demonstrated by driving the expression of an opsin to manipulate neuronal function in FLARE-positive cells in vivo in the motor cortex of mice.797 The Ting group later developed FLiCRE, a Ca2+ and light-gated integrator that builds off the existing design of FLARE with some performance-improving adjustments (Figure 14b). This integrator was used to label cells in the nucleus accumbens of mice in vivo. By performing single-cell RNA sequencing on FLiCRE-labeled cells, the authors were able to identify distinct cell types in the nucleus accumbens based on their responses to Ca2+ excitatory conditions,786 enriching our understanding of Ca2+ signaling in the mouse brain. This versatile system has been extended to detect PPIs799 and cell–cell contacts,800 and many more interesting applications are on the horizon.
13.3. Complex Neurotransmitter Reporters
Neurotransmitters are crucial signaling molecules in the brain, and monoamines like dopamine and norepinephrine are involved in key processes ranging from memory formation to decision-making.801,802 However, the detection of neurotransmitter release in vivo has been hindered by the lack of methods with sufficient specificity and adequate spatiotemporal resolution. In addition to the aforementioned neurotransmitter biosensors (section 7), two other types of reporters have been developed. Cell-based neurotransmitter fluorescent engineered reporters (CNiFERs) have been developed for detecting dopamine, norepinephrine,787 and acetylcholine.803 Briefly, CNiFERs are cells that stably express a specific GPCR that selectively recognizes the neurotransmitter of interest together with TN-XXL, a cyan-yellow FRET-based GECI that uses fragments of troponin C as the sensing unit. Upon GPCR activation, endogenous G-proteins trigger cytosolic Ca2+ elevation, which in turn induces a FRET response from TN-XXL (Figure 14c). CNiFERs were validated to detect neurotransmitter release in vivo under 2P laser scanning microscopy following implantation into the brains of adult mice.787
A similar system of detecting neurotransmitter activity in live neurons was introduced by Lee and colleagues from the Kwon lab, who developed the iTango system to identify dopamine presence in neurons via expression of a marker gene following blue light exposure.804 Their trimolecular system consists of DRD2 (dopamine receptor D2) fused to a truncated cryptochrome-interacting domain (CIBN), a TEVp-cleavage sequence (TEVseq), a truncated light-responsive AsLOV2 domain, and tTA transcription factor. Another component includes the C-terminal TEVp fragment and cryptochrome 2 photolyase (CRYPHR). The third component includes β-arrestin2 fused to the N-terminal TEVp fragment. Upon blue light exposure and dopamine binding to DRD2, β-arrestin2 is recruited to the receptor and CRY2PHR is recruited to CIBN. The TEVseq region hiding within the AsLOV2 domain is exposed, and reconstituted TEVp cleaves the exposed TEVseq, enabling the transcription factor to translocate to the nucleus and induce expression of a marker gene, in this case EGFP. Lee and colleagues were able to use this system in live mice to label the dopamine-sensitive population of neurons in the mouse brain. Furthermore, the subset of dopamine-sensitive neurons involved in various behaviors were identified. Because reporters like CNIFERs and the iTANGO system are coupled to GPCRs, their design can be adapted to detect other molecules that signal via GPCRs, which are highly relevant to the field of neuroscience and in many other contexts.
14. Conclusions and Outlook
Genetically encoded fluorescent biosensors have exploded in recent years in terms of both their utility and scope, from the number of accessible biological targets to compatible imaging techniques. As technologies like super-resolution microscopy and FLIM have become more accessible to biological researchers, novel biosensors compatible with these methods have been developed to take advantage of these powerful techniques and reap the unique insights they can provide. At the same time, the scope of accessible biological targets has greatly expanded as new sensing domains for previously inaccessible targets have been discovered or engineered, while the performance of sensors for existing targets has continued to improve.
In this review, we have discussed the different types of biosensors generated to visualize numerous molecular targets, as well as improvements to each biosensor class that are pushing the limits of what we can illuminate and visualize in living cells. We discussed recent advancements in FP engineering, where improved photophysics enable FP tags and passive sensors to be used for super-resolution imaging of PPIs (section 2). Alongside improvements to fluorescent reporting units, developments in the engineered sensing units of various biosensor types have yielded an impressive toolbox of sensors for a myriad of analytes. A deeper understanding of the fluorescence properties of FPs has resulted in environmental sensors, such as temperature sensors, that can now report on minute variations in intracellular temperatures with subcellular spatial resolution (section 4). As our understanding of cellular processes has become more thorough, the need for this kind of subcellular resolution in measuring enzymatic activities (section 10) and analyte concentrations (sections 5 and 6) has only grown, revealing a complex portrait of interrelated pathways governing cellular communication and homeostasis. A focus on spatial resolution, even down to the molecular level, has enabled improvements in our understanding of the dynamics of GPCR activation, internalization, and protein recruitment, as novel biosensors and imaging technologies are developed in concert with one another (section 8). In addition to increased spatial resolution, sensors have recently been developed for historically intractable or difficult-to-detect analytes, as new sensing units have been engineered and new scaffolds developed, in particular for neurotransmitters like GABA and glutamate, less commonly studied ions, and a number of metabolites, sure to broaden our understanding of these analytes. Further understanding of these analytes will drive future sensor development in turn. In addition, novel imaging methods have been combined with specifically engineered biosensors to enable absolute reporting of basal activity (section 10, section 11) or ion concentration (section 5), allowing more quantitative readout of these critical components of cellular function. These improvements in spatial and temporal precision, as well as in analyte sensitivity and scope have cemented fluorescent biosensors as invaluable tools for understanding the functions and biochemical pathways of living cells. As new classes of sensors are developed, we are able to learn more about the intricate connections underlying the biology of the cell.
With the accelerating development of new sensors, users should take care to adopt lessons learned through the development and use of previous biosensors. Sensors, especially for novel targets, should be tested for selectivity for the target of interest to minimize confounding responses produced by similar targets, as has been the case for some sensors of divalent metal cations.359 Additionally, inconvenient realities about the buffering extent of biosensors cannot be ignored; many sensors, in high enough concentrations, have the capability to buffer endogenous signals.805 This effect may be particularly challenging in vivo, where the extent of buffering is often harder to determine due to unknown sensor and analyte concentrations, while also affecting downstream processes, including behavior, as has been reported with buffering concentrations of Ca2+ indicators resulting in increased epileptiform events in transgenic mice.806 The affinity of a biosensor must be paid careful attention not only for the purpose of avoiding buffering, but also for adapting to the experiment at hand. Many sensors initially designed for detecting signals in the cytosol or at the plasma membrane are not equally as well-suited for reporting those signals in subcellular compartments, either due to differences in local concentration,207 or in pH that affect the biosensor’s signal or dynamic range.529 Equally as important as carefully selecting a sensor for the biological application of interest is to select a biosensor that is compatible with the desired imaging modality or system. Some biosensors that work well in immortalized cell lines perform unexpectedly poorly in vivo,352 and still others are workhorses of intensity-based imaging, but perform poorly when applied to techniques like FLIM.201 With the development of more biosensors for more targets, developers and users alike can take these lessons from experience with previous sensors, and avoid pitfalls in sensor application by carefully considering controls and ensuring sensors are carefully developed and chosen for the applications they will ultimately be used in.
Along with novel targets, the biosensors we have highlighted in this review have reflected a growth in the field toward increased multiplexing. As new FPs have been discovered and optimized, especially in the far-red to NIR region, the opportunities to multiplex readouts of multiple signals have grown. The opportunities in this area are far from exhausted, and we speculate that red and NIR FPs will continue to be developed and optimized into biosensors in the coming years. Particularly with the advent of synthetic RFPs like mScarlet, brighter RFPs like the new mScarlet333 are likely to be further developed and adapted into biosensor scaffolds, as most red single-FP biosensors have so far been limited to cpmApple or cpmRuby-based scaffolds. Additionally, BV-binding IR FPs are likely to receive more engineering focus due to their utility for in vivo imaging. Current NIR biosensors are relatively dim, and many exhibit an inverse response to the signal of interest. Both of these factors are likely to be targets of further biosensor engineering in the coming years. Alongside spectral multiplexing, another form of multiplexing relying on fluorescence lifetime has seen more utility in recent years, as exemplified with Fucci-Red,785 among others.
Fluorescence lifetime imaging is just one example of an imaging technique harnessing the photophysical characteristics of FPs that has seen increased use by biologists in recent years. FLIM, for instance, has seen utility not just as an alternative multiplexing method, but also as a quantitative readout of cellular signals. This focus on quantitative optical microscopy has been driven by an improvement in the understanding of how FP photophysics can be linked to the cellular environment, and thus calibrated to readouts like fluorescence lifetime and photochromism rates. An equal driver of these new imaging techniques, however, has been the advancement of microscopy approaches and hardware designs allowing the investigation of these photophysical properties. Fluorescence lifetime in particular is becoming more accessible as more commercial microscope companies begin to incorporate it into out-of-the-box systems, available to more and more users, as well as the development of new FLIM hardware that allows for faster imaging than traditional FLIM systems, such as electro-optical FLIM.807 As previously limited technology becomes widely available in microscopy core facilities and even individual laboratories, the drive to develop sensors that leverage these technologies will continue. Like fluorescence lifetime, this trend is beginning with some super-resolution microscopes. While super-resolution-compatible biosensors are so far still limited, we believe the next several years will bring in more developments, along with the continuing advances in FLIM-compatible sensors and other quantitative imaging methods, allowing increased spatial resolution and improved quantitative readouts for biosensor measurements. As these sensors are optimized and applied with new imaging technologies, the intertwined fields of biosensor (software) and microscope technology (hardware) development will push each other to new heights in the coming decade and continue to produce exciting new opportunities in the biosensor development and cellular signaling fields.
Acknowledgments
We thank Ben Li, Michelle Frei, and Daniel Stehle for helpful discussion and contribution of resources for this review. This work was supported by National Institutes of Health grants F31 DE032886 to A.Z.S., T32 5T32HL086344, and (NIH)/NIGMS K12 GM068524 to A.M.M.G., and R35 CA197622, R01 DK073368, R01 DE030497, R01 HL162302, R01 CA262815, and RF1MH126707 to J.Z.
Biographies
Anneliese M. M. Gest attended Macalester College, where she received a B.A. in Chemistry with a minor in Biology. She then pursued graduate studies at the University of California, Berkeley, where she earned a Ph.D. in Chemistry while working with Dr. Evan W. Miller. In her thesis work, she focused on the development of novel chemical probes and imaging methodologies to optically determine absolute membrane potential in excitable and nonexcitable cells. After graduation, Anneliese joined Dr. Jin Zhang’s lab at the University of California, San Diego, where she is developing novel red-shifted kinase sensors.
Ayse Z. Sahan received a B.S. in Biochemistry and Cell Biology from University of California, San Diego. She studied infection-mediated carcinogenesis in the context of H. pylori and gastric cancer during her undergraduate studies in the lab of Dr. Soumita Das. Upon graduation, she joined Dr. Utkan Demirci’s lab at Stanford University to investigate the effect of extracellular matrix stiffness on breast cancer cells. She went on to pursue graduate studies at University of California, San Diego in the Biomedical Sciences Graduate program in the lab of Dr. Jin Zhang. Her work includes developing improved ATP biosensors and investigating the spatial regulation of metabolic signaling pathways.
Yanghao Zhong obtained his B.S. in Biosciences from University of Science and Technology of China. He focused on studying the impact of miRNA-135a on metastasis of breast cancer cells in the lab of Dr. Tao Zhu. He then went to the United States to pursue his Ph.D. in Biomedical Sciences Graduate Program at University of California San Diego. During his graduate study, he joined Dr. Jin Zhang’s laboratory to investigate the spatiotemporal regulations and functions of the mechanistic target of rapamycin complex 1 (mTORC1) using genetically encoded fluorescent biosensors and engineered inhibitory peptide.
Wei Lin obtained his B.S. and M.S. in Pharmaceutical Science from Tianjin University in China. He then joined Dr. Xing Chen’s lab at Peking University in China and earned his Ph.D. in Chemical Biology. During his graduate study, he focused on developing a novel strategy for protein-specific imaging of glycans in living cells. After graduation, Wei went to the United States and joined Dr. Jin Zhang’s lab at the University of California, San Diego for postdoctoral research and continues to serve as a senior researcher in the lab. He focuses on developing new types of PKA activity biosensors for researching signaling pathway from nanoscale to cell/tissue, as well as in vivo.
Sohum Mehta received a B.S. in Biology, with a minor in Fine Arts, from the George Washington University before pursuing graduate studies at the Johns Hopkins University, where he received a Ph.D. in Biology for studies of calcineurin signaling in the yeast Saccharomyces cerevisiae. He originally joined Jin Zhang’s lab in 2009 as a postdoctoral fellow at the Johns Hopkins University School of Medicine, eventually moving with the lab to the University of California, San Diego in 2015. Sohum continues to serve as a senior researcher in the Zhang lab, where his research focuses on engineering novel genetically encoded tools to probe the intricate spatiotemporal organization of various signaling pathways in live cells and in vivo.
Jin Zhang attended Tsinghua University for her undergraduate studies and pursued her graduate studies in Chemistry at the University of Chicago. After completing her postdoctoral work at the University of California, San Diego, she joined the faculty of Johns Hopkins University School of Medicine in 2003. She was promoted to Professor of Pharmacology, Neuroscience and Oncology in 2013. In 2015, she moved back to University of California, San Diego, and is currently a member of the Moores Cancer Center and a Professor in Departments of Pharmacology, Bioengineering, and Chemistry and Biochemistry at UC San Diego. Research in her lab focuses on developing enabling technologies to probe the active molecules in their native environment and characterizing how these active molecules change in diseases including cancer. Professor Zhang is a recipient of the Biophysical Society Margaret Oakley Dayhoff Award (2009), NIH Director’s Pioneer Award (2009), John J. Abel Award in Pharmacology (2012), Pfizer Award in Enzyme Chemistry (2012), NCI Outstanding Investigator Award (2015 and 2022), Robert R. Ruffolo Career Achievement Award in Pharmacology (2022), Protein Society Christian B. Anfinsen Award (2022) and Biophysical Society Carolyn Cohen Innovation Award (2023). She was elected as a Fellow of the American Association for the Advancement of Science in 2014, a Fellow of the American Institute for Medical and Biological Engineering in 2019 and a Fellow of American Society for Pharmacology and Experimental Therapeutics in 2021. Professor Zhang also received UC San Diego Chancellor’s Award for Excellence in Postdoctoral Scholar Mentoring in 2019 and UC San Diego Jacobs School of Engineering Outstanding Graduate Student Mentoring Award in 2022.
Author Present Address
# Division of Chemistry and Chemical Engineering, California Institute of Technology, Pasadena, CA, 91125
Author Contributions
⊥ A.M.M.G., A.S., and Y.Z. contributed equally. CRediT: Anneliese Gest writing - original draft, writing - review & editing; Ayse Z Sahan writing - original draft, writing - review & editing; Yanghao Zhong writing - original draft, writing - review & editing; Wei Lin writing - original draft; Sohum Mehta conceptualization, writing - review & editing; Jin Zhang conceptualization, supervision, writing - review & editing.
The authors declare no competing financial interest.
Special Issue
Published as part of Chemical Reviewsspecial issue “Fluorescent Probes in Biology”.
References
- Chalfie M.; Tu Y.; Euskirchen G.; Ward W. W.; Prasher D. C. Green Fluorescent Protein as a Marker for Gene Expression. Science 1994, 263, 802–805. 10.1126/science.8303295. [DOI] [PubMed] [Google Scholar]
- Inouye S.; Tsuji F. I. Aequorea Green Fluorescent Protein. Expression of the Gene and Fluorescence Characteristics of the Recombinant Protein. FEBS Lett. 1994, 341, 277–280. 10.1016/0014-5793(94)80472-9. [DOI] [PubMed] [Google Scholar]
- Lambert T. J. FPbase: A Community-Editable Fluorescent Protein Database. Nat. Methods 2019, 16, 277–278. 10.1038/s41592-019-0352-8. [DOI] [PubMed] [Google Scholar]
- Heim R.; Prasher D. C.; Tsien R. Y. Wavelength Mutations and Posttranslational Autoxidation of Green Fluorescent Protein. Proc. Natl. Acad. Sci. U.S.A. 1994, 91, 12501–12504. 10.1073/pnas.91.26.12501. [DOI] [PMC free article] [PubMed] [Google Scholar]
- Craggs T. D. Green Fluorescent Protein: Structure, Folding and Chromophore Maturation. Chem. Soc. Rev. 2009, 38, 2865–2875. 10.1039/b903641p. [DOI] [PubMed] [Google Scholar]
- Ormö M.; Cubitt A. B.; Kallio K.; Gross L. A.; Tsien R. Y.; Remington S. J. Crystal Structure of the Aequorea Victoria Green Fluorescent Protein. Science 1996, 273, 1392–1395. 10.1126/science.273.5280.1392. [DOI] [PubMed] [Google Scholar]
- Grigorenko B. L.; Nemukhin A. V.; Polyakov I. V.; Morozov D. I.; Krylov A. I. First-Principles Characterization of the Energy Landscape and Optical Spectra of Green Fluorescent Protein along the A→I→B Proton Transfer Route. J. Am. Chem. Soc. 2013, 135, 11541–11549. 10.1021/ja402472y. [DOI] [PubMed] [Google Scholar]
- Yang L.; Nian S.; Zhang G.; Sharman E.; Miao H.; Zhang X.; Chen X.; Luo Y.; Jiang J. Role of Hydrogen Bonding in Green Fluorescent Protein-like Chromophore Emission. Sci. Rep. 2019, 9, 11640. 10.1038/s41598-019-47660-0. [DOI] [PMC free article] [PubMed] [Google Scholar]
- Olenych S. G.; Claxton N. S.; Ottenberg G. K.; Davidson M. W. The Fluorescent Protein Color Palette. Curr. Protoc. Cell Biol. 2007, 36, s36. 10.1002/0471143030.cb2105s36. [DOI] [PubMed] [Google Scholar]
- Gross L. A.; Baird G. S.; Hoffman R. C.; Baldridge K. K.; Tsien R. Y. The Structure of the Chromophore within DsRed, a Red Fluorescent Protein from Coral. Proc. Natl. Acad. Sci. U.S.A. 2000, 97, 11990–11995. 10.1073/pnas.97.22.11990. [DOI] [PMC free article] [PubMed] [Google Scholar]
- Rodriguez E. A.; Campbell R. E.; Lin J. Y.; Lin M. Z.; Miyawaki A.; Palmer A. E.; Shu X.; Zhang J.; Tsien R. Y. The Growing and Glowing Toolbox of Fluorescent and Photoactive Proteins. Trends Biochem. Sci. 2017, 42, 111–129. 10.1016/j.tibs.2016.09.010. [DOI] [PMC free article] [PubMed] [Google Scholar]
- Morozova K. S.; Piatkevich K. D.; Gould T. J.; Zhang J.; Bewersdorf J.; Verkhusha V. V. Far-Red Fluorescent Protein Excitable with Red Lasers for Flow Cytometry and Superresolution STED Nanoscopy. Biophys. J. 2010, 99, L13–5. 10.1016/j.bpj.2010.04.025. [DOI] [PMC free article] [PubMed] [Google Scholar]
- Babakhanova S.; Jung E. E.; Namikawa K.; Zhang H.; Wang Y.; Subach O. M.; Korzhenevskiy D. A.; Rakitina T. V.; Xiao X.; Wang W.; et al. Rapid Directed Molecular Evolution of Fluorescent Proteins in Mammalian Cells. Protein Sci. 2022, 31, 728–751. 10.1002/pro.4261. [DOI] [PMC free article] [PubMed] [Google Scholar]
- Merzlyak E. M.; Goedhart J.; Shcherbo D.; Bulina M. E.; Shcheglov A. S.; Fradkov A. F.; Gaintzeva A.; Lukyanov K. A.; Lukyanov S.; Gadella T. W. J.; et al. Bright Monomeric Red Fluorescent Protein with an Extended Fluorescence Lifetime. Nat. Methods 2007, 4, 555–557. 10.1038/nmeth1062. [DOI] [PubMed] [Google Scholar]
- Fischer A. J.; Lagarias J. C. Harnessing Phytochrome’s Glowing Potential. Proc. Natl. Acad. Sci. U.S.A. 2004, 101, 17334–17339. 10.1073/pnas.0407645101. [DOI] [PMC free article] [PubMed] [Google Scholar]
- Stryer L. Fluorescence Energy Transfer as a Spectroscopic Ruler. Annu. Rev. Biochem. 1978, 47, 819–846. 10.1146/annurev.bi.47.070178.004131. [DOI] [PubMed] [Google Scholar]
- Sekar R. B.; Periasamy A. Fluorescence Resonance Energy Transfer (FRET) Microscopy Imaging of Live Cell Protein Localizations. J. Cell Biol. 2003, 160, 629–633. 10.1083/jcb.200210140. [DOI] [PMC free article] [PubMed] [Google Scholar]
- Ma Y.; Sun Q.; Smith S. C. The Mechanism of Oxidation in Chromophore Maturation of Wild-Type Green Fluorescent Protein: A Theoretical Study. Phys. Chem. Chem. Phys. 2017, 19, 12942–12952. 10.1039/C6CP07983K. [DOI] [PubMed] [Google Scholar]
- Tsien R. Y. The Green Fluorescent Protein. Annu. Rev. Biochem. 1998, 67, 509–544. 10.1146/annurev.biochem.67.1.509. [DOI] [PubMed] [Google Scholar]
- Chudakov D. M.; Matz M. V.; Lukyanov S.; Lukyanov K. A. Fluorescent Proteins and Their Applications in Imaging Living Cells and Tissues. Physiol. Rev. 2010, 90, 1103–1163. 10.1152/physrev.00038.2009. [DOI] [PubMed] [Google Scholar]
- Terskikh A.; Fradkov A.; Ermakova G.; Zaraisky A.; Tan P.; Kajava A. V.; Zhao X.; Lukyanov S.; Matz M.; Kim S.; et al. Fluorescent Timer”: Protein That Changes Color with Time. Science 2000, 290, 1585–1588. 10.1126/science.290.5496.1585. [DOI] [PubMed] [Google Scholar]
- Subach F. V.; Subach O. M.; Gundorov I. S.; Morozova K. S.; Piatkevich K. D.; Cuervo A. M.; Verkhusha V. V. Monomeric Fluorescent Timers That Change Color from Blue to Red Report on Cellular Trafficking. Nat. Chem. Biol. 2009, 5, 118–126. 10.1038/nchembio.138. [DOI] [PMC free article] [PubMed] [Google Scholar]
- Ruhlandt D.; Andresen M.; Jensen N.; Gregor I.; Jakobs S.; Enderlein J.; Chizhik A. I. Absolute Quantum Yield Measurements of Fluorescent Proteins Using a Plasmonic Nanocavity. Commun. Biol. 2020, 3, 627. 10.1038/s42003-020-01316-2. [DOI] [PMC free article] [PubMed] [Google Scholar]
- Ai H.; Shaner N. C.; Cheng Z.; Tsien R. Y.; Campbell R. E. Exploration of New Chromophore Structures Leads to the Identification of Improved Blue Fluorescent Proteins. Biochemistry 2007, 46, 5904–5910. 10.1021/bi700199g. [DOI] [PubMed] [Google Scholar]
- Hendrix J.; Flors C.; Dedecker P.; Hofkens J.; Engelborghs Y. Dark States in Monomeric Red Fluorescent Proteins Studied by Fluorescence Correlation and Single Molecule Spectroscopy. Biophys. J. 2008, 94, 4103–4113. 10.1529/biophysj.107.123596. [DOI] [PMC free article] [PubMed] [Google Scholar]
- García-Parajó M. F.; Veerman J.-A.; Bouwhuis R.; Vallée R.; van Hulst N. F. Optical Probing of Single Fluorescent Molecules and Proteins. ChemPhysChem 2001, 2, 347–360. . [DOI] [PubMed] [Google Scholar]
- Ward W. W.; Bokman S. H. Reversible Denaturation of Aequorea Green-Fluorescent Protein: Physical Separation and Characterization of the Renatured Protein. Biochemistry 1982, 21, 4535–4540. 10.1021/bi00262a003. [DOI] [PubMed] [Google Scholar]
- Prangsma J. C.; Molenaar R.; van Weeren L.; Bindels D. S.; Haarbosch L.; Stouthamer J.; Gadella T. W. J.; Subramaniam V.; Vos W. L.; Blum C. Quantitative Determination of Dark Chromophore Population Explains the Apparent Low Quantum Yield of Red Fluorescent Proteins. J. Phys. Chem. B 2020, 124, 1383–1391. 10.1021/acs.jpcb.9b10396. [DOI] [PMC free article] [PubMed] [Google Scholar]
- Campbell B. C.; Nabel E. M.; Murdock M. H.; Lao-Peregrin C.; Tsoulfas P.; Blackmore M. G.; Lee F. S.; Liston C.; Morishita H.; Petsko G. A. MGreenLantern: A Bright Monomeric Fluorescent Protein with Rapid Expression and Cell Filling Properties for Neuronal Imaging. Proc. Natl. Acad. Sci. U.S.A. 2020, 117, 30710–30721. 10.1073/pnas.2000942117. [DOI] [PMC free article] [PubMed] [Google Scholar]
- Tsien R. Y.; Waggoner A.. Fluorophores for Confocal Microscopy: Photophysics and Photochemistry. In Handbook of Biological Confocal Microscopy; Springer: Boston, MA, 1990; pp 169–178. [Google Scholar]
- Hirano M.; Ando R.; Shimozono S.; Sugiyama M.; Takeda N.; Kurokawa H.; Deguchi R.; Endo K.; Haga K.; Takai-Todaka R.; et al. A Highly Photostable and Bright Green Fluorescent Protein. Nat. Biotechnol. 2022, 40, 1132–1142. 10.1038/s41587-022-01278-2. [DOI] [PMC free article] [PubMed] [Google Scholar]
- Shaner N. C.; Lin M. Z.; McKeown M. R.; Steinbach P. A.; Hazelwood K. L.; Davidson M. W.; Tsien R. Y. Improving the Photostability of Bright Monomeric Orange and Red Fluorescent Proteins. Nat. Methods 2008, 5, 545–551. 10.1038/nmeth.1209. [DOI] [PMC free article] [PubMed] [Google Scholar]
- Gadella T. W. J.; van Weeren L.; Stouthamer J.; Hink M. A.; Wolters A. H. G.; Giepmans B. N. G.; Aumonier S.; Dupuy J.; Royant A. MScarlet3: A Brilliant and Fast-Maturing Red Fluorescent Protein. Nat. Methods 2023, 20, 541–545. 10.1038/s41592-023-01809-y. [DOI] [PubMed] [Google Scholar]
- Ivorra-Molla E.; Akhuli D.; McAndrew M. B. L.; Scott W.; Kumar L.; Palani S.; Mishima M.; Crow A.; Balasubramanian M. K. A Monomeric StayGold Fluorescent Protein. Nat. Biotechnol. 2024, 42, 1368. 10.1038/s41587-023-02018-w. [DOI] [PMC free article] [PubMed] [Google Scholar]
- Zhang H.; Lesnov G. D.; Subach O. M.; Zhang W.; Kuzmicheva T. P.; Vlaskina A. V.; Samygina V. R.; Chen L.; Ye X.; Nikolaeva A. Y.; et al. Bright and Stable Monomeric Green Fluorescent Protein Derived from StayGold. Nat. Methods 2024, 21 (4), 657–665. 10.1038/s41592-024-02203-y. [DOI] [PMC free article] [PubMed] [Google Scholar]
- Mizuno H.; Mal T. K.; Wälchli M.; Fukano T.; Ikura M.; Miyawaki A. Molecular Basis of Photochromism of a Fluorescent Protein Revealed by Direct 13C Detection under Laser Illumination. J. Biomol. NMR 2010, 48, 237–246. 10.1007/s10858-010-9453-5. [DOI] [PubMed] [Google Scholar]
- Zhou X. X.; Lin M. Z. Photoswitchable Fluorescent Proteins: Ten Years of Colorful Chemistry and Exciting Applications. Curr. Opin. Chem. Biol. 2013, 17, 682–690. 10.1016/j.cbpa.2013.05.031. [DOI] [PMC free article] [PubMed] [Google Scholar]
- Shcherbakova D. M.; Sengupta P.; Lippincott-Schwartz J.; Verkhusha V. V. Photocontrollable Fluorescent Proteins for Superresolution Imaging. Annu. Rev. Biophys. 2014, 43, 303–329. 10.1146/annurev-biophys-051013-022836. [DOI] [PMC free article] [PubMed] [Google Scholar]
- Lu K.; Vu C. Q.; Matsuda T.; Nagai T. Fluorescent Protein-Based Indicators for Functional Super-Resolution Imaging of Biomolecular Activities in Living Cells. Int. J. Mol. Sci. 2019, 20, 5784. 10.3390/ijms20225784. [DOI] [PMC free article] [PubMed] [Google Scholar]
- Zhang X.; Zhang M.; Li D.; He W.; Peng J.; Betzig E.; Xu P. Highly Photostable, Reversibly Photoswitchable Fluorescent Protein with High Contrast Ratio for Live-Cell Superresolution Microscopy. Proc. Natl. Acad. Sci. U.S.A. 2016, 113, 10364–10369. 10.1073/pnas.1611038113. [DOI] [PMC free article] [PubMed] [Google Scholar]
- Schermelleh L.; Ferrand A.; Huser T.; Eggeling C.; Sauer M.; Biehlmaier O.; Drummen G. P. C. Super-Resolution Microscopy Demystified. Nat. Cell Biol. 2019, 21, 72–84. 10.1038/s41556-018-0251-8. [DOI] [PubMed] [Google Scholar]
- Mishin A. S.; Lukyanov K. A. Live-Cell Super-Resolution Fluorescence Microscopy. Biochemistry. (Mosc) 2019, 84, 19–31. 10.1134/S0006297919140025. [DOI] [PubMed] [Google Scholar]
- Dong D.; Huang X.; Li L.; Mao H.; Mo Y.; Zhang G.; Zhang Z.; Shen J.; Liu W.; Wu Z.; Liu G.; Liu Y.; Yang H.; Gong Q.; Shi K.; Chen L. Super-Resolution Fluorescence-Assisted Diffraction Computational Tomography Reveals the Three-Dimensional Landscape of the Cellular Organelle Interactome. Light Sci. Appl. 2020, 9, 11. 10.1038/s41377-020-0249-4. [DOI] [PMC free article] [PubMed] [Google Scholar]
- Godtliebsen G.; Larsen K. B.; Bhujabal Z.; Opstad I. S.; Nager M.; Punnakkal A. R.; Kalstad T. B.; Olsen R.; Lund T.; Prasad D. K.; et al. High-Resolution Visualization and Assessment of Basal and OXPHOS-Induced Mitophagy in H9c2 Cardiomyoblasts. Autophagy 2023, 19, 2769–2788. 10.1080/15548627.2023.2230837. [DOI] [PMC free article] [PubMed] [Google Scholar]
- Gelléri M.; Chen S.-Y.; Hübner B.; Neumann J.; Kröger O.; Sadlo F.; Imhoff J.; Hendzel M. J.; Cremer M.; Cremer T.; et al. True-to-Scale DNA-Density Maps Correlate with Major Accessibility Differences between Active and Inactive Chromatin. Cell Rep. 2023, 42, 112567. 10.1016/j.celrep.2023.112567. [DOI] [PubMed] [Google Scholar]
- Ruland J. A.; Krüger A. M.; Dörner K.; Bhatia R.; Wirths S.; Poetes D.; Kutay U.; Siebrasse J. P.; Kubitscheck U. Nuclear Export of the Pre-60S Ribosomal Subunit through Single Nuclear Pores Observed in Real Time. Nat. Commun. 2021, 12, 6211. 10.1038/s41467-021-26323-7. [DOI] [PMC free article] [PubMed] [Google Scholar]
- Kwon J.; Park J.-S.; Kang M.; Choi S.; Park J.; Kim G. T.; Lee C.; Cha S.; Rhee H.-W.; Shim S.-H. Bright Ligand-Activatable Fluorescent Protein for High-Quality Multicolor Live-Cell Super-Resolution Microscopy. Nat. Commun. 2020, 11, 273. 10.1038/s41467-019-14067-4. [DOI] [PMC free article] [PubMed] [Google Scholar]
- Richardson D. S.; Gregor C.; Winter F. R.; Urban N. T.; Sahl S. J.; Willig K. I.; Hell S. W. SRpHi Ratiometric PH Biosensors for Super-Resolution Microscopy. Nat. Commun. 2017, 8, 577. 10.1038/s41467-017-00606-4. [DOI] [PMC free article] [PubMed] [Google Scholar]
- De Keersmaecker H.; Camacho R.; Rantasa D. M.; Fron E.; Uji-I H.; Mizuno H.; Rocha S. Mapping Transient Protein Interactions at the Nanoscale in Living Mammalian Cells. ACS Nano 2018, 12, 9842–9854. 10.1021/acsnano.8b01227. [DOI] [PubMed] [Google Scholar]
- Liu Z.; Xing D.; Su Q. P.; Zhu Y.; Zhang J.; Kong X.; Xue B.; Wang S.; Sun H.; Tao Y.; et al. Super-Resolution Imaging and Tracking of Protein-Protein Interactions in Sub-Diffraction Cellular Space. Nat. Commun. 2014, 5, 4443. 10.1038/ncomms5443. [DOI] [PMC free article] [PubMed] [Google Scholar]
- Cho W.-K.; Jayanth N.; English B. P; Inoue T.; Andrews J O.; Conway W.; Grimm J. B; Spille J.-H.; Lavis L. D; Lionnet T.; Cisse I. I RNA Polymerase II Cluster Dynamics Predict MRNA Output in Living Cells. Elife 2016, 5, e13617. 10.7554/eLife.13617. [DOI] [PMC free article] [PubMed] [Google Scholar]
- Mo G. C. H.; Ross B.; Hertel F.; Manna P.; Yang X.; Greenwald E.; Booth C.; Plummer A. M.; Tenner B.; Chen Z.; et al. Genetically Encoded Biosensors for Visualizing Live-Cell Biochemical Activity at Super-Resolution. Nat. Methods 2017, 14, 427–434. 10.1038/nmeth.4221. [DOI] [PMC free article] [PubMed] [Google Scholar]
- Baird G. S.; Zacharias D. A.; Tsien R. Y. Biochemistry, Mutagenesis, and Oligomerization of DsRed, a Red Fluorescent Protein from Coral. Proc. Natl. Acad. Sci. U.S.A. 2000, 97, 11984–11989. 10.1073/pnas.97.22.11984. [DOI] [PMC free article] [PubMed] [Google Scholar]
- Campbell R. E.; Tour O.; Palmer A. E.; Steinbach P. A.; Baird G. S.; Zacharias D. A.; Tsien R. Y. A Monomeric Red Fluorescent Protein. Proc. Natl. Acad. Sci. U.S.A. 2002, 99, 7877–7882. 10.1073/pnas.082243699. [DOI] [PMC free article] [PubMed] [Google Scholar]
- Bousmah Y.; Valenta H.; Bertolin G.; Singh U.; Nicolas V.; Pasquier H.; Tramier M.; Merola F.; Erard M. TdLanYFP, a Yellow, Bright, Photostable, and PH-Insensitive Fluorescent Protein for Live-Cell Imaging and Förster Resonance Energy Transfer-Based Sensing Strategies. ACS Sens. 2021, 6, 3940–3947. 10.1021/acssensors.1c00874. [DOI] [PubMed] [Google Scholar]
- Baird G. S.; Zacharias D. A.; Tsien R. Y. Circular Permutation and Receptor Insertion within Green Fluorescent Proteins. Proc. Natl. Acad. Sci. U.S.A. 1999, 96, 11241–11246. 10.1073/pnas.96.20.11241. [DOI] [PMC free article] [PubMed] [Google Scholar]
- Wu T.; Pang Y.; Ai H.-W. Circularly Permuted Far-Red Fluorescent Proteins. Biosensors 2021, 11, 438. 10.3390/bios11110438. [DOI] [PMC free article] [PubMed] [Google Scholar]
- Deng H.; Li J.; Zhou Y.; Xia Y.; Chen C.; Zhou Z.; Wu H.; Wang P.; Zhou S. Genetic Engineering of Circularly Permuted Yellow Fluorescent Protein Reveals Intracellular Acidification in Response to Nitric Oxide Stimuli. Redox. Biol. 2021, 41, 101943. 10.1016/j.redox.2021.101943. [DOI] [PMC free article] [PubMed] [Google Scholar]
- Shui B.; Wang Q.; Lee F.; Byrnes L. J.; Chudakov D. M.; Lukyanov S. A.; Sondermann H.; Kotlikoff M. I. Circular Permutation of Red Fluorescent Proteins. PLoS One 2011, 6, e20505. 10.1371/journal.pone.0020505. [DOI] [PMC free article] [PubMed] [Google Scholar]
- Nagai T.; Sawano A.; Park E. S.; Miyawaki A. Circularly Permuted Green Fluorescent Proteins Engineered to Sense Ca2+. Proc. Natl. Acad. Sci. U.S.A. 2001, 98, 3197–3202. 10.1073/pnas.051636098. [DOI] [PMC free article] [PubMed] [Google Scholar]
- Gautam S. G.; Perron A.; Mutoh H.; Knöpfel T. Exploration of Fluorescent Protein Voltage Probes Based on Circularly Permuted Fluorescent Proteins. Front Neuroengineering 2009, 2, 14. 10.3389/neuro.16.014.2009. [DOI] [PMC free article] [PubMed] [Google Scholar]
- Kostyuk A. I.; Demidovich A. D.; Kotova D. A.; Belousov V. V.; Bilan D. S. Circularly Permuted Fluorescent Protein-Based Indicators: History, Principles, and Classification. Int. J. Mol. Sci. 2019, 20, 4200. 10.3390/ijms20174200. [DOI] [PMC free article] [PubMed] [Google Scholar]
- Mehta S.; Zhang Y.; Roth R. H.; Zhang J.-F.; Mo A.; Tenner B.; Huganir R. L.; Zhang J. Single-Fluorophore Biosensors for Sensitive and Multiplexed Detection of Signalling Activities. Nat. Cell Biol. 2018, 20, 1215–1225. 10.1038/s41556-018-0200-6. [DOI] [PMC free article] [PubMed] [Google Scholar]
- Ghosh I.; Hamilton A. D.; Regan L. Antiparallel Leucine Zipper-Directed Protein Reassembly: Application to the Green Fluorescent Protein. J. Am. Chem. Soc. 2000, 122, 5658–5659. 10.1021/ja994421w. [DOI] [Google Scholar]
- Miller K. E.; Kim Y.; Huh W.-K.; Park H.-O. Bimolecular Fluorescence Complementation (BiFC) Analysis: Advances and Recent Applications for Genome-Wide Interaction Studies. J. Mol. Biol. 2015, 427, 2039–2055. 10.1016/j.jmb.2015.03.005. [DOI] [PMC free article] [PubMed] [Google Scholar]
- Fujii Y.; Yoshimura A.; Kodama Y. A Novel Orange-Colored Bimolecular Fluorescence Complementation (BiFC) Assay Using Monomeric Kusabira-Orange Protein. BioTechniques 2018, 64, 153–161. 10.2144/btn-2017-0121. [DOI] [PubMed] [Google Scholar]
- Cabantous S.; Terwilliger T. C.; Waldo G. S. Protein Tagging and Detection with Engineered Self-Assembling Fragments of Green Fluorescent Protein. Nat. Biotechnol. 2005, 23, 102–107. 10.1038/nbt1044. [DOI] [PubMed] [Google Scholar]
- Feng S.; Sekine S.; Pessino V.; Li H.; Leonetti M. D.; Huang B. Improved Split Fluorescent Proteins for Endogenous Protein Labeling. Nat. Commun. 2017, 8, 370. 10.1038/s41467-017-00494-8. [DOI] [PMC free article] [PubMed] [Google Scholar]
- Zhou S.; Feng S.; Brown D.; Huang B. Improved Yellow-Green Split Fluorescent Proteins for Protein Labeling and Signal Amplification. PLoS One 2020, 15, e0242592 10.1371/journal.pone.0242592. [DOI] [PMC free article] [PubMed] [Google Scholar]
- Tamura R.; Jiang F.; Xie J.; Kamiyama D. Multiplexed Labeling of Cellular Proteins with Split Fluorescent Protein Tags. Commun. Biol. 2021, 4, 257. 10.1038/s42003-021-01780-4. [DOI] [PMC free article] [PubMed] [Google Scholar]
- Feng S.; Varshney A.; Coto Villa D.; Modavi C.; Kohler J.; Farah F.; Zhou S.; Ali N.; Muller J. D.; Van Hoven M. K.; Huang B. Bright Split Red Fluorescent Proteins for the Visualization of Endogenous Proteins and Synapses. Commun. Biol. 2019, 2, 344. 10.1038/s42003-019-0589-x. [DOI] [PMC free article] [PubMed] [Google Scholar]
- Cabantous S.; Nguyen H. B.; Pedelacq J.-D.; Koraïchi F.; Chaudhary A.; Ganguly K.; Lockard M. A.; Favre G.; Terwilliger T. C.; Waldo G. S. A New Protein-Protein Interaction Sensor Based on Tripartite Split-GFP Association. Sci. Rep. 2013, 3, 2854. 10.1038/srep02854. [DOI] [PMC free article] [PubMed] [Google Scholar]
- Guerreiro M. R.; Fernandes A. R.; Coroadinha A. S. Coroadinha, A. S. Evaluation of Structurally Distorted Split GFP Fluorescent Sensors for Cell-Based Detection of Viral Proteolytic Activity. Sensors (Basel) 2021, 21, 24. 10.3390/s21010024. [DOI] [PMC free article] [PubMed] [Google Scholar]
- Shen J.; Zhang W.; Gan C.; Wei X.; Li J.; Sun Y.; Yuan Y.; Cai X.; Long Q.; Cui J.; et al. Strategies to Improve the Fluorescent Signal of the Tripartite SfGFP System. Acta Biochim. Biophys. Sin. (Shanghai) 2020, 52, 998–1006. 10.1093/abbs/gmaa073. [DOI] [PubMed] [Google Scholar]
- Shcherbakova D. M.; Baloban M.; Verkhusha V. V. Near-Infrared Fluorescent Proteins Engineered from Bacterial Phytochromes. Curr. Opin. Chem. Biol. 2015, 27, 52–63. 10.1016/j.cbpa.2015.06.005. [DOI] [PMC free article] [PubMed] [Google Scholar]
- Matlashov M. E.; Shcherbakova D. M.; Alvelid J.; Baloban M.; Pennacchietti F.; Shemetov A. A.; Testa I.; Verkhusha V. V. A Set of Monomeric Near-Infrared Fluorescent Proteins for Multicolor Imaging across Scales. Nat. Commun. 2020, 11, 239. 10.1038/s41467-019-13897-6. [DOI] [PMC free article] [PubMed] [Google Scholar]
- Griffin B. A.; Adams S. R.; Tsien R. Y. Specific Covalent Labeling of Recombinant Protein Molecules inside Live Cells. Science 1998, 281, 269–272. 10.1126/science.281.5374.269. [DOI] [PubMed] [Google Scholar]
- Keppler A.; Kindermann M.; Gendreizig S.; Pick H.; Vogel H.; Johnsson K. Labeling of Fusion Proteins of O6-Alkylguanine-DNA Alkyltransferase with Small Molecules in Vivo and in Vitro. Methods 2004, 32, 437–444. 10.1016/j.ymeth.2003.10.007. [DOI] [PubMed] [Google Scholar]
- Keppler A.; Pick H.; Arrivoli C.; Vogel H.; Johnsson K. Labeling of Fusion Proteins with Synthetic Fluorophores in Live Cells. Proc. Natl. Acad. Sci. U.S.A. 2004, 101, 9955–9959. 10.1073/pnas.0401923101. [DOI] [PMC free article] [PubMed] [Google Scholar]
- Plamont M.-A.; Billon-Denis E.; Maurin S.; Gauron C.; Pimenta F. M.; Specht C. G.; Shi J.; Quérard J.; Pan B.; Rossignol J.; et al. Small Fluorescence-Activating and Absorption-Shifting Tag for Tunable Protein Imaging in Vivo. Proc. Natl. Acad. Sci. U.S.A. 2016, 113, 497–502. 10.1073/pnas.1513094113. [DOI] [PMC free article] [PubMed] [Google Scholar]
- Miller L. W.; Cai Y.; Sheetz M. P.; Cornish V. W. In Vivo Protein Labeling with Trimethoprim Conjugates: A Flexible Chemical Tag. Nat. Methods 2005, 2, 255–257. 10.1038/nmeth749. [DOI] [PubMed] [Google Scholar]
- Los G. V.; Encell L. P.; McDougall M. G.; Hartzell D. D.; Karassina N.; Zimprich C.; Wood M. G.; Learish R.; Ohana R. F.; Urh M.; et al. HaloTag: A Novel Protein Labeling Technology for Cell Imaging and Protein Analysis. ACS Chem. Biol. 2008, 3, 373–382. 10.1021/cb800025k. [DOI] [PubMed] [Google Scholar]
- Cook A.; Walterspiel F.; Deo C. HaloTag-Based Reporters for Fluorescence Imaging and Biosensing. Chembiochem 2023, 24, e202300022. 10.1002/cbic.202300022. [DOI] [PubMed] [Google Scholar]
- Adams S. T.; Miller S. C. Enzymatic Promiscuity and the Evolution of Bioluminescence. FEBS J. 2020, 287, 1369. 10.1111/febs.15176. [DOI] [PMC free article] [PubMed] [Google Scholar]
- White E. H.; McCapra F.; Field G. F. The Structure and Synthesis of Firefly Luciferin. J. Am. Chem. Soc. 1963, 85, 337–343. 10.1021/ja00886a019. [DOI] [Google Scholar]
- Hall M. P.; Unch J.; Binkowski B. F.; Valley M. P.; Butler B. L.; Wood M. G.; Otto P.; Zimmerman K.; Vidugiris G.; Machleidt T.; et al. Engineered Luciferase Reporter from a Deep Sea Shrimp Utilizing a Novel Imidazopyrazinone Substrate. ACS Chem. Biol. 2012, 7, 1848–1857. 10.1021/cb3002478. [DOI] [PMC free article] [PubMed] [Google Scholar]
- Loening A. M.; Fenn T. D.; Wu A. M.; Gambhir S. S. Consensus Guided Mutagenesis of Renilla Luciferase Yields Enhanced Stability and Light Output. Protein Eng. Des. Sel. 2006, 19, 391–400. 10.1093/protein/gzl023. [DOI] [PubMed] [Google Scholar]
- Syed A. J.; Anderson J. C. Applications of Bioluminescence in Biotechnology and Beyond. Chem. Soc. Rev. 2021, 50, 5668–5705. 10.1039/D0CS01492C. [DOI] [PubMed] [Google Scholar]
- Yeh H.-W.; Ai H.-W. Development and Applications of Bioluminescent and Chemiluminescent Reporters and Biosensors. Annu. Rev. Anal. Chem. (Palo Alto, Calif.) 2019, 12, 129–150. 10.1146/annurev-anchem-061318-115027. [DOI] [PMC free article] [PubMed] [Google Scholar]
- Hellweg L.; Edenhofer A.; Barck L.; Huppertz M.-C.; Frei M. S.; Tarnawski M.; Bergner A.; Koch B.; Johnsson K.; Hiblot J. A General Method for the Development of Multicolor Biosensors with Large Dynamic Ranges. Nat. Chem. Biol. 2023, 19, 1147–1157. 10.1038/s41589-023-01350-1. [DOI] [PMC free article] [PubMed] [Google Scholar]
- Elowitz M. B.; Levine A. J.; Siggia E. D.; Swain P. S. Stochastic Gene Expression in a Single Cell. Science 2002, 297, 1183–1186. 10.1126/science.1070919. [DOI] [PubMed] [Google Scholar]
- Rahman S. M. T.; Aqdas M.; Martin E. W.; Tomassoni Ardori F.; Songkiatisak P.; Oh K.-S.; Uderhardt S.; Yun S.; Claybourne Q. C.; McDevitt R. A.; et al. Double Knockin Mice Show NF-ΚB Trajectories in Immune Signaling and Aging. Cell Rep. 2022, 41, 111682. 10.1016/j.celrep.2022.111682. [DOI] [PMC free article] [PubMed] [Google Scholar]
- Gerlitz N.; Gerum R.; Sauer N.; Stadler R. Photoinducible DRONPA-s: A New Tool for Investigating Cell-Cell Connectivity. Plant Journal 2018, 94, 751–766. 10.1111/tpj.13918. [DOI] [PubMed] [Google Scholar]
- Jimenez L.; Mayoral-Varo V.; Amenábar C.; Ortega J.; Sequeira J. G. N.; Machuqueiro M.; Mourato C.; Silvestri R.; Angeli A.; Carta F.; et al. Multiplexed Cellular Profiling Identifies an Organoselenium Compound as an Inhibitor of CRM1-Mediated Nuclear Export. Traffic 2022, 23, 587–599. 10.1111/tra.12872. [DOI] [PMC free article] [PubMed] [Google Scholar]
- Kerppola T. K. Bimolecular Fluorescence Complementation (BiFC) Analysis as a Probe of Protein Interactions in Living Cells. Annu. Rev. Biophys. 2008, 37, 465–487. 10.1146/annurev.biophys.37.032807.125842. [DOI] [PMC free article] [PubMed] [Google Scholar]
- Hu C.-D.; Chinenov Y.; Kerppola T. K. Visualization of Interactions among BZIP and Rel Family Proteins in Living Cells Using Bimolecular Fluorescence Complementation. Mol. Cell 2002, 9, 789–798. 10.1016/S1097-2765(02)00496-3. [DOI] [PubMed] [Google Scholar]
- Chen M.; Yan C.; Ma Y.; Zhang X.-E. A Tandem Near-Infrared Fluorescence Complementation System with Enhanced Fluorescence for Imaging Protein-Protein Interactions in Vivo. Biomaterials 2021, 268, 120544. 10.1016/j.biomaterials.2020.120544. [DOI] [PubMed] [Google Scholar]
- Chen M.; Yan C.; Zheng L.; Zhang X.-E. The Smallest Near-Infrared Fluorescence Complementation System for Imaging Protein-Protein and RNA-Protein Interactions. Chem. Sci. 2022, 13, 1119–1129. 10.1039/D1SC04839B. [DOI] [PMC free article] [PubMed] [Google Scholar]
- Oliinyk O. S.; Shemetov A. A.; Pletnev S.; Shcherbakova D. M.; Verkhusha V. V. Smallest Near-Infrared Fluorescent Protein Evolved from Cyanobacteriochrome as Versatile Tag for Spectral Multiplexing. Nat. Commun. 2019, 10, 279. 10.1038/s41467-018-08050-8. [DOI] [PMC free article] [PubMed] [Google Scholar]
- Hertel F.; Mo G. C. H.; Duwé S.; Dedecker P.; Zhang J. RefSOFI for Mapping Nanoscale Organization of Protein-Protein Interactions in Living Cells. Cell Rep. 2016, 14, 390–400. 10.1016/j.celrep.2015.12.036. [DOI] [PMC free article] [PubMed] [Google Scholar]
- Wang S.; Ding M.; Chen X.; Chang L.; Sun Y. Development of Bimolecular Fluorescence Complementation Using RsEGFP2 for Detection and Super-Resolution Imaging of Protein-Protein Interactions in Live Cells. Biomed. Opt. Express 2017, 8, 3119–3131. 10.1364/BOE.8.003119. [DOI] [PMC free article] [PubMed] [Google Scholar]
- Bischof J.; Duffraisse M.; Furger E.; Ajuria L.; Giraud G.; Vanderperre S.; Paul R.; Bjorklund M.; Ahr D.; Ahmed A. W; Spinelli L.; Brun C.; Basler K.; Merabet S. Generation of a Versatile BiFC ORFeome Library for Analyzing Protein-Protein Interactions in Live Drosophila. Elife 2018, 7, e38853. 10.7554/eLife.38853. [DOI] [PMC free article] [PubMed] [Google Scholar]
- Wang S.; Ding M.; Xue B.; Hou Y.; Sun Y. Live Cell Visualization of Multiple Protein-Protein Interactions with BiFC Rainbow. ACS Chem. Biol. 2018, 13, 1180–1188. 10.1021/acschembio.7b00931. [DOI] [PubMed] [Google Scholar]
- Singh A. K.; Abdullahi A.; Soller M.; David A.; Brogna S. Visualisation of Ribosomes in Drosophila Axons Using Ribo-BiFC. Biol. Open 2019, 8, 047233. 10.1242/bio.047233. [DOI] [PMC free article] [PubMed] [Google Scholar]
- Bagher A. M.; Kelly M. E. M.; Denovan-Wright E. M. Combining SRET2 and BiFC to Study GPCR Heteromerization and Protein-Protein Interactions. Methods Mol. Biol. 2019, 1947, 199–215. 10.1007/978-1-4939-9121-1_11. [DOI] [PubMed] [Google Scholar]
- Doyle T. B.; Muntean B. S.; Ejendal K. F.; Hayes M. P.; Soto-Velasquez M.; Martemyanov K. A.; Dessauer C. W.; Hu C.-D.; Watts V. J. Identification of Novel Adenylyl Cyclase 5 (AC5) Signaling Networks in D1 and D2Medium Spiny Neurons Using Bimolecular Fluorescence Complementation Screening. Cells 2019, 8, 1468. 10.3390/cells8111468. [DOI] [PMC free article] [PubMed] [Google Scholar]
- Jia Y.; Reboulet J.; Gillet B.; Hughes S.; Forcet C.; Tribollet V.; Hajj Sleiman N.; Kundlacz C.; Vanacker J.-M.; Bleicher F.; Merabet S. A Live Cell Protein Complementation Assay for ORFeome-Wide Probing of Human HOX Interactomes. Cells 2023, 12, 200. 10.3390/cells12010200. [DOI] [PMC free article] [PubMed] [Google Scholar]
- Zhou B.; Zhang X.; Wang G.; Barbour K. W.; Berger F. G.; Wang Q. Drug Screening Assay Based on the Interaction of Intact Keap1 and Nrf2 Proteins in Cancer Cells. Bioorg. Med. Chem. 2019, 27, 92–99. 10.1016/j.bmc.2018.11.019. [DOI] [PubMed] [Google Scholar]
- Lin T.; Scott B. L.; Hoppe A. D.; Chakravarty S. FRETting about the Affinity of Bimolecular Protein-Protein Interactions. Protein Sci. 2018, 27, 1850–1856. 10.1002/pro.3482. [DOI] [PMC free article] [PubMed] [Google Scholar]
- Sobakinskaya E.; Schmidt Am Busch M.; Renger T. Theory of FRET “Spectroscopic Ruler” for Short Distances: Application to Polyproline. J. Phys. Chem. B 2018, 122, 54–67. 10.1021/acs.jpcb.7b09535. [DOI] [PMC free article] [PubMed] [Google Scholar]
- Bajar B. T.; Wang E. S.; Zhang S.; Lin M. Z.; Chu J. A Guide to Fluorescent Protein FRET Pairs. Sensors (Basel) 2016, 16, 1488. 10.3390/s16091488. [DOI] [PMC free article] [PubMed] [Google Scholar]
- Yengo C. M.; Berger C. L. Fluorescence Anisotropy and Resonance Energy Transfer: Powerful Tools for Measuring Real Time Protein Dynamics in a Physiological Environment. Curr. Opin. Pharmacol. 2010, 10, 731–737. 10.1016/j.coph.2010.09.013. [DOI] [PMC free article] [PubMed] [Google Scholar]
- Liput D. J.; Nguyen T. A.; Augustin S. M.; Lee J. O.; Vogel S. S. A Guide to Fluorescence Lifetime Microscopy and Förster’s Resonance Energy Transfer in Neuroscience. Curr Protoc. Neurosci. 2020, 94, e108. 10.1002/cpns.108. [DOI] [PMC free article] [PubMed] [Google Scholar]
- Datta R.; Heaster T. M.; Sharick J. T.; Gillette A. A.; Skala M. C. Fluorescence Lifetime Imaging Microscopy: Fundamentals and Advances in Instrumentation, Analysis, and Applications. J. Biomed. Opt. 2020, 25, 1–43. 10.1117/1.JBO.25.7.071203. [DOI] [PMC free article] [PubMed] [Google Scholar]
- Wu G.; Yang F.; Cheng X.; Mai Z.; Wang X.; Chen T. Live-Cell Imaging Analysis on the Anti-Apoptotic Function of the Bcl-XL Transmembrane Carboxyl Terminal Domain. Biochem. Biophys. Res. Commun. 2023, 639, 91–99. 10.1016/j.bbrc.2022.11.104. [DOI] [PubMed] [Google Scholar]
- Ghalali A.; Rice J. M.; Kusztos A.; Jernigan F. E.; Zetter B. R.; Rogers M. S. Developing a Novel FRET Assay, Targeting the Binding between Antizyme-AZIN. Sci. Rep. 2019, 9, 4632. 10.1038/s41598-019-40929-4. [DOI] [PMC free article] [PubMed] [Google Scholar]
- Shakoori A. R.Fluorescence in Situ Hybridization (FISH) and Its Applications. In Chromosome Structure and Aberrations; Bhat T. A., Wani A. A., Eds.; Springer India: New Delhi, 2017; pp 343–367. [Google Scholar]
- Chen W.; Zhao X.; Yang N.; Li X. Single MRNA Imaging with Fluorogenic RNA Aptamers and Small-Molecule Fluorophores. Angew. Chem., Int. Ed. 2023, 62, e202209813. 10.1002/anie.202209813. [DOI] [PubMed] [Google Scholar]
- Lu S.; Hou Y.; Zhang X.-E.; Gao Y. Live Cell Imaging of DNA and RNA with Fluorescent Signal Amplification and Background Reduction Techniques. Front. Cell Dev. Biol. 2023, 11, 1216232. 10.3389/fcell.2023.1216232. [DOI] [PMC free article] [PubMed] [Google Scholar]
- Jin X.; Hapsari N. D.; Lee S.; Jo K. DNA Binding Fluorescent Proteins as Single-Molecule Probes. Analyst 2020, 145, 4079–4095. 10.1039/D0AN00218F. [DOI] [PubMed] [Google Scholar]
- Takahashi S.; Oshige M.; Katsura S.; Nagahara Y. A New Fluorescence Labeling Method for Molecular Analysis of Double-Stranded DNA. Anal. Biochem. 2023, 662, 115000. 10.1016/j.ab.2022.115000. [DOI] [PubMed] [Google Scholar]
- Delker R. K.; Munce R. H.; Hu M.; Mann R. S. Fluorescent Labeling of Genomic Loci in Drosophila Imaginal Discs with Heterologous DNA-Binding Proteins. Cell Rep. Methods 2022, 2, 100175. 10.1016/j.crmeth.2022.100175. [DOI] [PMC free article] [PubMed] [Google Scholar]
- Nunes V.; Dantas M.; Lima J. T.; Ferreira J. G. High-Resolution Analysis of Centrosome Behavior During Mitosis. Methods Mol. Biol. 2021, 2329, 179–194. 10.1007/978-1-0716-1538-6_13. [DOI] [PubMed] [Google Scholar]
- Chen B.; Gilbert L. A.; Cimini B. A.; Schnitzbauer J.; Zhang W.; Li G.-W.; Park J.; Blackburn E. H.; Weissman J. S.; Qi L. S.; et al. Dynamic Imaging of Genomic Loci in Living Human Cells by an Optimized CRISPR/Cas System. Cell 2013, 155, 1479–1491. 10.1016/j.cell.2013.12.001. [DOI] [PMC free article] [PubMed] [Google Scholar]
- Peng Q.; Huang Z.; Sun K.; Liu Y.; Yoon C. W.; Harrison R. E. S.; Schmitt D. L.; Zhu L.; Wu Y.; Tasan I.; Zhao H.; Zhang J.; Zhong S.; Chien S.; Wang Y. Engineering Inducible Biomolecular Assemblies for Genome Imaging and Manipulation in Living Cells. Nat. Commun. 2022, 13, 7933. 10.1038/s41467-022-35504-x. [DOI] [PMC free article] [PubMed] [Google Scholar]
- Sato H.; Das S.; Singer R. H.; Vera M. Imaging of DNA and RNA in Living Eukaryotic Cells to Reveal Spatiotemporal Dynamics of Gene Expression. Annu. Rev. Biochem. 2020, 89, 159–187. 10.1146/annurev-biochem-011520-104955. [DOI] [PMC free article] [PubMed] [Google Scholar]
- Lu X.; Kong K. Y. S.; Unrau P. J. Harmonizing the Growing Fluorogenic RNA Aptamer Toolbox for RNA Detection and Imaging. Chem. Soc. Rev. 2023, 52, 4071–4098. 10.1039/D3CS00030C. [DOI] [PubMed] [Google Scholar]
- Bertrand E.; Chartrand P.; Schaefer M.; Shenoy S. M.; Singer R. H.; Long R. M. Localization of ASH1MRNA Particles in Living Yeast. Mol. Cell 1998, 2, 437–445. 10.1016/S1097-2765(00)80143-4. [DOI] [PubMed] [Google Scholar]
- Coleman R. A.; Liu Z.; Darzacq X.; Tjian R.; Singer R. H.; Lionnet T. Imaging Transcription: Past, Present, and Future. Cold Spring Harb. Symp. Quant. Biol. 2015, 80, 1–8. 10.1101/sqb.2015.80.027201. [DOI] [PMC free article] [PubMed] [Google Scholar]
- Williams C. G.; Lee H. J.; Asatsuma T.; Vento-Tormo R.; Haque A. An Introduction to Spatial Transcriptomics for Biomedical Research. Genome Med. 2022, 14, 68. 10.1186/s13073-022-01075-1. [DOI] [PMC free article] [PubMed] [Google Scholar]
- Govindaraj K.; Post J. N. Using FRAP to Quantify Changes in Transcription Factor Dynamics after Cell Stimulation: Cell Culture, FRAP, Data Analysis, and Visualization. Methods Mol. Biol. 2021, 2221, 109–139. 10.1007/978-1-0716-0989-7_9. [DOI] [PubMed] [Google Scholar]
- Voss T. C.; Schiltz R. L.; Sung M.-H.; Yen P. M.; Stamatoyannopoulos J. A.; Biddie S. C.; Johnson T. A.; Miranda T. B.; John S.; Hager G. L. Dynamic Exchange at Regulatory Elements during Chromatin Remodeling Underlies Assisted Loading Mechanism. Cell 2011, 146, 544–554. 10.1016/j.cell.2011.07.006. [DOI] [PMC free article] [PubMed] [Google Scholar]
- Chen J.; Zhang Z.; Li L.; Chen B.-C.; Revyakin A.; Hajj B.; Legant W.; Dahan M.; Lionnet T.; Betzig E.; et al. Single-Molecule Dynamics of Enhanceosome Assembly in Embryonic Stem Cells. Cell 2014, 156, 1274–1285. 10.1016/j.cell.2014.01.062. [DOI] [PMC free article] [PubMed] [Google Scholar]
- Peabody D. S. The RNA Binding Site of Bacteriophage MS2 Coat Protein. EMBO J. 1993, 12, 595–600. 10.1002/j.1460-2075.1993.tb05691.x. [DOI] [PMC free article] [PubMed] [Google Scholar]
- Tutucci E.; Vera M.; Biswas J.; Garcia J.; Parker R.; Singer R. H. An Improved MS2 System for Accurate Reporting of the MRNA Life Cycle. Nat. Methods 2018, 15, 81–89. 10.1038/nmeth.4502. [DOI] [PMC free article] [PubMed] [Google Scholar]
- Nwokafor C.; Singer R. H.; Lim H. Imaging Cell-Type-Specific Dynamics of MRNAs in Living Mouse Brain. Methods 2019, 157, 100–105. 10.1016/j.ymeth.2018.07.009. [DOI] [PMC free article] [PubMed] [Google Scholar]
- Larson D. R.; Zenklusen D.; Wu B.; Chao J. A.; Singer R. H. Real-Time Observation of Transcription Initiation and Elongation on an Endogenous Yeast Gene. Science 2011, 332, 475–478. 10.1126/science.1202142. [DOI] [PMC free article] [PubMed] [Google Scholar]
- Alamos S.; Reimer A.; Niyogi K. K.; Garcia H. G. Quantitative Imaging of RNA Polymerase II Activity in Plants Reveals the Single-Cell Basis of Tissue-Wide Transcriptional Dynamics. Nat. Plants 2021, 7, 1037–1049. 10.1038/s41477-021-00976-0. [DOI] [PMC free article] [PubMed] [Google Scholar]
- Wang S.; Su J.-H.; Zhang F.; Zhuang X. An RNA-Aptamer-Based Two-Color CRISPR Labeling System. Sci. Rep. 2016, 6, 26857. 10.1038/srep26857. [DOI] [PMC free article] [PubMed] [Google Scholar]
- Hocine S.; Raymond P.; Zenklusen D.; Chao J. A.; Singer R. H. Single-Molecule Analysis of Gene Expression Using Two-Color RNA Labeling in Live Yeast. Nat. Methods 2013, 10, 119–121. 10.1038/nmeth.2305. [DOI] [PMC free article] [PubMed] [Google Scholar]
- Halstead J. M.; Lionnet T.; Wilbertz J. H.; Wippich F.; Ephrussi A.; Singer R. H.; Chao J. A. Translation. An RNA Biosensor for Imaging the First Round of Translation from Single Cells to Living Animals. Science 2015, 347, 1367–1671. 10.1126/science.aaa3380. [DOI] [PMC free article] [PubMed] [Google Scholar]
- Morisaki T.; Lyon K.; DeLuca K. F.; DeLuca J. G.; English B. P.; Zhang Z.; Lavis L. D.; Grimm J. B.; Viswanathan S.; Looger L. L.; et al. Real-Time Quantification of Single RNA Translation Dynamics in Living Cells. Science 2016, 352, 1425–1429. 10.1126/science.aaf0899. [DOI] [PubMed] [Google Scholar]
- Tanenbaum M. E.; Gilbert L. A.; Qi L. S.; Weissman J. S.; Vale R. D. A Protein-Tagging System for Signal Amplification in Gene Expression and Fluorescence Imaging. Cell 2014, 159, 635–646. 10.1016/j.cell.2014.09.039. [DOI] [PMC free article] [PubMed] [Google Scholar]
- Wang C.; Han B.; Zhou R.; Zhuang X. Real-Time Imaging of Translation on Single MRNA Transcripts in Live Cells. Cell 2016, 165, 990–1001. 10.1016/j.cell.2016.04.040. [DOI] [PMC free article] [PubMed] [Google Scholar]
- Wu B.; Eliscovich C.; Yoon Y. J.; Singer R. H. Translation Dynamics of Single MRNAs in Live Cells and Neurons. Science 2016, 352, 1430–1435. 10.1126/science.aaf1084. [DOI] [PMC free article] [PubMed] [Google Scholar]
- Yan X.; Hoek T. A.; Vale R. D.; Tanenbaum M. E. Dynamics of Translation of Single MRNA Molecules In Vivo. Cell 2016, 165, 976–989. 10.1016/j.cell.2016.04.034. [DOI] [PMC free article] [PubMed] [Google Scholar]
- Uray I. P.; Uray K. Mechanotransduction at the Plasma Membrane-Cytoskeleton Interface. Int. J. Mol. Sci. 2021, 22, 11566. 10.3390/ijms222111566. [DOI] [PMC free article] [PubMed] [Google Scholar]
- Calizo R. C.; Bell M. K.; Ron A.; Hu M.; Bhattacharya S.; Wong N. J.; Janssen W. G. M.; Perumal G.; Pederson P.; Scarlata S.; Hone J.; Azeloglu E. U.; Rangamani P.; Iyengar R. Cell Shape Regulates Subcellular Organelle Location to Control Early Ca2+ Signal Dynamics in Vascular Smooth Muscle Cells. Sci. Rep. 2020, 10, 17866. 10.1038/s41598-020-74700-x. [DOI] [PMC free article] [PubMed] [Google Scholar]
- Passmore J. B.; Nijenhuis W.; Kapitein L. C. From Observing to Controlling: Inducible Control of Organelle Dynamics and Interactions. Curr. Opin. Cell Biol. 2021, 71, 69–76. 10.1016/j.ceb.2021.02.002. [DOI] [PubMed] [Google Scholar]
- Duan X.; Li Y.; Yi K.; Guo F.; Wang H.; Wu P.-H.; Yang J.; Mair D. B.; Morales E. A.; Kalab P.; Wirtz D.; Sun S. X.; Li R. Dynamic Organelle Distribution Initiates Actin-Based Spindle Migration in Mouse Oocytes. Nat. Commun. 2020, 11, 277. 10.1038/s41467-019-14068-3. [DOI] [PMC free article] [PubMed] [Google Scholar]
- Clemente-Suárez V. J.; Martín-Rodríguez A.; Yáñez-Sepúlveda R.; Tornero-Aguilera J. F. Mitochondrial Transfer as a Novel Therapeutic Approach in Disease Diagnosis and Treatment. Int. J. Mol. Sci. 2023, 24, 8848. 10.3390/ijms24108848. [DOI] [PMC free article] [PubMed] [Google Scholar]
- Taiko I.; Takano C.; Nomoto M.; Hayashida S.; Kanemaru K.; Miki T. Selection of Red Fluorescent Protein for Genetic Labeling of Mitochondria and Intercellular Transfer of Viable Mitochondria. Sci. Rep. 2022, 12, 19841. 10.1038/s41598-022-24297-0. [DOI] [PMC free article] [PubMed] [Google Scholar]
- Li Y.-Q.; Sueda S.; Kondo H.; Kawarabayasi Y. A Unique Biotin Carboxyl Carrier Protein in Archaeon Sulfolobus Tokodaii. FEBS Lett. 2006, 580, 1536–1540. 10.1016/j.febslet.2006.01.083. [DOI] [PubMed] [Google Scholar]
- Sueda S.; Tanaka H.; Yamagishi M. A Biotin-Based Protein Tagging System. Anal. Biochem. 2009, 393, 189–195. 10.1016/j.ab.2009.06.027. [DOI] [PubMed] [Google Scholar]
- Taniyama T.; Sueda S. Fluorescent Labeling of the Nuclear Envelope without Relying on Inner Nuclear Membrane Proteins. Methods Mol. Biol. 2021, 2274, 3–14. 10.1007/978-1-0716-1258-3_1. [DOI] [PubMed] [Google Scholar]
- Nishi S.; Yamamoto C.; Yoneda S.; Sueda S. Labeling of Cytoskeletal Proteins in Living Cells Using Biotin Ligase Carrying a Fluorescent Protein. Anal. Sci. 2017, 33, 897–902. 10.2116/analsci.33.897. [DOI] [PubMed] [Google Scholar]
- Perfilov M. M.; Gurskaya N. G.; Serebrovskaya E. O.; Melnikov P. A.; Kharitonov S. L.; Lewis T. R.; Arshavsky V. Y.; Baklaushev V. P.; Mishin A. S.; Lukyanov K. A. Highly Photostable Fluorescent Labeling of Proteins in Live Cells Using Exchangeable Coiled Coils Heterodimerization. Cell. Mol. Life Sci. 2020, 77, 4429–4440. 10.1007/s00018-019-03426-5. [DOI] [PMC free article] [PubMed] [Google Scholar]
- Scorrano L.; De Matteis M. A.; Emr S.; Giordano F.; Hajnoczky G.; Kornmann B.; Lackner L. L.; Levine T. P.; Pellegrini L.; Reinisch K.; Rizzuto R.; Simmen T.; Stenmark H.; Ungermann C.; Schuldiner M. Coming Together to Define Membrane Contact Sites. Nat. Commun. 2019, 10, 1287. 10.1038/s41467-019-09253-3. [DOI] [PMC free article] [PubMed] [Google Scholar]
- Eisenberg-Bord M.; Shai N.; Schuldiner M.; Bohnert M. A Tether Is a Tether Is a Tether: Tethering at Membrane Contact Sites. Dev. Cell 2016, 39, 395–409. 10.1016/j.devcel.2016.10.022. [DOI] [PubMed] [Google Scholar]
- Harmon M.; Larkman P.; Hardingham G.; Jackson M.; Skehel P. A Bi-Fluorescence Complementation System to Detect Associations between the Endoplasmic Reticulum and Mitochondria. Sci. Rep. 2017, 7, 17467. 10.1038/s41598-017-17278-1. [DOI] [PMC free article] [PubMed] [Google Scholar]
- Schröter S.; Beckmann S.; Schmitt H. D. ER Arrival Sites for COPI Vesicles Localize to Hotspots of Membrane Trafficking. EMBO J. 2016, 35, 1935–1955. 10.15252/embj.201592873. [DOI] [PMC free article] [PubMed] [Google Scholar]
- Venditti R.; Rega L. R.; Masone M. C.; Santoro M.; Polishchuk E.; Sarnataro D.; Paladino S.; D’Auria S.; Varriale A.; Olkkonen V. M.; et al. Molecular Determinants of ER-Golgi Contacts Identified through a New FRET-FLIM System. J. Cell Biol. 2019, 218, 1055–1065. 10.1083/jcb.201812020. [DOI] [PMC free article] [PubMed] [Google Scholar]
- Ichikawa S.; Kato S.; Fujii Y.; Ishikawa K.; Numata K.; Kodama Y. Organellar Glue: A Molecular Tool to Artificially Control Chloroplast-Chloroplast Interactions. ACS Synth. Biol. 2022, 11, 3190–3197. 10.1021/acssynbio.2c00367. [DOI] [PMC free article] [PubMed] [Google Scholar]
- Ishikawa K.; Kobayashi M.; Kusano M.; Numata K.; Kodama Y. Using the Organelle Glue Technique to Engineer the Plant Cell Metabolome. Plant Cell Rep. 2023, 42, 599–607. 10.1007/s00299-023-02982-2. [DOI] [PubMed] [Google Scholar]
- Armingol E.; Officer A.; Harismendy O.; Lewis N. E. Deciphering Cell-Cell Interactions and Communication from Gene Expression. Nat. Rev. Genet. 2021, 22, 71–88. 10.1038/s41576-020-00292-x. [DOI] [PMC free article] [PubMed] [Google Scholar]
- Kim J.; Zhao T.; Petralia R. S.; Yu Y.; Peng H.; Myers E.; Magee J. C. MGRASP Enables Mapping Mammalian Synaptic Connectivity with Light Microscopy. Nat. Methods 2012, 9, 96–102. 10.1038/nmeth.1784. [DOI] [PMC free article] [PubMed] [Google Scholar]
- Tsetsenis T.; Boucard A. A.; Araç D.; Brunger A. T.; Südhof T. C. Direct Visualization of Trans-Synaptic Neurexin-Neuroligin Interactions during Synapse Formation. J. Neurosci. 2014, 34, 15083–15096. 10.1523/JNEUROSCI.0348-14.2014. [DOI] [PMC free article] [PubMed] [Google Scholar]
- Livet J.; Weissman T. A.; Kang H.; Draft R. W.; Lu J.; Bennis R. A.; Sanes J. R.; Lichtman J. W. Transgenic Strategies for Combinatorial Expression of Fluorescent Proteins in the Nervous System. Nature 2007, 450, 56–62. 10.1038/nature06293. [DOI] [PubMed] [Google Scholar]
- Ombrato L.; Nolan E.; Kurelac I.; Mavousian A.; Bridgeman V. L.; Heinze I.; Chakravarty P.; Horswell S.; Gonzalez-Gualda E.; Matacchione G.; et al. Metastatic-Niche Labelling Reveals Parenchymal Cells with Stem Features. Nature 2019, 572, 603–608. 10.1038/s41586-019-1487-6. [DOI] [PMC free article] [PubMed] [Google Scholar]
- Joyner A. L. From Cloning Neural Development Genes to Functional Studies in Mice, 30 Years of Advancements. Curr. Top. Dev. Biol. 2016, 116, 501–515. 10.1016/bs.ctdb.2015.11.035. [DOI] [PubMed] [Google Scholar]
- Wilkinson E. L.; Brennan L. C.; Harrison O. J.; Crane-Smith Z.; Gautier P.; Keighren M. A.; Budd P.; Swaminathan K.; Machesky L. M.; Allinson S. L.; et al. Genetically Engineered Multicistronic Allele of Pmel Yielding Highly Specific CreERT2-Mediated Recombination in the Melanocyte Lineage. Pigment Cell Melanoma Res. 2023, 36, 71–77. 10.1111/pcmr.13076. [DOI] [PMC free article] [PubMed] [Google Scholar]
- Maetzig T.; Lieske A.; Dörpmund N.; Rothe M.; Kleppa M.-J.; Dziadek V.; Hassan J. J.; Dahlke J.; Borchert D.; Schambach A. Real-Time Characterization of Clonal Fate Decisions in Complex Leukemia Samples by Fluorescent Genetic Barcoding. Cells 2022, 11, 4045. 10.3390/cells11244045. [DOI] [PMC free article] [PubMed] [Google Scholar]
- Mohme M.; Maire C. L.; Riecken K.; Zapf S.; Aranyossy T.; Westphal M.; Lamszus K.; Fehse B. Optical Barcoding for Single-Clone Tracking to Study Tumor Heterogeneity. Mol. Ther. 2017, 25, 621–633. 10.1016/j.ymthe.2016.12.014. [DOI] [PMC free article] [PubMed] [Google Scholar]
- Maire C. L.; Mohme M.; Bockmayr M.; Fita K. D.; Riecken K.; Börnigen D.; Alawi M.; Failla A.; Kolbe K.; Zapf S.; et al. Glioma Escape Signature and Clonal Development under Immune Pressure. J. Clin. Invest. 2020, 130, 5257–5271. 10.1172/JCI138760. [DOI] [PMC free article] [PubMed] [Google Scholar]
- Montecinos-Franjola F.; Lin J. Y.; Rodriguez E. A. Fluorescent Proteins for in Vivo Imaging, Where’s the Biliverdin?. Biochem. Soc. Trans. 2020, 48, 2657–2667. 10.1042/BST20200444. [DOI] [PubMed] [Google Scholar]
- Shcherbo D.; Merzlyak E. M.; Chepurnykh T. V.; Fradkov A. F.; Ermakova G. V.; Solovieva E. A.; Lukyanov K. A.; Bogdanova E. A.; Zaraisky A. G.; Lukyanov S.; et al. Bright Far-Red Fluorescent Protein for Whole-Body Imaging. Nat. Methods 2007, 4, 741–746. 10.1038/nmeth1083. [DOI] [PubMed] [Google Scholar]
- Shcherbakova D. M.; Baloban M.; Emelyanov A. V.; Brenowitz M.; Guo P.; Verkhusha V. V. Bright Monomeric Near-Infrared Fluorescent Proteins as Tags and Biosensors for Multiscale Imaging. Nat. Commun. 2016, 7, 12405. 10.1038/ncomms12405. [DOI] [PMC free article] [PubMed] [Google Scholar]
- Yu D.; Baird M. A.; Allen J. R.; Howe E. S.; Klassen M. P.; Reade A.; Makhijani K.; Song Y.; Liu S.; Murthy Z.; et al. A Naturally Monomeric Infrared Fluorescent Protein for Protein Labeling in Vivo. Nat. Methods 2015, 12, 763–765. 10.1038/nmeth.3447. [DOI] [PMC free article] [PubMed] [Google Scholar]
- Filonov G. S.; Piatkevich K. D.; Ting L.-M.; Zhang J.; Kim K.; Verkhusha V. V. Bright and Stable Near-Infrared Fluorescent Protein for in Vivo Imaging. Nat. Biotechnol. 2011, 29, 757–761. 10.1038/nbt.1918. [DOI] [PMC free article] [PubMed] [Google Scholar]
- Rodriguez E. A.; Tran G. N.; Gross L. A.; Crisp J. L.; Shu X.; Lin J. Y.; Tsien R. Y. A Far-Red Fluorescent Protein Evolved from a Cyanobacterial Phycobiliprotein. Nat. Methods 2016, 13, 763–769. 10.1038/nmeth.3935. [DOI] [PMC free article] [PubMed] [Google Scholar]
- Kong Y.; Cirillo J. D. Fluorescence Imaging of Mycobacterial Infection in Live Mice Using Fluorescent Protein-Expressing Strains. Methods Mol. Biol. 2018, 1790, 75–85. 10.1007/978-1-4939-7860-1_6. [DOI] [PubMed] [Google Scholar]
- Kazachkina N. I.; Zherdeva V. V.; Meerovich I. G.; Saydasheva A. N.; Solovyev I. D.; Tuchina D. K.; Savitsky A. P.; Tuchin V. V.; Bogdanov A. A. MR and Fluorescence Imaging of Gadobutrol-Induced Optical Clearing of Red Fluorescent Protein Signal in an in Vivo Cancer Model. NMR Biomed. 2022, 35, e4708. 10.1002/nbm.4708. [DOI] [PubMed] [Google Scholar]
- Newman R. H.; Zhang J. The Design and Application of Genetically Encodable Biosensors Based on Fluorescent Proteins. Methods Mol. Biol. 2014, 1071, 1–16. 10.1007/978-1-62703-622-1_1. [DOI] [PMC free article] [PubMed] [Google Scholar]
- Mo G. C. H.; Posner C.; Rodriguez E. A.; Sun T.; Zhang J. A Rationally Enhanced Red Fluorescent Protein Expands the Utility of FRET Biosensors. Nat. Commun. 2020, 11, 1848. 10.1038/s41467-020-15687-x. [DOI] [PMC free article] [PubMed] [Google Scholar]
- Alford S. C.; Abdelfattah A. S.; Ding Y.; Campbell R. E. A Fluorogenic Red Fluorescent Protein Heterodimer. Chem. Biol. 2012, 19, 353–360. 10.1016/j.chembiol.2012.01.006. [DOI] [PMC free article] [PubMed] [Google Scholar]
- Alford S. C.; Ding Y.; Simmen T.; Campbell R. E. Dimerization-Dependent Green and Yellow Fluorescent Proteins. ACS Synth. Biol. 2012, 1, 569–575. 10.1021/sb300050j. [DOI] [PMC free article] [PubMed] [Google Scholar]
- Li X.; Wang X.; Zhang X.; Zhao M.; Tsang W. L.; Zhang Y.; Yau R. G. W.; Weisman L. S.; Xu H. Genetically Encoded Fluorescent Probe to Visualize Intracellular Phosphatidylinositol 3,5-Bisphosphate Localization and Dynamics. Proc. Natl. Acad. Sci. U.S.A. 2013, 110, 21165–21170. 10.1073/pnas.1311864110. [DOI] [PMC free article] [PubMed] [Google Scholar]
- Goulden B. D.; Pacheco J.; Dull A.; Zewe J. P.; Deiters A.; Hammond G. R. V. A High-Avidity Biosensor Reveals Plasma Membrane PI(3,4)P2 Is Predominantly a Class I PI3K Signaling Product. J. Cell Biol. 2019, 218, 1066–1079. 10.1083/jcb.201809026. [DOI] [PMC free article] [PubMed] [Google Scholar]
- Kudo T.; Jeknić S.; Macklin D. N.; Akhter S.; Hughey J. J.; Regot S.; Covert M. W. Live-Cell Measurements of Kinase Activity in Single Cells Using Translocation Reporters. Nat. Protoc. 2018, 13, 155–169. 10.1038/nprot.2017.128. [DOI] [PubMed] [Google Scholar]
- Regot S.; Hughey J. J.; Bajar B. T.; Carrasco S.; Covert M. W. High-Sensitivity Measurements of Multiple Kinase Activities in Live Single Cells. Cell 2014, 157, 1724–1734. 10.1016/j.cell.2014.04.039. [DOI] [PMC free article] [PubMed] [Google Scholar]
- Hyman A. A.; Weber C. A.; Jülicher F. Liquid-Liquid Phase Separation in Biology. Annu. Rev. Cell Dev. Biol. 2014, 30, 39–58. 10.1146/annurev-cellbio-100913-013325. [DOI] [PubMed] [Google Scholar]
- Mehta S.; Zhang J. Liquid-Liquid Phase Separation Drives Cellular Function and Dysfunction in Cancer. Nat. Rev. Cancer 2022, 22, 239–252. 10.1038/s41568-022-00444-7. [DOI] [PMC free article] [PubMed] [Google Scholar]
- Bergeron-Sandoval L.-P.; Safaee N.; Michnick S. W. Mechanisms and Consequences of Macromolecular Phase Separation. Cell 2016, 165, 1067–1079. 10.1016/j.cell.2016.05.026. [DOI] [PubMed] [Google Scholar]
- Zhang Q.; Huang H.; Zhang L.; Wu R.; Chung C.-I.; Zhang S.-Q.; Torra J.; Schepis A.; Coughlin S. R.; Kornberg T. B.; Shu X. Visualizing Dynamics of Cell Signaling In Vivo with a Phase Separation-Based Kinase Reporter. Mol. Cell 2018, 69, 334. 10.1016/j.molcel.2017.12.008. [DOI] [PMC free article] [PubMed] [Google Scholar]
- Siegel M. S.; Isacoff E. Y. A Genetically Encoded Optical Probe of Membrane Voltage. Neuron 1997, 19, 735–741. 10.1016/S0896-6273(00)80955-1. [DOI] [PubMed] [Google Scholar]
- Zhang Y.; Rózsa M.; Liang Y.; Bushey D.; Wei Z.; Zheng J.; Reep D.; Broussard G. J.; Tsang A.; Tsegaye G.; et al. Fast and Sensitive GCaMP Calcium Indicators for Imaging Neural Populations. Nature 2023, 615, 884–891. 10.1038/s41586-023-05828-9. [DOI] [PMC free article] [PubMed] [Google Scholar]
- Tantama M.; Martínez-François J. R.; Mongeon R.; Yellen G. Imaging Energy Status in Live Cells with a Fluorescent Biosensor of the Intracellular ATP-to-ADP Ratio. Nat. Commun. 2013, 4, 2550. 10.1038/ncomms3550. [DOI] [PMC free article] [PubMed] [Google Scholar]
- Zhao Y.; Araki S.; Wu J.; Teramoto T.; Chang Y.-F.; Nakano M.; Abdelfattah A. S.; Fujiwara M.; Ishihara T.; Nagai T.; et al. An Expanded Palette of Genetically Encoded Ca2+ Indicators. Science 2011, 333, 1888–1891. 10.1126/science.1208592. [DOI] [PMC free article] [PubMed] [Google Scholar]
- Wu J.; Abdelfattah A. S.; Miraucourt L. S.; Kutsarova E.; Ruangkittisakul A.; Zhou H.; Ballanyi K.; Wicks G.; Drobizhev M.; Rebane A.; et al. A Long Stokes Shift Red Fluorescent Ca2+ Indicator Protein for Two-Photon and Ratiometric Imaging. Nat. Commun. 2014, 5, 5262. 10.1038/ncomms6262. [DOI] [PMC free article] [PubMed] [Google Scholar]
- Zeng H. H.; Matveeva E. G.; Stoddard A. K.; Fierke C. A.; Thompson R. B. Long Wavelength Fluorescence Ratiometric Zinc Biosensor. J. Fluoresc 2013, 23, 375–379. 10.1007/s10895-013-1161-6. [DOI] [PMC free article] [PubMed] [Google Scholar]
- van der Linden F. H.; Mahlandt E. K.; Arts J. J. G.; Beumer J.; Puschhof J.; de Man S. M. A.; Chertkova A. O.; Ponsioen B.; Clevers H.; van Buul J. D.; Postma M.; Gadella T. W. J.; Goedhart J. A Turquoise Fluorescence Lifetime-Based Biosensor for Quantitative Imaging of Intracellular Calcium. Nat. Commun. 2021, 12, 7159. 10.1038/s41467-021-27249-w. [DOI] [PMC free article] [PubMed] [Google Scholar]
- Nasu Y.; Shen Y.; Kramer L.; Campbell R. E. Structure- and Mechanism-Guided Design of Single Fluorescent Protein-Based Biosensors. Nat. Chem. Biol. 2021, 17, 509–518. 10.1038/s41589-020-00718-x. [DOI] [PubMed] [Google Scholar]
- Wu S.-Y.; Wen Y.; Serre N. B. C.; Laursen C. C. H.; Dietz A. G.; Taylor B. R.; Drobizhev M.; Molina R. S.; Aggarwal A.; Rancic V.; et al. A Sensitive and Specific Genetically-Encoded Potassium Ion Biosensor for in Vivo Applications across the Tree of Life. PLoS Biol. 2022, 20, e3001772. 10.1371/journal.pbio.3001772. [DOI] [PMC free article] [PubMed] [Google Scholar]
- Zarowny L.; Aggarwal A.; Rutten V. M. S.; Kolb I.; Patel R.; Huang H.-Y.; Chang Y.-F.; Phan T.; Kanyo R.; Ahrens M. B.; Allison W. T.; Podgorski K.; Campbell R. E. Bright and High-Performance Genetically Encoded Ca2+ Indicator Based on MNeonGreen Fluorescent Protein. ACS Sens. 2020, 5, 1959–1968. 10.1021/acssensors.0c00279. [DOI] [PubMed] [Google Scholar]
- Qian Y.; Cosio D. M. O.; Piatkevich K. D.; Aufmkolk S.; Su W.-C.; Celiker O. T.; Schohl A.; Murdock M. H.; Aggarwal A.; Chang Y.-F.; et al. Improved Genetically Encoded Near-Infrared Fluorescent Calcium Ion Indicators for in Vivo Imaging. PLoS Biol. 2020, 18, e3000965. 10.1371/journal.pbio.3000965. [DOI] [PMC free article] [PubMed] [Google Scholar]
- Bhalla N.; Jolly P.; Formisano N.; Estrela P. Introduction to Biosensors. Essays Biochem 2016, 60, 1–8. 10.1042/EBC20150001. [DOI] [PMC free article] [PubMed] [Google Scholar]
- Qin Y.; Dittmer P. J.; Park J. G.; Jansen K. B.; Palmer A. E. Measuring Steady-State and Dynamic Endoplasmic Reticulum and Golgi Zn2+ with Genetically Encoded Sensors. Proc. Natl. Acad. Sci. U.S.A. 2011, 108, 7351–7356. 10.1073/pnas.1015686108. [DOI] [PMC free article] [PubMed] [Google Scholar]
- Imamura H.; Otsubo S.; Nishida M.; Takekawa N.; Imada K. Red Fluorescent Proteins Engineered from Green Fluorescent Proteins. Proc. Natl. Acad. Sci. U.S.A. 2023, 120, e2307687120. 10.1073/pnas.2307687120. [DOI] [PMC free article] [PubMed] [Google Scholar]
- Ast C.; Foret J.; Oltrogge L. M.; De Michele R.; Kleist T. J.; Ho C.-H.; Frommer W. B. Ratiometric Matryoshka Biosensors from a Nested Cassette of Green- and Orange-Emitting Fluorescent Proteins. Nat. Commun. 2017, 8, 431. 10.1038/s41467-017-00400-2. [DOI] [PMC free article] [PubMed] [Google Scholar]
- Nakai J.; Ohkura M.; Imoto K. A High Signal-to-Noise Ca(2+) Probe Composed of a Single Green Fluorescent Protein. Nat. Biotechnol. 2001, 19, 137–141. 10.1038/84397. [DOI] [PubMed] [Google Scholar]
- Komatsu N.; Aoki K.; Yamada M.; Yukinaga H.; Fujita Y.; Kamioka Y.; Matsuda M. Development of an Optimized Backbone of FRET Biosensors for Kinases and GTPases. Mol. Biol. Cell 2011, 22, 4647–4656. 10.1091/mbc.e11-01-0072. [DOI] [PMC free article] [PubMed] [Google Scholar]
- Akerboom J.; Carreras Calderon N.; Tian L.; Wabnig S.; Prigge M.; Tolo J.; Gordus A.; Orger M. B.; Severi K. E.; Macklin J. J.; Patel R.; Pulver S. R.; Wardill T. J.; Fischer E.; Schuler C.; Chen T.-W.; Sarkisyan K. S.; Marvin J. S.; Bargmann C. I.; Kim D. S.; Kugler S.; Lagnado L.; Hegemann P.; Gottschalk A.; Schreiter E. R.; Looger L. L. Genetically Encoded Calcium Indicators for Multi-Color Neural Activity Imaging and Combination with Optogenetics. Front. Mol. Neurosci. 2013, 6, 2. 10.3389/fnmol.2013.00002. [DOI] [PMC free article] [PubMed] [Google Scholar]
- Zhang J.-F.; Liu B.; Hong I.; Mo A.; Roth R. H.; Tenner B.; Lin W.; Zhang J. Z.; Molina R. S.; Drobizhev M.; et al. An Ultrasensitive Biosensor for High-Resolution Kinase Activity Imaging in Awake Mice. Nat. Chem. Biol. 2021, 17, 39–46. 10.1038/s41589-020-00660-y. [DOI] [PMC free article] [PubMed] [Google Scholar]
- Hario S.; Le G. N. T.; Sugimoto H.; Takahashi-Yamashiro K.; Nishinami S.; Toda H.; Li S.; Marvin J. S.; Kuroda S.; Drobizhev M.; et al. High-Performance Genetically Encoded Green Fluorescent Biosensors for Intracellularl -Lactate. ACS Cent. Sci. 2024, 10 (2), 402–416. 10.1021/acscentsci.3c01250. [DOI] [PMC free article] [PubMed] [Google Scholar]
- Evans S. W.; Shi D.-Q.; Chavarha M.; Plitt M. H.; Taxidis J.; Madruga B.; Fan J. L.; Hwang F.-J.; van Keulen S. C.; Suomivuori C.-M.; et al. A Positively Tuned Voltage Indicator for Extended Electrical Recordings in the Brain. Nat. Methods 2023, 20, 1104–1113. 10.1038/s41592-023-01913-z. [DOI] [PMC free article] [PubMed] [Google Scholar]
- Qian Y.; Piatkevich K. D.; Mc Larney B.; Abdelfattah A. S.; Mehta S.; Murdock M. H.; Gottschalk S.; Molina R. S.; Zhang W.; Chen Y.; et al. A Genetically Encoded Near-Infrared Fluorescent Calcium Ion Indicator. Nat. Methods 2019, 16, 171–174. 10.1038/s41592-018-0294-6. [DOI] [PMC free article] [PubMed] [Google Scholar]
- Tian H.; Davis H. C.; Wong-Campos J. D.; Park P.; Fan L. Z.; Gmeiner B.; Begum S.; Werley C. A.; Borja G. B.; Upadhyay H.; et al. Video-Based Pooled Screening Yields Improved Far-Red Genetically Encoded Voltage Indicators. Nat. Methods 2023, 20, 1082–1094. 10.1038/s41592-022-01743-5. [DOI] [PMC free article] [PubMed] [Google Scholar]
- Koveal D.; Rosen P. C.; Meyer D. J.; Díaz-García C. M.; Wang Y.; Cai L.-H.; Chou P. J.; Weitz D. A.; Yellen G. A High-Throughput Multiparameter Screen for Accelerated Development and Optimization of Soluble Genetically Encoded Fluorescent Biosensors. Nat. Commun. 2022, 13, 2919. 10.1038/s41467-022-30685-x. [DOI] [PMC free article] [PubMed] [Google Scholar]
- Frei M. S.; Mehta S.; Zhang J. Next-Generation Genetically Encoded Fluorescent Biosensors Illuminate Cell Signaling and Metabolism. Annu. Rev. Biophys. 2024, 53, 275–297. 10.1146/annurev-biophys-030722-021359. [DOI] [PMC free article] [PubMed] [Google Scholar]
- Liu L.; Limsakul P.; Meng X.; Huang Y.; Harrison R. E. S.; Huang T.-S.; Shi Y.; Yu Y.; Charupanit K.; Zhong S.; Lu S.; Zhang J.; Chien S.; Sun J.; Wang Y. Integration of FRET and Sequencing to Engineer Kinase Biosensors from Mammalian Cell Libraries. Nat. Commun. 2021, 12, 5031. 10.1038/s41467-021-25323-x. [DOI] [PMC free article] [PubMed] [Google Scholar]
- Raimondo J. V.; Joyce B.; Kay L.; Schlagheck T.; Newey S. E.; Srinivas S.; Akerman C. J. A Genetically-Encoded Chloride and PH Sensor for Dissociating Ion Dynamics in the Nervous System. Front. Cell Neurosci. 2013, 7, 202. 10.3389/fncel.2013.00202. [DOI] [PMC free article] [PubMed] [Google Scholar]
- Zhou X.; Clister T. L.; Lowry P. R.; Seldin M. M.; Wong G. W.; Zhang J. Dynamic Visualization of MTORC1 Activity in Living Cells. Cell Rep. 2015, 10, 1767–1777. 10.1016/j.celrep.2015.02.031. [DOI] [PMC free article] [PubMed] [Google Scholar]
- Poburko D.; Santo-Domingo J.; Demaurex N. Dynamic Regulation of the Mitochondrial Proton Gradient during Cytosolic Calcium Elevations. J. Biol. Chem. 2011, 286, 11672–11684. 10.1074/jbc.M110.159962. [DOI] [PMC free article] [PubMed] [Google Scholar]
- Aoi W.; Marunaka Y. Importance of PH Homeostasis in Metabolic Health and Diseases: Crucial Role of Membrane Proton Transport. Biomed Res. Int. 2014, 2014, 598986. 10.1155/2014/598986. [DOI] [PMC free article] [PubMed] [Google Scholar]
- Lagadic-Gossmann D.; Huc L.; Lecureur V. Alterations of Intracellular PH Homeostasis in Apoptosis: Origins and Roles. Cell Death Differ. 2004, 11, 953–961. 10.1038/sj.cdd.4401466. [DOI] [PubMed] [Google Scholar]
- Demaurex N. PH Homeostasis of Cellular Organelles. News Physiol. Sci. 2002, 17, 1–5. 10.1152/physiologyonline.2002.17.1.1. [DOI] [PubMed] [Google Scholar]
- Grabe M.; Oster G. Regulation of Organelle Acidity. J. Gen. Physiol. 2001, 117, 329–344. 10.1085/jgp.117.4.329. [DOI] [PMC free article] [PubMed] [Google Scholar]
- Brejc K.; Sixma T. K.; Kitts P. A.; Kain S. R.; Tsien R. Y.; Ormö M.; Remington S. J. Structural Basis for Dual Excitation and Photoisomerization of the Aequorea Victoria Green Fluorescent Protein. Proc. Natl. Acad. Sci. U.S.A. 1997, 94, 2306–2311. 10.1073/pnas.94.6.2306. [DOI] [PMC free article] [PubMed] [Google Scholar]
- Chattoraj M.; King B. A.; Bublitz G. U.; Boxer S. G. Ultra-Fast Excited State Dynamics in Green Fluorescent Protein: Multiple States and Proton Transfer. Proc. Natl. Acad. Sci. U.S.A. 1996, 93, 8362–8367. 10.1073/pnas.93.16.8362. [DOI] [PMC free article] [PubMed] [Google Scholar]
- Miesenböck G.; De Angelis D. A.; Rothman J. E. Visualizing Secretion and Synaptic Transmission with PH-Sensitive Green Fluorescent Proteins. Nature 1998, 394, 192–195. 10.1038/28190. [DOI] [PubMed] [Google Scholar]
- Sankaranarayanan S.; De Angelis D.; Rothman J. E.; Ryan T. A. The Use of PHluorins for Optical Measurements of Presynaptic Activity. Biophys. J. 2000, 79, 2199–2208. 10.1016/S0006-3495(00)76468-X. [DOI] [PMC free article] [PubMed] [Google Scholar]
- Mahon M. J. PHluorin2: An Enhanced, Ratiometric, PH-Sensitive Green Florescent Protein. Adv. Biosci Biotechnol 2011, 2, 132–137. 10.4236/abb.2011.23021. [DOI] [PMC free article] [PubMed] [Google Scholar]
- Li Y.; Tsien R. W. PHTomato, a Red, Genetically Encoded Indicator That Enables Multiplex Interrogation of Synaptic Activity. Nat. Neurosci. 2012, 15, 1047–1053. 10.1038/nn.3126. [DOI] [PMC free article] [PubMed] [Google Scholar]
- Shen Y.; Wen Y.; Sposini S.; Vishwanath A. A.; Abdelfattah A. S.; Schreiter E. R.; Lemieux M. J.; de Juan-Sanz J.; Perrais D.; Campbell R. E. Rational Engineering of an Improved Genetically Encoded PH Sensor Based on Superecliptic PHluorin. ACS Sens. 2023, 8, 3014–3022. 10.1021/acssensors.3c00484. [DOI] [PubMed] [Google Scholar]
- Pakhomov A. A.; Martynov V. I.; Orsa A. N.; Bondarenko A. A.; Chertkova R. V.; Lukyanov K. A.; Petrenko A. G.; Deyev I. E. Fluorescent Protein Dendra2 as a Ratiometric Genetically Encoded PH-Sensor. Biochem. Biophys. Res. Commun. 2017, 493, 1518–1521. 10.1016/j.bbrc.2017.09.170. [DOI] [PubMed] [Google Scholar]
- Rennick J. J.; Nowell C. J.; Pouton C. W.; Johnston A. P. R. Resolving Subcellular PH with a Quantitative Fluorescent Lifetime Biosensor. Nat. Commun. 2022, 13, 6023. 10.1038/s41467-022-33348-z. [DOI] [PMC free article] [PubMed] [Google Scholar]
- Reifenrath M.; Boles E. A Superfolder Variant of PH-Sensitive PHluorin for in Vivo PH Measurements in the Endoplasmic Reticulum. Sci. Rep. 2018, 8, 11985. 10.1038/s41598-018-30367-z. [DOI] [PMC free article] [PubMed] [Google Scholar]
- Burgstaller S.; Bischof H.; Gensch T.; Stryeck S.; Gottschalk B.; Ramadani-Muja J.; Eroglu E.; Rost R.; Balfanz S.; Baumann A.; et al. PH-Lemon, a Fluorescent Protein-Based PH Reporter for Acidic Compartments. ACS Sens. 2019, 4, 883–891. 10.1021/acssensors.8b01599. [DOI] [PMC free article] [PubMed] [Google Scholar]
- Ponsford A. H.; Ryan T. A.; Raimondi A.; Cocucci E.; Wycislo S. A.; Fröhlich F.; Swan L. E.; Stagi M. Live Imaging of Intra-Lysosome PH in Cell Lines and Primary Neuronal Culture Using a Novel Genetically Encoded Biosensor. Autophagy 2021, 17, 1500–1518. 10.1080/15548627.2020.1771858. [DOI] [PMC free article] [PubMed] [Google Scholar]
- Chin M. Y.; Patwardhan A. R.; Ang K.-H.; Wang A. L.; Alquezar C.; Welch M.; Nguyen P. T.; Grabe M.; Molofsky A. V.; Arkin M. R.; et al. Genetically Encoded, PH-Sensitive MTFP1 Biosensor for Probing Lysosomal PH. ACS Sens. 2021, 6, 2168–2180. 10.1021/acssensors.0c02318. [DOI] [PMC free article] [PubMed] [Google Scholar]
- Tantama M.; Hung Y. P.; Yellen G. Imaging Intracellular PH in Live Cells with a Genetically Encoded Red Fluorescent Protein Sensor. J. Am. Chem. Soc. 2011, 133, 10034–10037. 10.1021/ja202902d. [DOI] [PMC free article] [PubMed] [Google Scholar]
- Mellman I.; Fuchs R.; Helenius A. Acidification of the Endocytic and Exocytic Pathways. Annu. Rev. Biochem. 1986, 55, 663–700. 10.1146/annurev.bi.55.070186.003311. [DOI] [PubMed] [Google Scholar]
- Li S.-S.; Zhang M.; Wang J.-H.; Yang F.; Kang B.; Xu J.-J.; Chen H.-Y. Monitoring the Changes of PH in Lysosomes during Autophagy and Apoptosis by Plasmon Enhanced Raman Imaging. Anal. Chem. 2019, 91, 8398–8405. 10.1021/acs.analchem.9b01250. [DOI] [PubMed] [Google Scholar]
- Balaji J.; Ryan T. A. Single-Vesicle Imaging Reveals That Synaptic Vesicle Exocytosis and Endocytosis Are Coupled by a Single Stochastic Mode. Proc. Natl. Acad. Sci. U.S.A. 2007, 104, 20576–20581. 10.1073/pnas.0707574105. [DOI] [PMC free article] [PubMed] [Google Scholar]
- Yudowski G. A.; Puthenveedu M. A.; von Zastrow M. Distinct Modes of Regulated Receptor Insertion to the Somatodendritic Plasma Membrane. Nat. Neurosci. 2006, 9, 622–627. 10.1038/nn1679. [DOI] [PubMed] [Google Scholar]
- Shen Y.; Rosendale M.; Campbell R. E.; Perrais D. PHuji, a PH-Sensitive Red Fluorescent Protein for Imaging of Exo- and Endocytosis. J. Cell Biol. 2014, 207, 419–432. 10.1083/jcb.201404107. [DOI] [PMC free article] [PubMed] [Google Scholar]
- Liu A.; Huang X.; He W.; Xue F.; Yang Y.; Liu J.; Chen L.; Yuan L.; Xu P. PHmScarlet Is a PH-Sensitive Red Fluorescent Protein to Monitor Exocytosis Docking and Fusion Steps. Nat. Commun. 2021, 12, 1413. 10.1038/s41467-021-21666-7. [DOI] [PMC free article] [PubMed] [Google Scholar]
- Kabeya Y.; Mizushima N.; Ueno T.; Yamamoto A.; Kirisako T.; Noda T.; Kominami E.; Ohsumi Y.; Yoshimori T. LC3, a Mammalian Homologue of Yeast Apg8p, Is Localized in Autophagosome Membranes after Processing. EMBO J. 2000, 19, 5720–5728. 10.1093/emboj/19.21.5720. [DOI] [PMC free article] [PubMed] [Google Scholar]
- Lee I. H.; Cao L.; Mostoslavsky R.; Lombard D. B.; Liu J.; Bruns N. E.; Tsokos M.; Alt F. W.; Finkel T. A Role for the NAD-Dependent Deacetylase Sirt1 in the Regulation of Autophagy. Proc. Natl. Acad. Sci. U.S.A. 2008, 105, 3374–3379. 10.1073/pnas.0712145105. [DOI] [PMC free article] [PubMed] [Google Scholar]
- Kimura S.; Noda T.; Yoshimori T. Dissection of the Autophagosome Maturation Process by a Novel Reporter Protein, Tandem Fluorescent-Tagged LC3. Autophagy 2007, 3, 452–460. 10.4161/auto.4451. [DOI] [PubMed] [Google Scholar]
- Rosado C. J.; Mijaljica D.; Hatzinisiriou I.; Prescott M.; Devenish R. J. Rosella: A Fluorescent PH-Biosensor for Reporting Vacuolar Turnover of Cytosol and Organelles in Yeast. Autophagy 2008, 4, 205–213. 10.4161/auto.5331. [DOI] [PubMed] [Google Scholar]
- Zhou C.; Zhong W.; Zhou J.; Sheng F.; Fang Z.; Wei Y.; Chen Y.; Deng X.; Xia B.; Lin J. Monitoring Autophagic Flux by an Improved Tandem Fluorescent-Tagged LC3 (MTagRFP-MWasabi-LC3) Reveals That High-Dose Rapamycin Impairs Autophagic Flux in Cancer Cells. Autophagy 2012, 8, 1215–1226. 10.4161/auto.20284. [DOI] [PubMed] [Google Scholar]
- Kim H.; Kim H.; Choi J.; Inn K.-S.; Seong J. Visualization of Autophagy Progression by a Red-Green-Blue Autophagy Sensor. ACS Sens. 2020, 5, 3850–3861. 10.1021/acssensors.0c00809. [DOI] [PubMed] [Google Scholar]
- Ding W.-X.; Yin X.-M. Mitophagy: Mechanisms, Pathophysiological Roles, and Analysis. Biol. Chem. 2012, 393, 547–564. 10.1515/hsz-2012-0119. [DOI] [PMC free article] [PubMed] [Google Scholar]
- Katayama H.; Hama H.; Nagasawa K.; Kurokawa H.; Sugiyama M.; Ando R.; Funata M.; Yoshida N.; Homma M.; Nishimura T.; Takahashi M.; Ishida Y.; Hioki H.; Tsujihata Y.; Miyawaki A. Visualizing and Modulating Mitophagy for Therapeutic Studies of Neurodegeneration. Cell 2020, 181, 1176. 10.1016/j.cell.2020.04.025. [DOI] [PubMed] [Google Scholar]
- Richter K.; Haslbeck M.; Buchner J. The Heat Shock Response: Life on the Verge of Death. Mol. Cell 2010, 40, 253–266. 10.1016/j.molcel.2010.10.006. [DOI] [PubMed] [Google Scholar]
- Okabe K.; Inada N.; Gota C.; Harada Y.; Funatsu T.; Uchiyama S. Intracellular Temperature Mapping with a Fluorescent Polymeric Thermometer and Fluorescence Lifetime Imaging Microscopy. Nat. Commun. 2012, 3, 705. 10.1038/ncomms1714. [DOI] [PMC free article] [PubMed] [Google Scholar]
- Lu K.; Wazawa T.; Sakamoto J.; Vu C. Q.; Nakano M.; Kamei Y.; Nagai T. Intracellular Heat Transfer and Thermal Property Revealed by Kilohertz Temperature Imaging with a Genetically Encoded Nanothermometer. Nano Lett. 2022, 22, 5698–5707. 10.1021/acs.nanolett.2c00608. [DOI] [PMC free article] [PubMed] [Google Scholar]
- Tian Y.; Martinez M. M.; Pappas D. Fluorescence Correlation Spectroscopy: A Review of Biochemical and Microfluidic Applications. Appl. Spectrosc. 2011, 65, 115A. 10.1366/10-06224. [DOI] [PMC free article] [PubMed] [Google Scholar]
- Wong F. H. C.; Banks D. S.; Abu-Arish A.; Fradin C. A Molecular Thermometer Based on Fluorescent Protein Blinking. J. Am. Chem. Soc. 2007, 129, 10302–10303. 10.1021/ja0715905. [DOI] [PubMed] [Google Scholar]
- Donner J. S.; Thompson S. A.; Kreuzer M. P.; Baffou G.; Quidant R. Mapping Intracellular Temperature Using Green Fluorescent Protein. Nano Lett. 2012, 12, 2107–2111. 10.1021/nl300389y. [DOI] [PubMed] [Google Scholar]
- Deepankumar K.; Nadarajan S. P.; Bae D.-H.; Baek K.-H.; Choi K.-Y.; Yun H. Temperature Sensing Using Red Fluorescent Protein. Biotechnol. Bioprocess Eng. 2015, 20, 67–72. 10.1007/s12257-014-0456-z. [DOI] [PMC free article] [PubMed] [Google Scholar]
- Nakano M.; Arai Y.; Kotera I.; Okabe K.; Kamei Y.; Nagai T. Genetically Encoded Ratiometric Fluorescent Thermometer with Wide Range and Rapid Response. PLoS One 2017, 12, e0172344 10.1371/journal.pone.0172344. [DOI] [PMC free article] [PubMed] [Google Scholar]
- Kiyonaka S.; Kajimoto T.; Sakaguchi R.; Shinmi D.; Omatsu-Kanbe M.; Matsuura H.; Imamura H.; Yoshizaki T.; Hamachi I.; Morii T.; et al. Genetically Encoded Fluorescent Thermosensors Visualize Subcellular Thermoregulation in Living Cells. Nat. Methods 2013, 10, 1232–1238. 10.1038/nmeth.2690. [DOI] [PubMed] [Google Scholar]
- Vu C. Q.; Fukushima S.-I.; Wazawa T.; Nagai T. A Highly-Sensitive Genetically Encoded Temperature Indicator Exploiting a Temperature-Responsive Elastin-like Polypeptide. Sci. Rep. 2021, 11, 16519. 10.1038/s41598-021-96049-5. [DOI] [PMC free article] [PubMed] [Google Scholar]
- Savchuk O. A.; Silvestre O. F.; Adão R. M. R.; Nieder J. B. GFP Fluorescence Peak Fraction Analysis Based Nanothermometer for the Assessment of Exothermal Mitochondria Activity in Live Cells. Sci. Rep. 2019, 9, 7535. 10.1038/s41598-019-44023-7. [DOI] [PMC free article] [PubMed] [Google Scholar]
- Sahan A. Z.; Baday M.; Patel C. B. Biomimetic Hydrogels in the Study of Cancer Mechanobiology: Overview, Biomedical Applications, and Future Perspectives. Gels 2022, 8, 496. 10.3390/gels8080496. [DOI] [PMC free article] [PubMed] [Google Scholar]
- Baday M.; Ercal O.; Sahan A. Z.; Sahan A.; Ercal B.; Inan H.; Demirci U. Density Based Characterization of Mechanical Cues on Cancer Cells Using Magnetic Levitation. Adv. Healthc Mater. 2019, 8, e1801517. 10.1002/adhm.201801517. [DOI] [PubMed] [Google Scholar]
- Chen Y.; Ju L.; Rushdi M.; Ge C.; Zhu C. Receptor-Mediated Cell Mechanosensing. Mol. Biol. Cell 2017, 28, 3134–3155. 10.1091/mbc.e17-04-0228. [DOI] [PMC free article] [PubMed] [Google Scholar]
- Petridou N. I.; Spiró Z.; Heisenberg C.-P. Multiscale Force Sensing in Development. Nat. Cell Biol. 2017, 19, 581–588. 10.1038/ncb3524. [DOI] [PubMed] [Google Scholar]
- Alenghat F. J.; Ingber D. E. Mechanotransduction: All Signals Point to Cytoskeleton, Matrix, and Integrins. Sci. STKE 2002, 2002, pe6. 10.1126/stke.2002.119.pe6. [DOI] [PubMed] [Google Scholar]
- Jiang Y.; Zhang H.; Wang J.; Liu Y.; Luo T.; Hua H. Targeting Extracellular Matrix Stiffness and Mechanotransducers to Improve Cancer Therapy. J. Hematol Oncol 2022, 15, 34. 10.1186/s13045-022-01252-0. [DOI] [PMC free article] [PubMed] [Google Scholar]
- Cost A.-L.; Khalaji S.; Grashoff C. Genetically Encoded FRET-Based Tension Sensors. Curr. Protoc. Cell Biol. 2019, 83, e85. 10.1002/cpcb.85. [DOI] [PubMed] [Google Scholar]
- Meng F.; Suchyna T. M.; Sachs F. A Fluorescence Energy Transfer-Based Mechanical Stress Sensor for Specific Proteins in Situ. FEBS J. 2008, 275, 3072–3087. 10.1111/j.1742-4658.2008.06461.x. [DOI] [PMC free article] [PubMed] [Google Scholar]
- Meng F.; Suchyna T. M.; Lazakovitch E.; Gronostajski R. M.; Sachs F. Real Time FRET Based Detection of Mechanical Stress in Cytoskeletal and Extracellular Matrix Proteins. Cell Mol. Bioeng. 2011, 4, 148–159. 10.1007/s12195-010-0140-0. [DOI] [PMC free article] [PubMed] [Google Scholar]
- Meng F.; Sachs F. Visualizing Dynamic Cytoplasmic Forces with a Compliance-Matched FRET Sensor. J. Cell Sci. 2011, 124, 261–269. 10.1242/jcs.071928. [DOI] [PMC free article] [PubMed] [Google Scholar]
- Meng F.; Sachs F. Orientation-Based FRET Sensor for Real-Time Imaging of Cellular Forces. J. Cell Sci. 2012, 125, 743–750. 10.1242/jcs.093104. [DOI] [PMC free article] [PubMed] [Google Scholar]
- Grashoff C.; Hoffman B. D.; Brenner M. D.; Zhou R.; Parsons M.; Yang M. T.; McLean M. A.; Sligar S. G.; Chen C. S.; Ha T.; et al. Measuring Mechanical Tension across Vinculin Reveals Regulation of Focal Adhesion Dynamics. Nature 2010, 466, 263–266. 10.1038/nature09198. [DOI] [PMC free article] [PubMed] [Google Scholar]
- Conway D. E.; Breckenridge M. T.; Hinde E.; Gratton E.; Chen C. S.; Schwartz M. A. Fluid Shear Stress on Endothelial Cells Modulates Mechanical Tension across VE-Cadherin and PECAM-1. Curr. Biol. 2013, 23, 1024–1030. 10.1016/j.cub.2013.04.049. [DOI] [PMC free article] [PubMed] [Google Scholar]
- Austen K.; Ringer P.; Mehlich A.; Chrostek-Grashoff A.; Kluger C.; Klingner C.; Sabass B.; Zent R.; Rief M.; Grashoff C. Extracellular Rigidity Sensing by Talin Isoform-Specific Mechanical Linkages. Nat. Cell Biol. 2015, 17, 1597–1606. 10.1038/ncb3268. [DOI] [PMC free article] [PubMed] [Google Scholar]
- Iwai S.; Uyeda T. Q. P. Visualizing Myosin-Actin Interaction with a Genetically-Encoded Fluorescent Strain Sensor. Proc. Natl. Acad. Sci. U.S.A. 2008, 105, 16882–16887. 10.1073/pnas.0805513105. [DOI] [PMC free article] [PubMed] [Google Scholar]
- De Angelis D. A.; Miesenböck G.; Zemelman B. V.; Rothman J. E. PRIM: Proximity Imaging of Green Fluorescent Protein-Tagged Polypeptides. Proc. Natl. Acad. Sci. U.S.A. 1998, 95, 12312–12316. 10.1073/pnas.95.21.12312. [DOI] [PMC free article] [PubMed] [Google Scholar]
- Ren Y.; Yang J.; Fujita B.; Jin H.; Zhang Y.; Berro J. Force Redistribution in Clathrin-Mediated Endocytosis Revealed by Coiled-Coil Force Sensors. Sci. Adv. 2023, 9, eadi1535. 10.1126/sciadv.adi1535. [DOI] [PMC free article] [PubMed] [Google Scholar]
- Brenner M. D.; Zhou R.; Conway D. E.; Lanzano L.; Gratton E.; Schwartz M. A.; Ha T. Spider Silk Peptide Is a Compact, Linear Nanospring Ideal for Intracellular Tension Sensing. Nano Lett. 2016, 16, 2096–2102. 10.1021/acs.nanolett.6b00305. [DOI] [PMC free article] [PubMed] [Google Scholar]
- Ringer P.; Weißl A.; Cost A.-L.; Freikamp A.; Sabass B.; Mehlich A.; Tramier M.; Rief M.; Grashoff C. Multiplexing Molecular Tension Sensors Reveals Piconewton Force Gradient across Talin-1. Nat. Methods 2017, 14, 1090–1096. 10.1038/nmeth.4431. [DOI] [PubMed] [Google Scholar]
- LaCroix A. S.; Lynch A. D.; Berginski M. E.; Hoffman B. D. Tunable Molecular Tension Sensors Reveal Extension-Based Control of Vinculin Loading. Elife 2018, 7, e33927. 10.7554/eLife.33927. [DOI] [PMC free article] [PubMed] [Google Scholar]
- Boersma A. J.; Zuhorn I. S.; Poolman B. A Sensor for Quantification of Macromolecular Crowding in Living Cells. Nat. Methods 2015, 12, 227. 10.1038/nmeth.3257. [DOI] [PubMed] [Google Scholar]
- Mouton S. N.; Thaller D. J.; Crane M. M.; Rempel I. L.; Terpstra O. T.; Steen A.; Kaeberlein M.; Lusk C. P.; Boersma A. J.; Veenhoff L. M. A Physicochemical Perspective of Aging from Single-Cell Analysis of PH, Macromolecular and Organellar Crowding in Yeast. Elife 2020, 9, e54707. 10.7554/eLife.54707. [DOI] [PMC free article] [PubMed] [Google Scholar]
- Mitrea D. M.; Cika J. A.; Guy C. S.; Ban D.; Banerjee P. R.; Stanley C. B.; Nourse A.; Deniz A. A.; Kriwacki R. W. Nucleophosmin Integrates within the Nucleolus via Multi-Modal Interactions with Proteins Displaying R-Rich Linear Motifs and RRNA. Elife 2016, 5, e13571. 10.7554/eLife.13571. [DOI] [PMC free article] [PubMed] [Google Scholar]
- Miyagi T.; Yamanaka Y.; Harada Y.; Narumi S.; Hayamizu Y.; Kuroda M.; Kanekura K. An Improved Macromolecular Crowding Sensor CRONOS for Detection of Crowding Changes in Membrane-Less Organelles under Stressed Conditions. Biochem. Biophys. Res. Commun. 2021, 583, 29–34. 10.1016/j.bbrc.2021.10.055. [DOI] [PubMed] [Google Scholar]
- Joron K.; Viegas J. O.; Haas-Neill L.; Bier S.; Drori P.; Dvir S.; Lim P. S. L.; Rauscher S.; Meshorer E.; Lerner E. Fluorescent Protein Lifetimes Report Densities and Phases of Nuclear Condensates during Embryonic Stem-Cell Differentiation. Nat. Commun. 2023, 14, 4885. 10.1038/s41467-023-40647-6. [DOI] [PMC free article] [PubMed] [Google Scholar]
- Levin M. Molecular Bioelectricity: How Endogenous Voltage Potentials Control Cell Behavior and Instruct Pattern Regulation in Vivo. Mol. Biol. Cell 2014, 25, 3835–3850. 10.1091/mbc.e13-12-0708. [DOI] [PMC free article] [PubMed] [Google Scholar]
- Baker B. J.; Mutoh H.; Dimitrov D.; Akemann W.; Perron A.; Iwamoto Y.; Jin L.; Cohen L. B.; Isacoff E. Y.; Pieribone V. A.; et al. Genetically Encoded Fluorescent Sensors of Membrane Potential. Brain Cell Biol. 2008, 36, 53–67. 10.1007/s11068-008-9026-7. [DOI] [PMC free article] [PubMed] [Google Scholar]
- Yang H. H.; St-Pierre F. Genetically Encoded Voltage Indicators: Opportunities and Challenges. J. Neurosci. 2016, 36, 9977–9989. 10.1523/JNEUROSCI.1095-16.2016. [DOI] [PMC free article] [PubMed] [Google Scholar]
- Jin L.; Han Z.; Platisa J.; Wooltorton J. R. A.; Cohen L. B.; Pieribone V. A. Single Action Potentials and Subthreshold Electrical Events Imaged in Neurons with a Fluorescent Protein Voltage Probe. Neuron 2012, 75, 779–785. 10.1016/j.neuron.2012.06.040. [DOI] [PMC free article] [PubMed] [Google Scholar]
- Yang H. H.; St-Pierre F.; Sun X.; Ding X.; Lin M. Z.; Clandinin T. R. Subcellular Imaging of Voltage and Calcium Signals Reveals Neural Processing in Vivo. Cell 2016, 166, 245–257. 10.1016/j.cell.2016.05.031. [DOI] [PMC free article] [PubMed] [Google Scholar]
- Abdelfattah A. S.; Farhi S. L.; Zhao Y.; Brinks D.; Zou P.; Ruangkittisakul A.; Platisa J.; Pieribone V. A.; Ballanyi K.; Cohen A. E.; et al. A Bright and Fast Red Fluorescent Protein Voltage Indicator That Reports Neuronal Activity in Organotypic Brain Slices. J. Neurosci. 2016, 36, 2458–2472. 10.1523/JNEUROSCI.3484-15.2016. [DOI] [PMC free article] [PubMed] [Google Scholar]
- Piao H. H.; Rajakumar D.; Kang B. E.; Kim E. H.; Baker B. J. Combinatorial Mutagenesis of the Voltage-Sensing Domain Enables the Optical Resolution of Action Potentials Firing at 60 Hz by a Genetically Encoded Fluorescent Sensor of Membrane Potential. J. Neurosci. 2015, 35, 372–385. 10.1523/JNEUROSCI.3008-14.2015. [DOI] [PMC free article] [PubMed] [Google Scholar]
- Jung A.; Garcia J. E.; Kim E.; Yoon B.-J.; Baker B. J. Linker Length and Fusion Site Composition Improve the Optical Signal of Genetically Encoded Fluorescent Voltage Sensors. Neurophotonics 2015, 2, 021012 10.1117/1.NPh.2.2.021012. [DOI] [PMC free article] [PubMed] [Google Scholar]
- Sung U.; Sepehri-Rad M.; Piao H. H.; Jin L.; Hughes T.; Cohen L. B.; Baker B. J. Developing Fast Fluorescent Protein Voltage Sensors by Optimizing FRET Interactions. PLoS One 2015, 10, e0141585 10.1371/journal.pone.0141585. [DOI] [PMC free article] [PubMed] [Google Scholar]
- Dimitrov D.; He Y.; Mutoh H.; Baker B. J.; Cohen L.; Akemann W.; Knöpfel T. Engineering and Characterization of an Enhanced Fluorescent Protein Voltage Sensor. PLoS One 2007, 2, e440. 10.1371/journal.pone.0000440. [DOI] [PMC free article] [PubMed] [Google Scholar]
- Sakai R.; Repunte-Canonigo V.; Raj C. D.; Knöpfel T. Design and Characterization of a DNA-Encoded, Voltage-Sensitive Fluorescent Protein. Eur. J. Neurosci. 2001, 13, 2314–2318. 10.1046/j.0953-816x.2001.01617.x. [DOI] [PubMed] [Google Scholar]
- Tsutsui H.; Karasawa S.; Okamura Y.; Miyawaki A. Improving Membrane Voltage Measurements Using FRET with New Fluorescent Proteins. Nat. Methods 2008, 5, 683–685. 10.1038/nmeth.1235. [DOI] [PubMed] [Google Scholar]
- Tsutsui H.; Jinno Y.; Tomita A.; Niino Y.; Yamada Y.; Mikoshiba K.; Miyawaki A.; Okamura Y. Improved Detection of Electrical Activity with a Voltage Probe Based on a Voltage-Sensing Phosphatase. J. Physiol. (London) 2013, 591, 4427–4437. 10.1113/jphysiol.2013.257048. [DOI] [PMC free article] [PubMed] [Google Scholar]
- St-Pierre F.; Marshall J. D.; Yang Y.; Gong Y.; Schnitzer M. J.; Lin M. Z. High-Fidelity Optical Reporting of Neuronal Electrical Activity with an Ultrafast Fluorescent Voltage Sensor. Nat. Neurosci. 2014, 17, 884–889. 10.1038/nn.3709. [DOI] [PMC free article] [PubMed] [Google Scholar]
- Nagata T.; Inoue K. Rhodopsins at a Glance. J. Cell Sci. 2021, 134, jcs258989. 10.1242/jcs.258989. [DOI] [PubMed] [Google Scholar]
- de Grip W. J.; Ganapathy S. Rhodopsins: An Excitingly Versatile Protein Species for Research, Development and Creative Engineering. Front. Chem. 2022, 10, 879609. 10.3389/fchem.2022.879609. [DOI] [PMC free article] [PubMed] [Google Scholar]
- Kralj J. M.; Hochbaum D. R.; Douglass A. D.; Cohen A. E. Electrical Spiking in Escherichia Coli Probed with a Fluorescent Voltage-Indicating Protein. Science 2011, 333, 345–348. 10.1126/science.1204763. [DOI] [PubMed] [Google Scholar]
- Kralj J. M.; Douglass A. D.; Hochbaum D. R.; Maclaurin D.; Cohen A. E. Optical Recording of Action Potentials in Mammalian Neurons Using a Microbial Rhodopsin. Nat. Methods 2012, 9, 90–95. 10.1038/nmeth.1782. [DOI] [PMC free article] [PubMed] [Google Scholar]
- Hochbaum D. R.; Zhao Y.; Farhi S. L.; Klapoetke N.; Werley C. A.; Kapoor V.; Zou P.; Kralj J. M.; Maclaurin D.; Smedemark-Margulies N.; et al. All-Optical Electrophysiology in Mammalian Neurons Using Engineered Microbial Rhodopsins. Nat. Methods 2014, 11, 825–833. 10.1038/nmeth.3000. [DOI] [PMC free article] [PubMed] [Google Scholar]
- Gong Y.; Li J. Z.; Schnitzer M. J. Enhanced Archaerhodopsin Fluorescent Protein Voltage Indicators. PLoS One 2013, 8, e66959. 10.1371/journal.pone.0066959. [DOI] [PMC free article] [PubMed] [Google Scholar]
- Maclaurin D.; Venkatachalam V.; Lee H.; Cohen A. E. Mechanism of Voltage-Sensitive Fluorescence in a Microbial Rhodopsin. Proc. Natl. Acad. Sci. U.S.A. 2013, 110, 5939–5944. 10.1073/pnas.1215595110. [DOI] [PMC free article] [PubMed] [Google Scholar]
- Ernst O. P.; Lodowski D. T.; Elstner M.; Hegemann P.; Brown L. S.; Kandori H. Microbial and Animal Rhodopsins: Structures, Functions, and Molecular Mechanisms. Chem. Rev. 2014, 114, 126–163. 10.1021/cr4003769. [DOI] [PMC free article] [PubMed] [Google Scholar]
- Zhang X. M.; Yokoyama T.; Sakamoto M. Imaging Voltage with Microbial Rhodopsins. Front. Mol. Biosci. 2021, 8, 738829. 10.3389/fmolb.2021.738829. [DOI] [PMC free article] [PubMed] [Google Scholar]
- Park J.; Werley C. A.; Venkatachalam V.; Kralj J. M.; Dib-Hajj S. D.; Waxman S. G.; Cohen A. E. Screening Fluorescent Voltage Indicators with Spontaneously Spiking HEK Cells. PLoS One 2013, 8, e85221. 10.1371/journal.pone.0085221. [DOI] [PMC free article] [PubMed] [Google Scholar]
- Flytzanis N. C.; Bedbrook C. N.; Chiu H.; Engqvist M. K. M.; Xiao C.; Chan K. Y.; Sternberg P. W.; Arnold F. H.; Gradinaru V. Archaerhodopsin Variants with Enhanced Voltage-Sensitive Fluorescence in Mammalian and Caenorhabditis Elegans Neurons. Nat. Commun. 2014, 5, 4894. 10.1038/ncomms5894. [DOI] [PMC free article] [PubMed] [Google Scholar]
- Piatkevich K. D.; Jung E. E.; Straub C.; Linghu C.; Park D.; Suk H.-J.; Hochbaum D. R.; Goodwin D.; Pnevmatikakis E.; Pak N.; et al. A Robotic Multidimensional Directed Evolution Approach Applied to Fluorescent Voltage Reporters. Nat. Chem. Biol. 2018, 14, 352–360. 10.1038/s41589-018-0004-9. [DOI] [PMC free article] [PubMed] [Google Scholar]
- McIsaac R. S.; Engqvist M. K. M.; Wannier T.; Rosenthal A. Z.; Herwig L.; Flytzanis N. C.; Imasheva E. S.; Lanyi J. K.; Balashov S. P.; Gradinaru V.; et al. Directed Evolution of a Far-Red Fluorescent Rhodopsin. Proc. Natl. Acad. Sci. U.S.A. 2014, 111, 13034–13039. 10.1073/pnas.1413987111. [DOI] [PMC free article] [PubMed] [Google Scholar]
- Barneschi L.; Marsili E.; Pedraza-Gonzalez L.; Padula D.; De Vico L.; Kaliakin D.; Blanco-Gonzalez A.; Ferre N.; Huix-Rotllant M.; Filatov M.; Olivucci M. On the Fluorescence Enhancement of Arch Neuronal Optogenetic Reporters. Nat. Commun. 2022, 13, 6432. 10.1038/s41467-022-33993-4. [DOI] [PMC free article] [PubMed] [Google Scholar]
- Bayraktar H.; Fields A. P.; Kralj J. M.; Spudich J. L.; Rothschild K. J.; Cohen A. E. Ultrasensitive Measurements of Microbial Rhodopsin Photocycles Using Photochromic FRET. Photochem. Photobiol. 2012, 88, 90–97. 10.1111/j.1751-1097.2011.01011.x. [DOI] [PMC free article] [PubMed] [Google Scholar]
- Zou P.; Zhao Y.; Douglass A. D.; Hochbaum D. R.; Brinks D.; Werley C. A.; Harrison D. J.; Campbell R. E.; Cohen A. E. Bright and Fast Multicoloured Voltage Reporters via Electrochromic FRET. Nat. Commun. 2014, 5, 4625. 10.1038/ncomms5625. [DOI] [PMC free article] [PubMed] [Google Scholar]
- Brinks D.; Klein A. J.; Cohen A. E. Two-Photon Lifetime Imaging of Voltage Indicating Proteins as a Probe of Absolute Membrane Voltage. Biophys. J. 2015, 109, 914–921. 10.1016/j.bpj.2015.07.038. [DOI] [PMC free article] [PubMed] [Google Scholar]
- Gong Y.; Wagner M. J.; Zhong Li J.; Schnitzer M. J. Imaging Neural Spiking in Brain Tissue Using FRET-Opsin Protein Voltage Sensors. Nat. Commun. 2014, 5, 3674. 10.1038/ncomms4674. [DOI] [PMC free article] [PubMed] [Google Scholar]
- Abdelfattah A. S.; Valenti R.; Zheng J.; Wong A.; Chuong A. S.; Hasseman J. P.; Jayaraman V.; Kolb I.; Korff W.; Lavis L. D.; Liang Y.; Looger L. L.; Merryweather D.; Reep D.; Spruston N.; Svoboda K.; Tsang A.; Tsegaye G.; Turner G.; Podgorski K.; Koyama M.; Kim D. S.; Schreiter E. R. A General Approach to Engineer Positive-Going EFRET Voltage Indicators. Nat. Commun. 2020, 11, 3444. 10.1038/s41467-020-17322-1. [DOI] [PMC free article] [PubMed] [Google Scholar]
- Abdelfattah A. S.; Kawashima T.; Singh A.; Novak O.; Liu H.; Shuai Y.; Huang Y.-C.; Campagnola L.; Seeman S. C.; Yu J.; et al. Bright and Photostable Chemigenetic Indicators for Extended in Vivo Voltage Imaging. Science 2019, 365, 699–704. 10.1126/science.aav6416. [DOI] [PubMed] [Google Scholar]
- Xu Y.; Deng M.; Zhang S.; Yang J.; Peng L.; Chu J.; Zou P. Imaging Neuronal Activity with Fast and Sensitive Red-Shifted Electrochromic FRET Indicators. ACS Chem. Neurosci. 2019, 10, 4768–4775. 10.1021/acschemneuro.9b00501. [DOI] [PubMed] [Google Scholar]
- Sanchez C.; Berthier C.; Allard B.; Perrot J.; Bouvard C.; Tsutsui H.; Okamura Y.; Jacquemond V. Tracking the Sarcoplasmic Reticulum Membrane Voltage in Muscle with a FRET Biosensor. J. Gen. Physiol. 2018, 150, 1163–1177. 10.1085/jgp.201812035. [DOI] [PMC free article] [PubMed] [Google Scholar]
- Monakhov M. V.; Matlashov M. E.; Colavita M.; Song C.; Shcherbakova D. M.; Antic S. D.; Verkhusha V. V.; Knöpfel T. Screening and Cellular Characterization of Genetically Encoded Voltage Indicators Based on Near-Infrared Fluorescent Proteins. ACS Chem. Neurosci. 2020, 11, 3523–3531. 10.1021/acschemneuro.0c00046. [DOI] [PubMed] [Google Scholar]
- Kost L. A.; Ivanova V. O.; Balaban P. M.; Lukyanov K. A.; Nikitin E. S.; Bogdanov A. M. Red Fluorescent Genetically Encoded Voltage Indicators with Millisecond Responsiveness. Sensors (Basel) 2019, 19, 2982. 10.3390/s19132982. [DOI] [PMC free article] [PubMed] [Google Scholar]
- Kost L. A.; Nikitin E. S.; Ivanova V. O.; Sung U.; Putintseva E. V.; Chudakov D. M.; Balaban P. M.; Lukyanov K. A.; Bogdanov A. M. Insertion of the Voltage-Sensitive Domain into Circularly Permuted Red Fluorescent Protein as a Design for Genetically Encoded Voltage Sensor. PLoS One 2017, 12, e0184225 10.1371/journal.pone.0184225. [DOI] [PMC free article] [PubMed] [Google Scholar]
- Kannan M.; Vasan G.; Huang C.; Haziza S.; Li J. Z.; Inan H.; Schnitzer M. J.; Pieribone V. A. Fast, in Vivo Voltage Imaging Using a Red Fluorescent Indicator. Nat. Methods 2018, 15, 1108–1116. 10.1038/s41592-018-0188-7. [DOI] [PMC free article] [PubMed] [Google Scholar]
- Mishina Y.; Mutoh H.; Song C.; Knöpfel T. Exploration of Genetically Encoded Voltage Indicators Based on a Chimeric Voltage Sensing Domain. Front. Mol. Neurosci. 2014, 7, 78. 10.3389/fnmol.2014.00078. [DOI] [PMC free article] [PubMed] [Google Scholar]
- Werley C. A.; Chien M.-P.; Cohen A. E. Ultrawidefield Microscope for High-Speed Fluorescence Imaging and Targeted Optogenetic Stimulation. Biomed. Opt. Express 2017, 8, 5794–5813. 10.1364/BOE.8.005794. [DOI] [PMC free article] [PubMed] [Google Scholar]
- Tian H.; Davis H. C.; Wong-Campos J. D.; Park P.; Fan L. Z.; Gmeiner B.; Begum S.; Werley C. A.; Borja G. B.; Upadhyay H.; et al. Author Correction: Video-Based Pooled Screening Yields Improved Far-Red Genetically Encoded Voltage Indicators. Nat. Methods 2023, 20, 469. 10.1038/s41592-023-01805-2. [DOI] [PubMed] [Google Scholar]
- Grynkiewicz G.; Poenie M.; Tsien R. Y. A New Generation of Ca2+ Indicators with Greatly Improved Fluorescence Properties. J. Biol. Chem. 1985, 260, 3440–3450. 10.1016/S0021-9258(19)83641-4. [DOI] [PubMed] [Google Scholar]
- Miyawaki A.; Llopis J.; Heim R.; McCaffery J. M.; Adams J. A.; Ikura M.; Tsien R. Y. Fluorescent Indicators for Ca2+ Based on Green Fluorescent Proteins and Calmodulin. Nature 1997, 388, 882–887. 10.1038/42264. [DOI] [PubMed] [Google Scholar]
- Horikawa K.; Yamada Y.; Matsuda T.; Kobayashi K.; Hashimoto M.; Matsu-ura T.; Miyawaki A.; Michikawa T.; Mikoshiba K.; Nagai T. Spontaneous Network Activity Visualized by Ultrasensitive Ca(2+) Indicators, Yellow Cameleon-Nano. Nat. Methods 2010, 7, 729–732. 10.1038/nmeth.1488. [DOI] [PubMed] [Google Scholar]
- Palmer A. E.; Giacomello M.; Kortemme T.; Hires S. A.; Lev-Ram V.; Baker D.; Tsien R. Y. Ca2+ Indicators Based on Computationally Redesigned Calmodulin-Peptide Pairs. Chem. Biol. 2006, 13, 521–530. 10.1016/j.chembiol.2006.03.007. [DOI] [PubMed] [Google Scholar]
- Greotti E.; Fortunati I.; Pendin D.; Ferrante C.; Galla L.; Zentilin L.; Giacca M.; Kaludercic N.; Di Sante M.; Mariotti L.; et al. MCerulean3-Based Cameleon Sensor to Explore Mitochondrial Ca2+ Dynamics In Vivo. iScience 2019, 16, 340–355. 10.1016/j.isci.2019.05.031. [DOI] [PMC free article] [PubMed] [Google Scholar]
- Shemetov A. A.; Monakhov M. V.; Zhang Q.; Canton-Josh J. E.; Kumar M.; Chen M.; Matlashov M. E.; Li X.; Yang W.; Nie L.; et al. A Near-Infrared Genetically Encoded Calcium Indicator for in Vivo Imaging. Nat. Biotechnol. 2021, 39, 368–377. 10.1038/s41587-020-0710-1. [DOI] [PMC free article] [PubMed] [Google Scholar]
- Thestrup T.; Litzlbauer J.; Bartholomäus I.; Mues M.; Russo L.; Dana H.; Kovalchuk Y.; Liang Y.; Kalamakis G.; Laukat Y.; et al. Optimized Ratiometric Calcium Sensors for Functional in Vivo Imaging of Neurons and T Lymphocytes. Nat. Methods 2014, 11, 175–182. 10.1038/nmeth.2773. [DOI] [PubMed] [Google Scholar]
- Zhang D.; Redington E.; Gong Y. Rational Engineering of Ratiometric Calcium Sensors with Bright Green and Red Fluorescent Proteins. Commun. Biol. 2021, 4, 924. 10.1038/s42003-021-02452-z. [DOI] [PMC free article] [PubMed] [Google Scholar]
- Rose T.; Goltstein P. M.; Portugues R.; Griesbeck O. Putting a Finishing Touch on GECIs. Front. Mol. Neurosci. 2014, 7, 88. 10.3389/fnmol.2014.00088. [DOI] [PMC free article] [PubMed] [Google Scholar]
- Dana H.; Mohar B.; Sun Y.; Narayan S.; Gordus A.; Hasseman J. P; Tsegaye G.; Holt G. T; Hu A.; Walpita D.; Patel R.; Macklin J. J; Bargmann C. I; Ahrens M. B; Schreiter E. R; Jayaraman V.; Looger L. L; Svoboda K.; Kim D. S Sensitive Red Protein Calcium Indicators for Imaging Neural Activity. Elife 2016, 5, e12727. 10.7554/eLife.12727. [DOI] [PMC free article] [PubMed] [Google Scholar]
- Wu J.; Liu L.; Matsuda T.; Zhao Y.; Rebane A.; Drobizhev M.; Chang Y.-F.; Araki S.; Arai Y.; March K.; et al. Improved Orange and Red Ca2± Indicators and Photophysical Considerations for Optogenetic Applications. ACS Chem. Neurosci. 2013, 4, 963–972. 10.1021/cn400012b. [DOI] [PMC free article] [PubMed] [Google Scholar]
- Chen T.-W.; Wardill T. J.; Sun Y.; Pulver S. R.; Renninger S. L.; Baohan A.; Schreiter E. R.; Kerr R. A.; Orger M. B.; Jayaraman V.; et al. Ultrasensitive Fluorescent Proteins for Imaging Neuronal Activity. Nature 2013, 499, 295–300. 10.1038/nature12354. [DOI] [PMC free article] [PubMed] [Google Scholar]
- Dana H.; Sun Y.; Mohar B.; Hulse B. K.; Kerlin A. M.; Hasseman J. P.; Tsegaye G.; Tsang A.; Wong A.; Patel R.; et al. High-Performance Calcium Sensors for Imaging Activity in Neuronal Populations and Microcompartments. Nat. Methods 2019, 16, 649–657. 10.1038/s41592-019-0435-6. [DOI] [PubMed] [Google Scholar]
- Li J.; Shang Z.; Chen J.-H.; Gu W.; Yao L.; Yang X.; Sun X.; Wang L.; Wang T.; Liu S.; et al. Engineering of NEMO as Calcium Indicators with Large Dynamics and High Sensitivity. Nat. Methods 2023, 20, 918–924. 10.1038/s41592-023-01852-9. [DOI] [PMC free article] [PubMed] [Google Scholar]
- Bierbuesse F.; Bourges A. C.; Gielen V.; Monkemoller V.; Vandenberg W.; Shen Y.; Hofkens J.; Vanden Berghe P.; Campbell R. E.; Moeyaert B.; Dedecker P. Absolute Measurement of Cellular Activities Using Photochromic Single-Fluorophore Biosensors and Intermittent Quantification. Nat. Commun. 2022, 13, 1850. 10.1038/s41467-022-29508-w. [DOI] [PMC free article] [PubMed] [Google Scholar]
- Fosque B. F.; Sun Y.; Dana H.; Yang C.-T.; Ohyama T.; Tadross M. R.; Patel R.; Zlatic M.; Kim D. S.; Ahrens M. B.; et al. Neural Circuits. Labeling of Active Neural Circuits in Vivo with Designed Calcium Integrators. Science 2015, 347, 755–760. 10.1126/science.1260922. [DOI] [PubMed] [Google Scholar]
- Moeyaert B.; Holt G.; Madangopal R.; Perez-Alvarez A.; Fearey B. C.; Trojanowski N. F.; Ledderose J.; Zolnik T. A.; Das A.; Patel D.; Brown T. A.; Sachdev R. N. S.; Eickholt B. J.; Larkum M. E.; Turrigiano G. G.; Dana H.; Gee C. E.; Oertner T. G.; Hope B. T.; Schreiter E. R. Improved Methods for Marking Active Neuron Populations. Nat. Commun. 2018, 9, 4440. 10.1038/s41467-018-06935-2. [DOI] [PMC free article] [PubMed] [Google Scholar]
- Das A.; Margevicius D.; Borovicka J.; Icardi J.; Patel D.; Paquet M.-E.; Dana H. Enhanced Detection Sensitivity of Neuronal Activity Patterns Using CaMPARI1 vs. CaMPARI2. Front. Neurosci. 2023, 16, 1055554. 10.3389/fnins.2022.1055554. [DOI] [PMC free article] [PubMed] [Google Scholar]
- Pratt E. P. S.; Damon L. J.; Anson K. J.; Palmer A. E. Tools and Techniques for Illuminating the Cell Biology of Zinc. Biochim. Biophys. Acta Mol. Cell Res. 2021, 1868, 118865. 10.1016/j.bbamcr.2020.118865. [DOI] [PMC free article] [PubMed] [Google Scholar]
- Wu S.-Y.; Shen Y.; Shkolnikov I.; Campbell R. E. Fluorescent Indicators for Biological Imaging of Monatomic Ions. Front. Cell Dev. Biol. 2022, 10, 885440. 10.3389/fcell.2022.885440. [DOI] [PMC free article] [PubMed] [Google Scholar]
- Jensen K. K.; Martini L.; Schwartz T. W. Enhanced Fluorescence Resonance Energy Transfer between Spectral Variants of Green Fluorescent Protein through Zinc-Site Engineering. Biochemistry 2001, 40, 938–945. 10.1021/bi001765m. [DOI] [PubMed] [Google Scholar]
- Evers T. H.; Appelhof M. A. M.; de Graaf-Heuvelmans P. T. H. M.; Meijer E. W.; Merkx M. Ratiometric Detection of Zn(II) Using Chelating Fluorescent Protein Chimeras. J. Mol. Biol. 2007, 374, 411–425. 10.1016/j.jmb.2007.09.021. [DOI] [PubMed] [Google Scholar]
- Hessels A. M.; Chabosseau P.; Bakker M. H.; Engelen W.; Rutter G. A.; Taylor K. M.; Merkx M. EZinCh-2: A Versatile, Genetically Encoded FRET Sensor for Cytosolic and Intraorganelle Zn(2+) Imaging. ACS Chem. Biol. 2015, 10, 2126–2134. 10.1021/acschembio.5b00211. [DOI] [PMC free article] [PubMed] [Google Scholar]
- Carter K. P.; Carpenter M. C.; Fiedler B.; Jimenez R.; Palmer A. E. Critical Comparison of FRET-Sensor Functionality in the Cytosol and Endoplasmic Reticulum and Implications for Quantification of Ions. Anal. Chem. 2017, 89, 9601–9608. 10.1021/acs.analchem.7b02933. [DOI] [PMC free article] [PubMed] [Google Scholar]
- van Dongen E. M. W. M.; Dekkers L. M.; Spijker K.; Meijer E. W.; Klomp L. W. J.; Merkx M. Ratiometric Fluorescent Sensor Proteins with Subnanomolar Affinity for Zn(II) Based on Copper Chaperone Domains. J. Am. Chem. Soc. 2006, 128, 10754–10762. 10.1021/ja0610030. [DOI] [PubMed] [Google Scholar]
- Vinkenborg J. L.; Nicolson T. J.; Bellomo E. A.; Koay M. S.; Rutter G. A.; Merkx M. Genetically Encoded FRET Sensors to Monitor Intracellular Zn2+ Homeostasis. Nat. Methods 2009, 6, 737–740. 10.1038/nmeth.1368. [DOI] [PMC free article] [PubMed] [Google Scholar]
- Dittmer P. J.; Miranda J. G.; Gorski J. A.; Palmer A. E. Genetically Encoded Sensors to Elucidate Spatial Distribution of Cellular Zinc. J. Biol. Chem. 2009, 284, 16289–16297. 10.1074/jbc.M900501200. [DOI] [PMC free article] [PubMed] [Google Scholar]
- Qiao W.; Mooney M.; Bird A. J.; Winge D. R.; Eide D. J. Zinc Binding to a Regulatory Zinc-Sensing Domain Monitored in Vivo by Using FRET. Proc. Natl. Acad. Sci. U.S.A. 2006, 103, 8674–8679. 10.1073/pnas.0600928103. [DOI] [PMC free article] [PubMed] [Google Scholar]
- Fiedler B. L.; Van Buskirk S.; Carter K. P.; Qin Y.; Carpenter M. C.; Palmer A. E.; Jimenez R. Droplet Microfluidic Flow Cytometer For Sorting On Transient Cellular Responses Of Genetically-Encoded Sensors. Anal. Chem. 2017, 89, 711–719. 10.1021/acs.analchem.6b03235. [DOI] [PMC free article] [PubMed] [Google Scholar]
- Anson K. J.; Corbet G. A.; Palmer A. E. Zn2+ Influx Activates ERK and Akt Signaling Pathways. Proc. Natl. Acad. Sci. U.S.A. 2021, 118, e2015786118. 10.1073/pnas.2015786118. [DOI] [PMC free article] [PubMed] [Google Scholar]
- Slocum J. D.; Palmer A. E.; Jimenez R. Intramolecular Fluorescent Protein Association in a Class of Zinc FRET Sensors Leads to Increased Dynamic Range. J. Phys. Chem. B 2019, 123, 3079–3085. 10.1021/acs.jpcb.9b02479. [DOI] [PMC free article] [PubMed] [Google Scholar]
- Pratt E. P. S.; Anson K. J.; Tapper J. K.; Simpson D. M.; Palmer A. E. Systematic Comparison of Vesicular Targeting Signals Leads to the Development of Genetically Encoded Vesicular Fluorescent Zn2+ and Ph Sensors. ACS Sens. 2020, 5, 3879–3891. 10.1021/acssensors.0c01231. [DOI] [PMC free article] [PubMed] [Google Scholar]
- Chen M.; Zhang S.; Xing Y.; Li X.; He Y.; Wang Y.; Oberholzer J.; Ai H.-W. Genetically Encoded, Photostable Indicators to Image Dynamic Zn2+ Secretion of Pancreatic Islets. Anal. Chem. 2019, 91, 12212–12219. 10.1021/acs.analchem.9b01802. [DOI] [PMC free article] [PubMed] [Google Scholar]
- Chen Z.; Ai H.-W. Single Fluorescent Protein-Based Indicators for Zinc Ion (Zn(2+)). Anal. Chem. 2016, 88, 9029–9036. 10.1021/acs.analchem.6b01653. [DOI] [PMC free article] [PubMed] [Google Scholar]
- Minckley T. F.; Zhang C.; Fudge D. H.; Dischler A. M.; LeJeune K. D.; Xu H.; Qin Y. Sub-Nanomolar Sensitive GZnP3 Reveals TRPML1-Mediated Neuronal Zn2+ Signals. Nat. Commun. 2019, 10, 4806. 10.1038/s41467-019-12761-x. [DOI] [PMC free article] [PubMed] [Google Scholar]
- Wu T.; Kumar M.; Zhang J.; Zhao S.; Drobizhev M.; McCollum M.; Anderson C. T.; Wang Y.; Pokorny A.; Tian X.; Zhang Y.; Tzounopoulos T.; Ai H.-w. A Genetically Encoded Far-Red Fluorescent Indicator for Imaging Synaptically Released Zn2. Sci. Adv. 2023, 9, eadd2058. 10.1126/sciadv.add2058. [DOI] [PMC free article] [PubMed] [Google Scholar]
- Dischler A. M.; Maslar D.; Zhang C.; Qin Y. Development and Characterization of a Red Fluorescent Protein-Based Sensor RZnP1 for the Detection of Cytosolic Zn2. ACS Sens. 2022, 7, 3838–3845. 10.1021/acssensors.2c01774. [DOI] [PubMed] [Google Scholar]
- Bischof H.; Rehberg M.; Stryeck S.; Artinger K.; Eroglu E.; Waldeck-Weiermair M.; Gottschalk B.; Rost R.; Deak A. T.; Niedrist T.; Vujic N.; Lindermuth H.; Prassl R.; Pelzmann B.; Groschner K.; Kratky D.; Eller K.; Rosenkranz A. R.; Madl T.; Plesnila N.; Graier W. F.; Malli R. Novel Genetically Encoded Fluorescent Probes Enable Real-Time Detection of Potassium in Vitro and in Vivo. Nat. Commun. 2017, 8, 1422. 10.1038/s41467-017-01615-z. [DOI] [PMC free article] [PubMed] [Google Scholar]
- Shen Y.; Wu S.-Y.; Rancic V.; Aggarwal A.; Qian Y.; Miyashita S.-I.; Ballanyi K.; Campbell R. E.; Dong M. Genetically Encoded Fluorescent Indicators for Imaging Intracellular Potassium Ion Concentration. Commun. Biol. 2019, 2, 18. 10.1038/s42003-018-0269-2. [DOI] [PMC free article] [PubMed] [Google Scholar]
- Torres Cabán C. C.; Yang M.; Lai C.; Yang L.; Subach F. V.; Smith B. O.; Piatkevich K. D.; Boyden E. S. Tuning the Sensitivity of Genetically Encoded Fluorescent Potassium Indicators through Structure-Guided and Genome Mining Strategies. ACS Sens. 2022, 7, 1336–1346. 10.1021/acssensors.1c02201. [DOI] [PMC free article] [PubMed] [Google Scholar]
- Baek K.; Ji K.; Peng W.; Liyanaarachchi S. M.; Dodani S. C. The Design and Evolution of Fluorescent Protein-Based Sensors for Monoatomic Ions in Biology. Protein Eng. Des. Sel. 2021, 34, gzab023 10.1093/protein/gzab023. [DOI] [PMC free article] [PubMed] [Google Scholar]
- Lindenburg L. H.; Vinkenborg J. L.; Oortwijn J.; Aper S. J. A.; Merkx M. MagFRET: The First Genetically Encoded Fluorescent Mg2+ Sensor. PLoS One 2013, 8, e82009. 10.1371/journal.pone.0082009. [DOI] [PMC free article] [PubMed] [Google Scholar]
- Koldenkova V. P.; Matsuda T.; Nagai T. MagIC, a Genetically Encoded Fluorescent Indicator for Monitoring Cellular Mg2+ Using a Non-Förster Resonance Energy Transfer Ratiometric Imaging Approach. J. Biomed. Opt. 2015, 20, 101203. 10.1117/1.JBO.20.10.101203. [DOI] [PubMed] [Google Scholar]
- Maeshima K.; Matsuda T.; Shindo Y.; Imamura H.; Tamura S.; Imai R.; Kawakami S.; Nagashima R.; Soga T.; Noji H.; Oka K.; Nagai T. A Transient Rise in Free Mg2+ Ions Released from ATP-Mg Hydrolysis Contributes to Mitotic Chromosome Condensation. Curr. Biol. 2018, 28, 444. 10.1016/j.cub.2017.12.035. [DOI] [PubMed] [Google Scholar]
- Wegner S. V.; Arslan H.; Sunbul M.; Yin J.; He C. Dynamic Copper(I) Imaging in Mammalian Cells with a Genetically Encoded Fluorescent Copper(I) Sensor. J. Am. Chem. Soc. 2010, 132, 2567–2569. 10.1021/ja9097324. [DOI] [PubMed] [Google Scholar]
- Wegner S. V.; Sun F.; Hernandez N.; He C. The Tightly Regulated Copper Window in Yeast. Chem. Commun. 2011, 47, 2571–2573. 10.1039/C0CC04292G. [DOI] [PubMed] [Google Scholar]
- Zou W.; Nguyen H. N.; Zastrow M. L. Mutant Flavin-Based Fluorescent Protein Sensors for Detecting Intracellular Zinc and Copper in Escherichia Coli. ACS Sens. 2022, 7, 3369–3378. 10.1021/acssensors.2c01376. [DOI] [PMC free article] [PubMed] [Google Scholar]
- Zou W.; Le K.; Zastrow M. L. Live-Cell Copper-Induced Fluorescence Quenching of the Flavin-Binding Fluorescent Protein CreiLOV. Chembiochem 2020, 21, 1356–1363. 10.1002/cbic.201900669. [DOI] [PubMed] [Google Scholar]
- Zhao H.; Zastrow M. L. Transition Metals Induce Quenching of Monomeric Near-Infrared Fluorescent Proteins. Biochemistry 2022, 61, 494–504. 10.1021/acs.biochem.1c00705. [DOI] [PMC free article] [PubMed] [Google Scholar]
- Soleja N.; Manzoor O.; Khan P.; Mohsin M. Engineering Genetically Encoded FRET-Based Nanosensors for Real Time Display of Arsenic (As3+) Dynamics in Living Cells. Sci. Rep. 2019, 9, 11240. 10.1038/s41598-019-47682-8. [DOI] [PMC free article] [PubMed] [Google Scholar]
- Park J.; Cleary M. B.; Li D.; Mattocks J. A.; Xu J.; Wang H.; Mukhopadhyay S.; Gale E. M.; Cotruvo J. A. A Genetically Encoded Fluorescent Sensor for Manganese(II), Engineered from Lanmodulin. Proc. Natl. Acad. Sci. U.S.A. 2022, 119, e2212723119. 10.1073/pnas.2212723119. [DOI] [PMC free article] [PubMed] [Google Scholar]
- Wachter R. M.; Remington S. J. Sensitivity of the Yellow Variant of Green Fluorescent Protein to Halides and Nitrate. Curr. Biol. 1999, 9, R628. 10.1016/S0960-9822(99)80408-4. [DOI] [PubMed] [Google Scholar]
- Jayaraman S.; Haggie P.; Wachter R. M.; Remington S. J.; Verkman A. S. Mechanism and Cellular Applications of a Green Fluorescent Protein-Based Halide Sensor. J. Biol. Chem. 2000, 275, 6047–6050. 10.1074/jbc.275.9.6047. [DOI] [PubMed] [Google Scholar]
- Kuner T.; Augustine G. J. A Genetically Encoded Ratiometric Indicator for Chloride: Capturing Chloride Transients in Cultured Hippocampal Neurons. Neuron 2000, 27, 447–459. 10.1016/S0896-6273(00)00056-8. [DOI] [PubMed] [Google Scholar]
- Grimley J. S.; Li L.; Wang W.; Wen L.; Beese L. S.; Hellinga H. W.; Augustine G. J. Visualization of Synaptic Inhibition with an Optogenetic Sensor Developed by Cell-Free Protein Engineering Automation. J. Neurosci. 2013, 33, 16297–16309. 10.1523/JNEUROSCI.4616-11.2013. [DOI] [PMC free article] [PubMed] [Google Scholar]
- Arosio D.; Ricci F.; Marchetti L.; Gualdani R.; Albertazzi L.; Beltram F. Simultaneous Intracellular Chloride and PH Measurements Using a GFP-Based Sensor. Nat. Methods 2010, 7, 516–518. 10.1038/nmeth.1471. [DOI] [PubMed] [Google Scholar]
- Salto R.; Giron M. D.; Puente-Muñoz V.; Vilchez J. D.; Espinar-Barranco L.; Valverde-Pozo J.; Arosio D.; Paredes J. M. New Red-Emitting Chloride-Sensitive Fluorescent Protein with Biological Uses. ACS Sens. 2021, 6, 2563–2573. 10.1021/acssensors.1c00094. [DOI] [PMC free article] [PubMed] [Google Scholar]
- Tutol J. N.; Lee J.; Chi H.; Faizuddin F. N.; Abeyrathna S. S.; Zhou Q.; Morcos F.; Meloni G.; Dodani S. C. A Single Point Mutation Converts a Proton-Pumping Rhodopsin into a Red-Shifted, Turn-on Fluorescent Sensor for Chloride. Chem. Sci. 2021, 12, 5655–5663. 10.1039/D0SC06061E. [DOI] [PMC free article] [PubMed] [Google Scholar]
- Tutol J. N.; Kam H. C.; Dodani S. C. Identification of MNeonGreen as a PH-Dependent, Turn-On Fluorescent Protein Sensor for Chloride. Chembiochem 2019, 20, 1759–1765. 10.1002/cbic.201900147. [DOI] [PMC free article] [PubMed] [Google Scholar]
- Tutol J. N.; Peng W.; Dodani S. C. Discovery and Characterization of a Naturally Occurring, Turn-On Yellow Fluorescent Protein Sensor for Chloride. Biochemistry 2019, 58, 31–35. 10.1021/acs.biochem.8b00928. [DOI] [PMC free article] [PubMed] [Google Scholar]
- Arosio D.; Ratto G. M. Twenty Years of Fluorescence Imaging of Intracellular Chloride. Front. Cell Neurosci. 2014, 8, 258. 10.3389/fncel.2014.00258. [DOI] [PMC free article] [PubMed] [Google Scholar]
- Gu H.; Lalonde S.; Okumoto S.; Looger L. L.; Scharff-Poulsen A. M.; Grossman A. R.; Kossmann J.; Jakobsen I.; Frommer W. B. A Novel Analytical Method for in Vivo Phosphate Tracking. FEBS Lett. 2006, 580, 5885–5893. 10.1016/j.febslet.2006.09.048. [DOI] [PMC free article] [PubMed] [Google Scholar]
- Mukherjee P.; Banerjee S.; Wheeler A.; Ratliff L. A.; Irigoyen S.; Garcia L. R.; Lockless S. W.; Versaw W. K. Live Imaging of Inorganic Phosphate in Plants with Cellular and Subcellular Resolution. Plant Physiol. 2015, 167, 628–638. 10.1104/pp.114.254003. [DOI] [PMC free article] [PubMed] [Google Scholar]
- Assunção A. G. L.; Gjetting S. K.; Hansen M.; Fuglsang A. T.; Schulz A. Live Imaging of Phosphate Levels in Arabidopsis Root Cells Expressing a FRET-Based Phosphate Sensor. Plants 2020, 9, 1310. 10.3390/plants9101310. [DOI] [PMC free article] [PubMed] [Google Scholar]
- Zhang S.; Daniels D. A.; Ivanov S.; Jurgensen L.; Müller L. M.; Versaw W. K.; Harrison M. J. A Genetically Encoded Biosensor Reveals Spatiotemporal Variation in Cellular Phosphate Content in Brachypodium Distachyon Mycorrhizal Roots. New Phytol. 2022, 234, 1817–1831. 10.1111/nph.18081. [DOI] [PMC free article] [PubMed] [Google Scholar]
- Yan K.; Gao L.-N.; Cui Y.-L.; Zhang Y.; Zhou X. The Cyclic AMP Signaling Pathway: Exploring Targets for Successful Drug Discovery (Review). Mol. Med. Rep. 2016, 13, 3715–3723. 10.3892/mmr.2016.5005. [DOI] [PMC free article] [PubMed] [Google Scholar]
- Lissandron V.; Terrin A.; Collini M.; D’alfonso L.; Chirico G.; Pantano S.; Zaccolo M. Improvement of a FRET-Based Indicator for CAMP by Linker Design and Stabilization of Donor-Acceptor Interaction. J. Mol. Biol. 2005, 354, 546–555. 10.1016/j.jmb.2005.09.089. [DOI] [PubMed] [Google Scholar]
- Zaccolo M.; Pozzan T. Discrete Microdomains with High Concentration of CAMP in Stimulated Rat Neonatal Cardiac Myocytes. Science 2002, 295, 1711–1715. 10.1126/science.1069982. [DOI] [PubMed] [Google Scholar]
- Ponsioen B.; Zhao J.; Riedl J.; Zwartkruis F.; van der Krogt G.; Zaccolo M.; Moolenaar W. H.; Bos J. L.; Jalink K. Detecting CAMP-Induced Epac Activation by Fluorescence Resonance Energy Transfer: Epac as a Novel CAMP Indicator. EMBO Rep. 2004, 5, 1176–1180. 10.1038/sj.embor.7400290. [DOI] [PMC free article] [PubMed] [Google Scholar]
- DiPilato L. M.; Cheng X.; Zhang J. Fluorescent Indicators of CAMP and Epac Activation Reveal Differential Dynamics of CAMP Signaling within Discrete Subcellular Compartments. Proc. Natl. Acad. Sci. U.S.A. 2004, 101, 16513–16518. 10.1073/pnas.0405973101. [DOI] [PMC free article] [PubMed] [Google Scholar]
- Nikolaev V. O.; Bünemann M.; Hein L.; Hannawacker A.; Lohse M. J. Novel Single Chain CAMP Sensors for Receptor-Induced Signal Propagation. J. Biol. Chem. 2004, 279, 37215–37218. 10.1074/jbc.C400302200. [DOI] [PubMed] [Google Scholar]
- Massengill C. I.; Day-Cooney J.; Mao T.; Zhong H. Genetically Encoded Sensors towards Imaging CAMP and PKA Activity in Vivo. J. Neurosci. Methods 2021, 362, 109298. 10.1016/j.jneumeth.2021.109298. [DOI] [PMC free article] [PubMed] [Google Scholar]
- Surdo N. C.; Berrera M.; Koschinski A.; Brescia M.; Machado M. R.; Carr C.; Wright P.; Gorelik J.; Morotti S.; Grandi E.; Bers D. M.; Pantano S.; Zaccolo M. FRET Biosensor Uncovers CAMP Nano-Domains at β-Adrenergic Targets That Dictate Precise Tuning of Cardiac Contractility. Nat. Commun. 2017, 8, 15031. 10.1038/ncomms15031. [DOI] [PMC free article] [PubMed] [Google Scholar]
- Qiao J.; Mei F. C.; Popov V. L.; Vergara L. A.; Cheng X. Cell Cycle-Dependent Subcellular Localization of Exchange Factor Directly Activated by CAMP. J. Biol. Chem. 2002, 277, 26581–26586. 10.1074/jbc.M203571200. [DOI] [PubMed] [Google Scholar]
- Klarenbeek J.; Goedhart J.; van Batenburg A.; Groenewald D.; Jalink K. Fourth-Generation Epac-Based FRET Sensors for CAMP Feature Exceptional Brightness, Photostability and Dynamic Range: Characterization of Dedicated Sensors for FLIM, for Ratiometry and with High Affinity. PLoS One 2015, 10, e0122513 10.1371/journal.pone.0122513. [DOI] [PMC free article] [PubMed] [Google Scholar]
- van der Krogt G. N. M.; Ogink J.; Ponsioen B.; Jalink K. A Comparison of Donor-Acceptor Pairs for Genetically Encoded FRET Sensors: Application to the Epac CAMP Sensor as an Example. PLoS One 2008, 3, e1916. 10.1371/journal.pone.0001916. [DOI] [PMC free article] [PubMed] [Google Scholar]
- DiPilato L. M.; Zhang J. The Role of Membrane Microdomains in Shaping Beta2-Adrenergic Receptor-Mediated CAMP Dynamics. Mol. Biosyst. 2009, 5, 832–837. 10.1039/b823243a. [DOI] [PubMed] [Google Scholar]
- Violin J. D.; DiPilato L. M.; Yildirim N.; Elston T. C.; Zhang J.; Lefkowitz R. J. Beta2-Adrenergic Receptor Signaling and Desensitization Elucidated by Quantitative Modeling of Real Time CAMP Dynamics. J. Biol. Chem. 2008, 283, 2949–2961. 10.1074/jbc.M707009200. [DOI] [PubMed] [Google Scholar]
- Dao K. K.; Teigen K.; Kopperud R.; Hodneland E.; Schwede F.; Christensen A. E.; Martinez A.; Do̷skeland S. O. Epac1 and CAMP-Dependent Protein Kinase Holoenzyme Have Similar CAMP Affinity, but Their CAMP Domains Have Distinct Structural Features and Cyclic Nucleotide Recognition. J. Biol. Chem. 2006, 281, 21500–21511. 10.1074/jbc.M603116200. [DOI] [PubMed] [Google Scholar]
- Rehmann H.; Schwede F.; Do̷skeland S. O.; Wittinghofer A.; Bos J. L. Ligand-Mediated Activation of the CAMP-Responsive Guanine Nucleotide Exchange Factor Epac. J. Biol. Chem. 2003, 278, 38548. 10.1074/jbc.M306292200. [DOI] [PubMed] [Google Scholar]
- Zhang J. Z.; Lu T.-W.; Stolerman L. M.; Tenner B.; Yang J. R.; Zhang J.-F.; Falcke M.; Rangamani P.; Taylor S. S.; Mehta S.; Zhang J. Phase Separation of a PKA Regulatory Subunit Controls CAMP Compartmentation and Oncogenic Signaling. Cell 2020, 182, 1531. 10.1016/j.cell.2020.07.043. [DOI] [PMC free article] [PubMed] [Google Scholar]
- Everett K. L.; Cooper D. M. F. An Improved Targeted CAMP Sensor to Study the Regulation of Adenylyl Cyclase 8 by Ca2+ Entry through Voltage-Gated Channels. PLoS One 2013, 8, e75942. 10.1371/journal.pone.0075942. [DOI] [PMC free article] [PubMed] [Google Scholar]
- Salonikidis P. S.; Niebert M.; Ullrich T.; Bao G.; Zeug A.; Richter D. W. An Ion-Insensitive CAMP Biosensor for Long Term Quantitative Ratiometric Fluorescence Resonance Energy Transfer (FRET) Measurements under Variable Physiological Conditions. J. Biol. Chem. 2011, 286, 23419–23431. 10.1074/jbc.M111.236869. [DOI] [PMC free article] [PubMed] [Google Scholar]
- Klarenbeek J. B.; Goedhart J.; Hink M. A.; Gadella T. W. J.; Jalink K. A MTurquoise-Based CAMP Sensor for Both FLIM and Ratiometric Read-out Has Improved Dynamic Range. PLoS One 2011, 6, e19170. 10.1371/journal.pone.0019170. [DOI] [PMC free article] [PubMed] [Google Scholar]
- Kitaguchi T.; Oya M.; Wada Y.; Tsuboi T.; Miyawaki A. Extracellular calcium influx activates adenylate cyclase 1 and potentiates insulin secretion in MIN6 cells. Biochem. J. 2013, 450 (2), 365–373. 10.1042/BJ20121022. [DOI] [PubMed] [Google Scholar]
- Odaka H.; Arai S.; Inoue T.; Kitaguchi T. Genetically-Encoded Yellow Fluorescent CAMP Indicator with an Expanded Dynamic Range for Dual-Color Imaging. PLoS One 2014, 9, e100252. 10.1371/journal.pone.0100252. [DOI] [PMC free article] [PubMed] [Google Scholar]
- Tewson P. H.; Martinka S.; Shaner N. C.; Hughes T. E.; Quinn A. M. New DAG and cAMP Sensors Optimized for Live-Cell Assays in Automated Laboratories. J. Biomol. Screen. 2016, 21 (3), 298–305. 10.1177/1087057115618608. [DOI] [PMC free article] [PubMed] [Google Scholar]
- Hackley C. R.; Mazzoni E. O.; Blau J. CAMPr: A Single-Wavelength Fluorescent Sensor for Cyclic AMP. Sci. Signal. 2018, 11, eaah3738. 10.1126/scisignal.aah3738. [DOI] [PMC free article] [PubMed] [Google Scholar]
- Harada K.; Ito M.; Wang X.; Tanaka M.; Wongso D.; Konno A.; Hirai H.; Hirase H.; Tsuboi T.; Kitaguchi T. Red Fluorescent Protein-Based CAMP Indicator Applicable to Optogenetics and in Vivo Imaging. Sci. Rep. 2017, 7, 7351. 10.1038/s41598-017-07820-6. [DOI] [PMC free article] [PubMed] [Google Scholar]
- Ohta Y.; Furuta T.; Nagai T.; Horikawa K. Red Fluorescent CAMP Indicator with Increased Affinity and Expanded Dynamic Range. Sci. Rep. 2018, 8, 1866. 10.1038/s41598-018-20251-1. [DOI] [PMC free article] [PubMed] [Google Scholar]
- Lissandron V.; Rossetto M. G.; Erbguth K.; Fiala A.; Daga A.; Zaccolo M. Transgenic Fruit-Flies Expressing a FRET-Based Sensor for in Vivo Imaging of CAMP Dynamics. Cell Signal. 2007, 19, 2296–2303. 10.1016/j.cellsig.2007.07.004. [DOI] [PubMed] [Google Scholar]
- Sidoli M.; Chen L.-C.; Lu A. J.; Wandless T. J.; Talbot W. S. A CAMP Sensor Based on Ligand-Dependent Protein Stabilization. ACS Chem. Biol. 2022, 17, 2024–2030. 10.1021/acschembio.2c00333. [DOI] [PMC free article] [PubMed] [Google Scholar]
- Massengill C. I.; Bayless-Edwards L.; Ceballos C. C.; Cebul E. R.; Cahill J.; Bharadwaj A.; Wilson E.; Qin M.; Whorton M. R.; Baconguis I.; et al. Sensitive Genetically Encoded Sensors for Population and Subcellular Imaging of CAMP in Vivo. Nat. Methods 2022, 19, 1461–1471. 10.1038/s41592-022-01646-5. [DOI] [PMC free article] [PubMed] [Google Scholar]
- de Rooij J.; Rehmann H.; van Triest M.; Cool R. H.; Wittinghofer A.; Bos J. L. Mechanism of Regulation of the Epac Family of CAMP-Dependent RapGEFs. J. Biol. Chem. 2000, 275, 20829–20836. 10.1074/jbc.M001113200. [DOI] [PubMed] [Google Scholar]
- Parnell E.; Smith B. O.; Yarwood S. J. The CAMP Sensors, EPAC1 and EPAC2, Display Distinct Subcellular Distributions despite Sharing a Common Nuclear Pore Localisation Signal. Cell Signal. 2015, 27, 989–996. 10.1016/j.cellsig.2015.02.009. [DOI] [PMC free article] [PubMed] [Google Scholar]
- Kawata S.; Mukai Y.; Nishimura Y.; Takahashi T.; Saitoh N. Green Fluorescent CAMP Indicator of High Speed and Specificity Suitable for Neuronal Live-Cell Imaging. Proc. Natl. Acad. Sci. U.S.A. 2022, 119, e2122618119. 10.1073/pnas.2122618119. [DOI] [PMC free article] [PubMed] [Google Scholar]
- Wang L.; Wu C.; Peng W.; Zhou Z.; Zeng J.; Li X.; Yang Y.; Yu S.; Zou Y.; Huang M.; Liu C.; Chen Y.; Li Y.; Ti P.; Liu W.; Gao Y.; Zheng W.; Zhong H.; Gao S.; Lu Z.; Ren P.-G.; Ng H. L.; He J.; Chen S.; Xu M.; Li Y.; Chu J. A High-Performance Genetically Encoded Fluorescent Indicator for in Vivo CAMP Imaging. Nat. Commun. 2022, 13, 5363. 10.1038/s41467-022-32994-7. [DOI] [PMC free article] [PubMed] [Google Scholar]
- Liu W.; Liu C.; Ren P.-G.; Chu J.; Wang L. An Improved Genetically Encoded Fluorescent CAMP Indicator for Sensitive CAMP Imaging and Fast Drug Screening. Front. Pharmacol. 2022, 13, 902290. 10.3389/fphar.2022.902290. [DOI] [PMC free article] [PubMed] [Google Scholar]
- Valsecchi F.; Ramos-Espiritu L. S.; Buck J.; Levin L. R.; Manfredi G. CAMP and Mitochondria. Physiology (Bethesda) 2013, 28, 199–209. 10.1152/physiol.00004.2013. [DOI] [PMC free article] [PubMed] [Google Scholar]
- Zhang J. Z.; Tenner B.; Mehta S.; Zhang J. Protocol for Using Fluorescent Sensors Targeted to Endogenous Proteins (FluoSTEPs) to Measure Microdomain-Specific Signaling Events. STAR Protocols 2021, 2, 100693. 10.1016/j.xpro.2021.100693. [DOI] [PMC free article] [PubMed] [Google Scholar]
- Tenner B.; Zhang J. Z.; Kwon Y.; Pessino V.; Feng S.; Huang B.; Mehta S.; Zhang J. FluoSTEPs: Fluorescent Biosensors for Monitoring Compartmentalized Signaling within Endogenous Microdomains. Sci. Adv. 2021, 7, eabe4091. 10.1126/sciadv.abe4091. [DOI] [PMC free article] [PubMed] [Google Scholar]
- Baillie G. S. Compartmentalized Signalling: Spatial Regulation of CAMP by the Action of Compartmentalized Phosphodiesterases. FEBS J. 2009, 276, 1790–1799. 10.1111/j.1742-4658.2009.06926.x. [DOI] [PubMed] [Google Scholar]
- Bock A.; Annibale P.; Konrad C.; Hannawacker A.; Anton S. E.; Maiellaro I.; Zabel U.; Sivaramakrishnan S.; Falcke M.; Lohse M. J. Optical Mapping of CAMP Signaling at the Nanometer Scale. Cell 2020, 182, 1519. 10.1016/j.cell.2020.07.035. [DOI] [PMC free article] [PubMed] [Google Scholar]
- Lohse C.; Bock A.; Maiellaro I.; Hannawacker A.; Schad L. R.; Lohse M. J.; Bauer W. R. Experimental and Mathematical Analysis of CAMP Nanodomains. PLoS One 2017, 12, e0174856 10.1371/journal.pone.0174856. [DOI] [PMC free article] [PubMed] [Google Scholar]
- Feinstein W. P.; Zhu B.; Leavesley S. J.; Sayner S. L.; Rich T. C. Assessment of Cellular Mechanisms Contributing to CAMP Compartmentalization in Pulmonary Microvascular Endothelial Cells. Am. J. Physiol. Cell Physiol. 2012, 302, C839–52. 10.1152/ajpcell.00361.2011. [DOI] [PMC free article] [PubMed] [Google Scholar]
- Yang P.-C.; Boras B. W.; Jeng M.-T.; Docken S. S.; Lewis T. J.; McCulloch A. D.; Harvey R. D.; Clancy C. E. A Computational Modeling and Simulation Approach to Investigate Mechanisms of Subcellular CAMP Compartmentation. PLoS Comput. Biol. 2016, 12, e1005005. 10.1371/journal.pcbi.1005005. [DOI] [PMC free article] [PubMed] [Google Scholar]
- Hofmann F. The CGMP System: Components and Function. Biol. Chem. 2020, 401, 447–469. 10.1515/hsz-2019-0386. [DOI] [PubMed] [Google Scholar]
- Sato M.; Hida N.; Ozawa T.; Umezawa Y. Fluorescent Indicators for Cyclic GMP Based on Cyclic GMP-Dependent Protein Kinase Ialpha and Green Fluorescent Proteins. Anal. Chem. 2000, 72, 5918–5924. 10.1021/ac0006167. [DOI] [PubMed] [Google Scholar]
- Honda A.; Adams S. R.; Sawyer C. L.; Lev-Ram V.; Tsien R. Y.; Dostmann W. R. Spatiotemporal Dynamics of Guanosine 3′,5′-Cyclic Monophosphate Revealed by a Genetically Encoded, Fluorescent Indicator. Proc. Natl. Acad. Sci. U.S.A. 2001, 98, 2437–2442. 10.1073/pnas.051631298. [DOI] [PMC free article] [PubMed] [Google Scholar]
- Betolngar D. B.; Mota É.; Fabritius A.; Nielsen J.; Hougaard C.; Christoffersen C. T.; Yang J.; Kehler J.; Griesbeck O.; Castro L. R. V.; et al. Phosphodiesterase 1 Bridges Glutamate Inputs with NO- and Dopamine-Induced Cyclic Nucleotide Signals in the Striatum. Cereb. Cortex 2019, 29, 5022–5036. 10.1093/cercor/bhz041. [DOI] [PubMed] [Google Scholar]
- Russwurm M.; Mullershausen F.; Friebe A.; Jäger R.; Russwurm C.; Koesling D. Design of Fluorescence Resonance Energy Transfer (FRET)-Based CGMP Indicators: A Systematic Approach. Biochem. J. 2007, 407, 69–77. 10.1042/BJ20070348. [DOI] [PMC free article] [PubMed] [Google Scholar]
- Honda A.; Sawyer C. L.; Cawley S. M.; Dostmann W. R. G.. Cygnets: In Vivo Characterization of Novel CGMP Indicators and in Vivo Imaging of Intracellular CGMP. In Phosphodiesterase Methods and Protocols; Methods in Molecular Biology; Humana: Totowa, NJ, 2005; Vol. 307, pp 27–43. 10.1385/1-59259-839-0:027 [DOI] [PubMed] [Google Scholar]
- Nikolaev V. O.; Gambaryan S.; Lohse M. J. Fluorescent Sensors for Rapid Monitoring of Intracellular CGMP. Nat. Methods 2006, 3, 23–25. 10.1038/nmeth816. [DOI] [PubMed] [Google Scholar]
- Matsuda S.; Harada K.; Ito M.; Takizawa M.; Wongso D.; Tsuboi T.; Kitaguchi T. Generation of a CGMP Indicator with an Expanded Dynamic Range by Optimization of Amino Acid Linkers between a Fluorescent Protein and PDE5α. ACS Sens. 2017, 2, 46–51. 10.1021/acssensors.6b00582. [DOI] [PubMed] [Google Scholar]
- Ros O.; Zagar Y.; Ribes S.; Baudet S.; Loulier K.; Couvet S.; Ladarre D.; Aghaie A.; Louail A.; Petit C.; Mechulam Y.; Lenkei Z.; Nicol X. SponGee: A Genetic Tool for Subcellular and Cell-Specific CGMP Manipulation. Cell Rep. 2019, 27, 4003. 10.1016/j.celrep.2019.05.102. [DOI] [PubMed] [Google Scholar]
- Niino Y.; Hotta K.; Oka K. Blue Fluorescent CGMP Sensor for Multiparameter Fluorescence Imaging. PLoS One 2010, 5, e9164. 10.1371/journal.pone.0009164. [DOI] [PMC free article] [PubMed] [Google Scholar]
- Calamera G.; Li D.; Ulsund A. H.; Kim J. J.; Neely O. C.; Moltzau L. R.; Bjørnerem M.; Paterson D.; Kim C.; Levy F. O.; Andressen K. W. FRET-Based Cyclic GMP Biosensors Measure Low CGMP Concentrations in Cardiomyocytes and Neurons. Commun. Biol. 2019, 2, 394. 10.1038/s42003-019-0641-x. [DOI] [PMC free article] [PubMed] [Google Scholar]
- Thunemann M.; Wen L.; Hillenbrand M.; Vachaviolos A.; Feil S.; Ott T.; Han X.; Fukumura D.; Jain R. K.; Russwurm M.; et al. Transgenic Mice for CGMP Imaging. Circ. Res. 2013, 113, 365–371. 10.1161/CIRCRESAHA.113.301063. [DOI] [PMC free article] [PubMed] [Google Scholar]
- Götz K. R.; Sprenger J. U.; Perera R. K.; Steinbrecher J. H.; Lehnart S. E.; Kuhn M.; Gorelik J.; Balligand J.-L.; Nikolaev V. O. Transgenic Mice for Real-Time Visualization of CGMP in Intact Adult Cardiomyocytes. Circ. Res. 2014, 114, 1235–1245. 10.1161/CIRCRESAHA.114.302437. [DOI] [PubMed] [Google Scholar]
- Nausch L. W. M.; Ledoux J.; Bonev A. D.; Nelson M. T.; Dostmann W. R. Differential Patterning of CGMP in Vascular Smooth Muscle Cells Revealed by Single GFP-Linked Biosensors. Proc. Natl. Acad. Sci. U.S.A. 2008, 105, 365–370. 10.1073/pnas.0710387105. [DOI] [PMC free article] [PubMed] [Google Scholar]
- Bhargava Y.; Hampden-Smith K.; Chachlaki K.; Wood K. C.; Vernon J.; Allerston C. K.; Batchelor A. M.; Garthwaite J. Improved Genetically-Encoded, FlincG-Type Fluorescent Biosensors for Neural CGMP Imaging. Front. Mol. Neurosci. 2013, 6, 26. 10.3389/fnmol.2013.00026. [DOI] [PMC free article] [PubMed] [Google Scholar]
- Klein F.; Sardi F.; Machado M. R.; Ortega C.; Comini M. A.; Pantano S. Cutie2: The Attack of the Cyclic Nucleotide Sensor Clones. Front. Mol. Biosci. 2021, 8, 629773. 10.3389/fmolb.2021.629773. [DOI] [PMC free article] [PubMed] [Google Scholar]
- van Meer G.; Voelker D. R.; Feigenson G. W. Membrane Lipids: Where They Are and How They Behave. Nat. Rev. Mol. Cell Biol. 2008, 9, 112–124. 10.1038/nrm2330. [DOI] [PMC free article] [PubMed] [Google Scholar]
- Muro E.; Atilla-Gokcumen G. E.; Eggert U. S. Lipids in Cell Biology: How Can We Understand Them Better?. Mol. Biol. Cell 2014, 25, 1819–1823. 10.1091/mbc.e13-09-0516. [DOI] [PMC free article] [PubMed] [Google Scholar]
- Shimada Y.; Maruya M.; Iwashita S.; Ohno-Iwashita Y. The C-Terminal Domain of Perfringolysin O Is an Essential Cholesterol-Binding Unit Targeting to Cholesterol-Rich Microdomains. Eur. J. Biochem. 2002, 269, 6195–6203. 10.1046/j.1432-1033.2002.03338.x. [DOI] [PubMed] [Google Scholar]
- Chen J.; Deng F.; Li J.; Wang Q. J. Selective Binding of Phorbol Esters and Diacylglycerol by Individual C1 Domains of the PKD Family. Biochem. J. 2008, 411, 333–342. 10.1042/BJ20071334. [DOI] [PubMed] [Google Scholar]
- Hammond G. R. V.; Ricci M. M. C.; Weckerly C. C.; Wills R. C. An Update on Genetically Encoded Lipid Biosensors. Mol. Biol. Cell 2022, 33, tp2. 10.1091/mbc.E21-07-0363. [DOI] [PMC free article] [PubMed] [Google Scholar]
- Bilanges B.; Posor Y.; Vanhaesebroeck B. PI3K Isoforms in Cell Signalling and Vesicle Trafficking. Nat. Rev. Mol. Cell Biol. 2019, 20, 515–534. 10.1038/s41580-019-0129-z. [DOI] [PubMed] [Google Scholar]
- Posor Y.; Jang W.; Haucke V. Phosphoinositides as Membrane Organizers. Nat. Rev. Mol. Cell Biol. 2022, 23, 797–816. 10.1038/s41580-022-00490-x. [DOI] [PMC free article] [PubMed] [Google Scholar]
- Burd C. G.; Emr S. D. Phosphatidylinositol(3)-Phosphate Signaling Mediated by Specific Binding to RING FYVE Domains. Mol. Cell 1998, 2, 157–162. 10.1016/S1097-2765(00)80125-2. [DOI] [PubMed] [Google Scholar]
- Hammond G. R. V.; Machner M. P.; Balla T. A Novel Probe for Phosphatidylinositol 4-Phosphate Reveals Multiple Pools beyond the Golgi. J. Cell Biol. 2014, 205, 113–126. 10.1083/jcb.201312072. [DOI] [PMC free article] [PubMed] [Google Scholar]
- Stauffer T. P.; Ahn S.; Meyer T. Receptor-Induced Transient Reduction in Plasma Membrane PtdIns(4,5)P2 Concentration Monitored in Living Cells. Curr. Biol. 1998, 8, 343–346. 10.1016/S0960-9822(98)70135-6. [DOI] [PubMed] [Google Scholar]
- Várnai P.; Balla T. Visualization of Phosphoinositides That Bind Pleckstrin Homology Domains: Calcium- and Agonist-Induced Dynamic Changes and Relationship to Myo-[3H]Inositol-Labeled Phosphoinositide Pools. J. Cell Biol. 1998, 143, 501–510. 10.1083/jcb.143.2.501. [DOI] [PMC free article] [PubMed] [Google Scholar]
- Yoneda A.; Kanemaru K.; Matsubara A.; Takai E.; Shimozawa M.; Satow R.; Yamaguchi H.; Nakamura Y.; Fukami K. Phosphatidylinositol 4,5-Bisphosphate Is Localized in the Plasma Membrane Outer Leaflet and Regulates Cell Adhesion and Motility. Biochem. Biophys. Res. Commun. 2020, 527, 1050–1056. 10.1016/j.bbrc.2020.05.040. [DOI] [PubMed] [Google Scholar]
- Leitner M. G.; Thallmair V.; Wilke B. U.; Neubert V.; Kronimus Y.; Halaszovich C. R.; Oliver D. The N-Terminal Homology (ENTH) Domain of Epsin 1 Is a Sensitive Reporter of Physiological PI(4,5)P2 Dynamics. Biochim. Biophys. Acta Mol. Cell Biol. Lipids 2019, 1864, 433–442. 10.1016/j.bbalip.2018.08.005. [DOI] [PubMed] [Google Scholar]
- van der Wal J.; Habets R.; Várnai P.; Balla T.; Jalink K. Monitoring Agonist-Induced Phospholipase C Activation in Live Cells by Fluorescence Resonance Energy Transfer. J. Biol. Chem. 2001, 276, 15337–15344. 10.1074/jbc.M007194200. [DOI] [PubMed] [Google Scholar]
- Violin J. D.; Zhang J.; Tsien R. Y.; Newton A. C. A Genetically Encoded Fluorescent Reporter Reveals Oscillatory Phosphorylation by Protein Kinase C. J. Cell Biol. 2003, 161, 899–909. 10.1083/jcb.200302125. [DOI] [PMC free article] [PubMed] [Google Scholar]
- Sato M.; Ueda Y.; Takagi T.; Umezawa Y. Production of PtdInsP3 at Endomembranes Is Triggered by Receptor Endocytosis. Nat. Cell Biol. 2003, 5, 1016–1022. 10.1038/ncb1054. [DOI] [PubMed] [Google Scholar]
- Yoshizaki H.; Aoki K.; Nakamura T.; Matsuda M. Regulation of RalA GTPase by Phosphatidylinositol 3-Kinase as Visualized by FRET Probes. Biochem. Soc. Trans. 2006, 34, 851–854. 10.1042/BST0340851. [DOI] [PubMed] [Google Scholar]
- Nishioka T.; Aoki K.; Hikake K.; Yoshizaki H.; Kiyokawa E.; Matsuda M. Rapid Turnover Rate of Phosphoinositides at the Front of Migrating MDCK Cells. Mol. Biol. Cell 2008, 19, 4213–4223. 10.1091/mbc.e08-03-0315. [DOI] [PMC free article] [PubMed] [Google Scholar]
- Ananthanarayanan B.; Ni Q.; Zhang J. Signal Propagation from Membrane Messengers to Nuclear Effectors Revealed by Reporters of Phosphoinositide Dynamics and Akt Activity. Proc. Natl. Acad. Sci. U.S.A. 2005, 102, 15081–15086. 10.1073/pnas.0502889102. [DOI] [PMC free article] [PubMed] [Google Scholar]
- Chen M.; Sun T.; Zhong Y.; Zhou X.; Zhang J. A Highly Sensitive Fluorescent Akt Biosensor Reveals Lysosome-Selective Regulation of Lipid Second Messengers and Kinase Activity. ACS Cent. Sci. 2021, 7, 2009–2020. 10.1021/acscentsci.1c00919. [DOI] [PMC free article] [PubMed] [Google Scholar]
- Hertel F.; Li S.; Chen M.; Pott L.; Mehta S.; Zhang J. Fluorescent Biosensors for Multiplexed Imaging of Phosphoinositide Dynamics. ACS Chem. Biol. 2020, 15, 33–38. 10.1021/acschembio.9b00691. [DOI] [PMC free article] [PubMed] [Google Scholar]
- Ke R.; Xu Q.; Li C.; Luo L.; Huang D. Mechanisms of AMPK in the Maintenance of ATP Balance during Energy Metabolism. Cell Biol. Int. 2018, 42, 384–392. 10.1002/cbin.10915. [DOI] [PubMed] [Google Scholar]
- Imamura H.; Huynh Nhat K. P.; Togawa H.; Saito K.; Iino R.; Kato-Yamada Y.; Nagai T.; Noji H. Visualization of ATP Levels inside Single Living Cells with Fluorescence Resonance Energy Transfer-Based Genetically Encoded Indicators. Proc. Natl. Acad. Sci. U.S.A. 2009, 106, 15651. 10.1073/pnas.0904764106. [DOI] [PMC free article] [PubMed] [Google Scholar]
- Yaginuma H.; Kawai S.; Tabata K. V.; Tomiyama K.; Kakizuka A.; Komatsuzaki T.; Noji H.; Imamura H. Diversity in ATP Concentrations in a Single Bacterial Cell Population Revealed by Quantitative Single-Cell Imaging. Sci. Rep. 2014, 4, 6522. 10.1038/srep06522. [DOI] [PMC free article] [PubMed] [Google Scholar]
- Arai S.; Kriszt R.; Harada K.; Looi L.-S.; Matsuda S.; Wongso D.; Suo S.; Ishiura S.; Tseng Y.-H.; Raghunath M.; et al. RGB-Color Intensiometric Indicators to Visualize Spatiotemporal Dynamics of ATP in Single Cells. Angew. Chem., Int. Ed. 2018, 57, 10873–10878. 10.1002/anie.201804304. [DOI] [PMC free article] [PubMed] [Google Scholar]
- Lobas M. A.; Tao R.; Nagai J.; Kronschläger M. T.; Borden P. M.; Marvin J. S.; Looger L. L.; Khakh B. S. A Genetically Encoded Single-Wavelength Sensor for Imaging Cytosolic and Cell Surface ATP. Nat. Commun. 2019, 10, 711. 10.1038/s41467-019-08441-5. [DOI] [PMC free article] [PubMed] [Google Scholar]
- Urbach V.; Hélix N.; Renaudon B.; Harvey B. J. Cellular Mechanisms for Apical ATP Effects on Intracellular PH in Human Bronchial Epithelium. J. Physiol. (London) 2002, 543, 13–21. 10.1113/jphysiol.2001.015180. [DOI] [PMC free article] [PubMed] [Google Scholar]
- Wijeyeratne Y. D.; Heptinstall S. Anti-Platelet Therapy: ADP Receptor Antagonists. Br. J. Clin. Pharmacol. 2011, 72, 647–657. 10.1111/j.1365-2125.2011.03999.x. [DOI] [PMC free article] [PubMed] [Google Scholar]
- Trull K. J.; Miller P.; Tat K.; Varney S. A.; Conley J. M.; Tantama M. Detection of Osmotic Shock-Induced Extracellular Nucleotide Release with a Genetically Encoded Fluorescent Sensor of ADP and ATP. Sensors (Basel) 2019, 19, 3253. 10.3390/s19153253. [DOI] [PMC free article] [PubMed] [Google Scholar]
- Berg J.; Hung Y. P.; Yellen G. A Genetically Encoded Fluorescent Reporter of ATP:ADP Ratio. Nat. Methods 2009, 6, 161–166. 10.1038/nmeth.1288. [DOI] [PMC free article] [PubMed] [Google Scholar]
- Bianchi-Smiraglia A.; Rana M. S.; Foley C. E.; Paul L. M.; Lipchick B. C.; Moparthy S.; Moparthy K.; Fink E. E.; Bagati A.; Hurley E.; et al. Internally Ratiometric Fluorescent Sensors for Evaluation of Intracellular GTP Levels and Distribution. Nat. Methods 2017, 14, 1003–1009. 10.1038/nmeth.4404. [DOI] [PMC free article] [PubMed] [Google Scholar]
- Zhang M.; Yang B.; Zhang J.; Song Y.; Wang W.; Li N.; Wang Y.; Li W.; Wang J. Monitoring the Dynamic Regulation of the Mitochondrial GTP-to-GDP Ratio with a Genetically Encoded Fluorescent Biosensor. Angew. Chem., Int. Ed. 2022, 61, e202201266. 10.1002/anie.202201266. [DOI] [PubMed] [Google Scholar]
- Li T.; Zou Y.; Liu S.; Yang Y.; Zhang Z.; Zhao Y. Monitoring NAD(H) and NADP(H) Dynamics during Organismal Development with Genetically Encoded Fluorescent Biosensors. Cell Regen (Lond) 2022, 11, 5. 10.1186/s13619-021-00105-4. [DOI] [PMC free article] [PubMed] [Google Scholar]
- Cambronne X. A.; Stewart M. L.; Kim D.; Jones-Brunette A. M.; Morgan R. K.; Farrens D. L.; Cohen M. S.; Goodman R. H. Biosensor Reveals Multiple Sources for Mitochondrial NAD+. Science 2016, 352, 1474–1477. 10.1126/science.aad5168. [DOI] [PMC free article] [PubMed] [Google Scholar]
- Zou Y.; Wang A.; Huang L.; Zhu X.; Hu Q.; Zhang Y.; Chen X.; Li F.; Wang Q.; Wang H.; Liu R.; Zuo F.; Li T.; Yao J.; Qian Y.; Shi M.; Yue X.; Chen W.; Zhang Z.; Wang C.; Zhou Y.; Zhu L.; Ju Z.; Loscalzo J.; Yang Y.; Zhao Y. Illuminating NAD+ Metabolism in Live Cells and in Vivo Using a Genetically Encoded Fluorescent Sensor. Dev. Cell 2020, 53, 240. 10.1016/j.devcel.2020.02.017. [DOI] [PMC free article] [PubMed] [Google Scholar]
- Zhao Y.; Jin J.; Hu Q.; Zhou H.-M.; Yi J.; Yu Z.; Xu L.; Wang X.; Yang Y.; Loscalzo J. Genetically Encoded Fluorescent Sensors for Intracellular NADH Detection. Cell Metab. 2011, 14, 555–566. 10.1016/j.cmet.2011.09.004. [DOI] [PMC free article] [PubMed] [Google Scholar]
- Hung Y. P.; Yellen G. Live-Cell Imaging of Cytosolic NADH-NAD+ Redox State Using a Genetically Encoded Fluorescent Biosensor. Methods Mol. Biol. 2014, 1071, 83–95. 10.1007/978-1-62703-622-1_7. [DOI] [PMC free article] [PubMed] [Google Scholar]
- Bilan D. S.; Matlashov M. E.; Gorokhovatsky A. Y.; Schultz C.; Enikolopov G.; Belousov V. V. Genetically Encoded Fluorescent Indicator for Imaging NAD(+)/NADH Ratio Changes in Different Cellular Compartments. Biochim. Biophys. Acta 2014, 1840, 951–957. 10.1016/j.bbagen.2013.11.018. [DOI] [PMC free article] [PubMed] [Google Scholar]
- Zhao Y.; Hu Q.; Cheng F.; Su N.; Wang A.; Zou Y.; Hu H.; Chen X.; Zhou H.-M.; Huang X.; et al. SoNar, a Highly Responsive NAD+/NADH Sensor, Allows High-Throughput Metabolic Screening of Anti-Tumor Agents. Cell Metab. 2015, 21, 777–789. 10.1016/j.cmet.2015.04.009. [DOI] [PMC free article] [PubMed] [Google Scholar]
- Tao R.; Zhao Y.; Chu H.; Wang A.; Zhu J.; Chen X.; Zou Y.; Shi M.; Liu R.; Su N.; et al. Genetically Encoded Fluorescent Sensors Reveal Dynamic Regulation of NADPH Metabolism. Nat. Methods 2017, 14, 720–728. 10.1038/nmeth.4306. [DOI] [PMC free article] [PubMed] [Google Scholar]
- Zhao F.-L.; Zhang C.; Zhang C.; Tang Y.; Ye B.-C. A Genetically Encoded Biosensor for in Vitro and in Vivo Detection of NADP(.). Biosens. Bioelectron. 2016, 77, 901–906. 10.1016/j.bios.2015.10.063. [DOI] [PubMed] [Google Scholar]
- Cameron W. D.; Bui C. V.; Hutchinson A.; Loppnau P.; Gräslund S.; Rocheleau J. V. Apollo-NADP(+): A Spectrally Tunable Family of Genetically Encoded Sensors for NADP(+). Nat. Methods 2016, 13, 352–358. 10.1038/nmeth.3764. [DOI] [PubMed] [Google Scholar]
- Molinari P. E.; Krapp A. R.; Weiner A.; Beyer H. M.; Kondadi A. K.; Blomeier T.; Lopez M.; Bustos-Sanmamed P.; Tevere E.; Weber W.; Reichert A. S.; Calcaterra N. B.; Beller M.; Carrillo N.; Zurbriggen M. D. NERNST: A Genetically-Encoded Ratiometric Non-Destructive Sensing Tool to Estimate NADP(H) Redox Status in Bacterial, Plant and Animal Systems. Nat. Commun. 2023, 14, 3277. 10.1038/s41467-023-38739-4. [DOI] [PMC free article] [PubMed] [Google Scholar]
- Chen L.; Chen M.; Luo M.; Li Y.; Liao B.; Hu M.; Yu Q. Ratiometric NAD+ Sensors Reveal Subcellular NAD+ Modulators. ACS Sens. 2023, 8, 1518–1528. 10.1021/acssensors.2c02565. [DOI] [PubMed] [Google Scholar]
- San Martín A.; Ceballo S.; Baeza-Lehnert F.; Lerchundi R.; Valdebenito R.; Contreras-Baeza Y.; Alegría K.; Barros L. F. Imaging Mitochondrial Flux in Single Cells with a FRET Sensor for Pyruvate. PLoS One 2014, 9, e85780. 10.1371/journal.pone.0085780. [DOI] [PMC free article] [PubMed] [Google Scholar]
- Bulusu V.; Prior N.; Snaebjornsson M. T.; Kuehne A.; Sonnen K. F.; Kress J.; Stein F.; Schultz C.; Sauer U.; Aulehla A. Spatiotemporal Analysis of a Glycolytic Activity Gradient Linked to Mouse Embryo Mesoderm Development. Dev. Cell 2017, 40, 331. 10.1016/j.devcel.2017.01.015. [DOI] [PMC free article] [PubMed] [Google Scholar]
- Arce-Molina R.; Cortés-Molina F.; Sandoval P. Y.; Galaz A.; Alegría K.; Schirmeier S.; Barros L. F.; San Martín A. A Highly Responsive Pyruvate Sensor Reveals Pathway-Regulatory Role of the Mitochondrial Pyruvate Carrier MPC. Elife 2020, 9, e53917. 10.7554/eLife.53917. [DOI] [PMC free article] [PubMed] [Google Scholar]
- Harada K.; Chihara T.; Hayasaka Y.; Mita M.; Takizawa M.; Ishida K.; Arai M.; Tsuno S.; Matsumoto M.; Ishihara T.; Ueda H.; Kitaguchi T.; Tsuboi T. Green Fluorescent Protein-Based Lactate and Pyruvate Indicators Suitable for Biochemical Assays and Live Cell Imaging. Sci. Rep. 2020, 10, 19562. 10.1038/s41598-020-76440-4. [DOI] [PMC free article] [PubMed] [Google Scholar]
- Magistretti P. J.; Allaman I. Lactate in the Brain: From Metabolic End-Product to Signalling Molecule. Nat. Rev. Neurosci. 2018, 19, 235–249. 10.1038/nrn.2018.19. [DOI] [PubMed] [Google Scholar]
- Baltazar F.; Afonso J.; Costa M.; Granja S. Lactate beyond a Waste Metabolite: Metabolic Affairs and Signaling in Malignancy. Front. Oncol. 2020, 10, 231. 10.3389/fonc.2020.00231. [DOI] [PMC free article] [PubMed] [Google Scholar]
- Schurr A.; West C. A.; Rigor B. M. Lactate-Supported Synaptic Function in the Rat Hippocampal Slice Preparation. Science 1988, 240, 1326–1328. 10.1126/science.3375817. [DOI] [PubMed] [Google Scholar]
- San Martín A.; Ceballo S.; Ruminot I.; Lerchundi R.; Frommer W. B.; Barros L. F. A Genetically Encoded FRET Lactate Sensor and Its Use to Detect the Warburg Effect in Single Cancer Cells. PLoS One 2013, 8, e57712. 10.1371/journal.pone.0057712. [DOI] [PMC free article] [PubMed] [Google Scholar]
- Galaz A.; Cortés-Molina F.; Arce-Molina R.; Romero-Gómez I.; Mardones G. A.; Felipe Barros L.; San Martín A. Imaging of the Lactate/Pyruvate Ratio Using a Genetically Encoded Förster Resonance Energy Transfer Indicator. Anal. Chem. 2020, 92, 10643–10650. 10.1021/acs.analchem.0c01741. [DOI] [PubMed] [Google Scholar]
- Nasu Y.; Aggarwal A.; Le G. N. T.; Vo C. T.; Kambe Y.; Wang X.; Beinlich F. R. M.; Lee A. B.; Ram T. R.; Wang F.; Gorzo K. A.; Kamijo Y.; Boisvert M.; Nishinami S.; Kawamura G.; Ozawa T.; Toda H.; Gordon G. R.; Ge S.; Hirase H.; Nedergaard M.; Paquet M.-E.; Drobizhev M.; Podgorski K.; Campbell R. E. Lactate Biosensors for Spectrally and Spatially Multiplexed Fluorescence Imaging. Nat. Commun. 2023, 14, 6598. 10.1038/s41467-023-42230-5. [DOI] [PMC free article] [PubMed] [Google Scholar]
- Nasu Y.; Murphy-Royal C.; Wen Y.; Haidey J. N.; Molina R. S.; Aggarwal A.; Zhang S.; Kamijo Y.; Paquet M.-E.; Podgorski K.; Drobizhev M.; Bains J. S.; Lemieux M. J.; Gordon G. R.; Campbell R. E. A Genetically Encoded Fluorescent Biosensor for Extracellular L-Lactate. Nat. Commun. 2021, 12, 7058. 10.1038/s41467-021-27332-2. [DOI] [PMC free article] [PubMed] [Google Scholar]
- Icard P.; Coquerel A.; Wu Z.; Gligorov J.; Fuks D.; Fournel L.; Lincet H.; Simula L. Understanding the Central Role of Citrate in the Metabolism of Cancer Cells and Tumors: An Update. Int. J. Mol. Sci. 2021, 22, 6587. 10.3390/ijms22126587. [DOI] [PMC free article] [PubMed] [Google Scholar]
- Sevvana M.; Vijayan V.; Zweckstetter M.; Reinelt S.; Madden D. R.; Herbst-Irmer R.; Sheldrick G. M.; Bott M.; Griesinger C.; Becker S. A Ligand-Induced Switch in the Periplasmic Domain of Sensor Histidine Kinase CitA. J. Mol. Biol. 2008, 377, 512–523. 10.1016/j.jmb.2008.01.024. [DOI] [PubMed] [Google Scholar]
- Ewald J. C.; Reich S.; Baumann S.; Frommer W. B.; Zamboni N. Engineering Genetically Encoded Nanosensors for Real-Time in Vivo Measurements of Citrate Concentrations. PLoS One 2011, 6, e28245. 10.1371/journal.pone.0028245. [DOI] [PMC free article] [PubMed] [Google Scholar]
- Honda Y.; Kirimura K. Generation of Circularly Permuted Fluorescent-Protein-Based Indicators for in Vitro and in Vivo Detection of Citrate. PLoS One 2013, 8, e64597. 10.1371/journal.pone.0064597. [DOI] [PMC free article] [PubMed] [Google Scholar]
- Zhao Y.; Shen Y.; Wen Y.; Campbell R. E. High-Performance Intensiometric Direct- and Inverse-Response Genetically Encoded Biosensors for Citrate. ACS Cent. Sci. 2020, 6, 1441–1450. 10.1021/acscentsci.0c00518. [DOI] [PMC free article] [PubMed] [Google Scholar]
- Konno T.; Melo E. P.; Chambers J. E.; Avezov E. Intracellular Sources of ROS/H2O2 in Health and Neurodegeneration: Spotlight on Endoplasmic Reticulum. Cells 2021, 10, 233. 10.3390/cells10020233. [DOI] [PMC free article] [PubMed] [Google Scholar]
- Liou G.-Y.; Storz P. Reactive Oxygen Species in Cancer. Free Radic. Res. 2010, 44, 479–496. 10.3109/10715761003667554. [DOI] [PMC free article] [PubMed] [Google Scholar]
- Niu W.; Guo J. Novel Fluorescence-Based Biosensors Incorporating Unnatural Amino Acids. Meth. Enzymol. 2017, 589, 191–219. 10.1016/bs.mie.2017.01.012. [DOI] [PubMed] [Google Scholar]
- Enyedi B.; Zana M.; Donkó Á.; Geiszt M. Spatial and Temporal Analysis of NADPH Oxidase-Generated Hydrogen Peroxide Signals by Novel Fluorescent Reporter Proteins. Antioxid. Redox. Signal. 2013, 19, 523–534. 10.1089/ars.2012.4594. [DOI] [PubMed] [Google Scholar]
- Hanson G. T.; Aggeler R.; Oglesbee D.; Cannon M.; Capaldi R. A.; Tsien R. Y.; Remington S. J. Investigating Mitochondrial Redox Potential with Redox-Sensitive Green Fluorescent Protein Indicators. J. Biol. Chem. 2004, 279, 13044–13053. 10.1074/jbc.M312846200. [DOI] [PubMed] [Google Scholar]
- Gutscher M.; Sobotta M. C.; Wabnitz G. H.; Ballikaya S.; Meyer A. J.; Samstag Y.; Dick T. P. Proximity-Based Protein Thiol Oxidation by H2O2-Scavenging Peroxidases. J. Biol. Chem. 2009, 284, 31532–31540. 10.1074/jbc.M109.059246. [DOI] [PMC free article] [PubMed] [Google Scholar]
- Morgan B.; Van Laer K.; Owusu T. N. E.; Ezeriṇa D.; Pastor-Flores D.; Amponsah P. S.; Tursch A.; Dick T. P. Real-Time Monitoring of Basal H2O2 Levels with Peroxiredoxin-Based Probes. Nat. Chem. Biol. 2016, 12, 437–443. 10.1038/nchembio.2067. [DOI] [PubMed] [Google Scholar]
- Belousov V. V.; Fradkov A. F.; Lukyanov K. A.; Staroverov D. B.; Shakhbazov K. S.; Terskikh A. V.; Lukyanov S. Genetically Encoded Fluorescent Indicator for Intracellular Hydrogen Peroxide. Nat. Methods 2006, 3, 281–286. 10.1038/nmeth866. [DOI] [PubMed] [Google Scholar]
- Markvicheva K. N.; Bilan D. S.; Mishina N. M.; Gorokhovatsky A. Y.; Vinokurov L. M.; Lukyanov S.; Belousov V. V. A Genetically Encoded Sensor for H2O2 with Expanded Dynamic Range. Bioorg. Med. Chem. 2011, 19, 1079–1084. 10.1016/j.bmc.2010.07.014. [DOI] [PubMed] [Google Scholar]
- Bilan D. S.; Pase L.; Joosen L.; Gorokhovatsky A. Y.; Ermakova Y. G.; Gadella T. W. J.; Grabher C.; Schultz C.; Lukyanov S.; Belousov V. V. HyPer-3: A Genetically Encoded H(2)O(2) Probe with Improved Performance for Ratiometric and Fluorescence Lifetime Imaging. ACS Chem. Biol. 2013, 8, 535–542. 10.1021/cb300625g. [DOI] [PubMed] [Google Scholar]
- Blom H.; Widengren J. Stimulated Emission Depletion Microscopy. Chem. Rev. 2017, 117, 7377–7427. 10.1021/acs.chemrev.6b00653. [DOI] [PubMed] [Google Scholar]
- Mishina N. M.; Mishin A. S.; Belyaev Y.; Bogdanova E. A.; Lukyanov S.; Schultz C.; Belousov V. V. Live-Cell STED Microscopy with Genetically Encoded Biosensor. Nano Lett. 2015, 15, 2928–2932. 10.1021/nl504710z. [DOI] [PubMed] [Google Scholar]
- Subach O. M.; Kunitsyna T. A.; Mineyeva O. A.; Lazutkin A. A.; Bezryadnov D. V.; Barykina N. V.; Piatkevich K. D.; Ermakova Y. G.; Bilan D. S.; Belousov V. V.; et al. Slowly Reducible Genetically Encoded Green Fluorescent Indicator for in Vivo and Ex Vivo Visualization of Hydrogen Peroxide. Int. J. Mol. Sci. 2019, 20, 3138. 10.3390/ijms20133138. [DOI] [PMC free article] [PubMed] [Google Scholar]
- Pak V. V.; Ezerina D.; Lyublinskaya O. G.; Pedre B.; Tyurin-Kuzmin P. A.; Mishina N. M.; Thauvin M.; Young D.; Wahni K.; Martinez Gache S. A.; Demidovich A. D.; Ermakova Y. G.; Maslova Y. D.; Shokhina A. G.; Eroglu E.; Bilan D. S.; Bogeski I.; Michel T.; Vriz S.; Messens J.; Belousov V. V. Ultrasensitive Genetically Encoded Indicator for Hydrogen Peroxide Identifies Roles for the Oxidant in Cell Migration and Mitochondrial Function. Cell Metab. 2020, 31, 642. 10.1016/j.cmet.2020.02.003. [DOI] [PMC free article] [PubMed] [Google Scholar]
- Ermakova Y. G.; Bilan D. S.; Matlashov M. E.; Mishina N. M.; Markvicheva K. N.; Subach O. M.; Subach F. V.; Bogeski I.; Hoth M.; Enikolopov G.; et al. Red Fluorescent Genetically Encoded Indicator for Intracellular Hydrogen Peroxide. Nat. Commun. 2014, 5, 5222. 10.1038/ncomms6222. [DOI] [PMC free article] [PubMed] [Google Scholar]
- Pang Y.; Zhang Y.; Zhang J.; Li Z.; He Y.; Wang Y.; Oberholzer J.; Ai H.. SHRIMP: Genetically Encoded MScarlet-Derived Red Fluorescent Hydrogen Peroxide Sensor with High Brightness and Minimal Photoactivation. BioRxiv 2023, 08.09.552302. 10.1101/2023.08.09.552302. [DOI]
- Zhao B. S.; Liang Y.; Song Y.; Zheng C.; Hao Z.; Chen P. R. A Highly Selective Fluorescent Probe for Visualization of Organic Hydroperoxides in Living Cells. J. Am. Chem. Soc. 2010, 132, 17065–17067. 10.1021/ja1071114. [DOI] [PubMed] [Google Scholar]
- Freeman C. R.; Zehra A.; Ramirez V.; Wiers C. E.; Volkow N. D.; Wang G.-J. Impact of Sugar on the Body, Brain, and Behavior. Front. Biosci. (Landmark Ed) 2018, 23, 2255–2266. 10.2741/4704. [DOI] [PubMed] [Google Scholar]
- López-Gambero A. J.; Martínez F.; Salazar K.; Cifuentes M.; Nualart F. Brain Glucose-Sensing Mechanism and Energy Homeostasis. Mol. Neurobiol. 2019, 56, 769–796. 10.1007/s12035-018-1099-4. [DOI] [PubMed] [Google Scholar]
- Lee Y. J.; Choi H. J.; Lim T. H.; Lee S. H.; Hwang S. J. The Development and Experimental Application of a New Thoracostomy Trocar. Am. J. Emerg. Med. 2016, 34, 917–920. 10.1016/j.ajem.2016.02.016. [DOI] [PubMed] [Google Scholar]
- Tolosa L.; Gryczynski I.; Eichhorn L. R.; Dattelbaum J. D.; Castellano F. N.; Rao G.; Lakowicz J. R. Glucose Sensor for Low-Cost Lifetime-Based Sensing Using a Genetically Engineered Protein. Anal. Biochem. 1999, 267, 114–120. 10.1006/abio.1998.2974. [DOI] [PMC free article] [PubMed] [Google Scholar]
- Ye K.; Schultz J. S. Genetic Engineering of an Allosterically Based Glucose Indicator Protein for Continuous Glucose Monitoring by Fluorescence Resonance Energy Transfer. Anal. Chem. 2003, 75, 3451–3459. 10.1021/ac034022q. [DOI] [PubMed] [Google Scholar]
- Fehr M.; Frommer W. B.; Lalonde S. Visualization of Maltose Uptake in Living Yeast Cells by Fluorescent Nanosensors. Proc. Natl. Acad. Sci. U.S.A. 2002, 99, 9846–9851. 10.1073/pnas.142089199. [DOI] [PMC free article] [PubMed] [Google Scholar]
- Fehr M.; Lalonde S.; Lager I.; Wolff M. W.; Frommer W. B. In Vivo Imaging of the Dynamics of Glucose Uptake in the Cytosol of COS-7 Cells by Fluorescent Nanosensors. J. Biol. Chem. 2003, 278, 19127–19133. 10.1074/jbc.M301333200. [DOI] [PubMed] [Google Scholar]
- Kaper T.; Lager I.; Looger L. L.; Chermak D.; Frommer W. B. Fluorescence Resonance Energy Transfer Sensors for Quantitative Monitoring of Pentose and Disaccharide Accumulation in Bacteria. Biotechnol Biofuels 2008, 1, 11. 10.1186/1754-6834-1-11. [DOI] [PMC free article] [PubMed] [Google Scholar]
- Lager I.; Looger L. L.; Hilpert M.; Lalonde S.; Frommer W. B. Conversion of a Putative Agrobacterium Sugar-Binding Protein into a FRET Sensor with High Selectivity for Sucrose. J. Biol. Chem. 2006, 281, 30875–30883. 10.1074/jbc.M605257200. [DOI] [PubMed] [Google Scholar]
- Lager I.; Fehr M.; Frommer W. B.; Lalonde S. Development of a Fluorescent Nanosensor for Ribose. FEBS Lett. 2003, 553, 85–89. 10.1016/S0014-5793(03)00976-1. [DOI] [PubMed] [Google Scholar]
- Kikuta S.; Hou B.-H.; Sato R.; Frommer W. B.; Kikawada T. FRET Sensor-Based Quantification of Intracellular Trehalose in Mammalian Cells. Biosci. Biotechnol. Biochem. 2016, 80, 162–165. 10.1080/09168451.2015.1069699. [DOI] [PubMed] [Google Scholar]
- Deuschle K.; Okumoto S.; Fehr M.; Looger L. L.; Kozhukh L.; Frommer W. B. Construction and Optimization of a Family of Genetically Encoded Metabolite Sensors by Semirational Protein Engineering. Protein Sci. 2005, 14, 2304–2314. 10.1110/ps.051508105. [DOI] [PMC free article] [PubMed] [Google Scholar]
- Takanaga H.; Chaudhuri B.; Frommer W. B. GLUT1 and GLUT9 as Major Contributors to Glucose Influx in HepG2 Cells Identified by a High Sensitivity Intramolecular FRET Glucose Sensor. Biochim. Biophys. Acta 2008, 1778, 1091–1099. 10.1016/j.bbamem.2007.11.015. [DOI] [PMC free article] [PubMed] [Google Scholar]
- Hu H.; Wei Y.; Wang D.; Su N.; Chen X.; Zhao Y.; Liu G.; Yang Y. Glucose Monitoring in Living Cells with Single Fluorescent Protein-Based Sensors. RSC Adv. 2018, 8, 2485–2489. 10.1039/C7RA11347A. [DOI] [PMC free article] [PubMed] [Google Scholar]
- Mita M.; Ito M.; Harada K.; Sugawara I.; Ueda H.; Tsuboi T.; Kitaguchi T. Green Fluorescent Protein-Based Glucose Indicators Report Glucose Dynamics in Living Cells. Anal. Chem. 2019, 91, 4821–4830. 10.1021/acs.analchem.9b00447. [DOI] [PubMed] [Google Scholar]
- Mita M.; Sugawara I.; Harada K.; Ito M.; Takizawa M.; Ishida K.; Ueda H.; Kitaguchi T.; Tsuboi T. Development of Red Genetically Encoded Biosensor for Visualization of Intracellular Glucose Dynamics. Cell Chem. Biol. 2022, 29, 98. 10.1016/j.chembiol.2021.06.002. [DOI] [PubMed] [Google Scholar]
- Díaz-García C. M.; Lahmann C.; Martínez-François J. R.; Li B.; Koveal D.; Nathwani N.; Rahman M.; Keller J. P.; Marvin J. S.; Looger L. L.; et al. Quantitative in Vivo Imaging of Neuronal Glucose Concentrations with a Genetically Encoded Fluorescence Lifetime Sensor. J. Neurosci. Res. 2019, 97, 946–960. 10.1002/jnr.24433. [DOI] [PMC free article] [PubMed] [Google Scholar]
- Keller J. P.; Marvin J. S.; Lacin H.; Lemon W. C.; Shea J.; Kim S.; Lee R. T.; Koyama M.; Keller P. J.; Looger L. L. In Vivo Glucose Imaging in Multiple Model Organisms with an Engineered Single-Wavelength Sensor. Cell Rep. 2021, 35, 109284. 10.1016/j.celrep.2021.109284. [DOI] [PubMed] [Google Scholar]
- Duval C. W.; White P. G. The Histological Lesions of Experimental Glanders. J. Exp. Med. 1907, 9, 352–380. 10.1084/jem.9.4.352. [DOI] [PMC free article] [PubMed] [Google Scholar]
- Gruenwald K.; Holland J. T.; Stromberg V.; Ahmad A.; Watcharakichkorn D.; Okumoto S. Visualization of Glutamine Transporter Activities in Living Cells Using Genetically Encoded Glutamine Sensors. PLoS One 2012, 7, e38591. 10.1371/journal.pone.0038591. [DOI] [PMC free article] [PubMed] [Google Scholar]
- Li Y.; Sierra A. M.; Ai H.-W.; Campbell R. E. Identification of Sites within a Monomeric Red Fluorescent Protein That Tolerate Peptide Insertion and Testing of Corresponding Circular Permutations. Photochem. Photobiol. 2008, 84, 111–119. 10.1111/j.1751-1097.2007.00206.x. [DOI] [PubMed] [Google Scholar]
- Koberstein J. N.; Stewart M. L.; Mighell T. L.; Smith C. B.; Cohen M. S. A Sort-Seq Approach to the Development of Single Fluorescent Protein Biosensors. ACS Chem. Biol. 2021, 16, 1709–1720. 10.1021/acschembio.1c00423. [DOI] [PMC free article] [PubMed] [Google Scholar]
- Patriarchi T.; Cho J. R.; Merten K.; Howe M. W.; Marley A.; Xiong W.-H.; Folk R. W.; Broussard G. J.; Liang R.; Jang M. J.; Zhong H.; Dombeck D.; von Zastrow M.; Nimmerjahn A.; Gradinaru V.; Williams J. T.; Tian L. Ultrafast Neuronal Imaging of Dopamine Dynamics with Designed Genetically Encoded Sensors. Science 2018, 360, eaat4422. 10.1126/science.aat4422. [DOI] [PMC free article] [PubMed] [Google Scholar]
- Patriarchi T.; Cho J. R.; Merten K.; Marley A.; Broussard G. J.; Liang R.; Williams J.; Nimmerjahn A.; von Zastrow M.; Gradinaru V.; et al. Imaging Neuromodulators with High Spatiotemporal Resolution Using Genetically Encoded Indicators. Nat. Protoc. 2019, 14, 3471–3505. 10.1038/s41596-019-0239-2. [DOI] [PubMed] [Google Scholar]
- Duffet L.; Kosar S.; Panniello M.; Viberti B.; Bracey E.; Zych A. D.; Radoux-Mergault A.; Zhou X.; Dernic J.; Ravotto L.; et al. A Genetically Encoded Sensor for in Vivo Imaging of Orexin Neuropeptides. Nat. Methods 2022, 19, 231–241. 10.1038/s41592-021-01390-2. [DOI] [PMC free article] [PubMed] [Google Scholar]
- Sun F.; Zeng J.; Jing M.; Zhou J.; Feng J.; Owen S. F.; Luo Y.; Li F.; Wang H.; Yamaguchi T.; Yong Z.; Gao Y.; Peng W.; Wang L.; Zhang S.; Du J.; Lin D.; Xu M.; Kreitzer A. C.; Cui G.; Li Y. A Genetically Encoded Fluorescent Sensor Enables Rapid and Specific Detection of Dopamine in Flies, Fish, and Mice. Cell 2018, 174, 481. 10.1016/j.cell.2018.06.042. [DOI] [PMC free article] [PubMed] [Google Scholar]
- Jing M.; Li Y.; Zeng J.; Huang P.; Skirzewski M.; Kljakic O.; Peng W.; Qian T.; Tan K.; Zou J.; et al. An Optimized Acetylcholine Sensor for Monitoring in Vivo Cholinergic Activity. Nat. Methods 2020, 17, 1139–1146. 10.1038/s41592-020-0953-2. [DOI] [PMC free article] [PubMed] [Google Scholar]
- Wan J.; Peng W.; Li X.; Qian T.; Song K.; Zeng J.; Deng F.; Hao S.; Feng J.; Zhang P.; et al. A Genetically Encoded Sensor for Measuring Serotonin Dynamics. Nat. Neurosci. 2021, 24, 746–752. 10.1038/s41593-021-00823-7. [DOI] [PMC free article] [PubMed] [Google Scholar]
- Jing M.; Zhang P.; Wang G.; Feng J.; Mesik L.; Zeng J.; Jiang H.; Wang S.; Looby J. C.; Guagliardo N. A.; et al. A Genetically Encoded Fluorescent Acetylcholine Indicator for in Vitro and in Vivo Studies. Nat. Biotechnol. 2018, 36, 726–737. 10.1038/nbt.4184. [DOI] [PMC free article] [PubMed] [Google Scholar]
- Sun F.; Zhou J.; Dai B.; Qian T.; Zeng J.; Li X.; Zhuo Y.; Zhang Y.; Wang Y.; Qian C.; et al. Next-Generation GRAB Sensors for Monitoring Dopaminergic Activity in Vivo. Nat. Methods 2020, 17, 1156–1166. 10.1038/s41592-020-00981-9. [DOI] [PMC free article] [PubMed] [Google Scholar]
- Qian T.; Wang H.; Wang P.; Geng L.; Mei L.; Osakada T.; Wang L.; Tang Y.; Kania A.; Grinevich V.; et al. A Genetically Encoded Sensor Measures Temporal Oxytocin Release from Different Neuronal Compartments. Nat. Biotechnol. 2023, 41, 944–957. 10.1038/s41587-022-01561-2. [DOI] [PMC free article] [PubMed] [Google Scholar]
- Dong A.; He K.; Dudok B.; Farrell J. S.; Guan W.; Liput D. J.; Puhl H. L.; Cai R.; Wang H.; Duan J.; et al. A Fluorescent Sensor for Spatiotemporally Resolved Imaging of Endocannabinoid Dynamics in Vivo. Nat. Biotechnol. 2022, 40, 787–798. 10.1038/s41587-021-01074-4. [DOI] [PMC free article] [PubMed] [Google Scholar]
- Wang H.; Qian T.; Zhao Y.; Zhuo Y.; Wu C.; Osakada T.; Chen P.; Chen Z.; Ren H.; Yan Y.; Geng L.; Fu S.; Mei L.; Li G.; Wu L.; Jiang Y.; Qian W.; Zhang L.; Peng W.; Xu M.; Hu J.; Jiang M.; Chen L.; Tang C.; Zhu Y.; Lin D.; Zhou J.-N.; Li Y.; et al. A Tool Kit of Highly Selective and Sensitive Genetically Encoded Neuropeptide Sensors. Science 2023, 382, eabq8173. 10.1126/science.abq8173. [DOI] [PMC free article] [PubMed] [Google Scholar]
- Dong C.; Ly C.; Dunlap L. E.; Vargas M. V.; Sun J.; Hwang I.-W.; Azinfar A.; Oh W. C.; Wetsel W. C.; Olson D. E.; Tian L.; et al. Psychedelic-Inspired Drug Discovery Using an Engineered Biosensor. Cell 2021, 184, 2779. 10.1016/j.cell.2021.03.043. [DOI] [PMC free article] [PubMed] [Google Scholar]
- Okumoto S.; Looger L. L.; Micheva K. D.; Reimer R. J.; Smith S. J.; Frommer W. B. Detection of Glutamate Release from Neurons by Genetically Encoded Surface-Displayed FRET Nanosensors. Proc. Natl. Acad. Sci. U.S.A. 2005, 102, 8740–8745. 10.1073/pnas.0503274102. [DOI] [PMC free article] [PubMed] [Google Scholar]
- Tsien R. Y. Building and Breeding Molecules to Spy on Cells and Tumors. FEBS Lett. 2005, 579, 927–932. 10.1016/j.febslet.2004.11.025. [DOI] [PubMed] [Google Scholar]
- Okada S.; Ota K.; Ito T. Circular Permutation of Ligand-Binding Module Improves Dynamic Range of Genetically Encoded FRET-Based Nanosensor. Protein Sci. 2009, 18, 2518–2527. 10.1002/pro.266. [DOI] [PMC free article] [PubMed] [Google Scholar]
- Hires S. A.; Zhu Y.; Tsien R. Y. Optical Measurement of Synaptic Glutamate Spillover and Reuptake by Linker Optimized Glutamate-Sensitive Fluorescent Reporters. Proc. Natl. Acad. Sci. U.S.A. 2008, 105, 4411–4416. 10.1073/pnas.0712008105. [DOI] [PMC free article] [PubMed] [Google Scholar]
- Marvin J. S.; Borghuis B. G.; Tian L.; Cichon J.; Harnett M. T.; Akerboom J.; Gordus A.; Renninger S. L.; Chen T.-W.; Bargmann C. I.; et al. An Optimized Fluorescent Probe for Visualizing Glutamate Neurotransmission. Nat. Methods 2013, 10, 162–170. 10.1038/nmeth.2333. [DOI] [PMC free article] [PubMed] [Google Scholar]
- Marvin J. S.; Scholl B.; Wilson D. E.; Podgorski K.; Kazemipour A.; Müller J. A.; Schoch S.; Quiroz F. J. U.; Rebola N.; Bao H.; et al. Stability, Affinity, and Chromatic Variants of the Glutamate Sensor IGluSnFR. Nat. Methods 2018, 15, 936–939. 10.1038/s41592-018-0171-3. [DOI] [PMC free article] [PubMed] [Google Scholar]
- Aggarwal A.; Liu R.; Chen Y.; Ralowicz A. J.; Bergerson S. J.; Tomaska F.; Mohar B.; Hanson T. L.; Hasseman J. P.; Reep D.; et al. Glutamate Indicators with Improved Activation Kinetics and Localization for Imaging Synaptic Transmission. Nat. Methods 2023, 20, 925–934. 10.1038/s41592-023-01863-6. [DOI] [PMC free article] [PubMed] [Google Scholar]
- Marvin J. S.; Shimoda Y.; Magloire V.; Leite M.; Kawashima T.; Jensen T. P.; Kolb I.; Knott E. L.; Novak O.; Podgorski K.; et al. A Genetically Encoded Fluorescent Sensor for in Vivo Imaging of GABA. Nat. Methods 2019, 16, 763–770. 10.1038/s41592-019-0471-2. [DOI] [PubMed] [Google Scholar]
- Unger E. K.; Keller J. P.; Altermatt M.; Liang R.; Matsui A.; Dong C.; Hon O. J.; Yao Z.; Sun J.; Banala S.; Flanigan M. E.; Jaffe D. A.; Hartanto S.; Carlen J.; Mizuno G. O.; Borden P. M.; Shivange A. V.; Cameron L. P.; Sinning S.; Underhill S. M.; Olson D. E.; Amara S. G.; Temple Lang D.; Rudnick G.; Marvin J. S.; Lavis L. D.; Lester H. A.; Alvarez V. A.; Fisher A. J.; Prescher J. A.; Kash T. L.; Yarov-Yarovoy V.; Gradinaru V.; Looger L. L.; Tian L. Directed Evolution of a Selective and Sensitive Serotonin Sensor via Machine Learning. Cell 2020, 183, 1986. 10.1016/j.cell.2020.11.040. [DOI] [PMC free article] [PubMed] [Google Scholar]
- Vilardaga J.-P.; Steinmeyer R.; Harms G. S.; Lohse M. J. Molecular Basis of Inverse Agonism in a G Protein-Coupled Receptor. Nat. Chem. Biol. 2005, 1, 25–28. 10.1038/nchembio705. [DOI] [PubMed] [Google Scholar]
- Malik R. U.; Ritt M.; DeVree B. T.; Neubig R. R.; Sunahara R. K.; Sivaramakrishnan S. Detection of G Protein-Selective G Protein-Coupled Receptor (GPCR) Conformations in Live Cells. J. Biol. Chem. 2013, 288, 17167–17178. 10.1074/jbc.M113.464065. [DOI] [PMC free article] [PubMed] [Google Scholar]
- Kim Y.-S.; Yeon J.-H.; Ko W.; Suh B.-C. Two-Step Structural Changes in M3Muscarinic Receptor Activation Rely on the Coupled Gq Protein Cycle. Nat. Commun. 2023, 14, 1276. 10.1038/s41467-023-36911-4. [DOI] [PMC free article] [PubMed] [Google Scholar]
- El Daibani A.; Che T. Nanobodies as Sensors of GPCR Activation and Signaling. Methods Cell Biol. 2021, 166, 161–177. 10.1016/bs.mcb.2021.06.008. [DOI] [PubMed] [Google Scholar]
- Olson K. M.; Campbell A.; Alt A.; Traynor J. R. Finding the Perfect Fit: Conformational Biosensors to Determine the Efficacy of GPCR Ligands. ACS Pharmacol. Transl. Sci. 2022, 5, 694–709. 10.1021/acsptsci.1c00256. [DOI] [PMC free article] [PubMed] [Google Scholar]
- Irannejad R.; Tomshine J. C.; Tomshine J. R.; Chevalier M.; Mahoney J. P.; Steyaert J.; Rasmussen S. G. F.; Sunahara R. K.; El-Samad H.; Huang B.; et al. Conformational Biosensors Reveal GPCR Signalling from Endosomes. Nature 2013, 495, 534–538. 10.1038/nature12000. [DOI] [PMC free article] [PubMed] [Google Scholar]
- Che T.; English J.; Krumm B. E.; Kim K.; Pardon E.; Olsen R. H. J.; Wang S.; Zhang S.; Diberto J. F.; Sciaky N.; Carroll F. I.; Steyaert J.; Wacker D.; Roth B. L. Nanobody-Enabled Monitoring of Kappa Opioid Receptor States. Nat. Commun. 2020, 11, 1145. 10.1038/s41467-020-14889-7. [DOI] [PMC free article] [PubMed] [Google Scholar]
- Janetopoulos C.; Jin T.; Devreotes P. Receptor-Mediated Activation of Heterotrimeric G-Proteins in Living Cells. Science 2001, 291, 2408–2411. 10.1126/science.1055835. [DOI] [PubMed] [Google Scholar]
- Hein P.; Frank M.; Hoffmann C.; Lohse M. J.; Bünemann M. Dynamics of Receptor/G Protein Coupling in Living Cells. EMBO J. 2005, 24, 4106–4114. 10.1038/sj.emboj.7600870. [DOI] [PMC free article] [PubMed] [Google Scholar]
- Olsen R. H. J.; DiBerto J. F.; English J. G.; Glaudin A. M.; Krumm B. E.; Slocum S. T.; Che T.; Gavin A. C.; McCorvy J. D.; Roth B. L.; et al. TRUPATH, an Open-Source Biosensor Platform for Interrogating the GPCR Transducerome. Nat. Chem. Biol. 2020, 16, 841–849. 10.1038/s41589-020-0535-8. [DOI] [PMC free article] [PubMed] [Google Scholar]
- Schihada H.; Shekhani R.; Schulte G. Quantitative Assessment of Constitutive G Protein-Coupled Receptor Activity with BRET-Based G Protein Biosensors. Sci. Signal. 2021, 14, eabf1653. 10.1126/scisignal.abf1653. [DOI] [PubMed] [Google Scholar]
- Gibson S. K.; Gilman A. G. Gialpha and Gbeta Subunits Both Define Selectivity of G Protein Activation by Alpha2-Adrenergic Receptors. Proc. Natl. Acad. Sci. U.S.A. 2006, 103, 212–217. 10.1073/pnas.0509763102. [DOI] [PMC free article] [PubMed] [Google Scholar]
- Maziarz M.; Park J.-C.; Leyme A.; Marivin A.; Garcia-Lopez A.; Patel P. P.; Garcia-Marcos M. Revealing the Activity of Trimeric G-Proteins in Live Cells with a Versatile Biosensor Design. Cell 2020, 182, 770. 10.1016/j.cell.2020.06.020. [DOI] [PMC free article] [PubMed] [Google Scholar]
- Wan Q.; Okashah N.; Inoue A.; Nehmé R.; Carpenter B.; Tate C. G.; Lambert N. A. Mini G Protein Probes for Active G Protein-Coupled Receptors (GPCRs) in Live Cells. J. Biol. Chem. 2018, 293, 7466–7473. 10.1074/jbc.RA118.001975. [DOI] [PMC free article] [PubMed] [Google Scholar]
- Vilardaga J.-P.; Bünemann M.; Krasel C.; Castro M.; Lohse M. J. Measurement of the Millisecond Activation Switch of G Protein-Coupled Receptors in Living Cells. Nat. Biotechnol. 2003, 21, 807–812. 10.1038/nbt838. [DOI] [PubMed] [Google Scholar]
- Cao Y.; Namkung Y.; Laporte S. A. Methods to Monitor the Trafficking of β-Arrestin/G Protein-Coupled Receptor Complexes Using Enhanced Bystander BRET. Methods Mol. Biol. 2019, 1957, 59–68. 10.1007/978-1-4939-9158-7_3. [DOI] [PubMed] [Google Scholar]
- Wright S. C.; Lukasheva V.; Le Gouill C.; Kobayashi H.; Breton B.; Mailhot-Larouche S.; Blondel-Tepaz E.; Antunes Vieira N.; Costa-Neto C.; Heroux M.; Lambert N. A.; Parreiras-e-Silva L. T.; Bouvier M. BRET-Based Effector Membrane Translocation Assay Monitors GPCR-Promoted and Endocytosis-Mediated Gq Activation at Early Endosomes. Proc. Natl. Acad. Sci. U.S.A. 2021, 118, e2025846118. 10.1073/pnas.2025846118. [DOI] [PMC free article] [PubMed] [Google Scholar]
- Zhang Q.; Zheng Y.-W.; Coughlin S. R.; Shu X. A Rapid Fluorogenic GPCR-β-Arrestin Interaction Assay. Protein Sci. 2018, 27, 874–879. 10.1002/pro.3385. [DOI] [PMC free article] [PubMed] [Google Scholar]
- Hoare S. R. J.; Tewson P. H.; Quinn A. M.; Hughes T. E. A Kinetic Method for Measuring Agonist Efficacy and Ligand Bias Using High Resolution Biosensors and a Kinetic Data Analysis Framework. Sci. Rep. 2020, 10, 1766. 10.1038/s41598-020-58421-9. [DOI] [PMC free article] [PubMed] [Google Scholar]
- Heim R.; Tsien R. Y. Engineering Green Fluorescent Protein for Improved Brightness, Longer Wavelengths and Fluorescence Resonance Energy Transfer. Curr. Biol. 1996, 6, 178–182. 10.1016/S0960-9822(02)00450-5. [DOI] [PubMed] [Google Scholar]
- Li M.; Chen X.; Ye Q.-Z.; Vogt A.; Yin X.-M. A High-Throughput FRET-Based Assay for Determination of Atg4 Activity. Autophagy 2012, 8, 401–412. 10.4161/auto.18777. [DOI] [PMC free article] [PubMed] [Google Scholar]
- Li F.; Yu J.; Zhang Z.; Cui Z.; Wang D.; Wei H.; Zhang X.-E. Use of HGluc/TdTomato Pair for Sensitive BRET Sensing of Protease with High Solution Media Tolerance. Talanta 2013, 109, 141–146. 10.1016/j.talanta.2013.02.007. [DOI] [PubMed] [Google Scholar]
- Hou N.; Peng C.; Zhang L.; Zhu Y.; Hu Q. BRET-Based Self-Cleaving Biosensors for SARS-CoV-2 3CLpro Inhibitor Discovery. Microbiol. Spectrum 2022, 10, e0255921 10.1128/spectrum.02559-21. [DOI] [PMC free article] [PubMed] [Google Scholar]
- Dacres H.; Weihs F.; Wang J.; Anderson A.; Trowell S. C. Bioluminescence Resonance Energy Transfer Biosensor for Measuring Activity of a Protease Secreted by Pseudomonas Fluorescens Growing in Milk. Anal. Chim. Acta 2023, 1270, 341401. 10.1016/j.aca.2023.341401. [DOI] [PubMed] [Google Scholar]
- Geethakumari A. M.; Ahmed W. S.; Rasool S.; Fatima A.; Nasir Uddin S. M.; Aouida M.; Biswas K. H. A Genetically Encoded BRET-Based SARS-CoV-2 Mpro Protease Activity Sensor. Commun. Chem. 2022, 5, 117. 10.1038/s42004-022-00731-2. [DOI] [PMC free article] [PubMed] [Google Scholar]
- Ding Y.; Li J.; Enterina J. R.; Shen Y.; Zhang I.; Tewson P. H.; Mo G. C. H.; Zhang J.; Quinn A. M.; Hughes T. E.; et al. Ratiometric Biosensors Based on Dimerization-Dependent Fluorescent Protein Exchange. Nat. Methods 2015, 12, 195–198. 10.1038/nmeth.3261. [DOI] [PMC free article] [PubMed] [Google Scholar]
- Mitchell A. C.; Alford S. C.; Hunter S. A.; Kannan D.; Parra Sperberg R. A.; Chang C. H.; Cochran J. R. Development of a Protease Biosensor Based on a Dimerization-Dependent Red Fluorescent Protein. ACS Chem. Biol. 2018, 13, 66–72. 10.1021/acschembio.7b00715. [DOI] [PMC free article] [PubMed] [Google Scholar]
- Yan H.; Zhang R.; Yan G.; Liu Z.; Liu X.; Liu X.; Chen Y. Production of a Versatile SARS-CoV-2 Main Protease Biosensor Based on a Dimerization-Dependent Red Fluorescent Protein. J. Med. Virol. 2023, 95, e28342. 10.1002/jmv.28342. [DOI] [PubMed] [Google Scholar]
- Sakamoto S.; Terauchi M.; Hugo A.; Kim T.; Araki Y.; Wada T. Creation of a Caspase-3 Sensing System Using a Combination of Split-GFP and Split-Intein. Chem. Commun. 2013, 49, 10323–10325. 10.1039/c3cc43389g. [DOI] [PubMed] [Google Scholar]
- To T.-L.; Schepis A.; Ruiz-González R.; Zhang Q.; Yu D.; Dong Z.; Coughlin S. R.; Shu X. Rational Design of a GFP-Based Fluorogenic Caspase Reporter for Imaging Apoptosis In Vivo. Cell Chem. Biol. 2016, 23, 875–882. 10.1016/j.chembiol.2016.06.007. [DOI] [PMC free article] [PubMed] [Google Scholar]
- Zhang Q.; Schepis A.; Huang H.; Yang J.; Ma W.; Torra J.; Zhang S.-Q.; Yang L.; Wu H.; Nonell S.; et al. Designing a Green Fluorogenic Protease Reporter by Flipping a Beta Strand of GFP for Imaging Apoptosis in Animals. J. Am. Chem. Soc. 2019, 141, 4526–4530. 10.1021/jacs.8b13042. [DOI] [PMC free article] [PubMed] [Google Scholar]
- Froggatt H. M.; Heaton B. E.; Heaton N. S. Development of a Fluorescence-Based, High-Throughput SARS-CoV-2 3CLpro Reporter Assay. J. Virol. 2020, 94, e01265-20. 10.1128/JVI.01265-20. [DOI] [PMC free article] [PubMed] [Google Scholar]
- Li X.; Lidsky P. V.; Xiao Y.; Wu C.-T.; Garcia-Knight M.; Yang J.; Nakayama T.; Nayak J. V.; Jackson P. K.; Andino R.; et al. Ethacridine Inhibits SARS-CoV-2 by Inactivating Viral Particles. PLoS Pathog. 2021, 17, e1009898. 10.1371/journal.ppat.1009898. [DOI] [PMC free article] [PubMed] [Google Scholar]
- To T.-L.; Piggott B. J.; Makhijani K.; Yu D.; Jan Y. N.; Shu X. Rationally Designed Fluorogenic Protease Reporter Visualizes Spatiotemporal Dynamics of Apoptosis in Vivo. Proc. Natl. Acad. Sci. U.S.A. 2015, 112, 3338–3343. 10.1073/pnas.1502857112. [DOI] [PMC free article] [PubMed] [Google Scholar]
- Kula T.; Dezfulian M. H.; Wang C. I.; Abdelfattah N. S.; Hartman Z. C.; Wucherpfennig K. W.; Lyerly H. K.; Elledge S. J. T-Scan: A Genome-Wide Method for the Systematic Discovery of T Cell Epitopes. Cell 2019, 178, 1016. 10.1016/j.cell.2019.07.009. [DOI] [PMC free article] [PubMed] [Google Scholar]
- Dezfulian M. H.; Kula T.; Pranzatelli T.; Kamitaki N.; Meng Q.; Khatri B.; Perez P.; Xu Q.; Chang A.; Kohlgruber A. C.; et al. TScan-II: A Genome-Scale Platform for the de Novo Identification of CD4+ T Cell Epitopes. Cell 2023, 186 (25), 5569–5586. 10.1016/j.cell.2023.10.024. [DOI] [PMC free article] [PubMed] [Google Scholar]
- Eid S.; Turk S.; Volkamer A.; Rippmann F.; Fulle S. KinMap: A Web-Based Tool for Interactive Navigation through Human Kinome Data. BMC Bioinformatics 2017, 18, 16. 10.1186/s12859-016-1433-7. [DOI] [PMC free article] [PubMed] [Google Scholar]
- Lahiry P.; Torkamani A.; Schork N. J.; Hegele R. A. Kinase Mutations in Human Disease: Interpreting Genotype-Phenotype Relationships. Nat. Rev. Genet. 2010, 11, 60–74. 10.1038/nrg2707. [DOI] [PubMed] [Google Scholar]
- Schmitt D. L.; Mehta S.; Zhang J. Study of Spatiotemporal Regulation of Kinase Signaling Using Genetically Encodable Molecular Tools. Curr. Opin. Chem. Biol. 2022, 71, 102224. 10.1016/j.cbpa.2022.102224. [DOI] [PMC free article] [PubMed] [Google Scholar]
- Leroux A. E.; Schulze J. O.; Biondi R. M. AGC Kinases, Mechanisms of Regulation and Innovative Drug Development. Semin. Cancer Biol. 2018, 48, 1–17. 10.1016/j.semcancer.2017.05.011. [DOI] [PubMed] [Google Scholar]
- Zhang J.; Ma Y.; Taylor S. S.; Tsien R. Y. Genetically Encoded Reporters of Protein Kinase A Activity Reveal Impact of Substrate Tethering. Proc. Natl. Acad. Sci. U.S.A. 2001, 98, 14997–15002. 10.1073/pnas.211566798. [DOI] [PMC free article] [PubMed] [Google Scholar]
- Taylor S. S.; Zhang P.; Steichen J. M.; Keshwani M. M.; Kornev A. P. PKA: Lessons Learned after Twenty Years. Biochim. Biophys. Acta 2013, 1834, 1271–1278. 10.1016/j.bbapap.2013.03.007. [DOI] [PMC free article] [PubMed] [Google Scholar]
- Depry C.; Allen M. D.; Zhang J. Visualization of PKA Activity in Plasma Membrane Microdomains. Mol. Biosyst. 2011, 7, 52–58. 10.1039/C0MB00079E. [DOI] [PubMed] [Google Scholar]
- Kunkel M. T.; Ni Q.; Tsien R. Y.; Zhang J.; Newton A. C. Spatio-Temporal Dynamics of Protein Kinase B/Akt Signaling Revealed by a Genetically Encoded Fluorescent Reporter. J. Biol. Chem. 2005, 280, 5581–5587. 10.1074/jbc.M411534200. [DOI] [PMC free article] [PubMed] [Google Scholar]
- Sasaki K.; Sato M.; Umezawa Y. Fluorescent Indicators for Akt/Protein Kinase B and Dynamics of Akt Activity Visualized in Living Cells. J. Biol. Chem. 2003, 278, 30945–30951. 10.1074/jbc.M212167200. [DOI] [PubMed] [Google Scholar]
- Zhang J.; Hupfeld C. J.; Taylor S. S.; Olefsky J. M.; Tsien R. Y. Insulin Disrupts Beta-Adrenergic Signalling to Protein Kinase A in Adipocytes. Nature 2005, 437, 569–573. 10.1038/nature04140. [DOI] [PubMed] [Google Scholar]
- Ross B. L; Tenner B.; Markwardt M. L; Zviman A.; Shi G.; Kerr J. P; Snell N. E; McFarland J. J; Mauban J. R; Ward C. W; Rizzo M. A; Zhang J. Single-Color, Ratiometric Biosensors for Detecting Signaling Activities in Live Cells. Elife 2018, 7, e35458. 10.7554/eLife.35458. [DOI] [PMC free article] [PubMed] [Google Scholar]
- Gao X.; Zhang J. Spatiotemporal Analysis of Differential Akt Regulation in Plasma Membrane Microdomains. Mol. Biol. Cell 2008, 19, 4366–4373. 10.1091/mbc.e08-05-0449. [DOI] [PMC free article] [PubMed] [Google Scholar]
- Miura H.; Matsuda M.; Aoki K. Development of a FRET Biosensor with High Specificity for Akt. Cell Struct Funct 2014, 39, 9–20. 10.1247/csf.13018. [DOI] [PubMed] [Google Scholar]
- Shcherbakova D. M.; Cox Cammer N.; Huisman T. M.; Verkhusha V. V.; Hodgson L. Direct Multiplex Imaging and Optogenetics of Rho GTPases Enabled by Near-Infrared FRET. Nat. Chem. Biol. 2018, 14, 591–600. 10.1038/s41589-018-0044-1. [DOI] [PMC free article] [PubMed] [Google Scholar]
- Helmchen F.; Denk W. Deep Tissue Two-Photon Microscopy. Nat. Methods 2005, 2, 932–940. 10.1038/nmeth818. [DOI] [PubMed] [Google Scholar]
- Day R. N.; Tao W.; Dunn K. W. A Simple Approach for Measuring FRET in Fluorescent Biosensors Using Two-Photon Microscopy. Nat. Protoc. 2016, 11, 2066–2080. 10.1038/nprot.2016.121. [DOI] [PubMed] [Google Scholar]
- Chen Y.; Saulnier J. L.; Yellen G.; Sabatini B. L. A PKA Activity Sensor for Quantitative Analysis of Endogenous GPCR Signaling via 2-Photon FRET-FLIM Imaging. Front. Pharmacol. 2014, 5, 56. 10.3389/fphar.2014.00056. [DOI] [PMC free article] [PubMed] [Google Scholar]
- Ma L.; Jongbloets B. C.; Xiong W.-H.; Melander J. B.; Qin M.; Lameyer T. J.; Harrison M. F.; Zemelman B. V.; Mao T.; Zhong H. A Highly Sensitive A-Kinase Activity Reporter for Imaging Neuromodulatory Events in Awake Mice. Neuron 2018, 99, 665. 10.1016/j.neuron.2018.07.020. [DOI] [PMC free article] [PubMed] [Google Scholar]
- Wojciechowska D.; Taube M.; Rucińska K.; Maksim J.; Kozak M. Oligomerization of Human Cystatin C-An Amyloidogenic Protein: An Analysis of Small Oligomeric Subspecies. Int. J. Mol. Sci. 2022, 23, 13441. 10.3390/ijms232113441. [DOI] [PMC free article] [PubMed] [Google Scholar]
- Dedecker P.; Mo G. C. H.; Dertinger T.; Zhang J. Widely Accessible Method for Superresolution Fluorescence Imaging of Living Systems. Proc. Natl. Acad. Sci. U.S.A. 2012, 109, 10909–10914. 10.1073/pnas.1204917109. [DOI] [PMC free article] [PubMed] [Google Scholar]
- Lin W.; Mo G. C. H.; Mehta S.; Zhang J. DrFLINC Contextualizes Super-Resolution Activity Imaging. J. Am. Chem. Soc. 2021, 143, 14951–14955. 10.1021/jacs.1c05530. [DOI] [PMC free article] [PubMed] [Google Scholar]
- Newton A. C. Protein Kinase C: Perfectly Balanced. Crit Rev. Biochem Mol. Biol. 2018, 53, 208–230. 10.1080/10409238.2018.1442408. [DOI] [PMC free article] [PubMed] [Google Scholar]
- Kajimoto T.; Caliman A. D.; Tobias I. S.; Okada T.; Pilo C. A.; Van A.-A. N.; Andrew McCammon J.; Nakamura S.-I.; Newton A. C. Activation of Atypical Protein Kinase C by Sphingosine 1-Phosphate Revealed by an APKC-Specific Activity Reporter. Sci. Signal. 2019, 12, eaat6662. 10.1126/scisignal.aat6662. [DOI] [PMC free article] [PubMed] [Google Scholar]
- Antal C. E.; Violin J. D.; Kunkel M. T.; Skovso̷ S.; Newton A. C. Intramolecular Conformational Changes Optimize Protein Kinase C Signaling. Chem. Biol. 2014, 21, 459–469. 10.1016/j.chembiol.2014.02.008. [DOI] [PMC free article] [PubMed] [Google Scholar]
- Colgan L. A.; Hu M.; Misler J. A.; Parra-Bueno P.; Moran C. M.; Leitges M.; Yasuda R. PKCα Integrates Spatiotemporally Distinct Ca2+ and Autocrine BDNF Signaling to Facilitate Synaptic Plasticity. Nat. Neurosci. 2018, 21, 1027–1037. 10.1038/s41593-018-0184-3. [DOI] [PMC free article] [PubMed] [Google Scholar]
- Hongpaisan J.; Alkon D. L. A Structural Basis for Enhancement of Long-Term Associative Memory in Single Dendritic Spines Regulated by PKC. Proc. Natl. Acad. Sci. U.S.A. 2007, 104, 19571–19576. 10.1073/pnas.0709311104. [DOI] [PMC free article] [PubMed] [Google Scholar]
- Olds J. L.; Anderson M. L.; McPhie D. L.; Staten L. D.; Alkon D. L. Imaging of Memory-Specific Changes in the Distribution of Protein Kinase C in the Hippocampus. Science 1989, 245, 866–869. 10.1126/science.2772638. [DOI] [PubMed] [Google Scholar]
- Ananthanarayanan B.; Fosbrink M.; Rahdar M.; Zhang J. Live-Cell Molecular Analysis of Akt Activation Reveals Roles for Activation Loop Phosphorylation. J. Biol. Chem. 2007, 282, 36634–36641. 10.1074/jbc.M706227200. [DOI] [PubMed] [Google Scholar]
- Liu S.-L.; Wang Z.-G.; Hu Y.; Xin Y.; Singaram I.; Gorai S.; Zhou X.; Shim Y.; Min J.-H.; Gong L.-W.; Hay N.; Zhang J.; Cho W. Quantitative Lipid Imaging Reveals a New Signaling Function of Phosphatidylinositol-3,4-Bisphophate: Isoform- and Site-Specific Activation of Akt. Mol. Cell 2018, 71, 1092. 10.1016/j.molcel.2018.07.035. [DOI] [PMC free article] [PubMed] [Google Scholar]
- Roberts R. E. The Extracellular Signal-Regulated Kinase (ERK) Pathway: A Potential Therapeutic Target in Hypertension. J. Exp. Pharmacol. 2012, 4, 77–83. 10.2147/JEP.S28907. [DOI] [PMC free article] [PubMed] [Google Scholar]
- Chowdhury I.; Dashi G.; Keskitalo S. CMGC Kinases in Health and Cancer. Cancers (Basel) 2023, 15, 3838. 10.3390/cancers15153838. [DOI] [PMC free article] [PubMed] [Google Scholar]
- Fey D.; Croucher D. R.; Kolch W.; Kholodenko B. N. Crosstalk and Signaling Switches in Mitogen-Activated Protein Kinase Cascades. Front. Physiol. 2012, 3, 355. 10.3389/fphys.2012.00355. [DOI] [PMC free article] [PubMed] [Google Scholar]
- Harvey C. D.; Ehrhardt A. G.; Cellurale C.; Zhong H.; Yasuda R.; Davis R. J.; Svoboda K. A Genetically Encoded Fluorescent Sensor of ERK Activity. Proc. Natl. Acad. Sci. U.S.A. 2008, 105, 19264–19269. 10.1073/pnas.0804598105. [DOI] [PMC free article] [PubMed] [Google Scholar]
- Sparta B.; Pargett M.; Minguet M.; Distor K.; Bell G.; Albeck J. G. Receptor Level Mechanisms Are Required for Epidermal Growth Factor (EGF)-Stimulated Extracellular Signal-Regulated Kinase (ERK) Activity Pulses. J. Biol. Chem. 2015, 290, 24784–24792. 10.1074/jbc.M115.662247. [DOI] [PMC free article] [PubMed] [Google Scholar]
- Keyes J.; Ganesan A.; Molinar-Inglis O.; Hamidzadeh A.; Zhang J.; Ling M.; Trejo J.; Levchenko A.; Zhang J. Signaling Diversity Enabled by Rap1-Regulated Plasma Membrane ERK with Distinct Temporal Dynamics. Elife 2020, 9, e57410. 10.7554/eLife.57410. [DOI] [PMC free article] [PubMed] [Google Scholar]
- Vandame P.; Spriet C.; Riquet F.; Trinel D.; Cailliau-Maggio K.; Bodart J.-F. Optimization of ERK Activity Biosensors for Both Ratiometric and Lifetime FRET Measurements. Sensors (Basel) 2014, 14, 1140–1154. 10.3390/s140101140. [DOI] [PMC free article] [PubMed] [Google Scholar]
- Fritz R. D.; Letzelter M.; Reimann A.; Martin K.; Fusco L.; Ritsma L.; Ponsioen B.; Fluri E.; Schulte-Merker S.; van Rheenen J.; Pertz O. A Versatile Toolkit to Produce Sensitive FRET Biosensors to Visualize Signaling in Time and Space. Sci. Signal. 2013, 6, rs12. 10.1126/scisignal.2004135. [DOI] [PubMed] [Google Scholar]
- Ponsioen B.; Post J. B.; Buissant des Amorie J. R.; Laskaris D.; van Ineveld R. L.; Kersten S.; Bertotti A.; Sassi F.; Sipieter F.; Cappe B.; et al. Quantifying Single-Cell ERK Dynamics in Colorectal Cancer Organoids Reveals EGFR as an Amplifier of Oncogenic MAPK Pathway Signalling. Nat. Cell Biol. 2021, 23, 377–390. 10.1038/s41556-021-00654-5. [DOI] [PMC free article] [PubMed] [Google Scholar]
- Toettcher J. E.; Weiner O. D.; Lim W. A. Using Optogenetics to Interrogate the Dynamic Control of Signal Transmission by the Ras/Erk Module. Cell 2013, 155, 1422–1434. 10.1016/j.cell.2013.11.004. [DOI] [PMC free article] [PubMed] [Google Scholar]
- Miura H.; Kondo Y.; Matsuda M.; Aoki K. Cell-to-Cell Heterogeneity in P38-Mediated Cross-Inhibition of JNK Causes Stochastic Cell Death. Cell Rep. 2018, 24, 2658–2668. 10.1016/j.celrep.2018.08.020. [DOI] [PubMed] [Google Scholar]
- Martinez M. A. Q.; Matus D. Q. CDK Activity Sensors: Genetically Encoded Ratiometric Biosensors for Live Analysis of the Cell Cycle. Biochem. Soc. Trans. 2022, 50, 1081–1090. 10.1042/BST20211131. [DOI] [PMC free article] [PubMed] [Google Scholar]
- Maryu G.; Matsuda M.; Aoki K. Multiplexed Fluorescence Imaging of ERK and Akt Activities and Cell-Cycle Progression. Cell Struct Funct 2016, 41, 81–92. 10.1247/csf.16007. [DOI] [PubMed] [Google Scholar]
- Spencer S. L.; Cappell S. D.; Tsai F.-C.; Overton K. W.; Wang C. L.; Meyer T. The Proliferation-Quiescence Decision Is Controlled by a Bifurcation in CDK2 Activity at Mitotic Exit. Cell 2013, 155, 369–383. 10.1016/j.cell.2013.08.062. [DOI] [PMC free article] [PubMed] [Google Scholar]
- Yang H. W.; Cappell S. D; Jaimovich A.; Liu C.; Chung M.; Daigh L. H; Pack L. R; Fan Y.; Regot S.; Covert M.; Meyer T. Stress-Mediated Exit to Quiescence Restricted by Increasing Persistence in CDK4/6 Activation. Elife 2020, 9, e44571. 10.7554/eLife.44571. [DOI] [PMC free article] [PubMed] [Google Scholar]
- Depry C.; Mehta S.; Li R.; Zhang J. Visualization of Compartmentalized Kinase Activity Dynamics Using Adaptable Bimkars. Chem. Biol. 2015, 22, 1470–1479. 10.1016/j.chembiol.2015.10.004. [DOI] [PMC free article] [PubMed] [Google Scholar]
- Albeck J. G.; Mills G. B.; Brugge J. S. Frequency-Modulated Pulses of ERK Activity Transmit Quantitative Proliferation Signals. Mol. Cell 2013, 49, 249–261. 10.1016/j.molcel.2012.11.002. [DOI] [PMC free article] [PubMed] [Google Scholar]
- Zhang Q.; Huang H.; Zhang L.; Wu R.; Chung C.-I.; Zhang S.-Q.; Torra J.; Schepis A.; Coughlin S. R.; Kornberg T. B.; et al. Visualizing Dynamics of Cell Signaling In Vivo with a Phase Separation-Based Kinase Reporter. Mol. Cell 2018, 69, 347. 10.1016/j.molcel.2018.01.008. [DOI] [PubMed] [Google Scholar]
- Yang Y.; Kim S. C.; Yu T.; Yi Y.-S.; Rhee M. H.; Sung G.-H.; Yoo B. C.; Cho J. Y. Functional Roles of P38 Mitogen-Activated Protein Kinase in Macrophage-Mediated Inflammatory Responses. Mediators Inflamm. 2014, 2014, 352371. 10.1155/2014/352371. [DOI] [PMC free article] [PubMed] [Google Scholar]
- Weston C. R.; Davis R. J. The JNK Signal Transduction Pathway. Curr. Opin. Cell Biol. 2007, 19, 142–149. 10.1016/j.ceb.2007.02.001. [DOI] [PubMed] [Google Scholar]
- Tanoue T.; Adachi M.; Moriguchi T.; Nishida E. A Conserved Docking Motif in MAP Kinases Common to Substrates, Activators and Regulators. Nat. Cell Biol. 2000, 2, 110–116. 10.1038/35000065. [DOI] [PubMed] [Google Scholar]
- Fosbrink M.; Aye-Han N.-N.; Cheong R.; Levchenko A.; Zhang J. Visualization of JNK Activity Dynamics with a Genetically Encoded Fluorescent Biosensor. Proc. Natl. Acad. Sci. U.S.A. 2010, 107, 5459–5464. 10.1073/pnas.0909671107. [DOI] [PMC free article] [PubMed] [Google Scholar]
- Tomida T.; Takekawa M.; Saito H. Oscillation of P38 Activity Controls Efficient Pro-Inflammatory Gene Expression. Nat. Commun. 2015, 6, 8350. 10.1038/ncomms9350. [DOI] [PMC free article] [PubMed] [Google Scholar]
- Brzozowski J. S.; Skelding K. A. The Multi-Functional Calcium/Calmodulin Stimulated Protein Kinase (CaMK) Family: Emerging Targets for Anti-Cancer Therapeutic Intervention. Pharmaceuticals (Basel) 2019, 12, 8. 10.3390/ph12010008. [DOI] [PMC free article] [PubMed] [Google Scholar]
- Swulius M. T.; Waxham M. N. Ca(2+)/Calmodulin-Dependent Protein Kinases. Cell. Mol. Life Sci. 2008, 65, 2637–2657. 10.1007/s00018-008-8086-2. [DOI] [PMC free article] [PubMed] [Google Scholar]
- Hell J.; CaMKII W. Claiming Center Stage in Postsynaptic Function and Organization. Neuron 2014, 81, 249–265. 10.1016/j.neuron.2013.12.024. [DOI] [PMC free article] [PubMed] [Google Scholar]
- Mashin V. A.; Mashina M. N. [Analysis of the Heart Rhythm Variability in Negative Functional States during Sessions of Psychological Relaxation]. Fiziol. Cheloveka 2000, 26, 420–54. 10.1007/BF02760270. [DOI] [PubMed] [Google Scholar]
- Takao K.; Okamoto K.-I.; Nakagawa T.; Neve R. L.; Nagai T.; Miyawaki A.; Hashikawa T.; Kobayashi S.; Hayashi Y. Visualization of Synaptic Ca2+ /Calmodulin-Dependent Protein Kinase II Activity in Living Neurons. J. Neurosci. 2005, 25, 3107–3112. 10.1523/JNEUROSCI.0085-05.2005. [DOI] [PMC free article] [PubMed] [Google Scholar]
- Erickson J. R.; Patel R.; Ferguson A.; Bossuyt J.; Bers D. M. Fluorescence Resonance Energy Transfer-Based Sensor Camui Provides New Insight into Mechanisms of Calcium/Calmodulin-Dependent Protein Kinase II Activation in Intact Cardiomyocytes. Circ. Res. 2011, 109, 729–738. 10.1161/CIRCRESAHA.111.247148. [DOI] [PMC free article] [PubMed] [Google Scholar]
- Lam A. J.; St-Pierre F.; Gong Y.; Marshall J. D.; Cranfill P. J.; Baird M. A.; McKeown M. R.; Wiedenmann J.; Davidson M. W.; Schnitzer M. J.; et al. Improving FRET Dynamic Range with Bright Green and Red Fluorescent Proteins. Nat. Methods 2012, 9, 1005–1012. 10.1038/nmeth.2171. [DOI] [PMC free article] [PubMed] [Google Scholar]
- Fujii H.; Inoue M.; Okuno H.; Sano Y.; Takemoto-Kimura S.; Kitamura K.; Kano M.; Bito H. Nonlinear Decoding and Asymmetric Representation of Neuronal Input Information by CaMKIIα and Calcineurin. Cell Rep. 2013, 3, 978–987. 10.1016/j.celrep.2013.03.033. [DOI] [PubMed] [Google Scholar]
- Tramier M.; Gautier I.; Piolot T.; Ravalet S.; Kemnitz K.; Coppey J.; Durieux C.; Mignotte V.; Coppey-Moisan M. Picosecond-Hetero-FRET Microscopy to Probe Protein-Protein Interactions in Live Cells. Biophys. J. 2002, 83, 3570–3577. 10.1016/S0006-3495(02)75357-5. [DOI] [PMC free article] [PubMed] [Google Scholar]
- Lee S.-J. R.; Escobedo-Lozoya Y.; Szatmari E. M.; Yasuda R. Activation of CaMKII in Single Dendritic Spines during Long-Term Potentiation. Nature 2009, 458, 299–304. 10.1038/nature07842. [DOI] [PMC free article] [PubMed] [Google Scholar]
- Murakoshi H.; Shibata A. C. E.; Nakahata Y.; Nabekura J. A Dark Green Fluorescent Protein as an Acceptor for Measurement of Förster Resonance Energy Transfer. Sci. Rep. 2015, 5, 15334. 10.1038/srep15334. [DOI] [PMC free article] [PubMed] [Google Scholar]
- Nakahata Y.; Nabekura J.; Murakoshi H. Dual Observation of the ATP-Evoked Small GTPase Activation and Ca2+ Transient in Astrocytes Using a Dark Red Fluorescent Protein. Sci. Rep. 2016, 6, 39564. 10.1038/srep39564. [DOI] [PMC free article] [PubMed] [Google Scholar]
- Ardestani G.; West M. C.; Maresca T. J.; Fissore R. A.; Stratton M. M. FRET-Based Sensor for CaMKII Activity (FRESCA): A Useful Tool for Assessing CaMKII Activity in Response to Ca2+ Oscillations in Live Cells. J. Biol. Chem. 2019, 294, 11876–11891. 10.1074/jbc.RA119.009235. [DOI] [PMC free article] [PubMed] [Google Scholar]
- Reyes Gaido O. E.; Pavlaki N.; Granger J. M.; Mesubi O. O.; Liu B.; Lin B. L.; Long A.; Walker D.; Mayourian J.; Schole K. L.; Terrillion C. E.; Nkashama L. J.; Hulsurkar M. M.; Dorn L. E.; Ferrero K. M.; Huganir R. L.; Muller F. U.; Wehrens X. H. T.; Liu J. O.; Luczak E. D.; Bezzerides V. J.; Anderson M. E. An Improved Reporter Identifies Ruxolitinib as a Potent and Cardioprotective CaMKII Inhibitor. Sci. Transl. Med. 2023, 15, eabq7839. 10.1126/scitranslmed.abq7839. [DOI] [PMC free article] [PubMed] [Google Scholar]
- Steinberg G. R.; Hardie D. G. New Insights into Activation and Function of the AMPK. Nat. Rev. Mol. Cell Biol. 2023, 24, 255–272. 10.1038/s41580-022-00547-x. [DOI] [PubMed] [Google Scholar]
- Tsou P.; Zheng B.; Hsu C.-H.; Sasaki A. T.; Cantley L. C. A Fluorescent Reporter of AMPK Activity and Cellular Energy Stress. Cell Metab. 2011, 13, 476–486. 10.1016/j.cmet.2011.03.006. [DOI] [PMC free article] [PubMed] [Google Scholar]
- Sample V.; Ramamurthy S.; Gorshkov K.; Ronnett G. V.; Zhang J. Polarized Activities of AMPK and BRSK in Primary Hippocampal Neurons. Mol. Biol. Cell 2015, 26, 1935–1946. 10.1091/mbc.E14-02-0764. [DOI] [PMC free article] [PubMed] [Google Scholar]
- Miyamoto T.; Rho E.; Sample V.; Akano H.; Magari M.; Ueno T.; Gorshkov K.; Chen M.; Tokumitsu H.; Zhang J.; et al. Compartmentalized AMPK Signaling Illuminated by Genetically Encoded Molecular Sensors and Actuators. Cell Rep. 2015, 11, 657–670. 10.1016/j.celrep.2015.03.057. [DOI] [PMC free article] [PubMed] [Google Scholar]
- Schmitt D. L.; Curtis S. D.; Lyons A. C.; Zhang J.-F.; Chen M.; He C. Y.; Mehta S.; Shaw R. J.; Zhang J. Spatial Regulation of AMPK Signaling Revealed by a Sensitive Kinase Activity Reporter. Nat. Commun. 2022, 13, 3856. 10.1038/s41467-022-31190-x. [DOI] [PMC free article] [PubMed] [Google Scholar]
- Pelosse M.; Cottet-Rousselle C.; Bidan C. M.; Dupont A.; Gupta K.; Berger I.; Schlattner U. Synthetic Energy Sensor AMPfret Deciphers Adenylate-Dependent AMPK Activation Mechanism. Nat. Commun. 2019, 10, 1038. 10.1038/s41467-019-08938-z. [DOI] [PMC free article] [PubMed] [Google Scholar]
- Pincus D.; Letunic I.; Bork P.; Lim W. A. Evolution of the Phospho-Tyrosine Signaling Machinery in Premetazoan Lineages. Proc. Natl. Acad. Sci. U.S.A. 2008, 105, 9680–9684. 10.1073/pnas.0803161105. [DOI] [PMC free article] [PubMed] [Google Scholar]
- Du Z.; Lovly C. M. Mechanisms of Receptor Tyrosine Kinase Activation in Cancer. Mol. Cancer 2018, 17, 58. 10.1186/s12943-018-0782-4. [DOI] [PMC free article] [PubMed] [Google Scholar]
- Ting A. Y.; Kain K. H.; Klemke R. L.; Tsien R. Y. Genetically Encoded Fluorescent Reporters of Protein Tyrosine Kinase Activities in Living Cells. Proc. Natl. Acad. Sci. U.S.A. 2001, 98, 15003–15008. 10.1073/pnas.211564598. [DOI] [PMC free article] [PubMed] [Google Scholar]
- Nakajima T.; Sato M.; Akaza N.; Umezawa Y. Cell-Based Fluorescent Indicator to Visualize Brain-Derived Neurotrophic Factor Secreted from Living Neurons. ACS Chem. Biol. 2008, 3, 352–358. 10.1021/cb800052v. [DOI] [PubMed] [Google Scholar]
- Wang Y.; Botvinick E. L.; Zhao Y.; Berns M. W.; Usami S.; Tsien R. Y.; Chien S. Visualizing the Mechanical Activation of Src. Nature 2005, 434, 1040–1045. 10.1038/nature03469. [DOI] [PubMed] [Google Scholar]
- Seong J.; Huang M.; Sim K. M.; Kim H.; Wang Y. FRET-Based Visualization of PDGF Receptor Activation at Membrane Microdomains. Sci. Rep. 2017, 7, 1593. 10.1038/s41598-017-01789-y. [DOI] [PMC free article] [PubMed] [Google Scholar]
- Abram C. L.; Lowell C. A. The Diverse Functions of Src Family Kinases in Macrophages. Front. Biosci. (Landmark Ed.) 2008, 13, 4426–4450. 10.2741/3015. [DOI] [PMC free article] [PubMed] [Google Scholar]
- Thomas S. M.; Brugge J. S. Cellular Functions Regulated by Src Family Kinases. Annu. Rev. Cell Dev. Biol. 1997, 13, 513–609. 10.1146/annurev.cellbio.13.1.513. [DOI] [PubMed] [Google Scholar]
- Su T.; Pan S.; Luo Q.; Zhang Z. Monitoring of Dual Bio-Molecular Events Using FRET Biosensors Based on MTagBFP/SfGFP and MVenus/MKOκ Fluorescent Protein Pairs. Biosens. Bioelectron. 2013, 46, 97–101. 10.1016/j.bios.2013.02.024. [DOI] [PubMed] [Google Scholar]
- Su T.; Zhang Z.; Luo Q. Ratiometric Fluorescence Imaging of Dual Bio-Molecular Events in Single Living Cells Using a New FRET Pair MVenus/MKOκ-Based Biosensor and a Single Fluorescent Protein Biosensor. Biosens. Bioelectron. 2012, 31, 292–298. 10.1016/j.bios.2011.10.034. [DOI] [PubMed] [Google Scholar]
- Wang P.; Liang J.; Shi L. Z.; Wang Y.; Zhang P.; Ouyang M.; Preece D.; Peng Q.; Shao L.; Fan J.; et al. Visualizing Spatiotemporal Dynamics of Intercellular Mechanotransmission upon Wounding. ACS Photonics 2018, 5, 3565–3574. 10.1021/acsphotonics.8b00383. [DOI] [PMC free article] [PubMed] [Google Scholar]
- Ouyang M.; Wan R.; Qin Q.; Peng Q.; Wang P.; Wu J.; Allen M.; Shi Y.; Laub S.; Deng L.; et al. Sensitive FRET Biosensor Reveals Fyn Kinase Regulation by Submembrane Localization. ACS Sens. 2019, 4, 76–86. 10.1021/acssensors.8b00896. [DOI] [PMC free article] [PubMed] [Google Scholar]
- Li X.; Combs J. D.; Salaita K.; Shu X. Polarized Focal Adhesion Kinase Activity within a Focal Adhesion during Cell Migration. Nat. Chem. Biol. 2023, 19, 1458–1468. 10.1038/s41589-023-01353-y. [DOI] [PMC free article] [PubMed] [Google Scholar]
- Wang H.; Kadlecek T. A.; Au-Yeung B. B.; Goodfellow H. E. S.; Hsu L.-Y.; Freedman T. S.; Weiss A. ZAP-70: An Essential Kinase in T-Cell Signaling. Cold Spring Harb. Perspect. Biol. 2010, 2, a002279 10.1101/cshperspect.a002279. [DOI] [PMC free article] [PubMed] [Google Scholar]
- Lo W.-L.; Shah N. H.; Ahsan N.; Horkova V.; Stepanek O.; Salomon A. R.; Kuriyan J.; Weiss A. Lck Promotes Zap70-Dependent LAT Phosphorylation by Bridging Zap70 to LAT. Nat. Immunol. 2018, 19, 733–741. 10.1038/s41590-018-0131-1. [DOI] [PMC free article] [PubMed] [Google Scholar]
- Randriamampita C.; Mouchacca P.; Malissen B.; Marguet D.; Trautmann A.; Lellouch A. C. A Novel ZAP-70 Dependent FRET Based Biosensor Reveals Kinase Activity at Both the Immunological Synapse and the Antisynapse. PLoS One 2008, 3, e1521. 10.1371/journal.pone.0001521. [DOI] [PMC free article] [PubMed] [Google Scholar]
- Cai X.; Lietha D.; Ceccarelli D. F.; Karginov A. V.; Rajfur Z.; Jacobson K.; Hahn K. M.; Eck M. J.; Schaller M. D. Spatial and Temporal Regulation of Focal Adhesion Kinase Activity in Living Cells. Mol. Cell. Biol. 2008, 28, 201–214. 10.1128/MCB.01324-07. [DOI] [PMC free article] [PubMed] [Google Scholar]
- Kanev G. K.; de Graaf C.; de Esch I. J. P.; Leurs R.; Würdinger T.; Westerman B. A.; Kooistra A. J. The Landscape of Atypical and Eukaryotic Protein Kinases. Trends Pharmacol. Sci. 2019, 40, 818–832. 10.1016/j.tips.2019.09.002. [DOI] [PubMed] [Google Scholar]
- Laplante M.; Sabatini D. M. MTOR Signaling at a Glance. J. Cell Sci. 2009, 122, 3589–3594. 10.1242/jcs.051011. [DOI] [PMC free article] [PubMed] [Google Scholar]
- Zhou X.; Zhong Y.; Molinar-Inglis O.; Kunkel M. T.; Chen M.; Sun T.; Zhang J.; Shyy J. Y.-J.; Trejo J.; Newton A. C.; Zhang J. Location-Specific Inhibition of Akt Reveals Regulation of MTORC1 Activity in the Nucleus. Nat. Commun. 2020, 11, 6088. 10.1038/s41467-020-19937-w. [DOI] [PMC free article] [PubMed] [Google Scholar]
- Zhou X.; Zhong Y.; Zhang J. Regulation of Nuclear MTORC1. Mol. Cell. Oncol. 2021, 8, 1896348. 10.1080/23723556.2021.1896348. [DOI] [PMC free article] [PubMed] [Google Scholar]
- Ahmed A. R.; Owens R. J.; Stubbs C. D.; Parker A. W.; Hitchman R.; Yadav R. B.; Dumoux M.; Hawes C.; Botchway S. W. Direct Imaging of the Recruitment and Phosphorylation of S6K1 in the MTORC1 Pathway in Living Cells. Sci. Rep. 2019, 9, 3408. 10.1038/s41598-019-39410-z. [DOI] [PMC free article] [PubMed] [Google Scholar]
- Sparta B.; Kosaisawe N.; Pargett M.; Patankar M.; DeCuzzi N.; Albeck J. G. Continuous Sensing of Nutrients and Growth Factors by the MTORC1-TFEB Axis. Elife 2023, 12, e74903. 10.7554/eLife.74903. [DOI] [PMC free article] [PubMed] [Google Scholar]
- Zhong Y.; Zhou X.; Guan K.-L.; Zhang J. Rheb Regulates Nuclear MTORC1 Activity Independent of Farnesylation. Cell Chem. Biol. 2022, 29, 1037. 10.1016/j.chembiol.2022.02.006. [DOI] [PMC free article] [PubMed] [Google Scholar]
- Johnson S. A.; You Z.; Hunter T. Monitoring ATM Kinase Activity in Living Cells. DNA Repair (Amst.) 2007, 6, 1277–1284. 10.1016/j.dnarep.2007.02.025. [DOI] [PubMed] [Google Scholar]
- Yang D.; Wang Y.; Qi T.; Zhang X.; Shen L.; Ma J.; Pang Z.; Lal N. K.; McClatchy D. B.; Seradj S. H.; Leung V. H.; Wang K.; Xie Y.; Polli F. S.; Maximov A.; Gonzalez O. C.; de Lecea L.; Cline H. T.; Augustine V.; Yates J. R.; Ye L. Phosphorylation of Pyruvate Dehydrogenase Inversely Associates with Neuronal Activity. Neuron 2024, 112, 959. 10.1016/j.neuron.2023.12.015. [DOI] [PMC free article] [PubMed] [Google Scholar]
- Ishii E.; Eguchi Y. Diversity in Sensing and Signaling of Bacterial Sensor Histidine Kinases. Biomolecules 2021, 11, 1524. 10.3390/biom11101524. [DOI] [PMC free article] [PubMed] [Google Scholar]
- Stewart R. C. Protein Histidine Kinases: Assembly of Active Sites and Their Regulation in Signaling Pathways. Curr. Opin. Microbiol. 2010, 13, 133–141. 10.1016/j.mib.2009.12.013. [DOI] [PMC free article] [PubMed] [Google Scholar]
- Duvall S. W.; Childers W. S. Design of a Histidine Kinase FRET Sensor to Detect Complex Signal Integration within Living Bacteria. ACS Sens. 2020, 5, 1589–1596. 10.1021/acssensors.0c00008. [DOI] [PubMed] [Google Scholar]
- Hunter T. A Journey from Phosphotyrosine to Phosphohistidine and Beyond. Mol. Cell 2022, 82, 2190–2200. 10.1016/j.molcel.2022.05.007. [DOI] [PMC free article] [PubMed] [Google Scholar]
- Saraf J.; Bhattacharya P.; Kalia K.; Borah A.; Sarmah D.; Kaur H.; Dave K. R.; Yavagal D. R. A Friend or Foe: Calcineurin across the Gamut of Neurological Disorders. ACS Cent. Sci. 2018, 4, 805–819. 10.1021/acscentsci.8b00230. [DOI] [PMC free article] [PubMed] [Google Scholar]
- Dreisin R. B. New Perspectives in Wegener’s Granulomatosis. Thorax 1993, 48, 97–99. 10.1136/thx.48.2.97. [DOI] [PMC free article] [PubMed] [Google Scholar]
- Mehta S.; Aye-Han N.-N.; Ganesan A.; Oldach L.; Gorshkov K.; Zhang J. Calmodulin-Controlled Spatial Decoding of Oscillatory Ca2+ Signals by Calcineurin. Elife 2014, 3, e03765 10.7554/eLife.03765. [DOI] [PMC free article] [PubMed] [Google Scholar]
- Köhn M. Turn and Face the Strange: A New View on Phosphatases. ACS Cent. Sci. 2020, 6, 467–477. 10.1021/acscentsci.9b00909. [DOI] [PMC free article] [PubMed] [Google Scholar]
- Roy J.; Cyert M. S. Cracking the Phosphatase Code: Docking Interactions Determine Substrate Specificity. Sci. Signal. 2009, 2, re9. 10.1126/scisignal.2100re9. [DOI] [PubMed] [Google Scholar]
- Brautigan D. L.; Shenolikar S. Protein Serine/Threonine Phosphatases: Keys to Unlocking Regulators and Substrates. Annu. Rev. Biochem. 2018, 87, 921–964. 10.1146/annurev-biochem-062917-012332. [DOI] [PubMed] [Google Scholar]
- Hoermann B.; Kokot T.; Helm D.; Heinzlmeir S.; Chojnacki J. E.; Schubert T.; Ludwig C.; Berteotti A.; Kurzawa N.; Kuster B.; Savitski M. M.; Kohn M. Dissecting the Sequence Determinants for Dephosphorylation by the Catalytic Subunits of Phosphatases PP1 and PP2A. Nat. Commun. 2020, 11, 3583. 10.1038/s41467-020-17334-x. [DOI] [PMC free article] [PubMed] [Google Scholar]
- Bazzazi H.; Sang L.; Dick I. E.; Joshi-Mukherjee R.; Yang W.; Yue D. T. Novel Fluorescence Resonance Energy Transfer-Based Reporter Reveals Differential Calcineurin Activation in Neonatal and Adult Cardiomyocytes. J. Physiol. (London) 2015, 593, 3865–3884. 10.1113/JP270510. [DOI] [PMC free article] [PubMed] [Google Scholar]
- Fahs S.; Lujan P.; Köhn M. Approaches to Study Phosphatases. ACS Chem. Biol. 2016, 11, 2944–2961. 10.1021/acschembio.6b00570. [DOI] [PubMed] [Google Scholar]
- Takai Y.; Sasaki T.; Matozaki T. Small GTP-Binding Proteins. Physiol. Rev. 2001, 81, 153–208. 10.1152/physrev.2001.81.1.153. [DOI] [PubMed] [Google Scholar]
- Song S.; Cong W.; Zhou S.; Shi Y.; Dai W.; Zhang H.; Wang X.; He B.; Zhang Q. Small GTPases: Structure, Biological Function and Its Interaction with Nanoparticles. Asian Journal of Pharmaceutical Sciences 2019, 14, 30–39. 10.1016/j.ajps.2018.06.004. [DOI] [PMC free article] [PubMed] [Google Scholar]
- Bernal Astrain G.; Nikolova M.; Smith M. J. Functional Diversity in the RAS Subfamily of Small GTPases. Biochem. Soc. Trans. 2022, 50, 921–933. 10.1042/BST20211166. [DOI] [PubMed] [Google Scholar]
- Prior I. A.; Lewis P. D.; Mattos C. A Comprehensive Survey of Ras Mutations in Cancer. Cancer Res. 2012, 72, 2457–2467. 10.1158/0008-5472.CAN-11-2612. [DOI] [PMC free article] [PubMed] [Google Scholar]
- Hancock J. F.; Parton R. G. Ras Plasma Membrane Signalling Platforms. Biochem. J. 2005, 389, 1–11. 10.1042/BJ20050231. [DOI] [PMC free article] [PubMed] [Google Scholar]
- Simanshu D. K.; Nissley D. V.; McCormick F. RAS Proteins and Their Regulators in Human Disease. Cell 2017, 170, 17–33. 10.1016/j.cell.2017.06.009. [DOI] [PMC free article] [PubMed] [Google Scholar]
- Chiu V. K.; Bivona T.; Hach A.; Sajous J. B.; Silletti J.; Wiener H.; Johnson R. L.; Cox A. D.; Philips M. R. Ras Signalling on the Endoplasmic Reticulum and the Golgi. Nat. Cell Biol. 2002, 4, 343–350. 10.1038/ncb783. [DOI] [PubMed] [Google Scholar]
- Bondeva T.; Balla A.; Várnai P.; Balla T. Structural Determinants of Ras-Raf Interaction Analyzed in Live Cells. Mol. Biol. Cell 2002, 13, 2323–2333. 10.1091/mbc.e02-01-0019. [DOI] [PMC free article] [PubMed] [Google Scholar]
- Augsten M.; Pusch R.; Biskup C.; Rennert K.; Wittig U.; Beyer K.; Blume A.; Wetzker R.; Friedrich K.; Rubio I. Live-Cell Imaging of Endogenous Ras-GTP Illustrates Predominant Ras Activation at the Plasma Membrane. EMBO Rep. 2006, 7, 46–51. 10.1038/sj.embor.7400560. [DOI] [PMC free article] [PubMed] [Google Scholar]
- Bryan B. A.; Li D.; Wu X.; Liu M. The Rho Family of Small GTPases: Crucial Regulators of Skeletal Myogenesis. Cell. Mol. Life Sci. 2005, 62, 1547–1555. 10.1007/s00018-005-5029-z. [DOI] [PMC free article] [PubMed] [Google Scholar]
- Piekny A. J.; Glotzer M. Anillin Is a Scaffold Protein That Links RhoA, Actin, and Myosin during Cytokinesis. Curr. Biol. 2008, 18, 30–36. 10.1016/j.cub.2007.11.068. [DOI] [PubMed] [Google Scholar]
- Benink H. A.; Bement W. M. Concentric Zones of Active RhoA and Cdc42 around Single Cell Wounds. J. Cell Biol. 2005, 168, 429–439. 10.1083/jcb.200411109. [DOI] [PMC free article] [PubMed] [Google Scholar]
- O’Neill P. R.; Castillo-Badillo J. A.; Meshik X.; Kalyanaraman V.; Melgarejo K.; Gautam N. Membrane Flow Drives an Adhesion-Independent Amoeboid Cell Migration Mode. Dev. Cell 2018, 46, 9. 10.1016/j.devcel.2018.05.029. [DOI] [PMC free article] [PubMed] [Google Scholar]
- Bement W. M.; Leda M.; Moe A. M.; Kita A. M.; Larson M. E.; Golding A. E.; Pfeuti C.; Su K.-C.; Miller A. L.; Goryachev A. B.; et al. Activator-Inhibitor Coupling between Rho Signalling and Actin Assembly Makes the Cell Cortex an Excitable Medium. Nat. Cell Biol. 2015, 17, 1471–1483. 10.1038/ncb3251. [DOI] [PMC free article] [PubMed] [Google Scholar]
- Davenport N. R.; Sonnemann K. J.; Eliceiri K. W.; Bement W. M. Membrane Dynamics during Cellular Wound Repair. Mol. Biol. Cell 2016, 27, 2272–2285. 10.1091/mbc.E16-04-0223. [DOI] [PMC free article] [PubMed] [Google Scholar]
- Graessl M.; Koch J.; Calderon A.; Kamps D.; Banerjee S.; Mazel T.; Schulze N.; Jungkurth J. K.; Patwardhan R.; Solouk D.; et al. An Excitable Rho GTPase Signaling Network Generates Dynamic Subcellular Contraction Patterns. J. Cell Biol. 2017, 216, 4271–4285. 10.1083/jcb.201706052. [DOI] [PMC free article] [PubMed] [Google Scholar]
- Mahlandt E. K.; Arts J. J. G.; van der Meer W. J.; van der Linden F. H.; Tol S.; van Buul J. D.; Gadella T. W. J.; Goedhart J. Visualizing Endogenous Rho Activity with an Improved Localization-Based, Genetically Encoded Biosensor. J. Cell Sci. 2021, 134, jcs258823. 10.1242/jcs.258823. [DOI] [PMC free article] [PubMed] [Google Scholar]
- Kim S. H.; Li Z.; Sacks D. B. E-Cadherin-Mediated Cell-Cell Attachment Activates Cdc42. J. Biol. Chem. 2000, 275, 36999–37005. 10.1074/jbc.M003430200. [DOI] [PubMed] [Google Scholar]
- Kraynov V. S.; Chamberlain C.; Bokoch G. M.; Schwartz M. A.; Slabaugh S.; Hahn K. M. Localized Rac Activation Dynamics Visualized in Living Cells. Science 2000, 290, 333–337. 10.1126/science.290.5490.333. [DOI] [PubMed] [Google Scholar]
- Mochizuki N.; Yamashita S.; Kurokawa K.; Ohba Y.; Nagai T.; Miyawaki A.; Matsuda M. Spatio-Temporal Images of Growth-Factor-Induced Activation of Ras and Rap1. Nature 2001, 411, 1065–1068. 10.1038/35082594. [DOI] [PubMed] [Google Scholar]
- Yoshizaki H.; Ohba Y.; Kurokawa K.; Itoh R. E.; Nakamura T.; Mochizuki N.; Nagashima K.; Matsuda M. Activity of Rho-Family GTPases during Cell Division as Visualized with FRET-Based Probes. J. Cell Biol. 2003, 162, 223–232. 10.1083/jcb.200212049. [DOI] [PMC free article] [PubMed] [Google Scholar]
- Itoh R. E.; Kurokawa K.; Ohba Y.; Yoshizaki H.; Mochizuki N.; Matsuda M. Activation of Rac and Cdc42 Video Imaged by Fluorescent Resonance Energy Transfer-Based Single-Molecule Probes in the Membrane of Living Cells. Mol. Cell. Biol. 2002, 22, 6582–6591. 10.1128/MCB.22.18.6582-6591.2002. [DOI] [PMC free article] [PubMed] [Google Scholar]
- O’Shaughnessy E. C.; Stone O. J.; LaFosse P. K.; Azoitei M. L.; Tsygankov D.; Heddleston J. M.; Legant W. R.; Wittchen E. S.; Burridge K.; Elston T. C.; et al. Software for Lattice Light-Sheet Imaging of FRET Biosensors, Illustrated with a New Rap1 Biosensor. J. Cell Biol. 2019, 218, 3153–3160. 10.1083/jcb.201903019. [DOI] [PMC free article] [PubMed] [Google Scholar]
- Pertz O.; Hodgson L.; Klemke R. L.; Hahn K. M. Spatiotemporal Dynamics of RhoA Activity in Migrating Cells. Nature 2006, 440, 1069–1072. 10.1038/nature04665. [DOI] [PubMed] [Google Scholar]
- Zawistowski J. S.; Sabouri-Ghomi M.; Danuser G.; Hahn K. M.; Hodgson L. A RhoC Biosensor Reveals Differences in the Activation Kinetics of RhoA and RhoC in Migrating Cells. PLoS One 2013, 8, e79877. 10.1371/journal.pone.0079877. [DOI] [PMC free article] [PubMed] [Google Scholar]
- Hanna S.; Miskolci V.; Cox D.; Hodgson L. A New Genetically Encoded Single-Chain Biosensor for Cdc42 Based on FRET. Useful for Live-Cell Imaging. PLoS One 2014, 9, e96469. 10.1371/journal.pone.0096469. [DOI] [PMC free article] [PubMed] [Google Scholar]
- Ng K. Y.; Yin T.; Machida K.; Wu Y. I.; Mayer B. J. Phosphorylation of Dok1 by Abl Family Kinases Inhibits CrkI Transforming Activity. Oncogene 2015, 34, 2650–2659. 10.1038/onc.2014.210. [DOI] [PMC free article] [PubMed] [Google Scholar]
- van Unen J.; Reinhard N. R.; Yin T.; Wu Y. I.; Postma M.; Gadella T. W. J.; Goedhart J. Plasma Membrane Restricted RhoGEF Activity Is Sufficient for RhoA-Mediated Actin Polymerization. Sci. Rep. 2015, 5, 14693. 10.1038/srep14693. [DOI] [PMC free article] [PubMed] [Google Scholar]
- Yasuda R.; Harvey C. D.; Zhong H.; Sobczyk A.; van Aelst L.; Svoboda K. Supersensitive Ras Activation in Dendrites and Spines Revealed by Two-Photon Fluorescence Lifetime Imaging. Nat. Neurosci. 2006, 9, 283–291. 10.1038/nn1635. [DOI] [PubMed] [Google Scholar]
- Murakoshi H.; Shibata A. C. E. ShadowY: A Dark Yellow Fluorescent Protein for FLIM-Based FRET Measurement. Sci. Rep. 2017, 7, 6791. 10.1038/s41598-017-07002-4. [DOI] [PMC free article] [PubMed] [Google Scholar]
- Laviv T.; Kim B. B.; Chu J.; Lam A. J.; Lin M. Z.; Yasuda R. Simultaneous Dual-Color Fluorescence Lifetime Imaging with Novel Red-Shifted Fluorescent Proteins. Nat. Methods 2016, 13, 989–992. 10.1038/nmeth.4046. [DOI] [PMC free article] [PubMed] [Google Scholar]
- Weeks R.; Zhou X.; Yuan T. L.; Zhang J. Fluorescent Biosensor for Measuring Ras Activity in Living Cells. J. Am. Chem. Soc. 2022, 144, 17432–17440. 10.1021/jacs.2c05203. [DOI] [PMC free article] [PubMed] [Google Scholar]
- Kim J.; Lee S.; Jung K.; Oh W. C.; Kim N.; Son S.; Jo Y.; Kwon H.-B.; Heo W. D. Intensiometric Biosensors Visualize the Activity of Multiple Small GTPases in Vivo. Nat. Commun. 2019, 10, 211. 10.1038/s41467-018-08217-3. [DOI] [PMC free article] [PubMed] [Google Scholar]
- Cioni J.-M.; Lin J. Q.; Holtermann A. V.; Koppers M.; Jakobs M. A.H.; Azizi A.; Turner-Bridger B.; Shigeoka T.; Franze K.; Harris W. A.; Holt C. E. Late Endosomes Act as MRNA Translation Platforms and Sustain Mitochondria in Axons. Cell 2019, 176, 56. 10.1016/j.cell.2018.11.030. [DOI] [PMC free article] [PubMed] [Google Scholar]
- Tulpule A.; Guan J.; Neel D. S.; Allegakoen H. R.; Lin Y. P.; Brown D.; Chou Y.-T.; Heslin A.; Chatterjee N.; Perati S.; Menon S.; Nguyen T. A.; Debnath J.; Ramirez A. D.; Shi X.; Yang B.; Feng S.; Makhija S.; Huang B.; Bivona T. G. Kinase-Mediated RAS Signaling via Membraneless Cytoplasmic Protein Granules. Cell 2021, 184, 2649. 10.1016/j.cell.2021.03.031. [DOI] [PMC free article] [PubMed] [Google Scholar]
- Ramazi S.; Zahiri J. Posttranslational Modifications in Proteins: Resources, Tools and Prediction Methods. Database (Oxford) 2021, 2021, baab012 10.1093/database/baab012. [DOI] [PMC free article] [PubMed] [Google Scholar]
- An H. J.; Froehlich J. W.; Lebrilla C. B. Determination of Glycosylation Sites and Site-Specific Heterogeneity in Glycoproteins. Curr. Opin. Chem. Biol. 2009, 13, 421–426. 10.1016/j.cbpa.2009.07.022. [DOI] [PMC free article] [PubMed] [Google Scholar]
- Reily C.; Stewart T. J.; Renfrow M. B.; Novak J. Glycosylation in Health and Disease. Nat. Rev. Nephrol. 2019, 15, 346–366. 10.1038/s41581-019-0129-4. [DOI] [PMC free article] [PubMed] [Google Scholar]
- Eklund E. A.; Freeze H. H. The Congenital Disorders of Glycosylation: A Multifaceted Group of Syndromes. NeuroRx 2006, 3, 254–263. 10.1016/j.nurx.2006.01.012. [DOI] [PMC free article] [PubMed] [Google Scholar]
- Carrillo L. D.; Krishnamoorthy L.; Mahal L. K. A Cellular FRET-Based Sensor for Beta-O-GlcNAc, a Dynamic Carbohydrate Modification Involved in Signaling. J. Am. Chem. Soc. 2006, 128, 14768–14769. 10.1021/ja065835+. [DOI] [PubMed] [Google Scholar]
- Losfeld M.-E.; Soncin F.; Ng B. G.; Singec I.; Freeze H. H. A Sensitive Green Fluorescent Protein Biomarker of N-Glycosylation Site Occupancy. FASEB J. 2012, 26, 4210–4217. 10.1096/fj.12-211656. [DOI] [PMC free article] [PubMed] [Google Scholar]
- Contessa J. N.; Bhojani M. S.; Freeze H. H.; Ross B. D.; Rehemtulla A.; Lawrence T. S. Molecular Imaging of N-Linked Glycosylation Suggests Glycan Biosynthesis Is a Novel Target for Cancer Therapy. Clin. Cancer Res. 2010, 16, 3205–3214. 10.1158/1078-0432.CCR-09-3331. [DOI] [PMC free article] [PubMed] [Google Scholar]
- Li Z.; Zhang J.; Ai H.-W. Genetically Encoded Green Fluorescent Biosensors for Monitoring UDP-GlcNAc in Live Cells. ACS Cent. Sci. 2021, 7, 1763–1770. 10.1021/acscentsci.1c00745. [DOI] [PMC free article] [PubMed] [Google Scholar]
- Zhang J.; Li Z.; Pang Y.; Fan Y.; Ai H.-W. Genetically Encoded Boronolectin as a Specific Red Fluorescent UDP-GlcNAc Biosensor. ACS Sens. 2023, 8, 2996–3003. 10.1021/acssensors.3c00409. [DOI] [PMC free article] [PubMed] [Google Scholar]
- Ganesan S.; Ameer-Beg S. M.; Ng T. T. C.; Vojnovic B.; Wouters F. S. A Dark Yellow Fluorescent Protein (YFP)-Based Resonance Energy-Accepting Chromoprotein (REACh) for Förster Resonance Energy Transfer with GFP. Proc. Natl. Acad. Sci. U.S.A. 2006, 103, 4089–4094. 10.1073/pnas.0509922103. [DOI] [PMC free article] [PubMed] [Google Scholar]
- Paul D.; Kales S. C.; Cornwell J. A.; Afifi M. M.; Rai G.; Zakharov A.; Simeonov A.; Cappell S. D. Revealing β-TrCP Activity Dynamics in Live Cells with a Genetically Encoded Biosensor. Nat. Commun. 2022, 13, 6364. 10.1038/s41467-022-33762-3. [DOI] [PMC free article] [PubMed] [Google Scholar]
- Millán-Zambrano G.; Burton A.; Bannister A. J.; Schneider R. Histone Post-Translational Modifications - Cause and Consequence of Genome Function. Nat. Rev. Genet. 2022, 23, 563–580. 10.1038/s41576-022-00468-7. [DOI] [PubMed] [Google Scholar]
- Lawrence M.; Daujat S.; Schneider R. Lateral Thinking: How Histone Modifications Regulate Gene Expression. Trends Genet. 2016, 32, 42–56. 10.1016/j.tig.2015.10.007. [DOI] [PubMed] [Google Scholar]
- Boninsegna A.; D’Amelio G.; Calzavara M.; Bertolini M. Effect of Swimming in Thermal Water on Skeletal Muscle, Liver and Heart Glycogen. Clin Physiol Biochem 1990, 8, 318–321. [PubMed] [Google Scholar]
- Miller J. L.; Grant P. A. The Role of DNA Methylation and Histone Modifications in Transcriptional Regulation in Humans. Subcell. Biochem. 2013, 61, 289–317. 10.1007/978-94-007-4525-4_13. [DOI] [PMC free article] [PubMed] [Google Scholar]
- Lin C.-W.; Jao C. Y.; Ting A. Y. Genetically Encoded Fluorescent Reporters of Histone Methylation in Living Cells. J. Am. Chem. Soc. 2004, 126, 5982–5983. 10.1021/ja038854h. [DOI] [PubMed] [Google Scholar]
- Peng Q.; Lu S.; Shi Y.; Pan Y.; Limsakul P.; Chernov A. V.; Qiu J.; Chai X.; Shi Y.; Wang P.; Ji Y.; Li Y.-S. J.; Strongin A. Y.; Verkhusha V. V.; Izpisua Belmonte J. C.; Ren B.; Wang Y.; Chien S.; Wang Y. Coordinated Histone Modifications and Chromatin Reorganization in a Single Cell Revealed by FRET Biosensors. Proc. Natl. Acad. Sci. U.S.A. 2018, 115, E11681. 10.1073/pnas.1811818115. [DOI] [PMC free article] [PubMed] [Google Scholar]
- Lungu C.; Pinter S.; Broche J.; Rathert P.; Jeltsch A. Modular Fluorescence Complementation Sensors for Live Cell Detection of Epigenetic Signals at Endogenous Genomic Sites. Nat. Commun. 2017, 8, 649. 10.1038/s41467-017-00457-z. [DOI] [PMC free article] [PubMed] [Google Scholar]
- Eberharter A.; Becker P. B. Histone Acetylation: A Switch between Repressive and Permissive Chromatin. Second in Review Series on Chromatin Dynamics. EMBO Rep. 2002, 3, 224–229. 10.1093/embo-reports/kvf053. [DOI] [PMC free article] [PubMed] [Google Scholar]
- Sasaki K.; Ito T.; Nishino N.; Khochbin S.; Yoshida M. Real-Time Imaging of Histone H4 Hyperacetylation in Living Cells. Proc. Natl. Acad. Sci. U.S.A. 2009, 106, 16257–16262. 10.1073/pnas.0902150106. [DOI] [PMC free article] [PubMed] [Google Scholar]
- Dancy B. M.; Crump N. T.; Peterson D. J.; Mukherjee C.; Bowers E. M.; Ahn Y.-H.; Yoshida M.; Zhang J.; Mahadevan L. C.; Meyers D. J.; et al. Live-Cell Studies of P300/CBP Histone Acetyltransferase Activity and Inhibition. Chembiochem 2012, 13, 2113–2121. 10.1002/cbic.201200381. [DOI] [PMC free article] [PubMed] [Google Scholar]
- Sanchez O. F.; Mendonca A.; Carneiro A. D.; Yuan C. Engineering Recombinant Protein Sensors for Quantifying Histone Acetylation. ACS Sens. 2017, 2, 426–435. 10.1021/acssensors.7b00026. [DOI] [PubMed] [Google Scholar]
- Sato Y.; Mukai M.; Ueda J.; Muraki M.; Stasevich T. J.; Horikoshi N.; Kujirai T.; Kita H.; Kimura T.; Hira S.; Okada Y.; Hayashi-Takanaka Y.; Obuse C.; Kurumizaka H.; Kawahara A.; Yamagata K.; Nozaki N.; Kimura H. Genetically Encoded System to Track Histone Modification in Vivo. Sci. Rep. 2013, 3, 2436. 10.1038/srep02436. [DOI] [PMC free article] [PubMed] [Google Scholar]
- Najumudeen A. K.; Köhnke M.; Solman M.; Alexandrov K.; Abankwa D. Cellular FRET-Biosensors to Detect Membrane Targeting Inhibitors of N-Myristoylated Proteins. PLoS One 2013, 8, e66425. 10.1371/journal.pone.0066425. [DOI] [PMC free article] [PubMed] [Google Scholar]
- Sakaue-Sawano A.; Kurokawa H.; Morimura T.; Hanyu A.; Hama H.; Osawa H.; Kashiwagi S.; Fukami K.; Miyata T.; Miyoshi H.; et al. Visualizing Spatiotemporal Dynamics of Multicellular Cell-Cycle Progression. Cell 2008, 132, 487–498. 10.1016/j.cell.2007.12.033. [DOI] [PubMed] [Google Scholar]
- Zambon A. C.; Hsu T.; Kim S. E.; Klinck M.; Stowe J.; Henderson L. M.; Singer D.; Patam L.; Lim C.; McCulloch A. D.; et al. Methods and Sensors for Functional Genomic Studies of Cell-Cycle Transitions in Single Cells. Physiol. Genomics 2020, 52, 468–477. 10.1152/physiolgenomics.00065.2020. [DOI] [PMC free article] [PubMed] [Google Scholar]
- Desvoyes B.; Arana-Echarri A.; Barea M. D.; Gutierrez C. A Comprehensive Fluorescent Sensor for Spatiotemporal Cell Cycle Analysis in Arabidopsis. Nat. Plants 2020, 6, 1330–1334. 10.1038/s41477-020-00770-4. [DOI] [PubMed] [Google Scholar]
- De Souza C.; Madden J.; Koestler D. C.; Minn D.; Montoya D. J.; Minn K.; Raetz A. G.; Zhu Z.; Xiao W.-W.; Tahmassebi N.; et al. Effect of the P53 P72R Polymorphism on Mutant TP53 Allele Selection in Human Cancer. J. Natl. Cancer Inst. 2021, 113, 1246–1257. 10.1093/jnci/djab019. [DOI] [PMC free article] [PubMed] [Google Scholar]
- Shirmanova M. V.; Gorbachev D. A.; Sarkisyan K. S.; Parnes A. P.; Gavrina A. I.; Polozova A. V.; Kovaleva T. F.; Snopova L. B.; Dudenkova V. V.; Zagaynova E. V.; et al. FUCCI-Red: A Single-Color Cell Cycle Indicator for Fluorescence Lifetime Imaging. Cell. Mol. Life Sci. 2021, 78, 3467–3476. 10.1007/s00018-020-03712-7. [DOI] [PMC free article] [PubMed] [Google Scholar]
- Kim C. K.; Sanchez M. I.; Hoerbelt P.; Fenno L. E.; Malenka R. C.; Deisseroth K.; Ting A. Y. A Molecular Calcium Integrator Reveals a Striatal Cell Type Driving Aversion. Cell 2020, 183, 2003. 10.1016/j.cell.2020.11.015. [DOI] [PMC free article] [PubMed] [Google Scholar]
- Muller A.; Joseph V.; Slesinger P. A.; Kleinfeld D. Cell-Based Reporters Reveal in Vivo Dynamics of Dopamine and Norepinephrine Release in Murine Cortex. Nat. Methods 2014, 11, 1245–1252. 10.1038/nmeth.3151. [DOI] [PMC free article] [PubMed] [Google Scholar]
- Zerjatke T.; Gak I. A.; Kirova D.; Fuhrmann M.; Daniel K.; Gonciarz M.; Müller D.; Glauche I.; Mansfeld J. Quantitative Cell Cycle Analysis Based on an Endogenous All-in-One Reporter for Cell Tracking and Classification. Cell Rep. 2017, 19, 1953–1966. 10.1016/j.celrep.2017.05.022. [DOI] [PMC free article] [PubMed] [Google Scholar]
- Deneke V. E.; Melbinger A.; Vergassola M.; Di Talia S. Waves of Cdk1 Activity in S Phase Synchronize the Cell Cycle in Drosophila Embryos. Dev. Cell 2016, 38, 399–412. 10.1016/j.devcel.2016.07.023. [DOI] [PMC free article] [PubMed] [Google Scholar]
- Kohrman A. Q.; Kim-Yip R. P.; Posfai E. Imaging Developmental Cell Cycles. Biophys. J. 2021, 120, 4149–4161. 10.1016/j.bpj.2021.04.035. [DOI] [PMC free article] [PubMed] [Google Scholar]
- Gavet O.; Pines J. Progressive Activation of CyclinB1-Cdk1 Coordinates Entry to Mitosis. Dev. Cell 2010, 18, 533–543. 10.1016/j.devcel.2010.02.013. [DOI] [PMC free article] [PubMed] [Google Scholar]
- Prével C.; Pellerano M.; González-Vera J. A.; Henri P.; Meunier L.; Vollaire J.; Josserand V.; Morris M. C. Fluorescent Peptide Biosensor for Monitoring CDK4/Cyclin D Kinase Activity in Melanoma Cell Extracts, Mouse Xenografts and Skin Biopsies. Biosens. Bioelectron. 2016, 85, 371–380. 10.1016/j.bios.2016.04.050. [DOI] [PubMed] [Google Scholar]
- Adikes R. C; Kohrman A. Q; Martinez M. A Q; Palmisano N. J; Smith J. J; Medwig-Kinney T. N; Min M.; Sallee M. D; Ahmed O. B; Kim N.; Liu S.; Morabito R. D; Weeks N.; Zhao Q.; Zhang W.; Feldman J. L; Barkoulas M.; Pani A. M; Spencer S. L; Martin B. L; Matus D. Q Visualizing the Metazoan Proliferation-Quiescence Decision in Vivo. Elife 2020, 9, e63265. 10.7554/eLife.63265. [DOI] [PMC free article] [PubMed] [Google Scholar]
- Taïeb H. M.; Bertinetti L.; Robinson T.; Cipitria A. FUCCItrack: An All-in-One Software for Single Cell Tracking and Cell Cycle Analysis. PLoS One 2022, 17, e0268297 10.1371/journal.pone.0268297. [DOI] [PMC free article] [PubMed] [Google Scholar]
- Ghannoum S.; Antos K.; Leoncio Netto W.; Gomes C.; Köhn-Luque A.; Farhan H. CellMAPtracer: A User-Friendly Tracking Tool for Long-Term Migratory and Proliferating Cells Associated with FUCCI Systems. Cells 2021, 10, 469. 10.3390/cells10020469. [DOI] [PMC free article] [PubMed] [Google Scholar]
- Tsien R. Y. Very Long-Term Memories May Be Stored in the Pattern of Holes in the Perineuronal Net. Proc. Natl. Acad. Sci. U.S.A. 2013, 110, 12456–12461. 10.1073/pnas.1310158110. [DOI] [PMC free article] [PubMed] [Google Scholar]
- Wang W.; Wildes C. P.; Pattarabanjird T.; Sanchez M. I.; Glober G. F.; Matthews G. A.; Tye K. M.; Ting A. Y. A Light- and Calcium-Gated Transcription Factor for Imaging and Manipulating Activated Neurons. Nat. Biotechnol. 2017, 35, 864–871. 10.1038/nbt.3909. [DOI] [PMC free article] [PubMed] [Google Scholar]
- Lee D.; Hyun J. H.; Jung K.; Hannan P.; Kwon H.-B. A Calcium- and Light-Gated Switch to Induce Gene Expression in Activated Neurons. Nat. Biotechnol. 2017, 35, 858–863. 10.1038/nbt.3902. [DOI] [PubMed] [Google Scholar]
- Lee S.-Y.; Cheah J. S.; Zhao B.; Xu C.; Roh H.; Kim C. K.; Cho K. F.; Udeshi N. D.; Carr S. A.; Ting A. Y. Engineered Allostery in Light-Regulated LOV-Turbo Enables Precise Spatiotemporal Control of Proximity Labeling in Living Cells. Nat. Methods 2023, 20, 908–917. 10.1038/s41592-023-01880-5. [DOI] [PMC free article] [PubMed] [Google Scholar]
- Cho K. F.; Gillespie S. M.; Kalogriopoulos N. A.; Quezada M. A.; Jacko M.; Monje M.; Ting A. Y. A Light-Gated Transcriptional Recorder for Detecting Cell-Cell Contacts. Elife 2022, 11, e70881. 10.7554/eLife.70881. [DOI] [PMC free article] [PubMed] [Google Scholar]
- Rogers R. D. The Roles of Dopamine and Serotonin in Decision Making: Evidence from Pharmacological Experiments in Humans. Neuropsychopharmacology 2011, 36, 114–132. 10.1038/npp.2010.165. [DOI] [PMC free article] [PubMed] [Google Scholar]
- Miranda M. I.Changes in Neurotransmitter Extracellular Levels during Memory Formation. In Neural Plasticity and Memory: From Genes to Brain Imaging; Frontiers in Neuroscience; Bermúdez-Rattoni F., Ed.; CRC Press/Taylor & Francis: Boca Raton, FL, 2007. [PubMed] [Google Scholar]
- Nguyen Q.-T.; Schroeder L. F.; Mank M.; Muller A.; Taylor P.; Griesbeck O.; Kleinfeld D. An in Vivo Biosensor for Neurotransmitter Release and in Situ Receptor Activity. Nat. Neurosci. 2010, 13, 127–132. 10.1038/nn.2469. [DOI] [PMC free article] [PubMed] [Google Scholar]
- Lee D.; Creed M.; Jung K.; Stefanelli T.; Wendler D. J.; Oh W. C.; Mignocchi N. L.; Lüscher C.; Kwon H.-B. Temporally Precise Labeling and Control of Neuromodulatory Circuits in the Mammalian Brain. Nat. Methods 2017, 14, 495–503. 10.1038/nmeth.4234. [DOI] [PubMed] [Google Scholar]
- McMahon S. M.; Jackson M. B. An Inconvenient Truth: Calcium Sensors Are Calcium Buffers. Trends Neurosci. 2018, 41, 880–884. 10.1016/j.tins.2018.09.005. [DOI] [PMC free article] [PubMed] [Google Scholar]
- Steinmetz N. A.; Buetfering C.; Lecoq J.; Lee C. R.; Peters A. J.; Jacobs E. A. K.; Coen P.; Ollerenshaw D. R.; Valley M. T.; de Vries S. E. J.; Garrett M.; Zhuang J.; Groblewski P. A.; Manavi S.; Miles J.; White C.; Lee E.; Griffin F.; Larkin J. D.; Roll K.; Cross S.; Nguyen T. V.; Larsen R.; Pendergraft J.; Daigle T.; Tasic B.; Thompson C. L.; Waters J.; Olsen S.; Margolis D. J.; Zeng H.; Hausser M.; Carandini M.; Harris K. D. Aberrant Cortical Activity in Multiple GCaMP6-Expressing Transgenic Mouse Lines. eNeuro 2017, 4, 0207-17.2017. 10.1523/ENEURO.0207-17.2017. [DOI] [PMC free article] [PubMed] [Google Scholar]
- Bowman A. J.; Huang C.; Schnitzer M. J.; Kasevich M. A. Wide-Field Fluorescence Lifetime Imaging of Neuron Spiking and Subthreshold Activity in Vivo. Science 2023, 380, 1270–1275. 10.1126/science.adf9725. [DOI] [PMC free article] [PubMed] [Google Scholar]