

Abstract
Life stress can shorten lifespan and increase risk for aging-related diseases, but the biology underlying this phenomenon remains unclear. We assessed the effect of chronic stress on cellular senescence — a hallmark of aging. Exposure to restraint stress, a psychological non-social stress model, increased p21Cip1 exclusively in the brains of male, but not female mice, and in a p16Ink4a-independent manner. Conversely, exposure to chronic subordination stress (CSS; males only were tested) increased key senescent cell (SNC) markers in peripheral blood mononuclear cells, adipose tissue and brain, in a p16Ink4a-dependent manner. p16Ink4a-positive cells in the brain of CSS-exposed mice were primarily hippocampal and cortical neurons with evidence of DNA damage that could be reduced by p16Ink4a cell clearance. Clearance of p16Ink4a-positive cells was not sufficient to ameliorate the adverse effects of social stress on measured metrics of healthspan. Overall, our findings indicate that social stress induces an organ-specific and p16Ink4a-dependent accumulation SNCs, illuminating a fundamental way by which the social environment can contribute to aging.
Keywords: Psychosocial stress, psychological stress, social stress, brain, peripheral blood mononuclear cells, adipose tissue, senescence, neurons, aging, DNA damage, inflammaging
Introduction
Life stress is associated with numerous aging-related diseases including Alzheimer’s disease, vascular dementia, type 2 diabetes, and atherosclerosis1–5. Although stress is believed to have a negative impact on health and to accelerate biological aging6–10, the nature of this phenomenon is poorly characterized. A complicating factor in human and preclinical stress research is the variability of stressors and stress responses11,12. The range of stressor types and intensities, as well as individual coping ability are likely key determinants of the relationship between stress and biological aging. A revised stress terminology posits that “true” stress is only present in conditions characterized by unpredictability, uncontrollability, and real or perceived life threat11. Under this definition, social stressors are implicated as particularly potent drivers of disease5,11,13,14. However, how stress affects aging processes and life expectancy is still largely uncharacterized.
A growing body of correlative evidence points to an association between chronic life stress and markers of cellular senescence15–20. Senescent cells (SNCs) are implicated in a wide range of physiological processes and aging-related diseases21–28. Although there remains no consensus on the definition of a SNC, and no single marker (or combination) can be taken as absolute evidence of SCNs identity, commonly accepted markers include p16Ink4a (encoded by CDKN2A; Cdkn2a), p21Cip1 (encoded by CDKN1A; Cdkn1a), and senescence-associated β-galactosidase (SA-β-Gal)29,30. Additionally, SNCs secrete a collection of factors collectively termed the Senescence Associated Secretory Phenotype (SASP)31. These include pro-inflammatory cytokines, growth promoting, and remodeling factors that can alter the tissue microenvironment32. Cell cycle arrest, the central feature of senescence, can be initiated by two different cyclin-dependent kinase inhibitors p16Ink4a, and p21Cip1 33. p21Cip1 is activated by a signaling cascade beginning with the DNA damage response (DDR), which is also required for SNCs to develop a SASP31. p21Cip1-induced senescence is generally escapable, acting as a temporary recess from the cell cycle until DNA damage can be repaired. However, if p21-induced arrest is sustained, p16Ink4a will also become expressed, resulting in permanent cell-cycle arrest. p16Ink4a can also be directly induced by other factors, including oncogenic signaling34,35. Physiologically, SNCs can exert beneficial effects in wound healing, maintenance of blood-tissue barriers and embryonic development21,22,28,36, but they can also contribute to chronic sterile inflammation — a hallmark of aging and aging-related diseases32,37. SNCs have been shown to actively drive aging-related diseases in mouse models of atherosclerosis, osteoarthritis, and Alzheimer’s disease23–27, and have been detected in aging-associated diseases in humans26,26,38,39. Overall, their role in numerous diseases makes SNCs an alluring target for therapeutic intervention40–42.
The emerging list of diseases driven by senescence has remarkable overlap with that associated with chronic stress5,29. This, together with evidence that stress promotes senescence initiators like oxidative damage and telomere erosion, supports the hypothesis that chronic stress may accelerate accumulation of SNCs15–20. However, up to this point, this phenomenon has not been comprehensively demonstrated. Here, we characterize the impact of two contrasting models of chronic stress in mice on SNC accumulation: psychosocial - chronic subordination stress (CSS)20; and psychological - chronic restraint stress (CRS)43. In CRS, mice are restrained in conical tubes for 3 hours/day for 4 weeks. CRS elicits strong neuroendocrine responses, increased anxiety- and depression-like behavior, a general catabolic effect, and neurological changes43. In the CSS paradigm, the experimental mouse is subordinated daily by an aggressive, dominant mouse; the two mice are cohoused separated by a perforated partition, maintaining a constant perceived threat to the experimental mouse. CSS elicits profound neuroendocrine changes, anxiety- and depression-like behavior, hyperphagia, obesity, and is the only rodent stress model demonstrated to cause early onset of organ pathologies and to shorten lifespan6,20,44–47. We also characterized the effect of stress-induced accumulation of p16Ink4a positive cells using two independent models, the p16–3MR model21 and the p16-EF/CreERT2;Ai1448. Finally, we performed pharmacogenomic clearance of p16Ink4a expressing cells using the p16–3MR model21 on healthspan measures in stress exposed mice.
Our data demonstrate that CSS induces a p16Ink4a-dependent increase in key senescence markers in select organs in male mice, while CRS increases p21Cip1 exclusively in the brain of male but not female mice, and in a p16Ink4a-independent manner. We found the majority of CSS-induced p16Ink4a-positive SNCs in the brain to be hippocampal and cortical neurons, which also showed a pronounced increase in DNA damage markers. While clearance of p16Ink4a-positive cells effectively reduced SNC markers and DNA damage, it did not ameliorate the adverse effects of social stress on measured metrics of healthspan.
CSS, but not CRS, upregulates p16Ink4a expression in PBMCs in male mice
Previous work suggests a link between chronic stress and elevations in markers of cellular senescence9. However, the time course and the tissue and cell-type specificity of this effect have not been characterized. It is also unclear what types of stressors may drive senescence, prompting us to compare the extent to which social and non-social psychological stress drive cells into a senescent state. We exposed male mice to one of two well characterized models of chronic stress — CSS or CRS (Figure 1A). Female mice were tested in the CRS (see below), while the CSS resulted unsuitable to test our hypothesis (see Supplementary Note for further details).
Figure 1. Effect of Chronic Subordination Stress (CSS) or Chronic Restraint Stress (CRS) on senescent cells (SNCs) markers and senescence associated secretory phenotype (SASP) in peripheral blood mononuclear cells (PBMCs) and peripheral organs.

A) Experimental design/timeline. B) Relative p16Ink4a mRNA transcript abundance over time. CSS-exposed mice have a significant increase in p16Ink4a expression over the course of the stress experiment. 2-way repeated measures mixed effects model (REML). Group: p=0.035, Time: p=0.093, Group x Time: p=0.845 Tukey post hoc. Main effect of group p=0.035. control (ctrl) N=6; CSS N=11; CRS N=6 C) Relative p16Ink4a transcript abundance in PBMCs) at 20 months of age. CSS-exposed mice have significantly higher p16Ink4a expression relative to singly housed controls (p<0.0001). Unpaired 2-sided t test. Ctrl N=12; CSS N=15 D) Relative p16Ink4a transcript abundance in PBMCs at 26 months of age. CSS-exposed mice have significantly higher p16Ink4a expression relative to singly housed controls (p<0.0001). Unpaired 2-sided t test. Ctrl N=8; CSS N= 4. E) PBMC p16Ink4a expression in mice surviving to 26 months of age. CSS-exposed mice have a significant increase in p16Ink4a expression in this time frame (p<0.0001) while control mice do not. 2-way repeated measures ANOVA Group: p<0.0001, Time: p=0.0002, Group x Time: p=0.0003. Sidak’s multiple comparisons test. Ctrl N=8; CSS N=4. Data points represent group mean. Error bars represent standard error of the mean (SEM).
In both models, we evaluated the temporal dynamic of stress induced SNC accumulation by measuring p16Ink4a mRNA expression in peripheral blood mononuclear cells (PBMCs) over time. The assessment of PBMCs was used as a non-terminal option, and because p16Ink4a mRNA in PBMCs increases with age and in response to stress in humans19,49. CSS, but not CRS caused a time-dependent increase in p16Ink4a transcript in PBMCs, which was first noticeable 4 weeks from the initiation of the CSS procedure (Figure 1B). We performed a complete blood cell count 7 weeks after starting CSS/CRS and found no change in blood cell type composition (Supplementary Table 1; Extended Data Figure 1), suggesting that the increase in p16Ink4a was not related to changes in relative cell type abundance. The CSS-mediated increase in p16Ink4a was sustained over the entire duration of the experiment (Figure 1B). Conversely, CRS had no impact on p16Ink4a expression in PBMCs at any time point analyzed (Figure 1B). Since CSS induced a sustained increase in p16Ink4a in PBMCs, we repeated the same sampling protocol in an independent cohort of mice that had undergone the same CSS + lifelong sensory contact paradigm20 (Figure 1A, Experiment 2). At 20 months of age, CSS-exposed mice had a seven-fold increase in PBMC p16Ink4a expression over age-matched controls (p<0.0001; Figure 1C). Moreover, the group differences in p16Ink4a continued to widen over time, such that by 26 months of age, the CSS group had 12-fold higher p16Ink4a transcript levels (p<0.0001; Figure 1D). In this window between 20 and 26 months, surviving CSS mice manifested a significant increase in p16Ink4a expression while control mice did not (p<0.0001; Figure 1E).
CSS induces senescence markers in the brains of male mice via a p16Ink4a-dependent mechanism
Having established that 4 weeks of CSS was sufficient to increase senescence markers in PBMCs, we next sought to determine the extent to which this might also occur in other organs. Senescence-associated β-galactosidase staining (SA β-gal) is an established biomarker for cellular senescence, and its activity correlates with increased expression of other senescence markers, such as p16Ink4a, in multiple organs50. Mice subjected to 4 weeks of CSS had significantly more SA β-gal staining in the subcutaneous white adipose tissue (scWAT) than controls (Extended Data Figure 2A). White adipose tissue is known to be particularly sensitive to senescence51, and previous work from our lab and others indicates that CSS can alter adipose tissue function47. In contrast, there was no significant change in SA β-gal staining in the liver, kidney, or the brain (Extended Data Figure 2B–D). However the result in the brain should be considered with caution because SA β-gal is not a reliable marker for neuronal senescence 52.
Next, we expanded our assessment to a broader panel of tissues and sought to determine whether changes to other senescence markers were dependent on p16Ink4a expression. We took advantage of the selective p16Ink4a positive cell ablation mechanism inherent to the p16–3MR mouse line21 to determine whether removal of p16Ink4a -positive cells would also impact the expression of other senescence and SASP markers. In the p16–3MR model, the p16Ink4a promoter drives expression of a synthetic Renilla luciferase, a monomeric red fluorescent protein (mRFP) as well as a viral thymidine kinase, that unlike the mammalian thymidine kinase, has a high affinity for the antiviral drug ganciclovir (GCV). When phosphorylated, GCV is converted into a DNA chain terminator, causing cell death and selective clearance p16Ink4a positive SNCs21. In this study, the mRFP and the cell clearing function conferred by the HSV-1TK+GCV only were used, while bioluminescence conferred by Renilla luciferase was not investigated. Control and CSS-exposed mice were dosed with two rounds of GCV injections, or an equal volume of vehicle (Figure 2A) based on established protocol21.
Figure 2. Effect of Chronic Subordination Stress (CSS) or Chronic Restraint Stress (CRS) on senescent cells (SNCs) markers and senescence associated secretory phenotype (SASP) in the hippocampus and cortex.
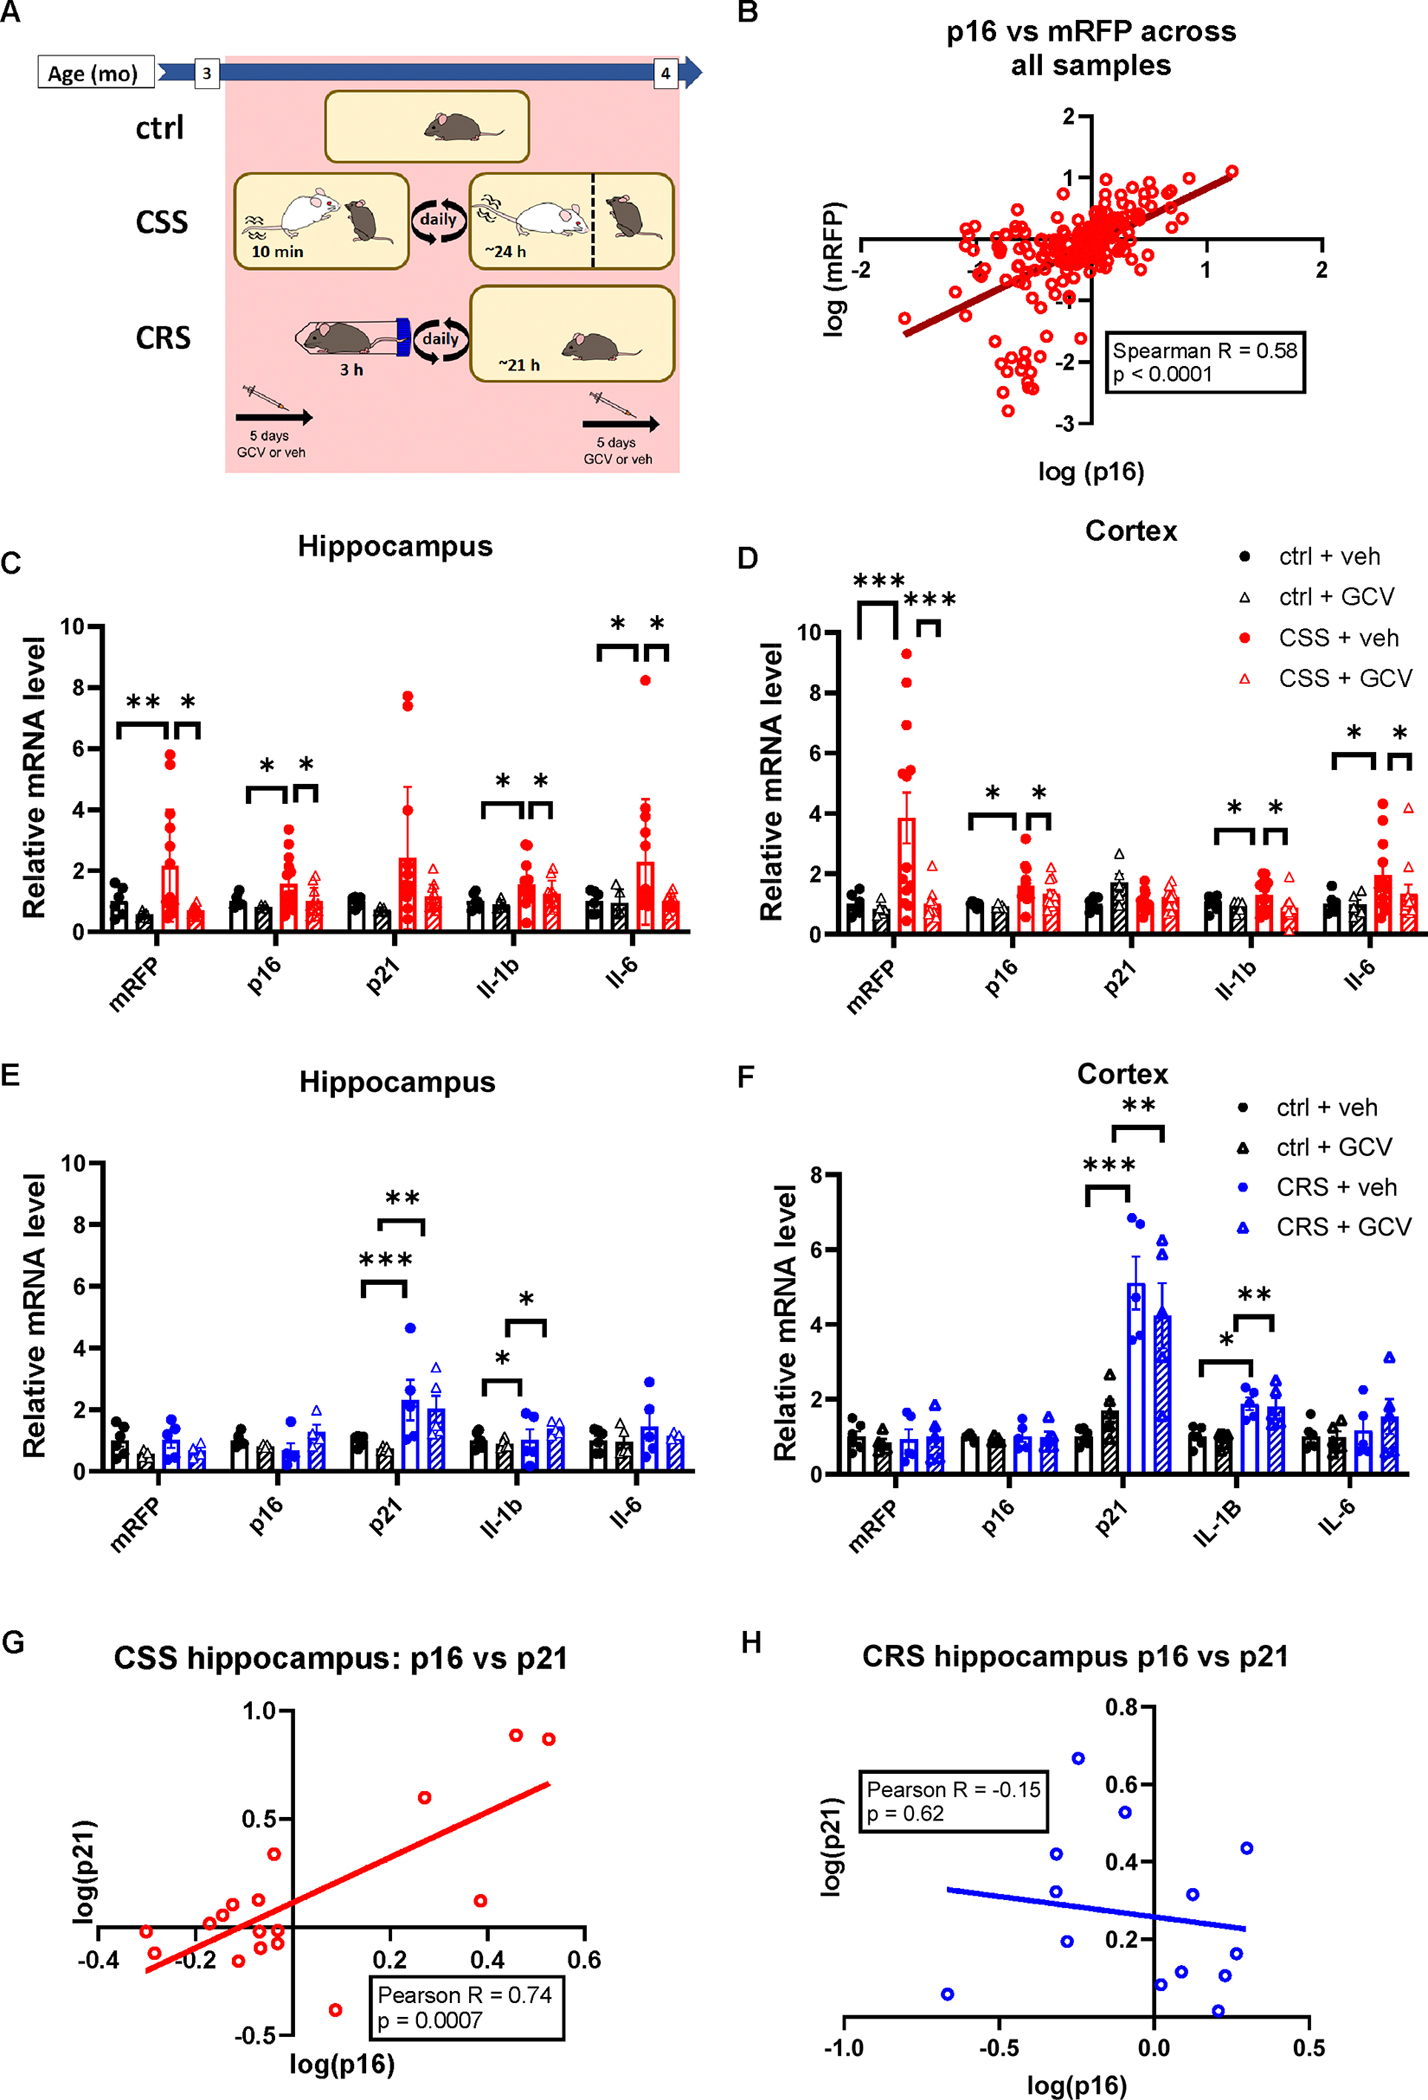
A) Illustration of experimental design. B) There is a significant correlation between p16Ink4a and mRFP expression across all samples and tissues analyzed. Spearman correlation coefficient r=0.68, p<0.0001. C) Expression of senescence and SASP genes in the hippocampus of control and CSS-exposed mice in the presence or absence of ganciclovir (GCV). D) Expression of senescence and SASP genes in the hippocampus of control and CRS-exposed mice in the presence or absence of ganciclovir (GCV). E) Expression of senescence and SASP genes in the cortex of control and CSS-exposed mice in the presence or absence of ganciclovir (GCV). F) Expression of senescence and SASP genes in the cortex of control and restraint-exposed mice in the presence or absence of ganciclovir (GCV). For statistical details C-F, see Supplementary Table 2. G) There is a significant correlation between p16Ink4a and p21Cip1 expression in the hippocampus of CSS-exposed mice. Pearson’s correlation coefficient R=0.74, p<0.0001). H) There is not a significant correlation between p16Ink4a and p21Cip1 transcript levels in the hippocampus of CRS exposed mice. Pearson’s correlation coefficient R=−0.62. p= 0.3979. Ctrl+veh N=6; ctrl+GCV N=5; CSS+veh N=14; CSS+GCV N=11; CRS+veh N=9; CRS+GCV N=5. * indicates p<0.05, ** indicates p<0.01 *** indicates p<0.001. Histogram bars and X/Y data points represent group mean. Shaded areas represent GCV treatment groups. Error bars represent standard error of the mean (SEM).
First, we used RNAscope fluorescent in situ hybridization to investigate which brain areas might be sensitive to SNC accumulation. Visual inspection of the whole brains found the somatosensory cortex, orbitofrontal cortex, and hippocampus to have pronounced expression of p16Ink4a and p21Cip1; however, this was not true of other stress-sensitive regions12 such as the amygdala, paraventricular nucleus, bed nucleus of the stria terminalis, or locus coeruleus (Extended Data Figure 3). Next, we used RT-qPCR to measure the abundance of key senescence and SASP genes in a panel of tissues — cortex, hippocampus, kidney, liver, lung, and scWAT. Across all organs, mRFP expression increased linearly with p16Ink4a, indicating specific transgene expression (Spearman R=0.58; p<0.0001; Figure 2B). We found the brain to be the most sensitive organ to CSS-induced changes in senescence markers with no significant changes in the peripheral tissues analyzed (Extended Data Figure 4; Supplementary Table 2). The hippocampus and cortex of CSS-exposed mice had elevated levels of mRFP, p16Ink4a, Il1β and Il6 with a non-significant trend in hippocampal p21Cip1 (Figure 2C,D; Supplementary Table 2). Importantly, treatment with GCV reversed the CSS-induced elevation of all senescence markers (Figure 2C,D, Supplementary Table 2). Consistent with this, p21Cip1 expression in the hippocampus of CSS and control mice correlated linearly with p16Ink4a (Pearson R=0.74; p=0.0007; Figure 2G). As expected, considering the young age of the experimental subjects, GCV treatment in control animals had minimal impact on gene expression. We validated the observed increase in p16Ink4a and p21Cip1 in CSS-exposed mice using RNAscope in the three key experimental treatments: ctrl+veh, CSS+veh and CSS+GCV (Figure 3A–C). Consistent with the RT-qPCR results, we found a significant increase in p16Ink4a, p21Cip1 and p16Ink4a/p21Cip1 double positive cells in the hippocampus of CSS-exposed mice that was ameliorated by treatment with GCV (Figure 3A–C). Also consistent with the RT-qPCR findings, this pattern, though not its magnitude, was mirrored in the cortex, where we observed clear trends toward an increase in p16Ink4a, p21Cip1, and p16Ink4a/p21Cip1 double positive cells in the CSS exposed/vehicle treated group (Figure 3D–F).
Figure 3. Quantitative and qualitative identification of p16/p21 positive cells using in situ hybridization.

A) Number of p16 positive cells / total cells in the hippocampus. B) Number of p21 positive cells / total cells in the hippocampus. C) Number of p16/p21 double positive cells / total cells in the hippocampus. D) Number of p16 positive cells / total cells in the cortex. E) Number of p21 positive cells / total cells in the cortex. F) Number of p16/p21 double positive cells / total cells in the cortex. A-F: ctrl+veh N=3; CSS+veh N=4; CSS+GCV N=4 per group. 10000–15000 total cells were observed per mouse (7000–11000 cells in hippocampus; 2500–3500 cells in cortex). A-F were analyzed with 1-way ANOVA followed by Tukey multiple comparisons test. * indicates p<0.05, ** indicates p<0.01. Histogram bars represent group mean. Error bars represent standard error. G) Representative images of fluorescent in situ hybridization labeling of p16, p21, Rbfox3, Aldh1l1, Tmem119, and Cspg4. Scale bars represent 50μm. Representative images of fluorescent in situ hybridization labeling mRFP colocalized with p16, and p21 are presented in Extended Data Figure 10. This experiment was repeated twice with similar results. I) Number of p16 positive cells of each cell type/total number of cells in those images in the hippocampus. J) Number of p21 positive cells of each cell type/total number of cells in those images in the hippocampus. K) Number of p16 and p21 double positive cells of each cell type/total number of cells in those images in the hippocampus. L) Number of p16 positive cells of each cell type/total number of cells in those images in the cortex. G) Percentage breakdown of p21 positive cell types across all those images in the cortex. M) Number of p21 positive cells of each cell type/total number of cells in those images in the cortex. N) Number of p16 and p21 double positive cells of each cell type/total number of cells in those images in the cortex. 10000–15000 total cells were observed per mouse (7000–11000 cells in hippocampus; 2500–3500 cells in cortex). I-N: N=2 per group. Shaded bars represent GCV treatment. Error bars represent standard error of the mean (SEM). Scale bars represent 50μm.
CRS induces a p16-independent elevation in p21Cip1 in the brains of male, but not female mice
Next, employing the same timescale and GCV treatment regimen used for the CSS (Figure 2A), we assessed whether CRS would affect senescence/SASP-related gene expression in in male or female mice. Unlike the CSS-exposed mice, CRS-exposed males had significantly greater levels of p21Cip1 and Il1β in the cortex and hippocampus (p<0.05), in absence of any changes to p16Ink4a and mRFP expression (Figures 2E,F, Supplementary Table 2). Importantly, the elevation in p21Cip1 and Il1β did not revert with GCV administration, suggesting that their elevation was p16Ink4a-independent. Additionally, while p21Cip1 and p16Ink4a expression were correlated in the hippocampus of CSS mice (Figure 2G), this was not the case in CRS mice (Figure 2H). We did not observe changes in senescence or SASP-related gene expression in any other organs of CRS-exposed mice examined (Extended Data Figure 4). Finally, no significant change in p16Ink4a, p21Cip1 mRFP or Il6 was detected in the brains of female mice exposed to CRS in presence/absence of GCV (Extended Data Figure 4), though there was a significant elevation in Il1β in the hippocampus of CRS-exposed females (Extended Data Figure 4G).
Neurons are the brain cell type most sensitive to stress-induced senescence
We next sought to identify the cell type identities of the SNCs induced by stress treatment. Previous studies have shown that neurons, microglia, astrocytes and oligodendrocyte precursors can all undergo senescence24,26,27,53. We first used the RNAscope as a qualitative approach to assess which cell types expressed SNC markers at a transcriptional level. We co-labeled 4 sets of brain sections with probes for Cdkn2a (p16Ink4a), Cdkn1a (p21Cip1) and a cell type marker for either astrocytes (Aldh1l1), neurons (Rbfox3), oligodendrocyte precursors (Cspg4), or microglia (Tmem119) (Figure 3G). In general, p16Ink4a most frequently colocalized with the neuronal marker Rbfox3 (the gene encoding NeuN; Figure 3I–N). p16Ink4a positive astrocytes were just slightly less abundant (Figure 3I–N). A much smaller fraction of p16Ink4a expressing cells colocalized with Tmem119 and Cspg4 (Figure 3I–N).
Next, to quantify the abundance of CSS induced SNCs at the protein level and to provide independent validation in a different mouse model, we used a recently developed p16-EF/CreERT2 reporter strain with the CreERT2 transgene driven by the endogenous p16Ink4a promoter48. We note that unlike the p16-CreERT2 reporter developed by others54, the p16-EF/CreERT2 lacks exogenous enhancer elements that boost endogenous p16Ink4a promoter activity and therefore requires robust p16Ink4a activation for induction of tdTomato upon administration of tamoxifen48 (we confirmed that tdTomato is expressed at negligible levels in the absence of tamoxifen treatment, see Extended Data Figure 5A). We subjected tamoxifen fed p16-EF/CreERT2;Ai14 mice to CSS but not CRS, as our previous data showed that CRS does not affect p16Ink4a expression (Figure 4A). Tamoxifen fed p16-EF/CreERT2 mice not exposed to CSS were used as controls.
Figure 4. Chronic Subordination Stress (CSS) increases the accumulation of p16-positive neurons in the brain.
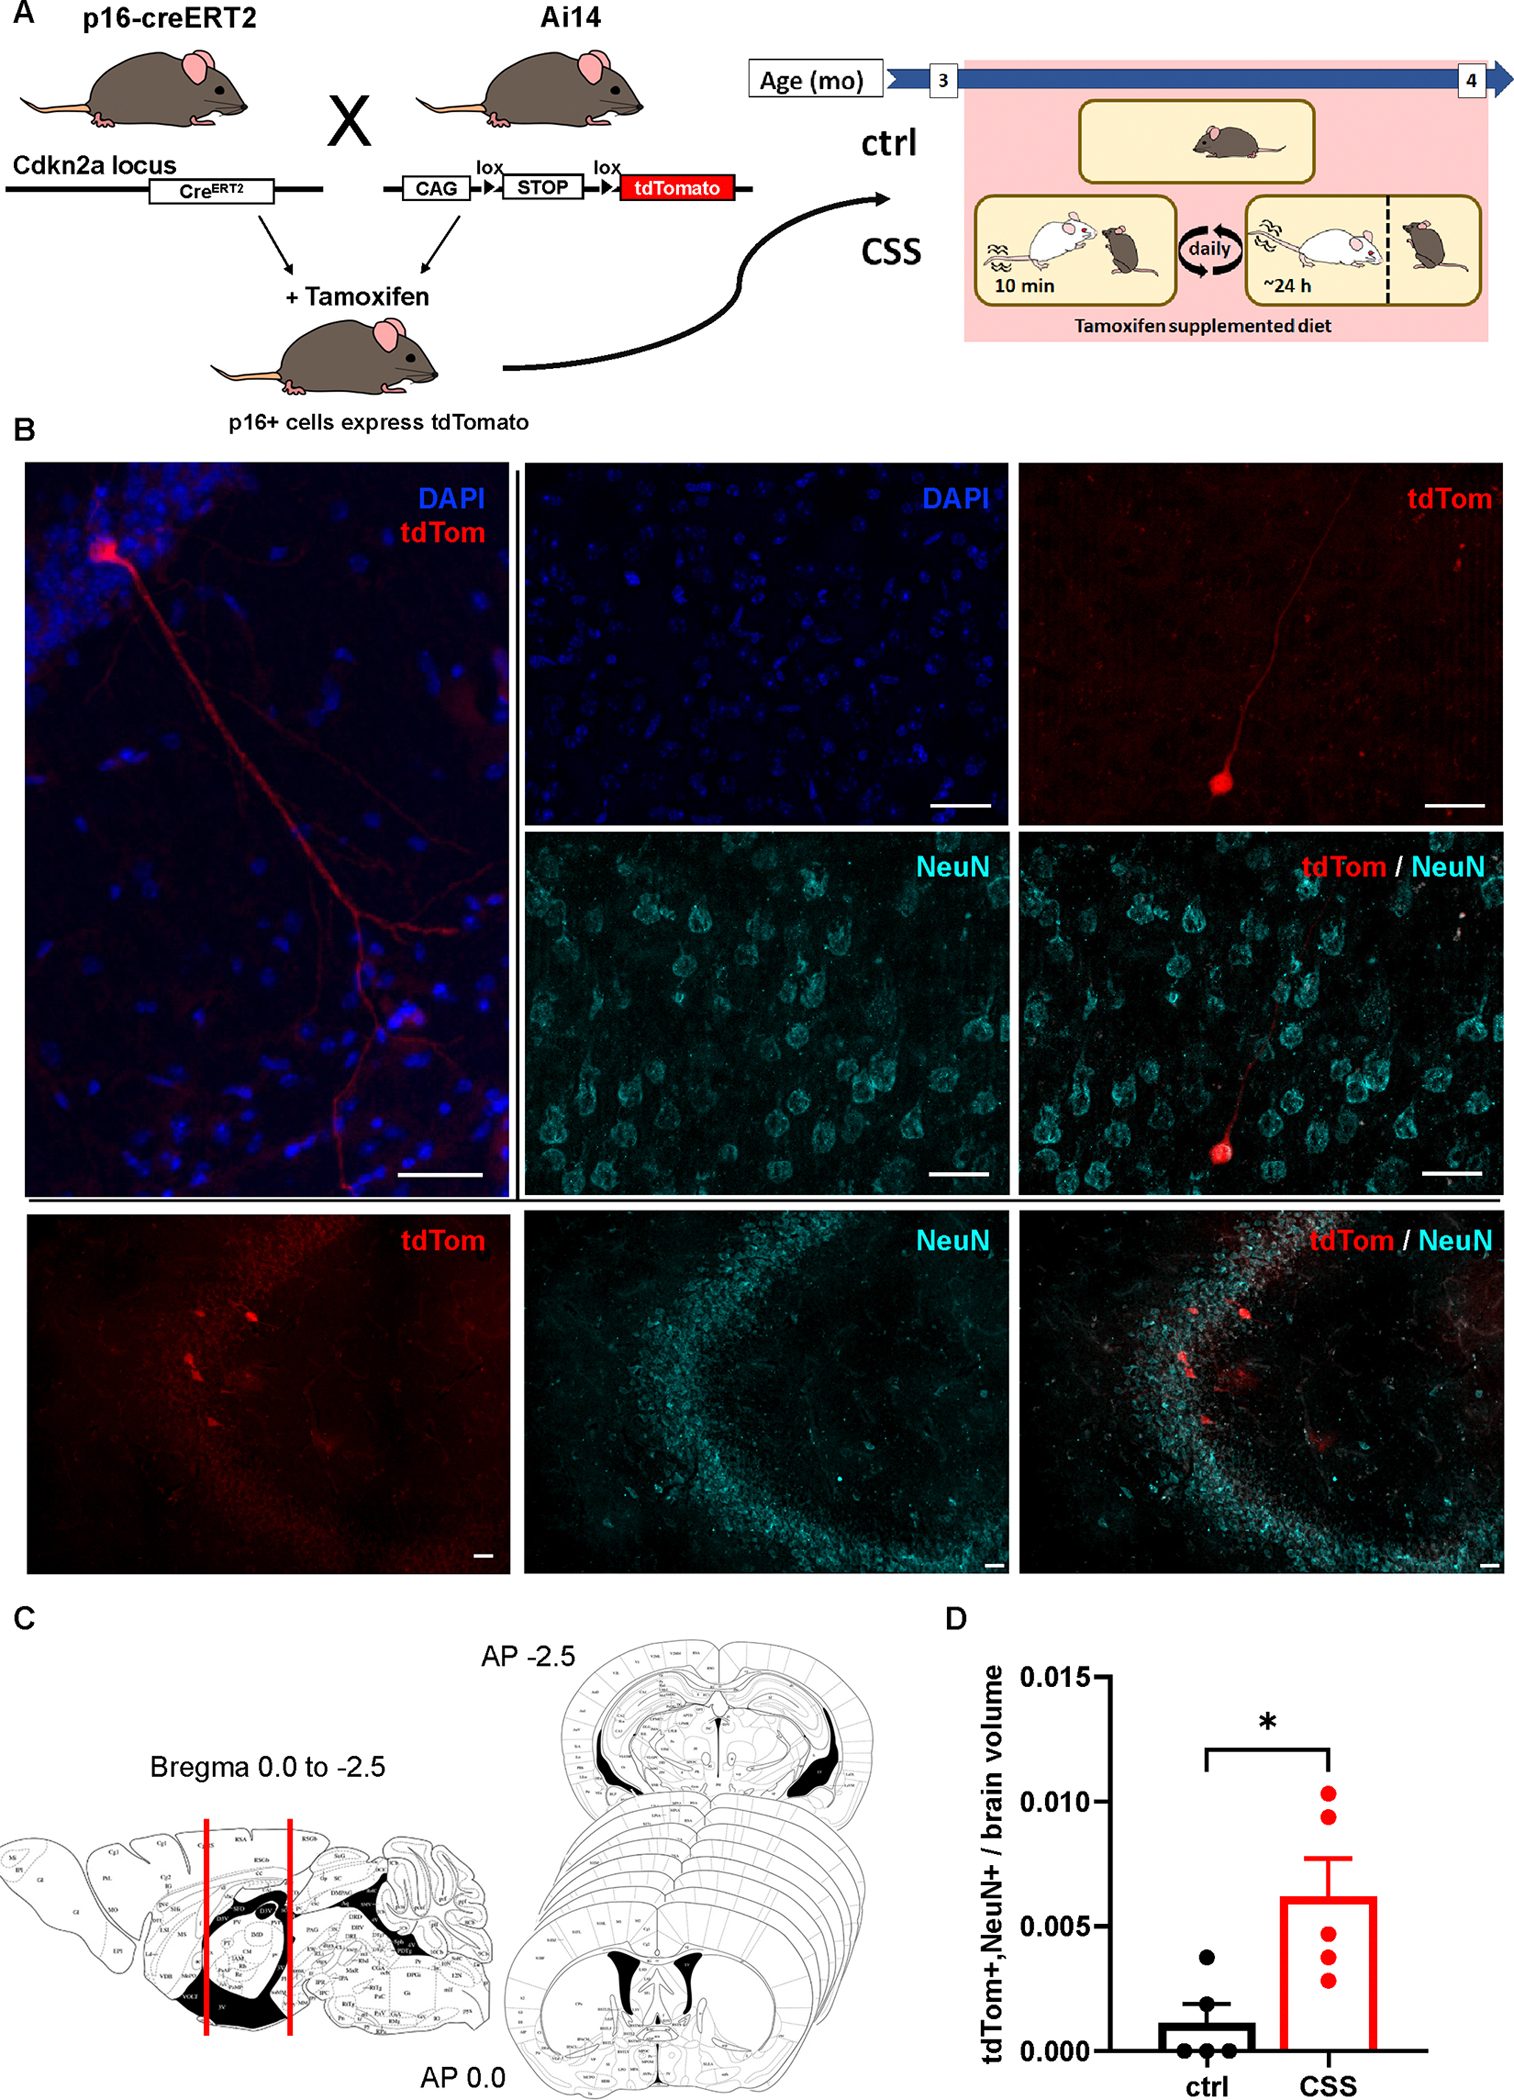
A) Illustration of generation of p16CreERT2;Ai14 mouse line and experimental design. B) Representative images of tdTomato/NeuN positive cells, in which the staining was repeated three times with consistent results. C) Illustration of sampling method used to quantify abundance of tdTomato positive cells D) CSS-exposed mice have significantly more tdTomato/NeuN positive cells in the brain than control mice; Two-tailed, unpaired t test, p=0.0178. ctrl N=5; CSS N=5. * indicates p<0.05. Histogram bars represent group mean. Error bars represent standard error of the mean (SEM). Scale bars represent 30μm.
We collected brains and performed immunofluorescent labeling for the cell type markers GFAP (astrocytes), Iba1 (microglia), NeuN (neurons), and NG2 (oligodendrocyte precursors). We observed colocalization of tdTomato only with NeuN (Figure 4B), and not any other cell type markers (Extended Data Figure 5B). tdTomato-positive fibers were also identified in white matter tracts, in particular the fimbria and striatum (Figure 4B). We then quantified tdTomato positive cells across 9 whole coronal brain sections immunofluorescently labeled for NeuN from approximately Bregma −0.94mm to −0.22 from each mouse (Figure 4C). We observed a significant increase in tdTomato/NeuN-positive cells in the brains of CSS exposed mice (Figure 4D).
Increased DNA damage is associated with the presence of CSS-induced SNCs
Our data demonstrated that CSS, but not CRS, induces accumulation of p16Ink4a expressing cells in the brain. To interrogate the pathways that mediate CSS-induced senescence and gain insight into how CSS-induced SNCs might alter the local microenvironment, we used the Nanostring GeoMx Digital Spatial Profiler to perform spatial transcriptomic profiling of regions with high p16Ink4a expression (Figure 5A)55. We used a high-sensitivity RNAscope in situ hybridization assay to label p16Ink4 positive cells the brains of control and CSS-exposed mice (CRS mice were not tested because they did not manifest increased p16Ink4a expression). p16Ink4a was selected as a marker by virtue of its relatively restricted expression compared to p21Cip1 (see Figure 2), making it a more specific senescence marker in our experimental conditions. We then defined areas of interest (AOIs) within the hippocampus and cortex — the regions identified by RNAscope and the p16-EF/CreERT2 reporter mouse line to contain most p16Ink4 positive cells. We identified subregions with high and low p16Ink4 abundance (p16 high; p16 low) ensuring size and cell abundance matched AOIs for each brain subregion in each sample (Figure 5B). In agreement with all previous data shown above, the p16 high AOIs of CSS mice had significantly more cells expressing p16Ink4 than those of controls (Figure 5C).
Figure 5. Transcriptomic profiling of Chronic Subordination Stress (CSS)-induced SNCs and their microenvironment.

A) Representative image of p16 transcript labeling and AOI selection for spatial transcriptomic profiling. B) Representative image showing area of interest (AOI) selection and p16 expression in ctrl and CSS p16 high and p16 low AOIs. Scale bars represent 50μm unless otherwise specified. C) Successful separation between p16 low and p16 high AOIs. CSS-exposed mice had significantly more p16+ cells in p16 high AOIs than ctrl p=0.0366. No significant differences between ctrl and CSS mice in p16 low AOIs p=0.9160. 2-way ANOVA. p16 status: p<0.0001. Group: p=0.1575. Interaction: p=0.0538. Tukey post hoc. No significant interaction (p=0.0538. Histogram bars represent group mean. Error bars represent standard error. Ctrl N=4; CSS N=6; 8 AOIs per mouse. Data points represent individual AOIs. D) Venn diagram illustrating overlapping differential gene expression in the hippocampus between p16 high regions in CSS mice, and with CSS in p16 high AOIs. Yellow and blue sectors illustrate the groups being compared on each set of the Venn diagram. 2-sided unpaired t tests; permutation q corrected. Statistical cutoff p<0.01. E) Venn diagram illustrating overlapping differential gene expression in the hippocampus between p16 high regions in CSS mice, and with CSS in p16 high AOIs. Yellow and blue sectors illustrate the groups being compared on each set of the Venn diagram. 2-sided unpaired t tests; permutation q corrected. Statistical cutoff p<0.01. F) Venn diagram showing pathways up/downregulated with p16 high and CSS conditions. G) Heat map showing significantly enriched senescence/SASP-related pathways associated with both CSS and p16 high. Gene set enrichment analysis (GSEA). p<0.01. Ctrl N=4; CSS N=6. Permutation q multiple testing correction. * indicates p<0.05. Histogram bars represent group mean. Shaded bars represent GCV treatment. Error bars represent standard error of the mean (SEM). Scale bars represent 1mm.
To determine the biological mechanisms that underlie CSS-induced senescence, we first separately assessed: 1) the differential gene expression between p16 high CSS and p16 high control mice (p16 high CSS v p16 high ctrl)); and 2) the differential gene expression between p16 high and p16 low AOIs in CSS-exposed mouse brains (p16 high v p16 low CSS). There were widespread changes in gene expression between p16 high and p16 low AOIs (252 differentially expressed genes; permutation q corrected p<0.01), and also between CSS and control mice (249 differentially expressed genes; permutation q corrected p<0.01) (Supplementary Table 3). We examined the overlap between these gene lists to determine which changes were associated specifically with elevated p16 expression in CSS-exposed mice. In the hippocampus, there were 11 overlapping genes with elevated expression, and 20 with lower expression (Figure 5D). In the cortex, there were 17 up and 14 down (Figure 5E). Interestingly, our analysis identifies more upregulated than downregulated pathways in response to CSS (Supplementary Table 3), which may impose a sustained energetic cost in conditions of chronic stress56,57.
To identify the functional relevance of transcriptomic changes we performed Gene Set Enrichment Analysis (GSEA). We conducted this for all AOIs combined, and also for separate brain regions (cortex and hippocampus) – see Supplementary Table 3 for full summary. The greatest number of up/downregulated pathways were in the hippocampus (p<.01; Supplementary Table 3). We compared the pathways significantly enriched for p16 high vs p16 low and for CSS vs control. We found a remarkable degree of overlap for the two independent comparisons, with 130 shared upregulated pathways and 3 downregulated pathways (Figure 5F). These overlapping shared biological functions included numerous pathways related to DNA damage, senescence, and SASP signaling (Figure 5G), such as “p53-Independent DNA Damage Response”, “Stabilization of p53”, and “Regulation of PTEN stability and activity”. Pathways associated with known SASP components were also commonly upregulated and included “Interleukin 1 family signaling”, “Signaling by VEGF”, and “VEGFA-VEGF2 Pathway”. Autophagy, NF-kB signaling and RAF:MAPK signaling were also notable.
We next performed targeted GSEA to assess overlap of the CSS gene signature with recently established “senescence signatures” – SenMayo gene set by Saul et al.58, and Core Senescence Signature by Hernandez-Segura et al.59. We found significant enrichment for the Core Senescence Signature in CSS vs ctrl (Extended Data Figure 6; NES values for analysis using the Core Senescence Signature: CSS vs. ctrl = 0.45; CSS vs. ctrl hippocampus = −0.49; CSS high vs low = 0.70; CSS high vs. low hippocampus = 0.72. Genes represented in Hernandez-Segura’s list = 55), but did not find significant enrichment for genes in the SenMayo panel (Extended Data Figure 6; NES values for analysis using SenMayo gene set: CSS vs. ctrl = −0.92; CSS vs. ctrl hippocampus = 1.0; CSS high vs. low = −1.16; CSS high vs. low hippocampus = −0.82.; Genes represented in SenMayo’s list = 118). One possible reason for the overlap with the Senescence Signature by Hernandez-Segura but not with the SenMayo signature is that the former was identified from the overlapping gene expression changes in four cell types (astrocytes, fibroblasts, keratinocytes, and melanocytes), all but one of which were induced to senesce by ionizing radiation or oxidative stress. Our data below suggest that CSS-induced senescence occurs via the DDR, which is activated by both ionizing radiation and oxidative damage; the Core Senescence Signature thus may more precisely reflect the SNC phenotype induced here than the SenMayo panel, which by design is very broadly applicable.
To validate findings from our pathway analysis, we measured expression of select genes associated with the NLRP3 inflammasome and the RAF:RAS signaling pathways in key experimental groups (ctrl+veh, CSS+veh, and CSS+GCV). We confirmed significant increases in select NLRP3 inflammasome genes Casp1 and IL-18 in the hippocampus and/or cortex of mice exposed to CSS (Extended Data Figure 7A), but we could not confirm changes in RAF:RAS related genes in the same groups (Extended Data Figure 7B).
Finally, since the transcriptomic analysis implicated several DNA damage pathways – a classical hallmark of aging, and driver of cellular senescence – as being present in the CSS-associated SNCs microenvironment, we performed γH2AX immunofluorescence staining and comet assay as measures of DNA damage. First, we stained the brains of control and CSS mice with γH2AX, a sensitive molecular marker of DNA damage. Results revealed a significant increase in γH2AX in neurons in the hippocampus CA3 and the somatosensory cortex of CSS exposed mice (Figure 6A). Notably, γH2AX signal occurred exclusively in NeuN positive cells but not in NeuN negative nuclei (Figure 6A). Next, we applied the comet assay to the cortex of key experimental groups, (ctrl+veh, CSS+veh and CSS+GCV; the hippocampus was not available for this assay). The CSS exposed group exhibited a higher DNA damage index, which was reversed by GCV treatment (Figure 6B).
Figure 6. Chronic Subordination Stress (CSS) induces DNA damage in the hippocampus and cortex.

A) Representative images showing γH2AX (red), NeuN (green), and DAPI (grey). Two-tailed, unpaired t-tests showed that CSS caused a significant increase in γH2AX staining in the hippocampus (CA3, t=7.311, df=8, p<0.0001) and somatosensory cortex (t=4.028, df=8, p=0.004). Only NeuN+ neurons but no other cell types shown in DAPI are stained with γH2AX. Ctrl, N=4. CSS, N=6, B) CSS increased DNA damage as indicated by tail and olive moment in the comet assay in the somatosensory cortex (ssCTX), and was normalized by ganciclovir (GCV) treatment. Tail moment, F (2,9) = 11.53, P=0.0033; Olive moment, F (2,9) = 10.28, P=0.0047. N=4 per group. * indicates p<0.05, ** indicates p<0.01, *** indicates p<0.0001. Histogram bars represent group mean. Error bars represent standard error of the mean (SEM). Scale bars represent 30μm.
Adverse effects of social stress on measured metrics of healthspan persist with clearance of p16Ink4a positive cells
Given that CSS-induces a GCV-reversible accumulation of SNCs and a multitude of studies have shown beneficial effects of SNC clearance42, we sought to determine the extent to which SNC clearance would protect male mice from CSS-associated phenotypes. To this end we assessed previously established CSS-induced metabolic phenotypes20,44–47 in the same young adult mice used for the SNC quantification. We found that GCV treatment did not affect CSS-induced phenotypes such as hyperphagia or weight gain (Extended Data Figure 8B,C). Molecular markers of HPA-axis activation such as hypothalamic corticotropin releasing hormone (CRH) expression or glucocorticoid receptor (GR) downregulation in the hypothalamus, cortex, or hippocampus (Extended Data Figure 8D), were also unaffected (plasma level of HPA-axis secreted hormones were not evaluated). As expected, GCV did not impact CRS-induced metabolic effects in male or female mice (Extended Data Figure 8E–H). Furthermore, male p16–3MR mice subjected to CSS followed by prolonged sensory contact for up to 16 months also did not benefit from GCV treatment as demonstrated by unabated hyperphagia, clinical frailty index, and loss of fur color (Extended Data Figure 9).
Discussion
Life stress has long been suspected to accelerate the aging process5,8,60. However, despite the prevalence of this belief, there is limited understanding of the biology underlying this phenomenon. Here, we tested the hypothesis that chronic social or psychological (non-social) stressors would induce cellular senescence, an established hallmark of aging9,61.
Differential effects of social and psychological stress on SNC accumulation
We showed that two different stress models – CSS and CRS – differentially increase expression of commonly accepted senescence markers p16Ink4a or p21Cip1. CRS induced a p16Ink4a-independent elevation of p21Cip1 in the brain of male but not female mice. However, because p21Cip1 was not associated with increases in other SNCs markers and is known to have roles in other cellular processes, this cannot be taken to conclusively represent a robust induction of senescence. It is notable that females were resilient to CRS-induced elevation of p21Cip1, as well as to other CRS-induced molecular and physiological effects. This result is consistent with a greater resilience to stress manifested by female rodents in most, but not all, functional domains62–66.
Conversely, CSS elicited an increase in p16Ink4a in the brain and other organs in male mice that was associated with expression of p21Cip1 and SASP factors. A limitation of the present study is that female mice were not tested in a model equivalent to the CSS. Future studies should address this gap in light of sex-related differences in stress resilience previously observed in the chronic social defeat stress (CSDS) paradigm65,66 (see also Supplementary Note for further details).
The differing effects of CSS and CRS in this study may reflect the intensity and/or salience of social vs nonsocial stressors. CSS recapitulates the formation of dominance hierarchies, modeling the negative impact of human psychosocial stressors – such as social marginalization and low socioeconomic status – on health9,20,67. CRS imposes psychological and physical (but not social) challenges; it elicits similar neuroendocrine changes to those observed in humans and is a valid model for depression and anxiety disorders68. Although both models elicit a stress response, they differ substantially in terms of pathophysiological outcomes and effects on aging-associated conditions9,11,69. For instance, CSS increases the risk for cardiovascular, neuroimmune, digestive, and metabolic diseases, in addition to substantial psychiatric comorbidity9,45. CRS exacerbates some forms of neurodegeneration, and induces anxiety/depression-like behavior68,70; however mice can also habituate to CRS68,71, while little to no habituation has been reported in social stress models such as CSS. Thus far only CSS has been shown to impact the aging process and to shorten lifespan in mice6,20. Arguably the chronicity of the social stress imposed on subordinate mice by the continuous threat by the dominant distinguishes it from other models, in which the challenge is typically intermittent. Demonstrating that CSS but not CRS induced accumulation of SNCs may provide an explanation of the superior efficacy of social stress model to elicit aging-associated diseases5,9,67.
CSS drives expression of SNCs markers preferentially in cortical and hippocampal neurons
It is striking that just 4 weeks of CSS in young male mice (3 months old at the start of the study) increased SNCs burden in PBMCs, brain and adipose tissue. This effect compounded with increasing duration of stressor exposure in PBMCs, and other work has demonstrated that longer exposure to CSS increases SNCs markers in peripheral organs such as the liver and spleen20. Thus, longer-term CSS exposure may accelerate the accumulation of SNCs in other tissues as well.
In the brain, the cortex and hippocampus were the main locations of CSS-induced SNCs with little evidence of senescence markers in classical stress-related nuclei such as the paraventricular nucleus, locus coeruleus, and bed nucleus of the stria terminalis12 (Extended Data Figure 3). The functional implication of this regional sensitivity remains to be established, but it suggests that CSS-induced senescence does not occur in nuclei controlling the activation of the neuroendocrine stress response, but rather in regions that are targets of stress mediators. Irrespective of brain area, neurons appear to be the cell type most sensitive to acquiring a senescent profile in response to CSS. Other cell types expressing p16Ink4a and p21Cip1 (astrocytes>microglia>oligodendrocyte precursors) were identified, though in fewer numbers, and at the transcriptional level but not at the protein level; thus, their identification as SNCs is less conclusive when compared to neurons. Adult neurons are postmitotic, but previous work has demonstrated that they can acquire markers of senescence in aging and disease72–74. Older adults have elevated neuronal p16Ink4a expression89, and p16Ink4a expression is negatively correlated with neurogenesis in aging mice75,76. Neurofibrillary tangle containing neurons from the cortex of patients affected by Alzheimer’s disease display the apoptosis-resistant senescent phenotype26. Premature accumulation of senescent neurons due to CSS thus may have functional consequences for brain function during aging.
DNA damage may mediate CSS-induced senescence
Spatial transcriptomic profiling, comet assay, and γH2AX staining, support DNA damage as the primary mediator of CSS-induced SNC accumulation. The DDR is a well-established initiator of cellular senescence, and our finding that GCV treatment attenuated the increase in DNA damage caused by CSS in the comet assay supports the mechanistic link with p16Ink4a expression. Although not directly tested in this study, chronic stress is known to increase ROS, which can cause DNA damage9,77–79. The brain is particularly vulnerable to stress-induced ROS and DNA damage80–82, and previous work shows that psychological stress-induced ROS and DNA damage are detectable in the brain earlier than in peripheral organs80–82.
GeoMx profiling also suggested that areas high in p16Ink4a expressing cells in CSS-exposed mice have increased interleukin signaling, NF-kB, NLRP3 inflammasome, and VEGF signaling, which have previously been suggested as major mediators of the SASP32. qPCR detection of SASP components Il1β and Il6 in the tissues of CSS-exposed mice, and their absence upon clearance of p16Ink4a expressing cells by GCV supports the conclusion that CSS-induced SNCs produce a SASP31,83. The potential consequences of this are manifold, but one worth mentioning is the formation of an inflammatory positive feedback loop, as Il1β signaling can activate inflammatory astrocytes84. Il1β and Il18 are key members of the NLRP3 inflammasome, a proposed mediator of aging-related diseases and inflammaging85. Over a lifetime, a greater burden of SNCs and their accompanying SASP could increase an individual’s risk for developing many chronic aging-related diseases precipitated by stress. Interestingly there is a substantial, although incomplete, overlap between the SASP and the Conserved Transcriptional Response to Adversity (CTRA) – a gene pattern observed across species exposed to chronic threat, particularly social stress86. Investigating the relationship between stress-induced senescence, the CTRA, inflammaging, and their downstream health consequences could help unify efforts across the fields of stress biology, epidemiology, and geroscience to develop therapeutic interventions against aging-related disease.
Clearance of p16Ink4a positive cells is insufficient to improve the adverse effects of social stress on measured metrics of healthspan
p16Ink4a positive SNCs can drive aging-related diseases and shorten lifespan23,24,26,27 though they can also mediate beneficial/homeostatic effects21,22,36,87. This prompted us to explore the extent to which p16Ink4a positive SNCs cells induced by CSS drive metabolic or physiological changes caused by short (4 weeks in young adults) or long-term (young adults exposed to CSS up to 16 months of age) CSS. We found that SNC clearance did not impact these changes in either timescale. However, the possibility that CSS-induced SNCs affect health parameters beyond the CSS-induced deficits/pathologies measured in this study, and that p16Ink4a-negative SNCs induced by stress drive these phenotypes, cannot be excluded since these were not evaluated in the current studies. Future work should further explore the extent to which senolytic or senomorphic treatments alleviate CCS-related impairments in older mice, and in the context of aging-related diseases.
In summary, we demonstrated that CSS increases accumulation of senescence markers in select organs including PBMCs, adipose tissue, and most prominently the cortex and hippocampus through a p16Ink4a-dependent mechanism. This is associated with increases in DNA damage, and SASP factors, both of which are reversed by targeted removal of p16Ink4a-positive cells. Our findings present a possible entry point through which life stress may accelerate senescence and thereby negatively affect the aging process.
Methods
Mouse experiments
All procedures were conducted with the approval of the University of Minnesota Institutional Animal Care and Use Committee. The p16–3MR mice line contains a copy of a bacterial artificial chromosome in which the senescence-sensitive p16Ink4a promoter drives expression of the widely used 3MR fusion protein 21. The trimodal 3MR fusion protein contains functional domains for Renilla luciferase, monomeric Red Fluorescent Protein (mRFP), and a truncated herpes simplex virus thymidine kinase (HSV-1TK), the latter conferring the ability to clear the p16 expressing cells upon administration of ganciclovir (GCV). In this study, the mRFP (assessed at the mRNA level to verify transgene expression) and the cell clearing function conferred by the HSV-1TK+GCV only were used, while luminescence was not investigated. This study included the following experiments: 1) 4-week stress experiments: male ctrl+veh N=16, male ctrl+GCV N=7, male CSS+veh N=30, male CSS+GCV N=14, male CRS+veh N=6, male CRS+GCV N=6, female ctrl+veh N=5, female ctrl+GCV N=5, female CRS+veh N=6, female CRS+GCV N=5; 2) Longitudinal PBMC sampling in male mice: ctrl N=5, CSS N=7, CRS N=6; 3) Lifelong CSS study in male mice: ctrl+veh N=14; ctrl+GCV N=15; CSS+veh N=19; CSS+GCV N=19. Mice included in these experiments were randomly identified by a random number generator within each group to select the tissues used for the molecular analyses described below. The specific sample size is indicated in the figure legends. Mice received intraperitoneal injections of 25 mg/kg ganciclovir (5mg/mL; Selleck Chemicals, USA) in sterile PBS with 4% DMSO for 5 consecutive days every 2 weeks21. These were days 2–6 and 23–27 of the 4-week CSS and CRS procedures and followed the same pattern for the Lifelong CSS experiments. Vehicle treated mice were injected with an equal volume of PBS with 4% DMSO.
p16-EF/CreERT2;Ai14 mice are derived from p16-EF/CreERT2x Ai14 mice as detailed in Cherry et al., 202348. Briefly, p16-EF/CreERT2 mice were created by knocking CreERT2 into the endogenous p16Ink4a locus and extensively validated for detection of SNCs as previously described48. CreERT2 encodes a Cre recombinase-mutant estrogen receptor fusion protein that is exclusively activatable by the estrogen-like agonist Tamoxifen. Ai14 mice (Jackson labs, Stock no: 007908) have a tdTomato reporter gene controlled by the ubiquitous CAG promoter that becomes active after the removal of a floxed (Lox-STOP-Lox) STOP cassette by Cre-mediated recombination. Mice were acclimated to and fed ad libitum with tamoxifen-supplemented diet (Envigo TD.130856). p16-EF/CreERT2;Ai14 male mice were used in the CSS experiment: ctrl Tam− N=5; ctrl Tam+ N=5; CSS N=8. Finally, CD1 mice were purchased from Charles River Laboratories. All mice had ad-libitum access to food (2018 Teklad diet, unless otherwise specified) and water. Mice were housed on a 12h:12h light:dark cycle and housing temperature of 21±2°C for the duration of the experiments. Mice were euthanized using CO2 asphyxiation.
Stress paradigms
3-month-old male p16–3MR mice were exposed to 4-weeks of CSS, CRS or remained singly housed as controls. 3-month-old female mice were exposed to 4 weeks of CRS or remained singly housed as controls. 3-month-old male p16-EF/CreERT2;Ai14 mice were exposed to 4 weeks of CSS or remained singly housed as controls.
Chronic subordination stress (CSS):
Male mice were subjected to a 4-week chronic subordination stress paradigm. Mice were paired with mice from the highly aggressive CD1 strain (retired breeders purchased from Charles River Labs). Daily, between the hours of 9:00am and 11:00am, the paired p16–3MR and CD1 mice were allowed to interact for a maximum of 10 minutes. Following this interaction, a perforated partition was used to separate the mice, allowing continuous sensory contact and preventing any additional physical contact. Aggressive behavior was manually scored to identify the frequency of aggression exhibited and received as previously described44–47.
Lifelong CSS:
This protocol was conducted as previously described20 and incorporates the CSS procedure above. After the CSS phase, however, mice entered an aging phase in which CD1 aggressor and experimental subordinate dyads were cohoused in continuous sensory contact with the partition in place in absence of physical social defeat for the remainder of the experiments as indicated in the specific figures.
Chronic restraint stress (CRS):
3-month-old male and female p16–3MR mice were restrained for 3 hours daily 6 days/week in perforated 50mL conical tubes during 4 weeks88. Mice used for repeated blood sampling remained in single housing following the 4 weeks of stress until the final sampling. Control mice were singly housed and handled daily.
31-Item Clinical Frailty Index
To quantify physical frailty in experimental mice, the 31-Item Clinical Frailty Index was used89. Trained experimenters evaluated for signs of discomfort along with the integument, musculoskeletal, vestibulocochlear/auditory, ocular, nasal, digestive, urogenital, and respiratory systems via direct observation. Grip strength was evaluated using a grip strength meter (Columbus Instruments, Columbus, OH) and internal body temperature was taken anally with a temperature probe (Cole-Parmer, Vernon Hills, IL). Deficits in each observational item were scored based on criteria provided by Whitehead et al.89 using a simple scale: 0 = no sign of deficit, 0.5 = mild deficit present, and 1 = severe deficit present. Deficits in grip strength, internal body temperature, and body weight were scored based on deviation from a reference population of sex- and strain-matched young adult mice and assigned values as previously described89. Deficit scores for all items were summed and divided by the total number of items to calculate a final frailty index value for each mouse.
Facial vein blood sampling
Mice were restrained by scruffing the skin of the dorsal neck and a 5-mm lancet (Goldenrod Animal Lancet, Medipoint, Mineola, NY) was used to puncture the facial vein on the right side of the face. Approximately 50–200μL of blood was collected by allowing it to freely drip into an EDTA coated MiniCollect tube (Greiner). There were at least 2 weeks between each blood sampling event. As all mice weighed greater than 25g, this volume ensured that no more than 10% of total blood volume was collected, in accordance with the NIH Office of Animal Care and Use Guidelines. Blood was kept at room temperature until PBMC isolation occurred immediately following collection.
PBMC isolation from whole blood
Blood samples were centrifuged at 376 rcf for 5 minutes at room temperature. Plasma and buffy coat layer were removed and resuspended in 1mL ACK lysis buffer (Thermo Fisher Scientific). Samples were incubated for 5 minutes to lyse red blood cells. Samples were then centrifuged at 376 rcf for 5 minutes at room temperature. ACK lysis buffer was removed and the cell pellet was washed twice in ice-cold DPBS to remove red blood cells. Cell pellets were resuspended in 850μL lysis buffer from the Mouse RiboPure Blood RNA Isolation kit (Thermo Fisher Scientific) and stored at −80°C until further use.
qPCRs
RNA from was extracted using either a Mouse RiboPure Blood RNA Isolation kit (for PBMCs; Thermo Fisher Scientific), an RNAeasy Lipid Tissue Mini Kit (for adipose tissue; Qiagen) or a PureLink RNA Mini Kit (for all other tissues; Thermo Fisher Scientific) according to the manufacturer’s protocol. Transcription into cDNA was performed using the iScript cDNA synthesis kit (Bio-Rad) according to the manufacturer’s directions. Each cDNA sample was run in duplicate using the iTaq Universal SYBR Green PCR Master Mix (Bio-Rad) to a final volume of 10μL in a CFX Connect thermal cycler and optic monitor (Bio-Rad). Primer sequences can be found in Supplementary Table 4. For p16Ink4a assessment in PBMCs, expression was normalized to Gapdh. The expression of senescence/SASP genes in our tissue panel was normalized to the geometric mean of two housekeeping genes – for brain tissue: actin and Gapdh, for all other tissues: actin and transcription factor II. Fold change was calculated using delta-delta Ct method.
Flow Cytometry
Whole blood was collected by submandibular cheek bleed. A small aliquot was used to count total nucleated cells by acridine orange staining (Cellometer K2). Red blood cells were lysed with ACK lysis buffer (Biolegend) and single cell suspensions were filtered through 100 μm nylon mesh. Cells were washed in FACS buffer (HBSS with 2% FBS and 2mM EDTA), then stained with blocking (2.4G2, Biolegend) and conjugated antibodies for 30 minutes at 4°C while being protected from light. Antibodies were stained at 1 ug/mL in 50 μL buffer. Flow cytometry was collected using a BD LSR Fortessa instrument, on BD FACSdiva software. Data was analyzed in Flowjo software (Tree Star). The following antibodies were used: Anti-CD45 BV480 (Clone: 30-F11, BD bioscience, Cat#:566168), Anti-CD11b BV605 (Clone: M1/70, Biolegend, Cat#:101237), Anti-Ly6G BV785 (Clone: 1A8, Biolegend, Cat#127645), Anti-Ly6C BV421 (Clone: HK1.4, Biolegend, Cat#:128031), Anti-CD115 PerCp Cy5.5 (Clone: AFS98, Biolegend, Cat#:135525), Anti-TCRβ APC (Clone: H57–156 597, Biolegend, Cat#:109211), Anti-CD4 Alexafluor700(Clone: GK1.5, Biolegend, Cat# 100430 ), Anti-CD8 APCcy7(Clone: 53–6.7,Biolegend, Cat# 100714 ), and Anti-CD19 FITC (Clone: ID3, Biolegend, Cat#:152403).
Comet Assay
The Comet assay was performed following the manufacturer protocol for the Comet Assay Kit (Abcam, AB238544). Comet agarose was heated up in 70°C water bath and a base layer of agarose was spread evenly along slides using roughly 45uL of agarose. Cortex samples from experimental mice were minced in 1X PBS with 20mM EDTA using dissection scissors. The supernatant from the tissue suspension was transferred to a new tube and centrifuged. The supernatant was discarded, and the pellet was resuspended at ~1 × 10⁵ cells/mL in 1x PBS. Samples were mixed at 1/10 ratio with comet agarose and 45uL was transferred evenly to the slides. Slides were cooled at 4°C and then transferred to a container with lysis buffer (Abcam, AB238544) and incubated for 45 minutes at 4°C. Lysis buffer was aspirated, replaced with alkaline solution, and incubated at 4°C for 30 minutes. Alkaline electrophoresis was then performed using the alkaline electrophoresis solution recommended in manufacturer protocol. Slides were placed horizontally within electrophoresis chamber and ran at 45V for 20 minutes, maintaining a 300mA setting. Slides were then washed with DI H20 as well as with 70% EtOH. 100uL of diluted Vista Green Dye (Abcam, AB 238544) was then added to each well and imaged using epifluorescence. Images were taken using the Nikon Eclipse NI-E with monochrome black/white camera Nikon DS-QiMC microscope and comets were analyzed using the OpenComet plug-in for ImageJ.
Senescence-associated β-Galactosidase Assay
Staining was performed using a kit according to manufacturer’s instructions (Cell Signaling 9860S) Freshly harvested chunks of tissue were washed in ice cold PBS, then lightly fixed in provided fixative solution for 15 minutes. Tissue was then incubated with X-Gal solution (adjusted to pH 6.0) for 16 hours at 37°C. A negative control tissue sample (liver) was incubated in staining solution that did not include X-gal. The samples were then postfixed with 4% PFA overnight at 4°C. The tissue was cryopreserved by incubating in a 30% sucrose solution for 3 days. It was then cryosectioned (10μm) and mounted on Superfrost Plus microscope slides. Slides were counterstained with DAPI (1μg/mL) and imaged using a Nikon Eclipse microscope equipped with a 60x oil-immersion objective (N.A. = 1.40). 10 fields of view for each sample were captured. An observer blinded to experimental condition manually counted the total number of cells, and the number of cells containing at least 1 X-gal crystal, and the percentage of X-gal positive cells was calculated for each sample.
Immunohistochemistry
Following euthanasia, tissue was collected and immersion fixed in 4% PFA in PBS overnight at 4°C. Tissues were then cryopreserved by incubating in a 30% sucrose solution for 3 days at 4°C or until tissue sank to bottom of tube. Tissue was cryosectioned at 40μm thickness and mounted on Superfrost Plus microscope slides (Fisher Scientific). Slides were washed 3 times for 5 minutes each in PBS. Tissue was then permeabilized with 0.3% Triton X-100 in PBS for 15 minutes. Nonspecific binding was blocked by incubating tissue with 5% Normal Donkey Serum (Jackson Immuno 017–000-121) in PBS with 0.1% Triton-X 100 for 1 hour at room temperature. Primary antibodies (Supplementary Table 5) were diluted in blocking buffer and incubated overnight at 4°C. They were subsequently washed 3 times for 5 minutes each in PBS. Tissue was incubated with secondary antibodies diluted in blocking buffer for 1 hour at room temperature. Tissue was washed 3 times for 5 minutes each in PBS and counterstained with DAPI (1μg/mL) for 10 minutes. Slides were briefly rinsed in deionized water and coverslipped using ProLong Diamond antifade mountant (ThermoFisher P36961). For quantification of tdTomato positive cells in the brain, imaging was performed using a Keyence BZ-X810 microscope equipped with a 20X objective (N.A. = 0.75).
Quantification of tdTomato positive cells
For each mouse, 9 coronal brain sections were scanned on a Keyence BZ-X810 microscope at 10X magnification (N.A. = 0.45). tdTomato positive cells were manually counted by a researcher blinded to the experimental condition of the samples. The position of the cells was recorded, and their authenticity confirmed by imaging at higher magnification. The number of tdTomato positive cells for each mouse was normalized to the total volume of brain tissue examined in the 9 coronal section scans.
γH2AX staining.
FFPE sections were mounted to a charged slide, dried overnight at room temperature in a hood. On the day of staining, they were baked at 60°C for 30 minutes. They were then deparaffinized and rehydrated using a series of xylene (3×10 minutes) and ethanol (2×5 minutes in 100%, 1×5 minutes in 95%, 1×5 minutes in 80%) followed by tap water (5 minutes). Antigen retrieval was performed by heating slides in a vegetable steamer for 35 minutes in pH 8.0 EDTA buffer, then allowing them to cool at room temperature for 20 minutes. Slides were placed in 3% Hydrogen Peroxide solution for 10 minutes, rinsed in running tap water, and placed into TRIS-buffered saline w/ Tween-20 (TBST, 0.1% Tween-20) for 5 minutes. TBST is the rinsing solution used in between steps. Slides were blocked using Rodent Block M (Biocare, RBM961L) for 30 minutes. On the first day, slides were incubated with anti-NeuN (1:4000; Sigma-Aldrich, ABN90) primary antibodies overnight at 4°C. Slides were rinsed and then incubated with corresponding secondary antibodies (1:1000,anti-mouse Alexa Fluor 488 cat#A11029 and anti-rabbit alexaFluor 647 cat#A31573) for 2 hours at room temperature. Slides were then rinsed with TBST for 10 minutes three times. On the second day, Rodent block M was applied for 15 minutes followed by anti-gamma H2A.X (1:8000; abcam, ab81299) incubated overnight at 4°C. The following day, slides were rinsed in TBST for 10 minutes three times, followed by anti-rabbit AlexaFluor 532 (1:1000, cat#A11009). The slides were incubated for 2 hours at room temperature followed by three 10 minutes TBST rinses. Slides were counterstained with DAPI (300nM) for 15 minutes at room temperature and then coverslipped using Vectashield mounting media (Vector Labs; cat# H-1000). Following staining, imaging of control and CSS brains were performed on a Keyence BZ-X810 microscope at 60X magnification (N.A. = 1.40) focusing on Hippocampus (CA3) and somatosensory cortex. Using ImageJ, images were processed and thresholded to quantify γH2AX+ pixels and also total NeuN+ cell counts. Final quantification values represent γH2AX+ pixels divided by the number of neurons present in a given FOV.
In situ hybridization
For the experiments that identified cell type marker colocalization with p16Ink4a and p21Cip:
fluorescent in situ hybridization was performed using RNAscope Fluorescent Multiplex v1 kit (ACD, catalog#: 320850) according to the manufacturer’s instructions on 10μm sagittal cryosections cut from fresh frozen mouse brains (2 mice per group, 4 sections per mouse). RNAscope assay was performed according to manufacturer’s specifications. For the experiments quantifying abundance of p16Ink4a and p21Cip1-positive cells, due to a change in product availability, fluorescent in situ hybridization was performed using RNAscope Multiplex Fluorescent Detection Kit v2 with TSA Vivid Dyes (ACD, catalog#: 323270) according to the manufacturer’s instructions on 10μm sagittal cryosections cut from fresh frozen mouse brains (4–5 mice per group, 4 sections per mouse). The same probes were used in both assays; they differ only in the manners of their fluorescent signal amplification.
In both cases, tissue slides were fixed in 4% PFA for 15 minutes at 4°C. Tissue was gradually dehydrated in increasing concentrations of ethanol prepared with milliQ water at room temperature (50%, 70%, and 100% for 5 minutes each). The kit’s “Protease IV” was applied to tissue sections and incubated for 30 minutes at room temperature. Slides were washed 3 times in 1X PBS by placing them in a staining rack and submerging 3–5 times. Slides were then transferred to a HybEZ stain rack (ACD 321716) in a humidified chamber (ACD 310012, 310025), probes were applied, and incubated for 2 hours at 40C in an HybEZ oven (ACD 321710). Probes were all sourced from ACD (Supplementary Table 6). Slides were washed 2X2min in the kit’s provided wash buffer in an EZ batch wash tray (ACD 321717).
RNAscope Fluorescent Multiplex v1 kit:
4 rounds of signal amplification were performed according to manufacturer’s directions – Amp-1 FL for 30 minutes at 40°C, Amp-2 FL for 15 minutes at 40 degrees, Amp-3 for 30 minutes at 40°C, Amp-4C-FL for 15 minutes at 40°C. Slides were washed 2×2 minutes in between amplification incubations in EZ batch wash tray (ACD 321717). Following Amp 4-C-FL incubation and 2×2min wash, tissue was counterstained with DAPI provided in the kit for 30 seconds. Excess solution was gently tapped off and slides were coverslipped with ProLong Gold Antifade Mountant (Invitrogen P36930).Imaging was performed on a Nikon Eclipse microscope equipped with a 60x oil objective (N.A. = 1.40). 4 sagittal sections per mouse were assessed. 10000–15000 nuclei were observed per mouse (7000–11000 in hippocampus; 2500–3500 in cortex). Images were collected in the following manner: 3 images from the subiculum, 5 from CA1, 5 from CA3, 3 from the dentate gyrus, 5 from the somatosensory cortex, and 3 from the orbito-frontal cortex.
RNAscope Multiplex Fluorescent Detection Kit v2:
3 rounds of signal amplification were performed according to manufacturer’s directions – Amp-1 FL for 30 minutes at 40°C, Amp-2 FL for 30 minutes at 40 degrees, Amp-3 FL for 15 minutes at 40°C. Following signal amplification, Tyramide Signal Amplification reactions were performed by treating slides with FL v2 HRP for 15 minutes at 40°C, followed by incubation with respective TSA Vivid fluorophore for 30 minutes and then FL v2 HRP Blocker for 15 minutes with all steps occurring at 40°C; this process was repeated separately for each individual fluorophore (TSA Vivid 520, 570, or 650 | catalog#: 323271, 323272, 323273). Following the three individual TSA reactions and 2×2min wash, tissue was counterstained with the kit-provided DAPI for 30 seconds. Excess solution was gently tapped off and slides were coverslipped with ProLong Gold Antifade Mountant (Invitrogen P36930). Imaging was performed on a Keyence BZ-X810 equipped with a 60x oil objective (N.A. = 1.40). 4 sagittal sections per mouse were assessed. Stitched 60x images were collected consisting of CA3, CA1, and somatosensory cortex. 10000–15000 nuclei were observed per mouse (7000–11000 in hippocampus; 2500–3500 in cortex).
Analysis:
The images were converted to binary in Image J, thresholded by an observer blinded to experimental condition, and the number of nuclei containing puncta from each channel, and colocalization of puncta from each channel on the same nuclei was then measured using a CellProfiler pipeline adapted from Erben et al90. Cell counts were normalized to number of DAPI stained nuclei per field of view.
Spatial Transcriptomics
The brains from 6 CSS-exposed mice and 4 control mice were dissected and immersion fixed in 4% PFA made with nuclease-free water overnight at 4°C, then stored in nuclease-free 70% ethanol until embedding in paraffin blocks by the University of Minnesota Histology Core. Blocks were microtome sectioned to a thickness of 5 μm and mounted of Superfrost Plus slides (Fisher Scientific). Sections were placed within the central 36.2 mm x 14.6 mm area of the slides to ensure tissues fit within the gasketed GeoMx slide holder. Mounted tissues were dried in a hood overnight at room temperature. Within 24 hours of sectioning, Cdkn2a transcripts were labeled using the RNAscope 2.5 HD Assay – RED (ACD 322360) and a Cdkn2a probe (411011), according to the manufacturer’s specifications.
Immediately following the RNAscope labeling, the slides proceeded to the GeoMx Whole Mouse Transcriptome Atlas protocol outlined by the manufacturer (Nanostring Technologies), starting at the 5-minute postfixation step in 10% formalin. Prepared tissues were flooded with whole transcriptome RNA probes (Nanostring Technologies, Cat#121401102) attached to oligonucleotide barcodes via photocleavable linkers. Slides were covered with HybriSlip hybridization covers (Grace Bio-Labs, Cat#714022) and hybridized overnight at 37°C in a hybridization oven (Boekel Scientific RapidFISH Slide Hybridizer, Cat#240200). Following hybridization, unbound probes were washed away using a wash solution of equal parts 4XSSC and deionized formamide (ThermoFisher, Cat#AM9342). Nuclei were labeled using SYTO 13 green fluorescent nucleic acid stain (ThermoFisher, Cat# S7575). Tissues were blocked with Buffer W (Nanostring Technologies, Cat#121300313) in a light impermeable humidity chamber (Simport, Cat#M920–2) for 30 minutes at room temperature. Following blocking, morphology markers were incubated at room temperature for 1 hour. Slides were washed in 2XSSC and loaded into GeoMx DSP instrument slide holder (University of Minnesota Imaging Center).
The GeoMx DSP instrument performs multiplexed wide field fluorescence microscopy and utilizes an ultraviolet (UV) laser to release oligonucleotide barcodes from a specific area of illumination (AOI). The labeled Cdkn2a transcripts enable precise selection of regions within a tissue based upon fluorescent intensity. The GeoMx instrument has a complement of four fluorescence imaging channels with the following specifications (Channel, Excitation (peak/bandwidth), Emission (peak/bandwidth)): FITC, 480/28 nm, 516/23 nm; Cy3, 538/19 nm, 564/15 nm; Texas Red, 588/19 nm, 623/30 nm; Cy5, 645/19 nm, 683/30 nm. Multiple segments can be chosen for each region of interest (ROI) with a maximum ROI size of 660 μm x 785 μm. This segmentation is performed using the onboard GeoMx software which selects pixels within the image based upon fluorescent intensity thresholds. Only the selected areas are then illuminated by UV light thereby photocleaving the linker molecule and liberating the oligonucleotide barcodes in specific regions within the ROI. Thresholds can be adjusted for each segment and for each fluorescent channel and corresponding fluorescently labeled morphology marker.
AOIs were manually drawn based on visual inspection of Cdkn2a expression and aimed to have approximately 230 nuclei per AOI. 2 AOIs per brain region were selected from each brain section — one with a high number of Cdkn2a (p16 high) and one with a low number of Cdkn2a puncta (p16 low). The brain regions inspected were areas CA1 and CA3 of the hippocampus, the somatosensory cortex, and the motor cortex. This yielded a total of 10 matched AOIs per brain sample. Selected AOIs were illuminated by UV laser in the GeoMx instrument and photocleaved barcodes were collected and deposited into a 96-well microplate by the instruments onboard microfluidics system. Collection plates were sealed to prevent contamination and stored at −80°C prior to library preparation.
Sequencing was performed by the University of Minnesota Genomics Center. Indexed AOIs were pooled and purified into two rounds of AMPure XP (Beckman Coulter, Cat#A63880) PCR purification using a 1.2x bead:sample ratio. Samples were then sequenced on an Illumina NextSeq 2000. FASTQ files were filtered and demultiplexed using DND2.0 with the following parameters: quality trim score = 20, adaptor trim match length = 10, adaptor trim max mismatch = 3, barcode max mismatch = 1, stitching max mismatch = 2, dedup-hd = 1. DND is used to convert the raw FASTQ files to Digital Count Conversion (DCC) file format. Individual DCC files were aggregated and checked for probe-level quality prior to data analysis. For the WTA, each gene is mapped to a single probe.
Statistics & Reproducibility
Mice were randomized to the experimental treatment and biological samples randomized to be analyzed by flipping a coin. The Investigators were blinded to allocation during molecular analyses, while for the invivo experiments this was not possile due to the different housing conditions. No statistical method was used to predetermine sample size. Data distribution was verified before applying the parametric tests and whn this did not occur data we log-transformed. Body weight, food intake were measured regularly and analyzed with two-levels repeated measures ANOVAs followed by Tukey’s multiple comparison test. CFI data were analyzed with two-levels repeated measures ANOVA followed by Tukey’s HSD post hoc tests for binary comparisons. For single time point assessments of PBMC p16Ink4a expression, unpaired t-tests, or 2-way ANOVAs with Tukey post hoc were used to test for statistical differences. Longitudinal measurements of PBMC expression were analyzed using a Restricted Maximum Likelihood (REML) linear mixed-effects model, to account for several individual’s values missing at various timepoints due to insufficient blood sample collection. Change in p16Ink4a expression between 20 and 26 months was analyzed using 2-way Repeated Measures ANOVA. For the senescence/SASP panel, data were analyzed for brain and peripheral tissues by ML mixed effects model with the contribution of individual to variance factored in the random effect as well as in the autocorrelation structure; due to the large number of comparisons, pairwise comparisons were conducted using the multivariate t method correction. Grubb’s outlier test was applied and data were removed when p<0.05. Flow cytometry data were analyzed was analyzed using 2-way ANOVA. Grubb’s outlier test was applied and data were removed when p<0.05. Comet assay data were analyzed using one way ANOVA followed by Tukey’s multiple comparison test. Grubb’s outlier test was applied, and data were removed when p<0.05. SAβ-Galdata were analyzed using unpaired t-tests. tdTom cells were analyzed using unpaired t-test. γH2AX was analyzed separately for Hippocampus (CA3) and Cortex, were tested using unpaired t-tests. RNAscope data were analyzed using one way ANOVA followed by Tukey’s multiple comparison test. Data from the GeoMX analysis was performed using Nanostring’s GeoMx DSP Analysis Suite. For each sample, Limit of Quantification (LOQ) was derived. LOQ for a given gene is defined as the geometric mean of pool-specific negative probes times the geometric standard deviation of negative probes raised to a power of 2 (i.e., LOQ2). These LOQ values were used as a basis of filtering genes that are expressed near background. We required that a given gene needed to be above LOQ2 in at least 20% of the AOIs. Any probes that failed Grubb’s outlier test in >20% of segments were excluded. Under these criteria 19963 genes were detected. Individual probe counts were normalized to the median probe count for each AOI. Differential gene expression between p16 high and p16 low AOIs was determined using unpaired t-tests with permutation q correction. Gene Set Enrichment Analysis (GSEA) was performed within the DSP Analysis Suite with minimum coverage of genes in pathway set at 20%, minimum number of genes in each pathway set as 5, minimum pathway size as 15, and maximum as 500, and number of permutations at 1000.
Extended Data
Extended data figure 1. Flow cytometry gating scheme.

Flow cytometry gating scheme used to identify major immune cell subsets (CD45+) in peripheral blood; including neutrophils (Ly6G+ CD11b+), Ly6C+ classical monocytes (Ly6C+ CD115+ CD11b+ Ly6G−), Ly6C− nonclassical monocytes (Ly6C− CD115+ CD11b+ Ly6G−), B cells (CD19+ Ly6G− CD115−), CD4 T cells (CD4+ TCRb+ Ly6G− CD115−), and CD8 T cells (CD4+ TCRb+ Ly6G− CD115−).
Extended data figure 2. Senescence-associated β-galactosidase (SA β-gal).

A-D) Representative gross images of subcutaneous white adipose tissue (scWAT), Liver, Kidney, Hippocampus, and Cortex of control (ctrl) and Chronic Subordination Stress (CSS) mice following senescence-associated β-galactosidase staining. A-C) CSS mice have significantly more SA β-gal positive cells in the scWAT than control mice (p=0.001). Unpaired, two-sided t test. Ctrl N=3; CSS N=4. A-D) No significant difference between control and CSS mice in SA β-gal staining in the liver, kidney, liver, hippocampus or cortex. Unpaired, two-sided t test. Ctrl N=3; CSS N=4 * indicates p<0.05. Scale bars represent 50μm unless otherwise specified. Histogram bars represent group mean. Error bars represent standard error of the mean (SEM). Scale bars represent 1mm.
Extended data figure 3. RNAscope™ representative images in animals exposed to Chronic Subordination Stress (CSS).

A) 10x DAPI stitched images of entire sagittal sections showing boxed regions of interest at various medial-lateral positions in which they appear. B) 60x fields of view captured from regions of high p16/p21 expression (CA3 – hippocampus and somatosensory cortex) and regions with negligible p16/p21 expression (BST – bed nucleus of stria terminalis | PVN – paraventricular nucleus | LC – locus coeruleus | MEA – medial amygdala nucleus) showing DAPI, Rbfox3 (neurons), p21, and p16. Scale bars represent 50μM. Experiment was repeated twice with similar results; second pass was to have a cohort large enough for valid statistical analysis.
Extended data figure 4. Effect of Chronic Subordination Stress (CSS) or Chronic Restraint Stress (CRS) on gene expression.

A-D) Senescence/senescence associated secretory phenotype (SASP)-related gene expression in the CSS exposed mice. E-F) Senescence/SASP-related gene expression in the lung and liver in animals exposed to CRS. Control + vehicle (Ctrl+veh) N=6; ctrl + ganciclovir (GCV) N=5; CSS+veh N=14; CSS+GCV N=11; CRS+veh N=9; CRS+GCV N=5; G) CSS + GCV group had significantly higher expression of IL1B than ctrl (p=0.046). G-H) Senescence/SASP-related gene expression in the hippocampus and cortex of CRS exposed female mice. Ctrl+veh N=5; ctrl+GCV N=4; CRS+veh N=6; CRS+GCV N=5. 2-way ANOVA, Tukey post hoc. * indicates p<0.05. Histogram bars represent group mean. Shaded bars represent GCV treatment groups. Error bars represent standard error of the mean (SEM).
Extended data figure 5. Histological analysis of p16CreERT2;Ai14 mice.

A) Tamoxifen (Tam) is required for tdTomato (TdTom) expression in p16CreERT2;Ai14 mice. Control (Ctrl) Tam− N=5, ctrl Tam+ N=5 (p=0.017). Two-sided, unpaired t-test. Histogram bars represent group mean. Error bars represent standard error. B) Representative images of tdTom+ cells co-stained with NeuN (neurons), and GFAP+ (astrocytes), Iba1+ (microglia), and NG2+ (oligodendrocytes precursors, OPCs) cells which were all negative for TdTom; multi-staining repeated twice with consistent results. Scale bars represent 30μm. **p<0.01.
Extended data figure 6. Gene set enrichment analysis (GSEA).
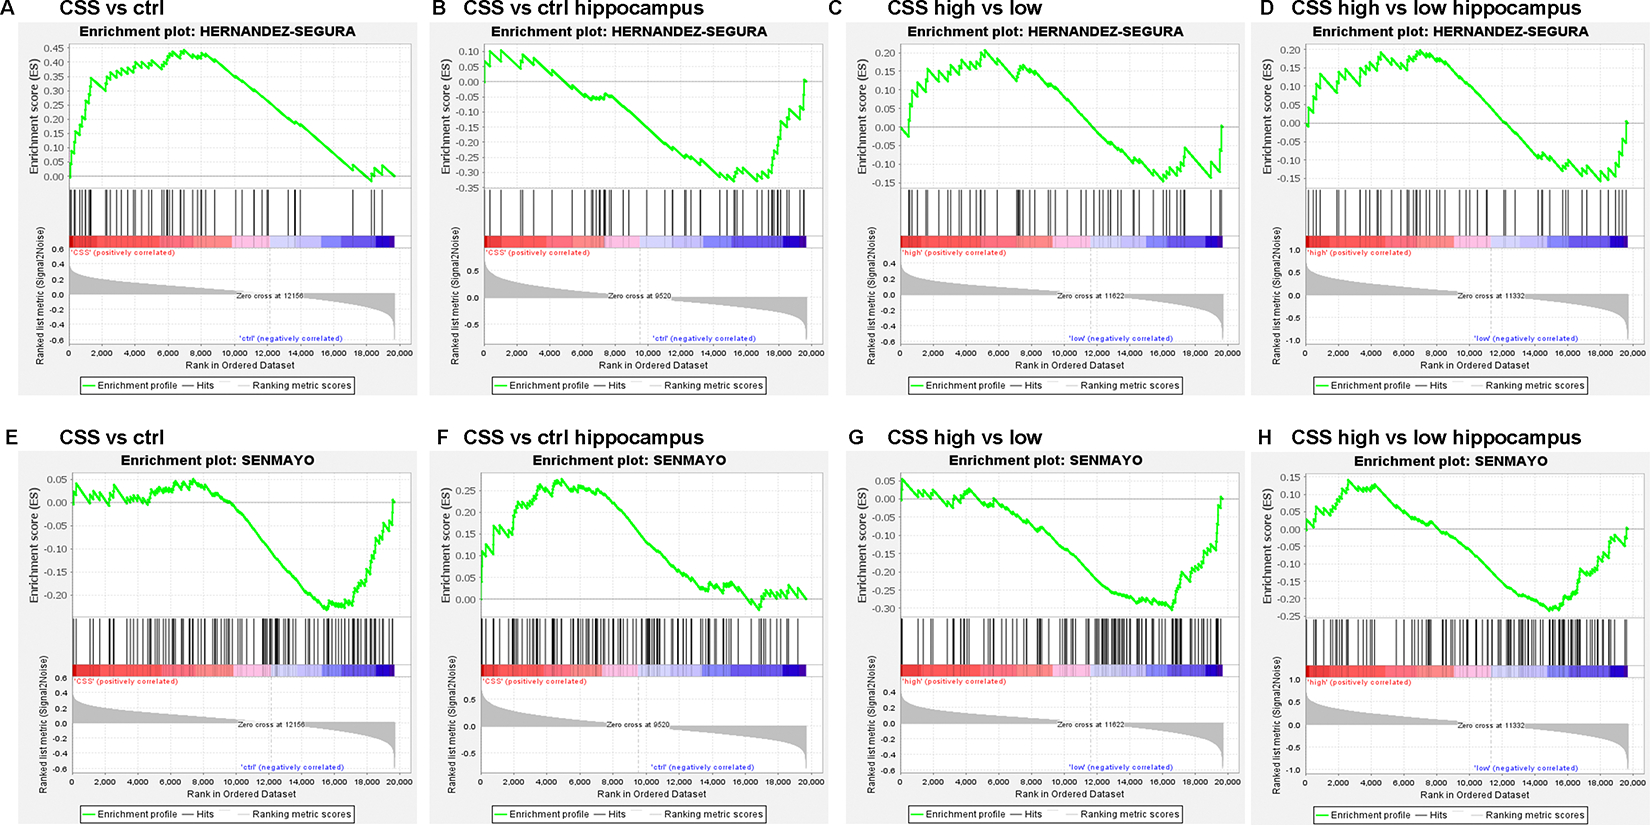
GSEA for the Hernandez-Segura et al. 71 gene set (genes represented in Hernandez-Segura’s list = 52) in mouse whole brain (A-C) or hippocampus (B-D). GSEA mRNA expression levels using the SenMayo70 gene set (genes represented in SenMayo’s list = 118) in mouse whole brain (E-F) or hippocampus (G-H). X axis represents: (A-B and E-F) chronic subordination stress (CSS)/control level; (C-D and G-H) CSS high p16 expressing/CSS low p16 expressing. Y axis represents the enrichment score of these mRNAs.
Extended data figure 7. Gene expression analysis.

A-F) Select genes in the NLRP3 inflammasome pathway and G-L) select genes in the RAF:RAS pathway in the hippocampus or cortex of male mice. Control (Ctrl)=4; Chronic Subordination Stress (CSS)=5. Unpaired, two-sided t test (A: p=0.0169; B: p<0.0001). Bars represent group mean and error bars represent standard error of the mean (SEM). * p<0.05, ****p<0.0001.
Extended data figure 8. Behavioral and physiological characterization of mice exposed to Chronic Subordination Stress (CSS) or Chronic Restraint Stress (CRS).

A) Diagram of the experimental protocol. B) CSS increases body weight gain irrespective of GCV treatment. Ctrl+veh vs CSS+veh p=0.0091. ctrl+veh vs CSS+GCV p=0.0412. ctrl+GCV vs CSS+veh p = 0.0007. ctrl+GCV vs CSS+GCV p=0.0030. 2-way ANOVA, Tukey post hoc. Ctrl+veh N=15, Ctrl+GCV N=7, CSS+veh N=28, CSS+GCV N=14. C) CSS increases body weight gain irrespective of GCV treatment. Ctrl+veh vs CSS+veh p=0.0010. Ctrl+veh vs CSS+GCV p=0.0178. ctrl+GCV vs CSS+veh p=0.0036. ctrl+GCV vs CSS+GCV p=0.0229. 2-way ANOVA, Tukey post hoc. Ctrl+veh N=15, Ctrl+GCV N=7, CSS+veh N=28, CSS+GCV N=14.D) CSS affects expression of select Hypothalamus Pituitary Adrenocortical (HPA)-axis related genes in the hypothalamus, cortex or hippocampus irrespective of GCV treatment. 1-way ANOVA. CRH= Corticotropin-releasing hormone, GR=glucocorticoids receptor. Ctrl+veh=3–4, CSS+veh=4–5, CSS+GCV=6. E-F) CRS decreases body weight in male mice irrespective of GCV treatment. Ctrl+veh vs CSS+veh p<0.0001. ctrl+veh vs CSS+GCV p<0.0001 ctrl+GCV vs CSS+veh p<0.0001. ctrl+GCV vs CSS+GCV p<0.0001. 2-way ANOVA. Tukey post hoc. Ctrl+veh=15, Ctrl+GCV=7, CRS+veh=15, CRS+GCV=9. G-H) CRS exerts no effect in female mice. Ganciclovir (GCV) decreases body weight gain in control but not CRS treated mice. Ctrl+veh vs ctrl+GCV p=0.0246. 2-way ANOVA. Tukey post hoc. Ctrl+veh=5, Ctrl+GCV=5, CRS+veh=6, CRS+GCV=5. * indicates p<0.05, ** indicates p<0.01; *** indicates p<0.001; **** indicates p<0.0001. Shaded bars indicate GCV treatment groups. Histograms represent group mean and error bars represents standard error of the mean (SEM).
Extended data figure 9. Behavioral and physiological characterization of mice exposed to lifelong Chronic Subordination Stress (CSS) up to 17 months of age.

A) Diagram of the experimental protocol. B) while treatment group didn’t affect body weight (age: F(1.66, 94.73)=391.1, p<0.0001; group: F(3,63)=0.24, p=0.86; age x group: F(12, 228)=1.12, p=0.35), CSS causes hyperphagia. C) (age: F(2.74, 150.7)=11.1, p<0.0001; group: F(3,63)=10.72, p<0.0001; age x group: F(12, 220)=2.51, p=0.0042) and increases clinical frailty index (CFI). D) (age: F(2, 110)=149.6, p<0.0001; group: F(3,63)=2.39, p=0.076; age x group: F(6, 110)=2.05, p=0.06) – including loss of fur color). E) (age: F(1.71, 94.03)=46.76, p<0.0001; group: F(3,63)=6.14, p=0.001; age x group: F(6, 110)=4.17, p=0.0008) irrespective of Ganciclovir (GCV) treatment. Ctrl+veh=14, Ctrl+GCV=15, CSS+veh=14–19 (range due to animal death during the experiment), CSS+GCV=9–19 (range due to animal death during the experiment). * indicates p<0.05, ** indicates p<0.01; *** indicates p<0.001; **** indicates p<0.0001. 2-way ANOVA, Tukey post hoc. Data are represented as group means and error bars represent standard error of the mean (SEM).
Extended data figure 10. RNAscope representative images validating mRFP expression, and colocalization with p16 and p21.

Representative RNAscope Fluorescent In Situ Hybridization images showing probes for mRFP, p21, and p16 expression in Hippocampus-CA3 (A) and somatosensory cortex (B) in vehicle (Veh) treated control animals (Ctrl), veh treated chronic Subordination Stress (CSS) animals, and Ganciclovir (GCV) treated CSS animals. The results here were consistent across two repeated experiments, with the second pass having a more substantial n per group. The mRFP signal that is observed is not due to autofluorescence (any autofluorescent signal gets quenched due to the protease reagents in FISH protocol), but rather RNAscope mRFP probes detecting mRFP transcripts and that signal then being amplified. The inserts in the p16 panels show the merge of the 3 signals on one representative nucleus. Scale bars represent 30μm.
Supplementary Material
Acknowledgements
We dedicate this paper to the memory of Judith (Judy) Campisi, a giant in the field who kindly shared the p16–3MR mice and provided feedback during the execution of the research described in this paper. The authors would also like to thank Patrick Rothwell for training and crucial support with the RNAscope experiments, Giada Caviola, Madeleine Berg, and Nivedita Sabarinathan for their assistance with the in vivo studies, The spatial transcriptomics workflow was carried out with the resources of and substantial assistance from Colleen Forster at the University of Minnesota Histology Core, Grant Barthel at the University of Minnesota Imaging Center (UIC) SCR.020997, and Fernanda Rodriguez at the University of Minnesota Genomics Center. Colleen Forster is also acknowledged for help provided with the γH2AX staining. The staff of the Research Animal Resources at the University of Minnesota are also acknowledged for their instrumental role in animal care on a daily basis.
The project was supported MN Partnership for Biotechnology and Molecular Genomics #18.04 (AB, JMvD and DJB), and #19.02 (LJN), which purchased the Nanostring GeoMx Digital Spatial Profiler, NIH R61/R33 AG078520 (AB), R01 HL151740 (AB), T32 AG029796 (CML), T32 DK083250 (JPP), U54 AG076041 (AB, LJN), U54 AG079754 (AB, LJN), R01 AG063543 (LJN), R01 HL166843 (JWW), R01 AI165553 (JWW), and Glenn Foundation for Medical Research (DJB).
Footnotes
Competing Interests Statement
D.J.B. and J.Mv.D. have a potential financial interest related to this research. J.M.v.D. is a cofounder of Unity Biotechnology, D.J.B. and J.M.v.D. are co-inventors on patents held by Mayo Clinic and patent applications licensed to or filed by Unity Biotechnology, and D.J.B. and J.M.v.D. are Unity shareholders. Research in the Baker laboratory has been reviewed by the Mayo Clinic Conflict of Interest Review Board and is being conducted in compliance with Mayo Clinic Conflict of Interest policies. The other authors declare no conflict of interest.
Data availability
All data reported in this paper are available at https://doi.org/10.6084/m9.figshare.26236583.v1. The sequencing data have been deposited in NCBI’s Gene Expression Omnibus and are accessible through GEO Series accession number GSE278620 (https://www.ncbi.nlm.nih.gov/geo/query/acc.cgi?acc=GSE278620). All data are available from the corresponding author upon request.
References
- 1.Yuede CM et al. Interactions between stress and physical activity on Alzheimer’s disease pathology. Neurobiology of Stress 8, 158–171 (2018). [DOI] [PMC free article] [PubMed] [Google Scholar]
- 2.Hemmerle AM, Herman JP & Seroogy KB Stress, depression and Parkinson’s disease. Experimental Neurology 233, 79–86 (2012). [DOI] [PMC free article] [PubMed] [Google Scholar]
- 3.Gu HF, Tang CK & Yang YZ Psychological stress, immune response, and atherosclerosis. Atherosclerosis 223, 69–77 (2012). [DOI] [PubMed] [Google Scholar]
- 4.Harris ML et al. Stress increases the risk of type 2 diabetes onset in women: A 12-year longitudinal study using causal modelling. PLoS ONE 12, (2017). [DOI] [PMC free article] [PubMed] [Google Scholar]
- 5.Kivimäki M, Bartolomucci A & Kawachi I The multiple roles of life stress in metabolic disorders. Nature Reviews Endocrinology 2022 19:1 19, 10–27 (2022). [DOI] [PMC free article] [PubMed] [Google Scholar]
- 6.Razzoli M, Nyuyki-Dufe K, Chen BH & Bartolomucci A Contextual modifiers of healthspan, lifespan, and epigenome in mice under chronic social stress. Proceedings of the National Academy of Sciences of the United States of America 120, e2211755120 (2023). [DOI] [PMC free article] [PubMed] [Google Scholar]
- 7.Marzi SJ et al. Analysis of DNA Methylation in Young People: Limited Evidence for an Association Between Victimization Stress and Epigenetic Variation in Blood. The American journal of psychiatry 175, 517–529 (2018). [DOI] [PMC free article] [PubMed] [Google Scholar]
- 8.Epel ES & Prather A. A. Stress, Telomeres, and Psychopathology: Toward a Deeper Understanding of a Triad of Early Aging. Annual Review of Clinical Psychology 14, 371–397 (2018). [DOI] [PMC free article] [PubMed] [Google Scholar]
- 9.Lyons CE, Razzoli M & Bartolomucci A The impact of life stress on hallmarks of aging and accelerated senescence: Connections in sickness and in health. Neuroscience & Biobehavioral Reviews 153, 105359 (2023). [DOI] [PMC free article] [PubMed] [Google Scholar]
- 10.Ni Y et al. Activation of β2-adrenergic receptor stimulates γ-secretase activity and accelerates amyloid plaque formation. Nature Medicine 12, 1390–1396 (2006). [DOI] [PubMed] [Google Scholar]
- 11.Koolhaas JM et al. Stress revisited: A critical evaluation of the stress concept. Neuroscience & Biobehavioral Reviews 35, 1291–1301 (2011). [DOI] [PubMed] [Google Scholar]
- 12.Ulrich-Lai YM & Herman JP Neural regulation of endocrine and autonomic stress responses. Nature Reviews Neuroscience 10, 397–409 (2009). [DOI] [PMC free article] [PubMed] [Google Scholar]
- 13.Takahashi A, Flanigan ME, McEwen BS & Russo SJ Aggression, social stress, and the immune system in humans and animal models. Frontiers in Behavioral Neuroscience 12, 56–56 (2018). [DOI] [PMC free article] [PubMed] [Google Scholar]
- 14.Kivimäki M & Steptoe A Effects of stress on the development and progression of cardiovascular disease. Nature Reviews Cardiology 15, 215–229 (2018). [DOI] [PubMed] [Google Scholar]
- 15.Epel ES et al. Accelerated telomere shortening in response to life stress. Proceedings of the National Academy of Sciences of the United States of America 101, 17312–5 (2004). [DOI] [PMC free article] [PubMed] [Google Scholar]
- 16.Aschbacher K et al. Good stress, bad stress and oxidative stress: insights from anticipatory cortisol reactivity. Psychoneuroendocrinology 38, 1698–708 (2013). [DOI] [PMC free article] [PubMed] [Google Scholar]
- 17.Cherkas LF et al. The effects of social status on biological aging as measured by white-blood-cell telomere length. Aging Cell 5, 361–365 (2006). [DOI] [PubMed] [Google Scholar]
- 18.Mansur RB et al. Socioeconomic Disadvantage Moderates the Association between Peripheral Biomarkers and Childhood Psychopathology. (2016) doi: 10.1371/journal.pone.0160455. [DOI] [PMC free article] [PubMed] [Google Scholar]
- 19.Rentscher KE et al. Chronic stress exposure and daily stress appraisals relate to biological aging marker p16 INK4a. Psychoneuroendocrinology 102, 139–148 (2019). [DOI] [PMC free article] [PubMed] [Google Scholar]
- 20.Razzoli M et al. Social stress shortens lifespan in mice. Aging cell 17, e12778 (2018). [DOI] [PMC free article] [PubMed] [Google Scholar]
- 21.Demaria M et al. An essential role for senescent cells in optimal wound healing through secretion of PDGF-AA. Developmental cell 31, 722–33 (2014). [DOI] [PMC free article] [PubMed] [Google Scholar]
- 22.Grosse L et al. Defined p16High Senescent Cell Types Are Indispensable for Mouse Healthspan. Cell Metabolism 32, 87–99.e6 (2020). [DOI] [PubMed] [Google Scholar]
- 23.Childs BG et al. Senescent intimal foam cells are deleterious at all stages of atherosclerosis. Science (New York, N.Y.) 354, 472–477 (2016). [DOI] [PMC free article] [PubMed] [Google Scholar]
- 24.Bussian TJ et al. Clearance of senescent glial cells prevents tau-dependent pathology and cognitive decline. Nature 562, 578–582 (2018). [DOI] [PMC free article] [PubMed] [Google Scholar]
- 25.Jeon OH et al. Local clearance of senescent cells attenuates the development of post-traumatic osteoarthritis and creates a pro-regenerative environment. Nature medicine 23, 775–781 (2017). [DOI] [PMC free article] [PubMed] [Google Scholar]
- 26.Musi N et al. Tau protein aggregation is associated with cellular senescence in the brain. Aging Cell e12840 (2018) doi: 10.1111/acel.12840. [DOI] [PMC free article] [PubMed] [Google Scholar]
- 27.Zhang P et al. Senolytic therapy alleviates Aβ-associated oligodendrocyte progenitor cell senescence and cognitive deficits in an Alzheimer’s disease model. Nature neuroscience 22, 719–728 (2019). [DOI] [PMC free article] [PubMed] [Google Scholar]
- 28.de Magalhães JP Cellular senescence in normal physiology. Science 384, 1300–1301 (2024). [DOI] [PubMed] [Google Scholar]
- 29.Gorgoulis V et al. Cellular Senescence: Defining a Path Forward. Cell vol. 179 813–827 Preprint at 10.1016/j.cell.2019.10.005 (2019). [DOI] [PubMed] [Google Scholar]
- 30.Suryadevara V et al. SenNet recommendations for detecting senescent cells in different tissues. Nat Rev Mol Cell Biol (2024) doi: 10.1038/s41580-024-00738-8. [DOI] [PMC free article] [PubMed] [Google Scholar]
- 31.Rodier F et al. Persistent DNA damage signalling triggers senescence-associated inflammatory cytokine secretion. Nature cell biology 11, 973–9 (2009). [DOI] [PMC free article] [PubMed] [Google Scholar]
- 32.Coppé J-P, Desprez P-Y, Krtolica A & Campisi J The senescence-associated secretory phenotype: the dark side of tumor suppression. Annual review of pathology 5, 99–118 (2010). [DOI] [PMC free article] [PubMed] [Google Scholar]
- 33.Campisi J & d’Adda di Fagagna F Cellular senescence: when bad things happen to good cells. Nature Reviews Molecular Cell Biology 8, 729–740 (2007). [DOI] [PubMed] [Google Scholar]
- 34.Lin AW et al. Premature senescence involving p53 and p16 is activated in response to constitutive MEK/MAPK mitogenic signaling. Genes and Development 12, 3008–3019 (1998). [DOI] [PMC free article] [PubMed] [Google Scholar]
- 35.Di Micco R et al. Oncogene-induced senescence is a DNA damage response triggered by DNA hyper-replication. Nature 444, 638–642 (2006). [DOI] [PubMed] [Google Scholar]
- 36.Muñoz-Espín D et al. Programmed cell senescence during mammalian embryonic development. Cell 155, 1104 (2013). [DOI] [PubMed] [Google Scholar]
- 37.Ferrucci L & Fabbri E Inflammageing: chronic inflammation in ageing, cardiovascular disease, and frailty. Nature Reviews Cardiology 15, 505–522 (2018). [DOI] [PMC free article] [PubMed] [Google Scholar]
- 38.Gonzales MM et al. Senolytic therapy in mild Alzheimer’s disease: a phase 1 feasibility trial. Nat Med 29, 2481–2488 (2023). [DOI] [PMC free article] [PubMed] [Google Scholar]
- 39.Lin Y et al. Circulating monocytes expressing senescence-associated features are enriched in COVID-19 patients with severe disease. Aging Cell 22, e14011 (2023). [DOI] [PMC free article] [PubMed] [Google Scholar]
- 40.Robbins PD et al. Senolytic Drugs: Reducing Senescent Cell Viability to Extend Health Span. Annual Review of Pharmacology and Toxicology 61, 779–803 (2021). [DOI] [PMC free article] [PubMed] [Google Scholar]
- 41.Kim EC & Kim J. R. Senotherapeutics: emerging strategy for healthy aging and age-related disease. BMB Reports 52, 47 (2019). [DOI] [PMC free article] [PubMed] [Google Scholar]
- 42.Childs BG et al. Senescent cells: An emerging target for diseases of ageing. Nature Reviews Drug Discovery 16, 718–735 (2017). [DOI] [PMC free article] [PubMed] [Google Scholar]
- 43.Buynitsky T & Mostofsky DI Restraint stress in biobehavioral research: Recent developments. Neuroscience & Biobehavioral Reviews 33, 1089–1098 (2009). [DOI] [PubMed] [Google Scholar]
- 44.Razzoli M, Karsten C, Yoder JM, Bartolomucci A & Engeland WC Chronic subordination stress phase advances adrenal and anterior pituitary clock gene rhythms. American journal of physiology. Regulatory, integrative and comparative physiology 307, R198–205 (2014). [DOI] [PMC free article] [PubMed] [Google Scholar]
- 45.Razzoli M et al. Social stress is lethal in the mdx model of Duchenne muscular dystrophy. EBioMedicine 55, 102700 (2020). [DOI] [PMC free article] [PubMed] [Google Scholar]
- 46.Bartolomucci A et al. Behavioral and physiological characterization of male mice under chronic psychosocial stress. Psychoneuroendocrinology 29, 899–910 (2004). [DOI] [PubMed] [Google Scholar]
- 47.Sanghez V et al. Psychosocial stress induces hyperphagia and exacerbates diet-induced insulin resistance and the manifestations of the Metabolic Syndrome. Psychoneuroendocrinology 38, 2933–2942 (2013). [DOI] [PubMed] [Google Scholar]
- 48.Cherry C et al. Transfer learning in a biomaterial fibrosis model identifies in vivo senescence heterogeneity and contributions to vascularization and matrix production across species and diverse pathologies. GeroScience (2023) doi: 10.1007/S11357-023-00785-7. [DOI] [PMC free article] [PubMed] [Google Scholar]
- 49.Liu Y et al. Expression of p16INK4a in peripheral blood T-cells is a biomarker of human aging. Aging Cell 8, 439–448 (2009). [DOI] [PMC free article] [PubMed] [Google Scholar]
- 50.Dimri GP et al. A biomarker that identifies senescent human cells in culture and in aging skin in vivo. Proceedings of the National Academy of Sciences of the United States of America 92, 9363–7 (1995). [DOI] [PMC free article] [PubMed] [Google Scholar]
- 51.Schafer MJ et al. Exercise Prevents Diet-Induced Cellular Senescence in Adipose Tissue. Diabetes 65, 1606–15 (2016). [DOI] [PMC free article] [PubMed] [Google Scholar]
- 52.Piechota M et al. Is senescence-associated β-galactosidase a marker of neuronal senescence? Oncotarget 7, 81099 (2016). [DOI] [PMC free article] [PubMed] [Google Scholar]
- 53.Ogrodnik M et al. Whole-body senescent cell clearance alleviates age-related brain inflammation and cognitive impairment in mice. Aging Cell 20, e13296 (2021). [DOI] [PMC free article] [PubMed] [Google Scholar]
- 54.Omori S et al. Generation of a p16 Reporter Mouse and Its Use to Characterize and Target p16high Cells In Vivo. Cell Metabolism 32, 814–828.e6 (2020). [DOI] [PubMed] [Google Scholar]
- 55.Gurkar AU et al. Spatial mapping of cellular senescence: emerging challenges and opportunities. Nature aging 3, 776–790 (2023). [DOI] [PMC free article] [PubMed] [Google Scholar]
- 56.Bobba-Alves N et al. Cellular Allostatic Load is linked to Increased Energy Expenditure and Accelerated Biological Aging. Psychoneuroendocrinology 106322 (2023) doi: 10.1016/j.psyneuen.2023.106322. [DOI] [PMC free article] [PubMed] [Google Scholar]
- 57.Razzoli M & Bartolomucci A The Dichotomous Effect of Chronic Stress on Obesity. Trends in Endocrinology and Metabolism 27, (2016). [DOI] [PMC free article] [PubMed] [Google Scholar]
- 58.Saul D et al. A new gene set identifies senescent cells and predicts senescence-associated pathways across tissues. Nature Communications 13, (2022). [DOI] [PMC free article] [PubMed] [Google Scholar]
- 59.Hernandez-Segura A et al. Unmasking Transcriptional Heterogeneity in Senescent Cells. Current Biology 27, 2652–2660.e4 (2017). [DOI] [PMC free article] [PubMed] [Google Scholar]
- 60.Steptoe A & Zaninotto P Lower socioeconomic status and the acceleration of aging: An outcome-wide analysis. Proceedings of the National Academy of Sciences of the United States of America 117, 14911–14917 (2020). [DOI] [PMC free article] [PubMed] [Google Scholar]
- 61.López-Otín C, Blasco MA, Partridge L, Serrano M & Kroemer G Hallmarks of aging: An expanding universe. Cell 0, (2023). [DOI] [PubMed] [Google Scholar]
- 62.Olave FA et al. Chronic restraint stress produces sex-specific behavioral and molecular outcomes in the dorsal and ventral rat hippocampus. Neurobiol Stress 17, 100440 (2022). [DOI] [PMC free article] [PubMed] [Google Scholar]
- 63.Galea LAM et al. Sex differences in dendritic atrophy of CA3 pyramidal neurons in response to chronic restraint stress. Neuroscience 81, 689–697 (1997). [DOI] [PubMed] [Google Scholar]
- 64.Smith A et al. Metabolic, neuroendocrine and behavioral effects of social defeat in male and female mice using the chronic non-discriminatory social defeat stress model. Horm Behav 155, 105412 (2023). [DOI] [PubMed] [Google Scholar]
- 65.Harris AZ et al. A Novel Method for Chronic Social Defeat Stress in Female Mice. Neuropsychopharmacology 43, 1276–1283 (2018). [DOI] [PMC free article] [PubMed] [Google Scholar]
- 66.Takahashi A et al. Establishment of a repeated social defeat stress model in female mice. Scientific reports 7, 12838–12838 (2017). [DOI] [PMC free article] [PubMed] [Google Scholar]
- 67.Snyder-Mackler N et al. Social determinants of health and survival in humans and other animals. Science 368, (2020). [DOI] [PMC free article] [PubMed] [Google Scholar]
- 68.Molina P, Andero R & Armario A Restraint or immobilization: A comparison of methodologies for restricting free movement in rodents and their potential impact on physiology and behavior. Neuroscience & Biobehavioral Reviews 151, 105224 (2023). [DOI] [PubMed] [Google Scholar]
- 69.Atrooz F, Alkadhi KA & Salim S Understanding stress: Insights from rodent models. Current Research in Neurobiology 2, 100013 (2021). [DOI] [PMC free article] [PubMed] [Google Scholar]
- 70.Lyons CE, Razzoli M & Bartolomucci A The impact of life stress on hallmarks of aging and accelerated senescence: connections in sickness and in health. Neuroscience & Biobehavioral Reviews under review (2023). [DOI] [PMC free article] [PubMed] [Google Scholar]
- 71.Nascaa C et al. Stress dynamically regulates behavior and glutamatergic gene expression in hippocampus by opening a window of epigenetic plasticity. Proceedings of the National Academy of Sciences of the United States of America 112, 14960–14965 (2015). [DOI] [PMC free article] [PubMed] [Google Scholar]
- 72.Herdy JR et al. Increased post-mitotic senescence in aged human neurons is a pathological feature of Alzheimer’s disease. Cell Stem Cell 29, 1637–1652.e6 (2022). [DOI] [PMC free article] [PubMed] [Google Scholar]
- 73.Melo dos Santos LS, Trombetta-Lima M, Eggen BJL & Demaria M Cellular senescence in brain aging and neurodegeneration. Ageing Research Reviews 93, 102141 (2024). [DOI] [PubMed] [Google Scholar]
- 74.Herdy JR, Mertens J & Gage FH Neuronal senescence may drive brain aging. Science 384, 1404–1406 (2024). [DOI] [PMC free article] [PubMed] [Google Scholar]
- 75.Kang C et al. The DNA damage response induces inflammation and senescence by inhibiting autophagy of GATA4. Science (New York, N.Y.) 349, aaa5612 (2015). [DOI] [PMC free article] [PubMed] [Google Scholar]
- 76.Molofsky AV et al. Increasing p16INK4a expression decreases forebrain progenitors and neurogenesis during ageing. Nature 2006 443:7110 443, 448–452 (2006). [DOI] [PMC free article] [PubMed] [Google Scholar]
- 77.Eskiocak S et al. Glutathione and free sulphydryl content of seminal plasma in healthy medical students during and after exam stress. Human reproduction (Oxford, England) 20, 2595–2600 (2005). [DOI] [PubMed] [Google Scholar]
- 78.Bagchi M et al. Acute and chronic stress-induced oxidative gastrointestinal injury in rats, and the protective ability of a novel grape seed proanthocyanidin extract. Nutrition Research 19, 1189–1199 (1999). [Google Scholar]
- 79.Rezatabar S et al. RAS/MAPK signaling functions in oxidative stress, DNA damage response and cancer progression. Journal of Cellular Physiology 234, 14951–14965 (2019). [DOI] [PubMed] [Google Scholar]
- 80.Colaianna M et al. Neuroendocrine Profile in a Rat Model of Psychosocial Stress: Relation to Oxidative Stress. Antioxidants & Redox Signaling 18, 1385 (2013). [DOI] [PMC free article] [PubMed] [Google Scholar]
- 81.Schiavone S et al. NADPH oxidase elevations in pyramidal neurons drive psychosocial stress-induced neuropathology. Translational Psychiatry 2, 111 (2012). [DOI] [PMC free article] [PubMed] [Google Scholar]
- 82.Son SW et al. Testosterone depletion increases the susceptibility of brain tissue to oxidative damage in a restraint stress mouse model. Journal of Neurochemistry 136, 106–117 (2016). [DOI] [PubMed] [Google Scholar]
- 83.Coppé JP et al. Tumor suppressor and aging biomarker p16 INK4a induces cellular senescence without the associated inflammatory secretory phenotype. Journal of Biological Chemistry 286, 36396–36403 (2011). [DOI] [PMC free article] [PubMed] [Google Scholar]
- 84.Kwon HS & Koh SH Neuroinflammation in neurodegenerative disorders: the roles of microglia and astrocytes. Translational Neurodegeneration 9, 1–12 (2020). [DOI] [PMC free article] [PubMed] [Google Scholar]
- 85.Sebastian-Valverde M & Pasinetti GM The NLRP3 inflammasome as a critical actor in the inflammaging process. Cells 9, 1–28 (2020). [DOI] [PMC free article] [PubMed] [Google Scholar]
- 86.Cole SW The Conserved Transcriptional Response to Adversity. Current Opinion in Behavioral Sciences 28, 31–37 (2019). [DOI] [PMC free article] [PubMed] [Google Scholar]
- 87.Torrance BL et al. Cellular senescence is a double-edged sword in regulating aged immune responses to influenza. Aging Cell n/a, e14162. [DOI] [PMC free article] [PubMed] [Google Scholar]
- 88.Lyons CE et al. Chronic Social and Psychological Stress Impact Select Neuropathologies in the PS19 Mouse Model of Tauopathy. Psychosom Med 86, 366–378 (2024). [DOI] [PMC free article] [PubMed] [Google Scholar]
- 89.Whitehead JC et al. A clinical frailty index in aging mice: Comparisons with frailty index data in humans. Journals of Gerontology - Series A Biological Sciences and Medical Sciences 69, 621–632 (2014). [DOI] [PMC free article] [PubMed] [Google Scholar]
- 90.Erben L, He M-X, Laeremans A, Park E & Buonanno A A Novel Ultrasensitive In Situ Hybridization Approach to Detect Short Sequences and Splice Variants with Cellular Resolution. Molecular Neurobiology 2017 55:7 55, 6169–6181 (2017). [DOI] [PMC free article] [PubMed] [Google Scholar]
Associated Data
This section collects any data citations, data availability statements, or supplementary materials included in this article.
Supplementary Materials
Data Availability Statement
All data reported in this paper are available at https://doi.org/10.6084/m9.figshare.26236583.v1. The sequencing data have been deposited in NCBI’s Gene Expression Omnibus and are accessible through GEO Series accession number GSE278620 (https://www.ncbi.nlm.nih.gov/geo/query/acc.cgi?acc=GSE278620). All data are available from the corresponding author upon request.