



Summary
Bayesian sparse factor models have proven useful for characterizing dependence in multivariate data, but scaling computation to large numbers of samples and dimensions is problematic. We propose expandable factor analysis for scalable inference in factor models when the number of factors is unknown. The method relies on a continuous shrinkage prior for efficient maximum a posteriori estimation of a low-rank and sparse loadings matrix. The structure of the prior leads to an estimation algorithm that accommodates uncertainty in the number of factors. We propose an information criterion to select the hyperparameters of the prior. Expandable factor analysis has better false discovery rates and true positive rates than its competitors across diverse simulation settings. We apply the proposed approach to a gene expression study of ageing in mice, demonstrating superior results relative to four competing methods.
Keywords: Expectation-maximization algorithm, Factor analysis, Shrinkage prior, Sparsity, Variable selection
1. Introduction
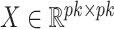
Factor analysis is a popular approach to modelling covariance matrices. Letting  ,
 and
 denote the true number of factors, number of dimensions and
 covariance matrix, respectively, factor models set
 , where
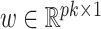
 is the loadings matrix and
 is a diagonal matrix of positive residual variances. To allow computation to scale to large
 ,
 is commonly assumed to be of low rank and sparse. These assumptions imply that
 and the number of nonzero loadings is small. A practical problem is that
 and the locations of zeros in
 are unknown. A number of Bayesian approaches exist to model this uncertainty in
 and sparsity (Carvalho et al., 2008; Knowles & Ghahramani, 2011), but conventional approaches that rely on posterior sampling are intractable for large sample sizes
 and dimensions
 . Continuous shrinkage priors have been proposed that lead to computationally efficient sampling algorithms (Bhattacharya & Dunson, 2011), but the focus is on estimating
 , with
 treated as a nonidentifiable nuisance parameter. Our goal is to develop a computationally tractable approach for inference on
 that models the uncertainty in
 and the locations of zeros in
 . To do this, we propose a novel shrinkage prior and a corresponding class of efficient inference algorithms for factor analysis.
Penalized likelihood methods provide computationally efficient approaches for point estimation of  and
 . If
 is known, then many such methods exist (Kneip & Sarda, 2011; Bai & Li, 2012). Sparse principal components analysis estimates a sparse
 assuming
 , where
 is the
 identity matrix (Jolliffe et al., 2003; Zou et al., 2006; Shen & Huang, 2008; Witten et al., 2009). The assumptions of spherical residual covariance and known
 are restrictive in practice. There are several approaches to estimating
 . In econometrics, it is popular to rely on test statistics based on the eigenvalues of the empirical covariance matrix (Onatski, 2009; Ahn & Horenstein, 2013). It is also common to fit the model for different choices of
 , and choose the best value based on an information criterion (Bai & Ng, 2002). Recent approaches instead use the trace norm or the sum of column norms of
 as a penalty in the objective function to estimate
 (Caner & Han, 2014). Alternatively, Ročková & George (2016) use a spike-and-slab prior to induce sparsity in
 with an Indian buffet process allowing uncertainty in
 ; a parameter-expanded expectation-maximization algorithm is then used for estimation.
We propose a Bayesian approach for estimation of a low-rank and sparse  , allowing
 to be unknown. Our approach relies on a novel multi-scale generalized double Pareto prior, inspired by the generalized double Pareto prior for variable selection (Armagan et al., 2013) and by the multiplicative gamma process prior for loadings matrices (Bhattacharya & Dunson, 2011). The latter approach focuses on estimation of
 , but does not explicitly estimate
 or
 . The proposed prior leads to an efficient and scalable computational algorithm for obtaining a sparse estimate of
 with appealing practical and theoretical properties. We refer to our method as expandable factor analysis because it allows the number of factors to increase as more dimensions are added and as
 increases.
Expandable factor analysis combines the representational strengths of Bayesian approaches with the computational benefits of penalized likelihood methods. The multi-scale generalized double Pareto prior is concentrated near low-rank matrices; in particular, a high probability is placed around matrices with rank  . Local linear approximation of the penalty imposed by the prior equals a sum of weighted
 penalties on the elements of
 . This facilitates maximum a posteriori estimation of a sparse
 using an extension of the coordinate descent algorithm for weighted
 -regularized regression (Zou & Li, 2008). The hyperparameters of our prior are selected using a version of the Bayesian information criterion for factor analysis. Under the theoretical set-up for high-dimensional factor analysis in Kneip & Sarda (2011), we show that the estimates of loadings are consistent and that the estimates of nonzero loadings are asymptotically normal.
2. Expandable factor analysis
2.1. Factor analysis model
Consider the usual factor model. Let  ,
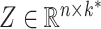 and
 be the mean-centred data matrix, latent factor matrix and residual error matrix, respectively, where
 and
 are unknown. We use index
 for samples, index
 for dimensions, and index
 for factors. If
 is the residual error variance matrix, then the factor model for
 is
| (1) |
where  and
 are independent
 . Equivalently,
| (2) |
for sample  and

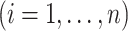 . Similarly, model (1) reduces to regression in the space of latent factors
| (3) |
for dimension 
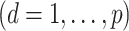 . Unlike usual regression, the design matrix
 in (3) is unknown.
Penalized estimation of  is typically based on (2) or (3). The loss is estimated as the regression-type squared error after imputing
 using the eigendecomposition of the empirical covariance matrix
 or an expectation-maximization algorithm. The choice of penalty on
 presents a variety of options. If the goal is to select factors that affect any of the
 variables, then the sum of column norms of
 can be used as a penalty; a recent example is the group bridge penalty,
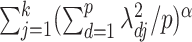 , where
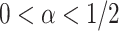 and
 is an upper bound on
 . The selected factors correspond to the nonzero columns of the estimated
 (Caner & Han, 2014). To further obtain elementwise sparsity, a nonconcave variable selection penalty can be applied to the elements in
 . The estimate of
 depends on the choice of criterion for selecting the tuning parameters (Hirose & Yamamoto, 2015).
Our expandable factor analysis differs from this typical approach in several important ways. We start from a Bayesian perspective, and place a prior on  that is structured to allow uncertainty in
 while shrinking towards loadings matrices with many zeros and
 . If
 is an upper bound on
 , then the prior is designed to automatically allow a slow rate of growth in
 as the number of dimensions
 increases by concentrating in neighbourhoods of matrices with rank bounded above by
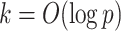 . To our knowledge, this is a unique feature of our approach, justifying its name. Expandability is an appealing characteristic, as more factors should be needed to accurately model the dependence structure as the dimension of the data increases.
2.2. Multi-scale generalized double Pareto prior
We would like to design a prior on  such that maximum a posteriori estimates of
 have the following four characteristics:
(a) the estimate of a loading with large magnitude should be nearly unbiased;
(b) a thresholding rule, such as soft-thresholding, is used to estimate the loadings so that loadings estimates with small magnitudes are automatically set to zero;
(c) the estimator of any loading is continuous in the data to limit instability; and
(d) the
 -norm of the
 th column of the estimated
 does not increase as
 increases.
The first three properties are related to nonconcave variable selection (Fan & Li, 2001). Properties (b) and (d) together ensure existence of a column index after which all estimated loadings are identically zero. Automatic relevance determination and multiplicative gamma process priors satisfy (d) but fail to satisfy (b). No existing prior for loadings matrices satisfies properties (a)–(d) simultaneously (Carvalho et al., 2008; Bhattacharya & Dunson, 2011; Knowles & Ghahramani, 2011).
In order to satisfy these four properties and obtain a computationally efficient inference procedure, it is convenient to start with a prior for a loadings matrix  having infinitely many columns; in practice, all of the elements will be estimated to be zero after a finite column index that corresponds to the estimated number of factors. Bhattacharya & Dunson (2011) showed that the set of loadings matrices
 that leads to well-defined covariance matrices is
We propose a multi-scale generalized double Pareto prior for  having support on
 . This prior is constructed to concentrate near low-rank matrices, placing high probability around matrices with rank at most
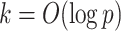 .
The multi-scale generalized double Pareto prior on  specifies independent generalized double Pareto priors on
 (
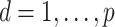 ;
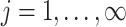 ) so that the density of
 is
| (4) |
where 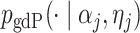 is the generalized double Pareto density with parameters
 and
 (Armagan et al., 2013). This prior on
 ensures that properties (a)–(c) are satisfied. Property (d) is satisfied by choosing parameter sequences
 and
 (
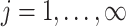 ) such that two conditions hold: the prior measure
 on
 has density
 in (4), and
 has
 as its support. These conditions hold for the form of
 and
 (
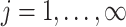 ) specified by the following lemma.
Lemma 1
If
,
(
) and
, then
.
The proof is given in the Supplementary Material, along with the other proofs.
As in Bhattacharya & Dunson (2011), we truncate to a finite number of columns for tractable computation. This truncation is accomplished by mapping  to
 , with
 retaining the first
 columns of
 . The choice of
 is such that
 is arbitrarily close to
 , where distance between
 and
 is measured using the
 -norm of their elementwise difference. In addition, for computational convenience, we assume that the hyperparameters
 and
 (
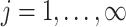 ) are analytic functions of the parameters
 and
 , respectively, with these functions satisfying the conditions of Lemma 1.
The following lemma defines the forms of  and
 (
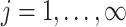 ) in terms of
 and
 .
Lemma 2
If
,
,
and
for
, then
, where
has density
in (4) with hyperparameters
and
(
). Furthermore, given
, there exists a positive integer
for every
such that for all
,
,
(
) and
, we have that
where
.
The penalty imposed on the loadings by the prior grows exponentially with  as the column index increases. This property of the prior ensures that all the loadings are estimated to be zero after a finite column index, which corresponds to the estimated number of factors.
3. Estimation algorithm
3.1. Expectation-maximization algorithm
We rely on an adaptation of the expectation-maximization algorithm to estimate  and
 . Choose a positive integer
 of order
 as the upper bound on
 ; the estimate of the number of factors will be less than or equal to
 . The results are not sensitive to the choice of
 due to the properties of the multi-scale generalized double Pareto prior, provided
 is sufficiently large. If
 is too small, then the estimated number of factors will be equal to the upper bound, suggesting that this bound should be increased. Given
 , define
 and
 (
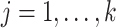 ) as in Lemma 2, with
 and
 being prespecified constants.
We present the objective function as a starting point for developing the coordinate descent algorithm and provide derivations in the Supplementary Material. Let  and
 , where the superscript
 denotes an estimate at iteration
 and
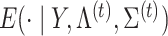 denotes the conditional expectation given
 ,
 and
 based on (1). The objective function for parameter updates in iteration
 is
| (5) |
where 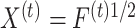 and
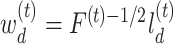 (
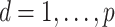 ).
3.2. Estimating parameters using a convex objective function
The objective (5) is written as a sum of  terms. The
 th term corresponds to the objective function for the regularized estimation of the
 th row of the loadings matrix,
 , with a specific form of log penalty on
 (Zou & Li, 2008). Local linear approximation at
 of the log penalty on
 in (5) implies that each row of
 is estimated separately at iteration
 :
| (6) |
This problem corresponds to regularized estimation of regression coefficients  with
 as the response,
 as the design matrix,
 as the error variance, and a weighted
 penalty on
 .
The solution to (6) is found using block coordinate descent. Let column  of
 and row
 of
 without the
 th element be written as
 and
 . Then the update to estimate
 is
| (7) |
where 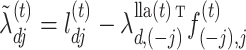 and
 . Fix
 at
 in (5) to update
 in iteration
 as
| (8) |
If any root- -consistent estimate of
 is used instead of
 in (6), then it acts as a warm starting point for the estimation algorithm. This leads to a consistent estimate of
 in one step of coordinate descent (Zou & Li, 2008). An implementation of this approach for known values of
 and
 is summarized in steps (i)–(iv) of Algorithm 1 using the R (R Development Core Team, 2017) package glmnet (Friedman et al., 2010).
Algorithm 1
Estimation algorithm for expandable factor analysis.
Notation :
1.
is the diagonal matrix containing diagonal elements of a symmetric matrix
.
2. Chol(
) is the upper triangular Cholesky factorization of a symmetric positive-definite matrix
.
3.
is a block-diagonal matrix with
forming the diagonal blocks.
4.
, where
.
Input :
1. Data
and upper bound
on the rank of the loadings matrix.
2. The
-
grid with
grid indices (
;
).
Do :
1. Centre data about their mean
(
;
).
2. Let
. Then estimate eigenvalues and eigenvectors of
:
and
.
3. Define
to be the matrix
.
4. Begin estimation of
,
and
across the
-
grid:
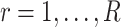
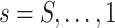
For
For
(i) Define
,
if
, and
if
(
).
(iv) Estimate
in (7) and
in (8) using the R package glmnet in three steps:
result
glmnet
x =
, y =
, weights =
, intercept = FALSE,
standardize = FALSE, penalty.factor =
.

coef
result, s =
, exact = TRUE
[-1, ].

(
).
(v) Set
,
,
, and estimate the posterior weight
in (10).
End for.
Set
.
End for.
5. Obtain grid index
for the estimate of
, where
Return :
,
and
.



The estimate of  obtained using (7) satisfies properties (a)–(d) described earlier. The adaptive threshold
 in (7) ensures that property (a) is satisfied. The soft-thresholding rule to estimate
 ensures that property (b) is satisfied. The local linear approximation (6) has continuous first derivatives in the parameter space excluding zero, so property (c) is also satisfied (Zou & Li, 2008). The
 estimate satisfies property (d) due to the structured penalty imposed by the prior.
We comment briefly on the choice of prior and uncertainty quantification. We build on the generalized double Pareto prior instead of other shrinkage priors not only because the estimate of  satisfies properties (a)–(d), but also because local linear approximation of the resulting penalty has a weighted
 form. We exploit this for efficient computations and use a warm starting point to estimate a sparse
 in one step using Algorithm 1. Uncertainty estimates of the nonzero loadings are obtained from Laplace approximation, and the remaining loadings are estimated as zero without uncertainty quantification.
3.3. Root- -consistent estimate of

The root- -consistent estimate of
 exists under Assumptions A0–A4 given in the Appendix. If
 and
 (
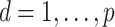 ) are the eigenvalues and eigenvectors of the empirical covariance matrix
 , then
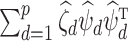 is the eigendecomposition of
 . It is known that
 is a root-
 -consistent estimator of
 if
 is fixed and
 . If
 ,
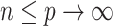 and
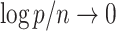 , then
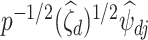 is a root-
 -consistent estimator of
 ; see the Supplementary Material for a proof. Scaling by
 is required because the largest eigenvalue of
 tends to infinity as
 (Kneip & Sarda, 2011). This scaling does not change our estimation algorithm for
 in (7), except that
 is changed to
 (
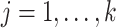 ).
3.4. Bayesian information criterion to select  and

The parameter estimates in (7) and (8) depend on the hyperparameters through  and
 , both of which are unknown. To estimate
 and
 , we use a grid search. Let
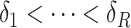 and
 form a
 -
 grid. If
 is the value of (
 ,
 ) at grid index
 , then
 and

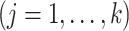 are the hyperparameters of our prior defined using Lemma 2, and
 and
 are the parameter estimates based on this prior. Algorithm 1 first estimates
 and
 for every
 by choosing warm starting points and then estimates (
 ,
 ) using all the estimated
 and
 . These two steps in the estimation of (
 ,
 ) are described next.
The structured penalty imposed by our prior implies that  has the maximum number of nonzero loadings. Algorithm 1 exploits this structure by first estimating
 and then other loadings matrices along the
 -
 grid by successively thresholding nonzero loadings in
 to 0. Let
 be the set that contains the locations of nonzero loadings in
 . The estimation path of Algorithm 1 across the
 -
 grid is such that
 (
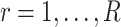 ) and
 .
After the estimation of  and

 ,
 is set to
 if
 has the maximum posterior probability. Let
 be the cardinality of set
 . Given
 , there are
 loadings matrices that have
 nonzero loadings but differ in the locations of the nonzero loadings. Assuming that each of these matrices is equally likely to represent the locations of nonzero loadings in the true loadings matrix, the prior for
 is
| (9) |
Let  be the posterior probability of
 . Then an asymptotic approximation to
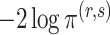 is
| (10) |
if terms of order smaller than 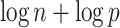 are ignored, where
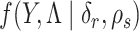 is the joint density of
 and
 based on (1). The first term in (10) measures the goodness-of-fit, and the last two terms penalize complexity of a factor model with
 samples and
 loadings with the locations of nonzero loadings in
 . Theorem 3 in the next section shows that
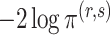 and
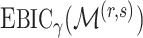 have the same asymptotic order under certain regularity assumptions, where
 is the extended Bayesian information criteria of Chen & Chen (2008) and
 is an unknown constant. The analytic forms of
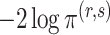 and
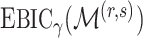 are the same when
 and terms of order smaller than
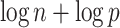 are ignored, so we use
 for estimating
 in our numerical experiments.
4. Theoretical properties
Let  and
 be the fixed points of
 and
 The updates (7) and (8) define the map
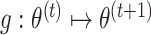 , where
 . The following theorem shows that our estimation algorithm retains the convergence properties of the expectation-maximization algorithm.
Theorem 1
If
represents the objective (5), then
does not decrease at every iteration. Let
be the local linear approximation of (5). Assume that
only for stationary points of
; then the sequence
converges to its stationary point
.
Let  be the true loadings matrix and
 the residual variance matrix. We define
 (
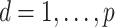 ;
 ) and express
 as having
 columns. The locations of true nonzero loadings are in the set
 . Let
 and
 be the estimates of
 and
 obtained using our estimation algorithm for a specific choice of
 and
 (
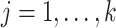 ); then
 is an estimator of
 . If
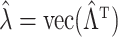 and
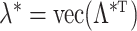 , then
 and
 retain elements of
 and
 with indices in the set
 . The following theorem specifies the asymptotic properties of
 ,
 and
 .
Theorem 2
Suppose that Assumptions A0–A6 in the Appendix hold and that
,
and
. Then, for any
and
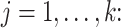
(i)
,
and
are consistent estimators of
,
and
, respectively

(ii)
and
in distribution, where
is a
symmetric positive-definite matrix and
.
Theorem 2 holds for any multi-scale generalized double Pareto prior with hyperparameters  and
 (
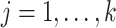 ) that satisfies Assumption 5. In practice, the estimate of
 depends on the choice of
 and
 . Restricting the search to the hyperparameters indexed along the
 -
 grid, Algorithm 1 sets the values of the hyperparameters to
 and
 (
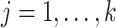 ), where
 achieves its maximum at grid index
 . The following theorem justifies this method of selecting hyperparameters and shows the asymptotic relationship between
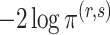 and
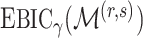 .
Theorem 3
Suppose that the generalized double Pareto prior with hyperparameters defined using
leads to estimation of
. Let
be another set that contains the locations of nonzero loadings in an estimated
for a given
. Define
and
. If Assumptions A0–A7 in the Appendix hold, then for any
such that

(i)
in probability as

(ii)
as
.
Let  be a point on the
 -
 grid that leads to estimation of
 . Then, Theorem 3 shows that Algorithm 1 selects
 with probability tending to 1 because
 will be larger than any
 where
 is such that
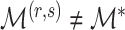 .
5. Data analysis
5.1. Set-up and comparison metrics
We compared our method with those of Caner & Han (2014), Hirose & Yamamoto (2015), Ročková & George (2016) and Witten et al. (2009). The first competitor was developed to estimate the rank of  , and the last three competitors were developed to estimate
 . We used two versions of Roǎková and George’s method. The first version uses the expectation-maximization algorithm developed in Ročková & George (2016), and the second version adds an extra step in every iteration of the algorithm that rotates the loadings matrix using the varimax criterion.
We evaluated the performance of the methods for estimating  on simulated data using the root mean square error, proportion of true positives, and proportion of false discoveries:
where  and
 are the true and estimated loadings matrices and
 and
 are the true and estimated locations of nonzero loadings. We assume that
 for any
 and
 . Since
 and
 could differ in sign, mean square error compared their magnitudes.
5.2. Simulated data analysis
The simulation settings were based on examples in Kneip & Sarda (2011). The number of dimensions varied among  . The rank of every simulated loadings matrix was fixed at
 . The magnitudes of nonzero loadings in a column were equal and decreased as
 ,
 ,
 ,
 and
 from the first to the fifth column. The signs of the nonzero loadings were chosen such that the columns of any loadings matrix were orthogonal, with a small fraction of overlapping nonzero loadings between adjacent columns:
The error variances  increased linearly from
 to
 for
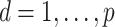 . With varying sample sizes
 , data were simulated using model (1) for all combinations of
 and
 . The simulation set-up was replicated ten times and all five methods were applied in every replication by fixing the upper bound on the number of factors at
 . The
 -
 grid had dimensions
 , and
 increased linearly from
 to
 while
 increased linearly from
 to
 when
 and from
 to
 when
 .
All five methods had the same computational complexity of  for one iteration, but their runtimes differed depending on their implementations, with the method of Witten et al. (2009) being the fastest. Figure 1 shows that Hirose and Yamamoto’s method and both versions of Roǎková and George’s method significantly overestimated
 for large
 . The method of Witten et al. slightly overestimated
 across all settings. Caner and Han’s method showed excellent performance and accurately estimated
 across all simulation settings, except when
 and
 or
 . When
 was larger than 500, Assumption A4 was satisfied and our method accurately estimated
 as 5 in every setting, performing better than Caner and Han’s method when
 .
Fig. 1.

Rank estimate averaged across simulation replications for the methods of Caner & Han (2014) (crosses), Hirose & Yamamoto (2015) (squares), Ročková & George (2016) varimax-free version (empty circles), Ročková & George (2016) varimax version (filled circles) and Witten et al. (2009) (diamonds), as well as our estimation algorithm (triangles). In each panel the horizontal grey line represents the true number of factors; error bars represent Monte Carlo errors.
The four methods for estimating  differed significantly in their root mean square errors, true positive rates, and false discovery rates; see Figs 2–4. Hirose and Yamamoto’s method had the highest false discovery rates and the lowest true positive rates across most settings. Both versions of Roǎková and George’s method estimated an overly dense
 across most settings, resulting in high true positive rates and high false discovery rates. The extra rotation step in the second version of Roǎková and George’s method resulted in excellent mean square error performance; however, varimax rotation is a post-processing step. A similar step to reduce the mean square error could be added to our method, for example by including a step to rotate the
 in step 3 of Algorithm 1 using the varimax criterion. When
 and
 were small, the method of Witten et al. achieved the lowest false discovery rates while our method achieved the highest true positive rates. When
 and
 were larger than 250 and 100, respectively, Assumption A4 was satisfied and our method simultaneously achieved the highest true positive rates and lowest false discovery rates while maintaining competitive mean square errors relative to the rotation-free methods.
Fig. 2.

Root mean square error averaged across simulation replications for the methods of Hirose & Yamamoto (2015) (squares), Ročková & George (2016) varimax-free version (empty circles), Ročková & George (2016) varimax version (filled circles) and Witten et al. (2009) (diamonds), as well as our estimation algorithm (triangles). Error bars represent Monte Carlo errors.
Fig. 4.

False discovery rate averaged across simulation replications for the methods of Hirose & Yamamoto (2015) (squares), Ročková & George (2016) original version (empty circles), Ročková & George (2016) varimax version (filled circles) and Witten et al. (2009) (diamonds), as well as our estimation algorithm (triangles). Error bars represent Monte Carlo errors.
Fig. 3.

True positive rate averaged across simulation replications for the methods of Hirose & Yamamoto (2015) (squares), Ročková & George (2016) varimax-free version (empty circles), Ročková & George (2016) varimax version (filled circles) and Witten et al. (2009) (diamonds), as well as our estimation algorithm (triangles). Error bars represent Monte Carlo errors.
5.3. Microarray data analysis
We used gene expression data on ageing in mice from the AGEMAP database (Zahn et al., 2007). There were 40 mice aged 1, 6, 16 and 24 months in this study. Each age group included five male and five female mice. Tissue samples were collected from 16 different tissues, including the cerebrum and cerebellum, for every mouse. Gene expression levels in every tissue sample were measured on a microarray platform. After normalization and removal of missing data, gene expression data were available for all 8932 probes across 618 microarrays. We used a factor model to estimate the effect of latent biological processes on gene expression variation.
AGEMAP data were centred before analysis following Perry & Owen (2010). Gene expression measurements were represented by  , where
 and
 . Further, age
 represented the age of mouse
 and gender
 was 1 if mouse
 was female and 0 otherwise. Least-squares estimates of the intercept, age effect and gender effect in the linear model
 (
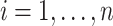 ), with idiosyncratic error
 , were represented as
 ,
 and
 . Using these estimates for
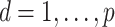 , the mean-centred data were defined as
Four mice were randomly held out, and all tissue samples for these mice in  were used as test data. The remaining samples were used as training data. This set-up was replicated ten times. All four methods were applied to the training data in every replication by fixing the upper bound on the number of factors at 10. The
 -
 grid had dimensions
 , and
 increased linearly from
 to
 while
 increased linearly from
 to
 .
The results for all five methods were stable across all ten folds of crossvalidation. Caner and Han’s method, Hirose and Yamamoto’s method, both versions of Roǎková and George’s method, the method of Witten et al. and our method selected 10, 10, 10, 4 and 1, respectively, as the number of latent biological processes  across all folds. Our result matched the result of Perry & Owen (2010), who confirmed the presence of one latent variable using rotation tests. Our simulation results and the findings in Perry & Owen (2010) strongly suggest that our method accurately estimated
 and the other methods overestimated
 .
We also estimated the factors for the test data. With  denoting test datum
 and
 denoting the singular value decomposition of
 , the factor estimate of test datum
 was
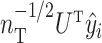 , where
 denotes the number of samples in the training data. Perry & Owen (2010) found that factor estimates for the tissue samples from cerebrum and cerebellum, respectively, had bimodal densities. We used the density function in R with default settings to obtain kernel density estimates of the factors. Hirose and Yamamoto’s method and both versions of Roǎková and George’s method estimated the number of factors as 10, which made the results challenging to interpret. The method of Witten et al. recovered bimodal densities in all four factors for both tissue samples, but it was unclear which of these four factors corresponded to the factor estimated by Perry & Owen (2010). Our method estimated the number of factors to be 1 and recovered the bimodal density in both tissue samples.
Supplementary Material
Acknowledgement
This work was supported by the U.S. National Institute of Environmental Health Sciences, National Institutes of Health, and National Science Foundation. We are grateful to the referees, associate editor, and editor for their comments and suggestions.
Supplementary material
Supplementary material available at Biometrika online includes derivation of the expectation-maximization algorithm, proofs of Lemmas 1 and 2 and Theorems 1–3, supporting figures for the results in § 5.3, and the R code used for data analysis.
Appendix
Assumptions
Assumptions A0–A4 follow from the theoretical set-up for high-dimensional factor models in Kneip & Sarda (2011). Assumption 5 is based on results in Zou & Li (2008) for variable selection.
Assumption A0.
Let
,
,
,
,
,
and
(
).
Assumption A1.
There exist finite positive constants
,
and
such that
,
and
(
;
).
Assumption A2.
There exists a constant
such that
,
,
and
are
-sub-Gaussian for every
. A random variable
is
-sub-Gaussian if
for any
.
Assumption A3.
Let
be the eigenvalues of
; then there exists a
such that
,
,
, and
.
Assumption A4.
The sample size
and dimension
are large enough that
and
.
Assumption A5.
Let
be the upper bound on
and let
,
,
and
(
) be defined as in Lemma 2. Then
,
,
and
(
) as
,
and
.
Assumption A6.
The elements of the set
are fixed and do not change as
or
increases to
.
Model (2) is recovered upon substituting  into Assumption A0. Assumption A1 ensures that
 is positive definite. Assumption A2 ensures that the empirical covariances are good approximations of the true covariances. Specifically, for any
 ,
hold simultaneously with probability at least  . If
 , then
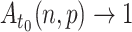 as
 and
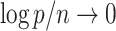 . Assumption A3 guarantees identifiability of
 when
 is large and
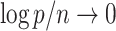
 . Assumption A4 is required to ensure that
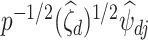 is a root-
 -consistent estimator of
 as
 ,
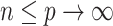 and
 .
One additional assumption is required to relate 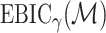 and
 .
Assumption A7
Let
for a fixed constant
such that
.
Assumption A7 and equation (4.6) in Theorem 3 of Kneip & Sarda (2011) imply that  for any
 such that
 , because
 as
 .
References
- Ahn S. C. & Horenstein A. R. (2013). Eigenvalue ratio test for the number of factors. Econometrica 81,1203–27. [Google Scholar]
- Armagan A., Dunson D. B. & Lee J. (2013). Generalized double Pareto shrinkage. Statist. Sinica 23,119–43. [PMC free article] [PubMed] [Google Scholar]
- Bai J. & Li K. (2012) Statistical analysis of factor models of high dimension. Ann. Statist. 40,436–65. [Google Scholar]
- Bai J. & Ng S. (2002). Determining the number of factors in approximate factor models. Econometrica 70,191–221. [Google Scholar]
- Bhattacharya A. & Dunson D. B. (2011). Sparse Bayesian infinite factor models. Biometrika 98,291–306. [DOI] [PMC free article] [PubMed] [Google Scholar]
- Caner M. & Han X. (2014). Selecting the correct number of factors in approximate factor models: The large panel case with group bridge estimators. J. Bus. Econ. Statist. 32,359–74. [Google Scholar]
- Carvalho C. M., Chang J., Lucas J. E., Nevins J. R., Wang Q. & West M. (2008). High-dimensional sparse factor modeling: Applications in gene expression genomics. J. Am. Statist. Assoc. 103,1438–56. [DOI] [PMC free article] [PubMed] [Google Scholar]
- Chen J. & Chen Z. (2008). Extended Bayesian information criteria for model selection with large model spaces. Biometrika 95,759–71. [Google Scholar]
- Fan J. & Li R. (2001). Variable selection via nonconcave penalized likelihood and its oracle properties. J. Am. Statist. Assoc. 96,1348–60. [Google Scholar]
- Friedman J. H., Hastie T. J. & Tibshirani R. J. (2010). Regularization paths for generalized linear models via coordinate descent. J. Statist. Software 33,1–22. [PMC free article] [PubMed] [Google Scholar]
- Hirose K. & Yamamoto M. (2015). Sparse estimation via nonconcave penalized likelihood in factor analysis model. Statist. Comp. 25,863–75. [Google Scholar]
- Jolliffe I. T., Trendafilov N. T. & Uddin M. (2003). A modified principal component technique based on the LASSO. J. Comp. Graph. Statist. 12,531–47. [Google Scholar]
- Kneip A. & Sarda P. (2011). Factor models and variable selection in high-dimensional regression analysis. Ann. Statist. 39,2410–47. [Google Scholar]
- Knowles D. & Ghahramani Z. (2011). Nonparametric Bayesian sparse factor models with application to gene expression modeling. Ann. Statist. 5,1534–52. [Google Scholar]
- Onatski A. (2009). Testing hypotheses about the number of factors in large factor models. Econometrica 77,1447–79. [Google Scholar]
- Perry P. O. & Owen A. B. (2010). A rotation test to verify latent structure. J. Mach. Learn. Res. 11,603–24. [Google Scholar]
- R Development Core Team (2017). R: A Language and Environment for Statistical Computing. R Foundation for Statistical Computing, Vienna, Austria.ISBN 3-900051-07-0.http://www.R-project.org. [Google Scholar]
- RokĉovÁ V. & George E. I. (2016). Fast Bayesian factor analysis via automatic rotations to sparsity. J. Am. Statist. Assoc. 111,1608–22. [Google Scholar]
- Shen H. & Huang J. Z. (2008). Sparse principal component analysis via regularized low rank matrix approximation. J. Mult. Anal. 99,1015–34. [Google Scholar]
- Witten D. M., Tibshirani R. J. & Hastie T. J. (2009). A penalized matrix decomposition, with applications to sparse principal components and canonical correlation analysis. Biostatistics 10,515–34. [DOI] [PMC free article] [PubMed] [Google Scholar]
- Zahn J. M., Poosala S., Owen A. B., Ingram D. K., Lustig A., Carter A., Weeraratna A. T., Taub D. D., Gorospe M., Mazan-Mamczarz K. et al. (2007). AGEMAP: A gene expression database for aging in mice. PLoS Genet. 3,e201. [DOI] [PMC free article] [PubMed] [Google Scholar]
- Zou H., Hastie T. J. & Tibshirani R. J. (2006). Sparse principal component analysis. J. Comp. Graph. Statist. 15,265–86. [Google Scholar]
- Zou H. & Li R. (2008). One-step sparse estimates in nonconcave penalized likelihood models. Ann. Statist. 36,1509–33. [DOI] [PMC free article] [PubMed] [Google Scholar]
Associated Data
This section collects any data citations, data availability statements, or supplementary materials included in this article.