

ABSTRACT
Background
Lack of robust estimates of human-milk nutrient composition and influential maternal factors, such as body composition, are barriers to informing nutrition policies and programs.
Objective
The objective was to understand the relation between maternal BMI and human-milk energy, fat, and/or total protein.
Methods
Four electronic databases (MEDLINE, Embase, CINAHL, and Web of Science) were searched. Outcomes assessed were human-milk energy (kcal/L), fat (g/L), and total protein (g/L) from mothers 1 to 6 mo postpartum. Studies with data on maternal BMI or weight and height that quantified human-milk energy, fat, or protein between 1 and 6 mo postpartum were eligible. Random-effects meta-regression weighted by the inverse of the study-level SE was completed for each of the 3 outcomes. The certainty of evidence for each outcome was assessed using the GRADE (Grading of Recommendations Assessment, Development, and Evaluation) approach.
Results
A total of 11,373 titles and abstracts were identified, and after full-text screening, 69 articles of 66 studies were included. Meta-regression results showed a positive association between maternal BMI and human-milk fat (β: 0.56 g/L; 95% CI: 0.034, 1.1; P = 0.04; I2 = 93.7%, n = 63 datapoints). There was no significant association between maternal BMI and human-milk energy (β: 3.9 kcal/L; 95% CI: −1.6, 9.5; P = 0.16, I2 = 93.3%, n = 40 datapoints) or total protein (β: 0.13 g/L; 95% CI: −0.16, 0.41; P = 0.37, I2 = 99.1%, n = 40 datapoints). The certainty of evidence for human-milk energy was low and the certainty of evidence for fat and total protein was very low.
Conclusions
Meta-regression analysis of available literature suggested an association between maternal BMI and human-milk fat between 1 and 6 mo postpartum. Future studies are needed to confirm the relation between maternal BMI; variation in human-milk energy, fat, and protein content; and the implications for child growth and development. This review is registered with International Prospective Register of Systematic Reviews (PROSPERO 2018 CRD42018098808) at https://www.crd.york.ac.uk/prospero/.
Keywords: meta-analysis, BMI, maternal nutritional status, breast milk, breastmilk, macronutrient
See corresponding editorial on page 772.
Introduction
There are strongly supported benefits of breastfeeding, both for mothers and for their infants, and thus exclusive breastfeeding is recommended for the first 6 mo of life (1, 2). For infants, benefits include lower risk of morbidity and mortality as well as improved neurodevelopment (1). Human milk is believed to provide all required nutrients for healthy term infants up to 6 mo of age, with the exception of vitamin D (2, 3). However, the concentration of individual nutrients may vary due to a number of maternal factors including body composition (4, 5).
Bravi et al. (4) performed a systematic review and qualitative assessment of the association between maternal diet and a range of human-milk macronutrients and, from 32 studies (1977–2014), concluded that evidence on this topic is both limited and conflicting. Only studies of well-nourished women were included in their review and associations between maternal body composition and human-milk composition were not assessed. A recent meta-analysis by Leghi et al. (6) found that mothers with overweight or obesity have higher human milk fat compared with normal-weight mothers (n = 6 studies). No significant associations were observed with human-milk protein (n = 5 studies). Human-milk energy was not investigated in this review, and underweight women and low- and middle-income countries were not represented.
To our knowledge, there has never been a contemporary systematic review that has quantitively evaluated all available data in the published literature on human-milk energy and macronutrient composition in relation to maternal body size from underweight to obese using BMI as a continuous variable. We reasoned that meta-regression of datapoints from all available studies would be a novel approach to accomplishing this goal. The lack of robust data on the composition of human milk and factors that influence it has recently been highlighted by several international agencies and researchers (7). Data on milk composition and associated health outcomes are required to facilitate evidence-based nutrition and health programs and policies. Given that a significant number of women of reproductive age globally are underweight and the prevalence of overweight and obesity continues to rise (8, 9), clarification of the degree to which maternal body composition is related to human-milk energy and macronutrient composition is required.
Therefore, the main question that this systematic review aimed to answer was, “In mothers of infants 1 to 6 months of age, is maternal body composition, as assessed by BMI, associated with human-milk energy, fat, and/or total protein?” A secondary aim was to examine the influence of quantification techniques for the determination of human-milk energy, fat, and total protein on these estimates. An additional aim was to explore sources of heterogeneity in human-milk composition related to breastfeeding practices, technique of human-milk collection, prepregnancy or postpartum BMI, and income level of the country where research was conducted.
Methods
A protocol for this systematic review was prospectively registered on the International Prospective Register of Systematic Reviews (PROSPERO 2018 CRD42018098808). The Preferred Reporting Items for Systematic Reviews and Meta-Analyses (PRISMA) guidelines were followed in the completion of this systematic review (10).
Literature search and eligibility
The electronic databases MEDLINE, Embase, CINAHL, and Web of Science were searched by a research librarian at the Hospital for Sick Children on 4 July 2019 and the search was updated on 19 May 2020 (Supplemental Tables 1 and 2). Search terms related to maternal BMI and human-milk energy and macronutrients. There were no restrictions (e.g., language) used for the search apart from the restriction to human research studies.
Studies that included mothers of infants between 1 and 6 mo of age were eligible for inclusion. This age range was selected to ensure that the milk-composition analyses were conducted on mature milk samples and not colostrum or transitional milk. All studies where mothers provided any amount of human milk were considered; in other words, mothers were not always exclusively breastfeeding. Articles including preterm infants born before 37 wk of gestation were to be considered in the review but quantitatively analyzed separately from term-born infants. Studies were excluded if authors did not provide data on maternal BMI or weight and height, did not collect human milk, or did not directly assess (i.e., quantify) human-milk energy, fat, or protein concentration.
Study types that were eligible for inclusion were observational studies and intervention trials; reviews, commentaries, and abstracts of conference proceedings were excluded. Research performed in low-, middle-, and high-income countries was considered. Upon completion of the initial screening process, references of eligible articles were examined to identify additional publications that met the inclusion criteria for this systematic review.
Maternal BMI and main outcomes
Maternal BMI (kg/m2) prepregnancy or during lactation was examined as a continuous variable. BMI is a simple and inexpensive proxy indicator of body composition, with a BMI <18.5 representing underweight, a BMI of at least 25.0 representing overweight, and a BMI of at least 30.0 representing obesity (11). The 3 primary outcomes of interest were human-milk energy (kcal/L), fat (g/L), and total protein (g/L) from mothers of infants between 1 and 6 mo postpartum. Based on reviewer feedback during the peer review process, human-milk lactose (g/L) was also evaluated in post hoc analyses. Total protein reflects the total amount of nitrogen in a sample and includes both protein and nonprotein nitrogen components in human milk. If human-milk samples were collected at multiple time points in a study, measures closest to 3 mo postpartum were used. We considered all studies, regardless of the techniques (e.g., methods) used to quantitate energy, fat, and total protein; the 3 main outcomes were determined a priori for this systematic review (Supplemental Table 3). Unlike with the dairy industry, there is no national or international body that recommends a specific technique for human-milk analysis. However, the following methods are described by experts in the field as the “gold standard” or “preferred” methodology: bomb calorimetry (human-milk energy), gravimetric method (human-milk fat), and nitrogen or amino acid analysis (human-milk total protein) (12–15). As described below, in our secondary analyses, we examined associations between maternal BMI and human-milk energy, fat, and total protein using these preferred methods alone or in combination with other commonly utilized techniques.
Study selection and data extraction
Using Covidence online software, articles were independently screened in duplicate to determine eligibility by 2 of 3 reviewers involved in this systematic review (AID, SS, and SI) (16). This first step involved reviewing titles and abstracts followed by full-text review. The third reviewer was involved in the case of any discrepancies. Reasons for excluding full-text articles were documented. Results from this screening process are summarized in Figure 1 following the PRISMA guidelines (10).
FIGURE 1.

Study flow diagram of included and excluded studies in this systematic review.
A data-extraction sheet in Research Electronic Data Capture (REDCap) was used separately by 2 of the reviewers and data were subsequently combined (17). If any studies had missing data on maternal BMI or human-milk energy, fat, or protein, the authors were contacted for this information, although this was required for only 1 study in the review (18). Data extracted were publication year; country and income classification (low-, middle-, or high-income) according to the World Bank Group (19); study design (experimental or observational); maternal age; maternal prepregnancy and/or postpartum BMI; human-milk collection methods (exclusive breastfeeding, complete breast expression, frequency of collection within a 24-h study period); human-milk energy, fat, and total protein concentration; and the respective quantification techniques used (20).
Data were pooled during the data-extraction process for studies with multiple experimental groups or cohorts. However, for all studies that examined human-milk composition separated by BMI categories, these data were disaggregated and included in the analysis as discrete datapoints. Units were converted to kilocalories per liter for energy and to grams per liter for fat and protein upon data extraction. Protein data that were presented as nitrogen content were multiplied by a protein conversion factor of 6.25 (21). All quantitative data, including ranges, IQRs, variance, SEs, and CIs, were converted to SDs at this step of the review by 2 reviewers independently for each article.
Certainty of the evidence across studies
The Grading of Recommendations Assessment, Development, and Evaluation (GRADE) approach was used to assess the certainty or quality of the evidence across studies, rather than for individual studies (20). This assessment was done for each of the 3 outcomes examined by meta-regression—specifically, human-milk energy, fat, and total protein, respectively. Evidence started at moderate quality because of the observational nature of this systematic review, and was downgraded based on the following 4 GRADE criteria: 1) risk of bias of individual studies included in the meta-regression (study design or execution problems that could impact the outcome), 2) inconsistency (unexplained statistical heterogeneity in meta-regression results), 3) indirectness (whether included studies assessed mothers across the BMI continuum or human-milk quantification collection methods and techniques employed, many of which were proxy measures such as calculated energy for human-milk energy), and 4) imprecision (wide CIs around the estimate of effect for the meta-regression). An overall score for each outcome (high, moderate, low, or very low) was determined by considering certainty across all GRADE criteria.
Statistical analysis
All analyses were completed in Stata version 14 (StataCorp LP) after data were exported from REDCap version 9.3.8 (Vanderbilt University, Nashville, TN) (22). Random-effects meta-regression using the metareg macro was performed to examine the association between maternal BMI as a continuous predictor of human-milk energy, fat, and total protein, respectively.
Again, individual studies were usually included as single datapoints in the meta-regression. For studies that also disaggregated groups by BMI and reported on human-milk composition across groups, results were included as separate datapoints in the meta-regression. Means were weighted by the inverse of the study-level SE for each of human-milk energy, fat, total protein, and lactose. The meta-regression analyses were fitted using restricted maximum likelihood. The residual variation due to between-study variation (I2 residual) was computed (23). This type of analysis assumes that the relations between variables in the meta-regression are linear or follow a normal distribution. The assumption of normality for each outcome was confirmed using Q–Q plots (Supplemental Figures 1–4).
To address our second aim, additional meta-regression analyses were performed with inclusion of only those studies that used higher-quality human-milk quantification techniques described by experts in the field as “gold standard” or “preferred” methodology for human-milk energy (bomb calorimetry), fat (gravimetric method), and total protein (nitrogen or amino acid analysis). We also completed meta-regression with these techniques in combination with other commonly used techniques to quantitate human-milk fat and total protein. Further subgroup analyses were conducted to explore potential reasons for heterogeneity around human-milk energy, fat, and total protein. These subgroup analyses included exclusive breastfeeding (yes/no), collection of a complete breast expression (yes/no), human milk collected over 24 h (yes/no), BMI measured prepregnancy or postpartum, income level of the country from which milk samples were collected (low- and middle-income vs. high-income), and observational or experimental study design. Separate meta-regression analyses were completed for each respective subgroup comparison and I2 values were assessed.
Results
The search of the 4 electronic databases and reference lists of included studies identified 11,373 abstracts after duplicates were removed (Figure 1). After title and abstract screening, there were 277 articles that were potentially eligible for inclusion. There were 11 titles and abstracts for which the full text could not be located, potentially because they were published in print only and we were unable to secure a hard copy (Supplemental Table 4). Available articles were examined in full and 69 articles reporting on 66 studies were included in the systematic review (Table 1) (18, 24–91). These articles included a total of 4674 mothers with human-milk samples. Sixty-two studies included term-born infants, while just 6 studies included a total of 216 preterm infants (26, 35, 48–50, 63), which was deemed insufficient for meta-regression based on the Cochrane Handbook (section 9.6.4), which specifies that meta-regression analysis should be considered only when there are a minimum of 10 studies (Supplemental Table 5) (92). Therefore, only studies with term-born infants were included in the statistical analyses.
TABLE 1.
Characteristics of studies of term-born infants included in this systematic review1
| First author, year (ref) | Country (classification) | Study design | Sample size,2n | Maternal age,3 y | Maternal BMI,3,4 kg/m2 | Human-milk energy quantification | Human-milk fat quantification | Human-milk protein quantification |
|---|---|---|---|---|---|---|---|---|
| Abdul Basir, 2019 (86) | Malaysia (LMIC) | Observational | 32 | 30.6 ± 4.4 | 23.5 ± 4.8 (prepregnancy) | Calculated energy | Creamatocrit | Colorimetry |
| Agostoni, 2003 (24) | Italy (HIC) | Observational | 50 | 30.3 ± 5.4 | 20.7 ± 3.4 (postpartum) | — | Gravimetric method | — |
| Alvarez de Acosta, 2013 (36) | Venezuela (LMIC) | Observational | 52 | 20.8 ± 5.0 | 23.9 ± 0.8 (postpartum) | Calculated energy | Gerber method | Nitrogen analysis |
| Anastácio, 2004 (46) | Brazil (LMIC) | Observational | 38 | 27.7 ± 6.5 | 23.8 ± 4.3 (postpartum) | — | Creamatocrit | Colorimetry |
| Antonakou, 2011 (57)/Antonakou, 2013 (68) | Greece (HIC) | Observational | 39 | 32.5 ± 3.1 | 22.2 ± 4.1 (prepregnancy) | — | Creamatocrit | — |
| Ayah, 2007 (79) | Kenya (LMIC) | Experimental | 422 | 24.7 ± 6.6 | 22.2 ± 5.6 (prepregnancy) | — | Creamatocrit | — |
| Barbosa, 1997 (89) | Mexico (LMIC) | Observational | 21 normal-weight, 19 overweight | 21.3 ± 4.3 normal-weight, 22.4 ± 3.0 overweight | 21.4 ± 0.9 normal-weight (postpartum), 25.7 ± 1.9 overweight (postpartum) | Bomb calorimetry | Jeejeebhoy method | Nitrogen analysis5 |
| Be'er, 2020 (88) | Israel (HIC) | Observational | 31 | 33.5 ± 3.3 | 22.8 ± 3.2 (postpartum) | Calculated energy | IR spectrophotometry | IR spectrophotometry |
| Boniglia, 2003 (90) | Italy (HIC) | Observational | 117 | 31.2 ± 4.5 | 24.2 ± 3.3 (postpartum) | — | — | Nitrogen analysis |
| Brown, 1986 (91) | Bangladesh (LMIC) | Observational | 33 | 19.6 ± 6.3 | 17.8 ± 1.6 (postpartum) | Calculated energy | Gravimetric method | Nitrogen analysis |
| Bumrungpert, 2018 (25) | Thailand (LMIC) | Experimental | 50 | 24.9 ± 4.7 | 22.5 ± 3.1 (postpartum) | Bomb calorimetry | Gravimetric method | Nitrogen analysis |
| Butte, 1984 (27) | United States (HIC) | Observational | 13 | 26.6 ± 5.0 | 20.8 ± 2.6 (prepregnancy) | Bomb calorimetry | Gravimetric method | Nitrogen analysis |
| Butte, 1984 (26) | United States (HIC) | Observational | 37 | 28.0 ± 3.1 | 22.7 ± 3.9 (postpartum) | Bomb calorimetry | Gravimetric method | Nitrogen analysis |
| Butts, 2018 (28) | New Zealand (HIC) | Observational | 78 | 30.8 ± 0.9 | 27.2 ± 0.8 (postpartum) | — | Gravimetric method | Nitrogen analysis |
| Bzikowska-Jura, 2018 (29) | Poland (HIC) | Observational | 22 | 31.1 ± 4.4 | 23.3 ± 4.0 (postpartum) | Calculated energy | IR spectrophotometry | IR spectrophotometry |
| Cannon, 2015 (30) | Australia (HIC) | Observational | 19 | 32 ± 3 | 25 ± 4 (postpartum) | — | Creamatocrit | Colorimetry |
| Carratù, 2003 (30) | Italy (HIC) | Observational | 195 | 31 ± 4 | 23.7 ± 3.2 (postpartum) | — | — | Nitrogen analysis |
| Chang, 2015 (32) | South Korea (HIC) | Observational | 230 | 32.0 ± 3.3 | 22.9 ± 3.0 (postpartum) | Calculated energy | IR spectrophotometry | IR spectrophotometry |
| Cissé, 2002 (33) | Senegal (LMIC) | Experimental | 133 | 27 ± 6 | 22.6 ± 3.7 (postpartum) | — | Other | Nitrogen analysis |
| Dagnelie, 1992 (34) | The Netherlands (HIC) | Observational | 19 | 31.5 ± 4.7 | 21.1 ± 2.0 (postpartum) | Calculated energy | Gravimetric method | Nitrogen analysis |
| De Luca, 2016 (38) | France (HIC) | Observational | 50 normal-weight, 47 obese | 30.6 ± 4.5 normal-weight, 30.8 ± 4.9 obese | 24.0 ± 3.4 normal-weight (postpartum), 35.3 ± 3.1 obese (postpartum) | Calculated energy | IR spectrophotometry | IR spectrophotometry |
| de Pee, 1997 (39) | Indonesia (LMIC) | Experimental | 64 | — | 21.0 ± 2.6 (postpartum) | — | Creamatocrit | — |
| Del Prado, 2001 (37) | Mexico (LMIC) | Experimental | 10 | 21.4 ± 3.1 | 22.8 ± 2.4 (postpartum) | — | Gravimetric method | — |
| Dewey, 1994 (41) | United States (HIC) | Experimental | 33 | 30.5 ± 5.1 | 24.3 ± 3.6 (postpartum) | Calculated energy | Gravimetric method | Nitrogen analysis5 |
| Du, 2017 (42) | Australia (HIC) | Observational | 40 | 31.8 ± 4.3 | 26.3 ± 5.7 (postpartum) | — | Creamatocrit | — |
| Dusdieker, 1994 (43) | United States (HIC) | Experimental | 33 | 31.7 ± 3.7 | 25.2 ± 2.9 (postpartum) | — | Creamatocrit | Nitrogen analysis |
| Fornes, 1995 (44) | Brazil (LMIC) | Observational | 14 | 24.9 ± 5.8 | 22.8 ± 2.8 (postpartum) | — | Creamatocrit | — |
| Gridneva, 2018 (45) | Australia (HIC) | Observational | 15 | 33.3 ± 4.7 | 27.2 ± 5.5 (postpartum) | — | — | Colorimetry |
| Hampel, 2017 (47) | Bangladesh (LMIC) | Experimental | 18 | 20 ± 3 | 22 ± 4 (postpartum) | — | Creamatocrit | — |
| Hsu, 2014 (50) | Taiwan (HIC) | Observational | 15 | 32.7 ± 5.2 | 24.2 ± 2.4 (postpartum) | Calculated energy | IR spectrophotometry | IR spectrophotometry |
| Jans, 2018 (51) | Belgium (HIC) | Observational | 16 normal-weight, 24 overweight, 9 obese, 6 mixed group | 29 ± 6 normal-weight, 29 ± 5 overweight, 29 ± 5 obese, 30 ± 4 mixed group | 22 ± 2 normal-weight (prepregnancy), 27 ± 2 overweight (prepregnancy), 35 ± 6 obese (prepregnancy), 28 ± 4 mixed group (prepregnancy) | Calculated energy | IR spectrophotometry | IR spectrophotometry6 |
| Kugananthan, 2017 (52) | Australia (HIC) | Observational | 23 | 33.4 ± 4.2 | 27.0 ± 7.3 (postpartum) | — | — | Colorimetry |
| Kurniati, 2016 (53) | Indonesia (LMIC) | Observational | 48 | 27.3 ± 4.4 | 25.9 ± 5.9 (postpartum) | — | Creamatocrit | — |
| Ley, 2012 (54) | Canada (HIC) | Observational | 116 | 34.8 ± 4.3 | 24.8 ± 5.1 (prepregnancy) | — | Creamatocrit | Colorimetry |
| Liyanage, 2008 (55) | Sri Lanka (LMIC) | Observational | 66 | 27.1 ± 6.1 | 20.8 ± 3.4 (postpartum) | — | Creamatocrit | — |
| Lovelady, 1990 (56) | United States (HIC) | Observational | 16 | 28.7 ± 4.4 | 20.9 ± 1.7 (postpartum) | Bomb calorimetry | Gravimetric method | Colorimetry |
| Mandel, 2005 (58) | Israel (HIC) | Observational | 27 | 30.7 ± 2.9 | 24.5 ± 3.9 (postpartum) | Bomb calorimetry | Creamatocrit | — |
| Marangoni, 2000 (59) | Italy (HIC) | Observational | 7 | 33.5 ± 1.8 | 25.5 ± 2.5 (postpartum) | — | Gravimetric method | — |
| McCrory, 1999 (60) | United States (HIC) | Experimental | 67 | 31.5 ± 5.3 | 25.2 ± 4.2 (postpartum) | Calculated energy | Gravimetric method | Nitrogen analysis5 |
| Michaelsen, 1994 (61) | Denmark (HIC) | Observational | 88 | 29 ± 5 | 21.3 ± 3.1 (postpartum) | Calculated energy | IR spectrophotometry | IR spectrophotometry5 |
| Minato, 2019 (87) | Japan (HIC) | Observational | 56 | — | 21.3 ± 2.8 (postpartum) | Calculated energy | IR spectrophotometry | IR spectrophotometry |
| Mohammad, 2011 (62) | United States (HIC) | Experimental | 7 | 26.6 ± 1.3 | 34.5 ± 1.5 (postpartum) | Calculated energy | Other | Colorimetry |
| Motil, 1995 (64) | United States (HIC) | Experimental | 16 | 29.0 ± 2.6 | 23.6 ± 3.3 (postpartum) | — | — | Nitrogen analysis |
| Nikniaz, 2009 (65) | Iran (LMIC) | Observational | 182 | 26.5 ± 6 | 26.8 ± 4 (postpartum) | — | Gerber method | — |
| Nommsen, 1991 (66)/Dewey, 1991 (40) | United States (HIC) | Observational | 58 | 30.4 ± 4.6 | 23.7 ± 2.7 (postpartum) | Calculated energy | Gravimetric method | Colorimetry |
| Pérez-Escamilla, 1995 (67) | Honduras (LMIC) | Experimental | 141 | 20.2 ± 3.5 | 22.7 ± 3.3 (postpartum) | Calculated energy | Gravimetric method | Nitrogen analysis5 |
| Perrella, 2016 (69) | Australia (HIC) | Observational | 1 | 28 | 29.7 (postpartum) | Calculated energy | Creamatocrit | Colorimetry |
| Pines, 2016 (70) | Israel (HIC) | Observational | 45 | 31.7 ± 3.8 | 22.2 ± 2.7 (prepregnancy) | Calculated energy | IR spectrophotometry | IR spectrophotometry |
| Prentice, 2016 (71) | England (HIC) | Observational | 614 | 33.9 ± 4.0 | 22.8 ± 3.2 (prepregnancy) | Calculated energy | Chromatography | Nitrogen analysis |
| Rakicioğlu, 2006 (72) | Turkey (LMIC) | Observational | 21 | 27.3 ± 5.4 | 25.6 ± 4.8 (postpartum) | — | Gravimetric method | Nitrogen analysis5 |
| Rice, 2000 (73) | Bangladesh (LMIC) | Experimental | 147 | 26.6 ± 5.7 | 18.9 ± 1.7 (postpartum) | — | Creamatocrit | — |
| Rocquelin, 1998 (74) | Congo (LMIC) | Observational | 102 | 27.0 ± 6.8 | 22.3 ± 4.5 (postpartum) | — | Gravimetric method | — |
| Ruel, 1997 (75) | Guatemala (LMIC) | Observational | 52 | 25 ± 6 | 24 ± 3 (postpartum) | — | Other | — |
| Sadurskis, 1988 (76) | Sweden (HIC) | Observational | 23 | 28.6 ± 2.8 | 22.2 ± 3.3 (prepregnancy) | Bomb calorimetry | — | — |
| Shehadeh, 2006 (77) | Israel (HIC) | Observational | 41 | 30.8 ± 5.0 | 25.9 ± 3.9 (postpartum) | — | Gerber method | Nitrogen analysis |
| Sims, 2020 (18)7 | United States (HIC) | Observational | 63 normal-weight, 68 overweight | 30.4 ± 0.4 normal-weight, 30.5 ± 0.4 overweight | 22.3 ± 0.2 normal-weight (prepregnancy), 29.0 ± 0.3 overweight (prepregnancy) | Calculated energy | IR spectrophotometry | IR spectrophotometry |
| Thakkar, 2013 (80)/Thakkar, 2016 (78) | Singapore (HIC) | Observational | 50 | 31 ± 4 | 21 ± 6 (postpartum) | Calculated energy | IR spectrophotometry | Colorimetry |
| Urteaga, 2018 (81) | Bolivia (LMIC) | Observational | 18 | 28.8 ± 5.9 | 25.6 ± 4.5 (postpartum) | Calculated energy | Creamatocrit | — |
| van Steenbergen, 1983 (82) | Kenya (LMIC) | Observational | 75 | 27.5 ± 7.5 | 21.3 ± 3.3 (postpartum) | — | Gravimetric method | Nitrogen analysis |
| Villalpando, 1992 (83) | Mexico (LMIC) | Observational | 30 | 26.0 ± 6.1 | 23.8 ± 3.2 (postpartum) | Bomb calorimetry | Jeejeebhoy method | Nitrogen analysis |
| Yang, 2014 (84) | China (HIC) | Observational | 90 | 27.2 ± 3.9 | 23.3 ± 3.1 (postpartum) | Calculated energy | IR spectrophotometry | IR spectrophotometry |
| Young, 2017 (85) | United States (HIC) | Observational | 33 normal-weight, 23 overweight | 31.1 ± 4.4 normal-weight, 32.5 ± 4.6 overweight | 22.1 ± 1.4 normal-weight (postpartum), 27.8 ± 3.0 overweight (postpartum) | Calculated energy | Creamatocrit | Colorimetry |
HIC, high-income country; IR, infrared; LMIC, low- and middle-income country; Ref, reference; —, indicates that human-milk energy, fat, or protein were not quantified.
Human-milk samples at time point closest to 3 mo postpartum.
Data are presented as means ± SDs for maternal age and BMI.
BMI categories are underweight (kg/m2; <18.5), normal weight (between 18.5 and 24.9), overweight (between 25.0 and 29.9), and obese (≥30.0).
Only human-milk true protein, as opposed to total protein, was presented. These data were not included in the meta-regression.
Unknown whether human-milk total protein or true protein was assessed.
Data for the Sims (2020) paper were provided directly from the authors (not from the published paper).
The mean BMI of the included studies of term-born infants ranged from 17.8 to 35.3. Of the studies that included term-born infants, there was 1 datapoint (1.4%) with a mean maternal BMI within the underweight category, 46 datapoints (66.7%) within the normal-weight category, 19 datapoints (27.5%) within the overweight category, and 3 datapoints (4.3%) within the obese category. For the studies that evaluated preterm infants, the mean maternal BMI was between 20.7 and 26.4, with 4 studies having a mean BMI in the normal-weight category (66.7%), 2 in the overweight category (33.3%), and none with a BMI in the underweight or obese categories.
Forty datapoints (33 studies) were included in the meta-regression of maternal BMI and human-milk energy, 63 datapoints (56 studies) in the analysis of maternal BMI and human-milk fat, 40 datapoints (37 studies) in the analysis of maternal BMI and human-milk total protein, and 20 datapoints (17 studies) in the analysis of maternal BMI and human-milk lactose (Figure 1). Five studies were included as multiple datapoints for the meta-regression analyses as they included data disaggregated by maternal BMI category (18, 38, 51, 85, 89). Four of these studies separated mothers into 2 BMI categories, whereas 1 included 4 different categories that were each discrete datapoints (51).
Associations between maternal BMI and human-milk energy, fat, and total protein: meta-regression results
Human-milk energy
The meta-regression of the relation of maternal BMI and human-milk energy from 40 datapoints (33 studies) showed no significant association between these variables (β: 3.9 kcal/L; 95% CI: −1.6, 9.5; P = 0.16, I2 = 93.3%) (Figure 2). These data met the assumptions for normality based on the Q–Q plot (Supplemental Figure 1). Subgroup analyses to ascertain whether quantification techniques (bomb calorimetry or calculated), exclusive breastfeeding, complete breast expression, 24-h collection, BMI measured prepregnancy or postpartum, study design, and country income level did not provide insight into the source of the large heterogeneity (Supplemental Table 6).
FIGURE 2.
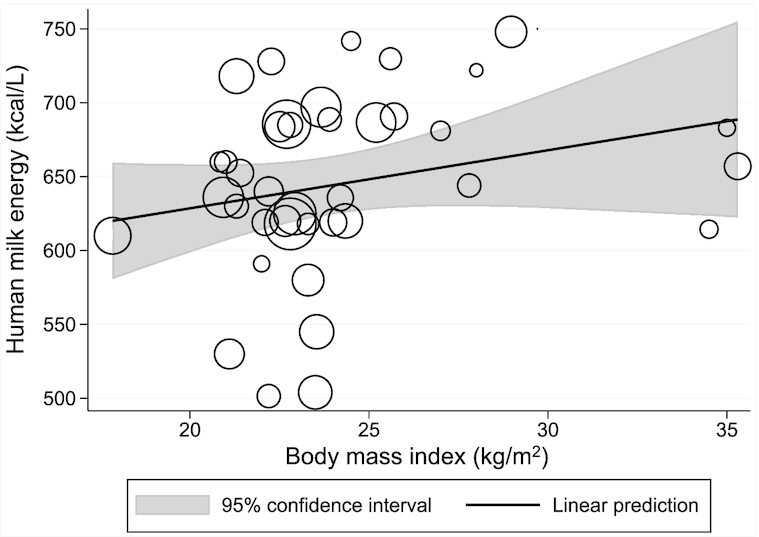
Meta-regression of the relation between maternal BMI and human-milk energy. The bubble sizes in this meta-regression are proportional to the inverse of the study-level SE for human-milk energy. The solid line represents the linear prediction for the means of human-milk energy as a function of the mean BMI observed at the study level (β: 3.9 kcal/L; 95% CI: −1.6, 9.5; P = 0.16, I2 = 93.3%, n = 40 datapoints).
The subgroup meta-regression of the 9 datapoints (8 studies) using bomb calorimetry showed no significant relation (β: 7.6 kcal/L; 95% CI: −21.3, 36.5; P = 0.55, I2 = 91.6%) nor did the meta-regression of the 31 datapoints (25 studies) using calculated energy (β: 4.1 kcal/L; 95% CI: −2.1, 10.2; P = 0.19, I2 = 93.9%).
Human-milk fat
The meta-regression of maternal BMI and human-milk fat from 63 datapoints (56 studies) showed that for each 1-kg/m2 higher BMI, human-milk fat was 0.56 g/L higher (95% CI: 0.034, 1.1; P = 0.04, I2 = 93.7%). Visual examination of the meta-regression and the Q–Q plot suggests that the relation was linear and met assumptions of normality, respectively (Figure 3 and Supplemental Figure 2).
FIGURE 3.
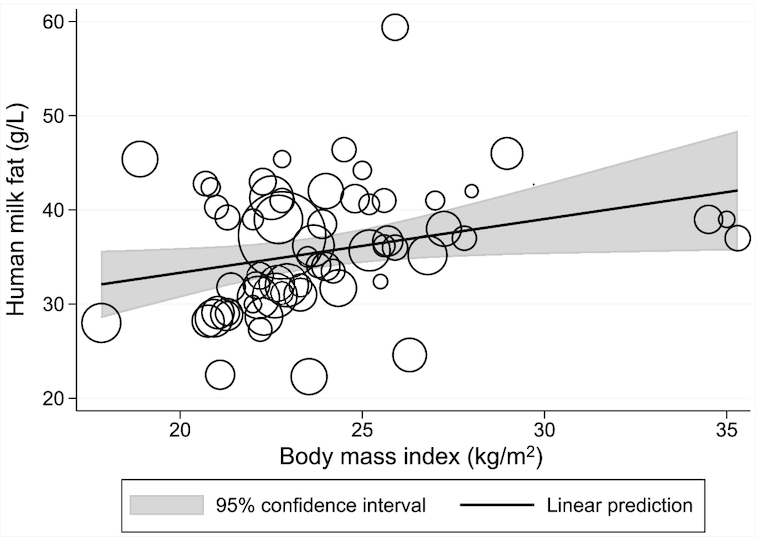
Meta-regression of the relation between maternal BMI and human-milk fat. The bubble sizes in this meta-regression are proportional to the inverse of the study-level SE for human-milk fat. The solid line represents the linear prediction for the means of human-milk fat as a function of the mean BMI observed at the study level (β: 0.56 g/L; 95% CI: 0.034, 1.1; P = 0.04, I2 = 93.7%, n = 63 datapoints).
When including only the gravimetric method to quantitate fat and excluding other techniques, there were 17 datapoints (16 studies) in this meta-regression. These showed a similar trend between maternal BMI and human-milk fat, but the relation was not significant (β: 0.84 g/L; 95% CI: −0.45, 2.1; P = 0.19, I2 = 93.6%). The subgroup analysis of 46 datapoints (40 studies) using all other techniques also did not show a significant relation between maternal BMI and human-milk fat (β: 0.44 g/L; 95% CI: −0.17, 1.1; P = 0.15, I2 = 93.6%). There was a significant positive relation between maternal BMI and human-milk fat for the 34 datapoints (30 studies) that used gravimetric or infrared spectrophotometry (β: 0.58 g/L; 95% CI: 0.016, 1.2; P = 0.04, I2 = 90.0%). Other commonly used human-milk-fat techniques were examined in meta-regression subgroup analyses and showed similar trends to the primary meta-regression (Supplemental Table 6). Additional subgroup analyses did not reveal any specific source for the high I2 values in the meta-regression analyses.
Human-milk total protein
There was no significant association between maternal BMI and human-milk total protein based on the meta-regression of 40 datapoints (37 studies) (β: 0.13 g/L; 95% CI: −0.16, 0.41; P = 0.37, I2 = 99.1%) (Figure 4). Examination of the Q–Q plot suggests that the data met the assumptions of normality (Supplemental Figure 3).
FIGURE 4.
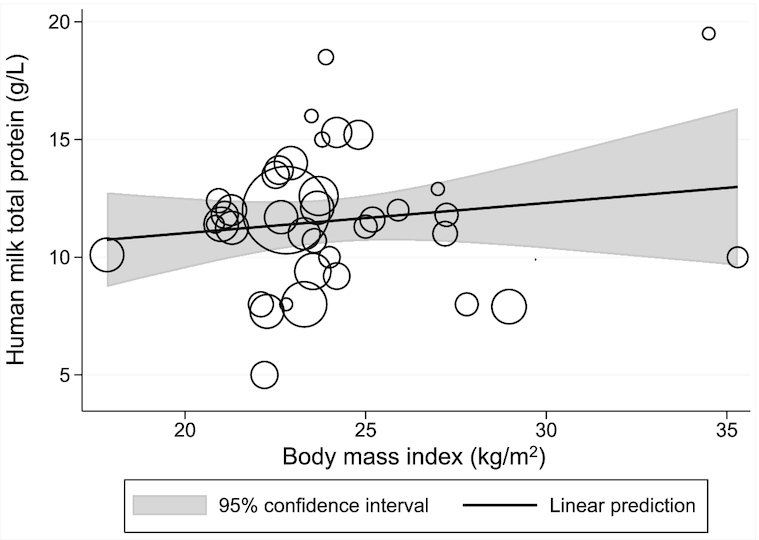
Meta-regression of the relation between maternal BMI and human-milk total protein. The bubble sizes in this meta-regression are proportional to the inverse of the study-level SE for human-milk total protein. The solid line represents the linear prediction for the means of human-milk total protein as a function of the mean BMI observed at the study level (β: 0.13 g/L; 95% CI: −0.16, 0.41; P = 0.37, I2 = 99.1%, n = 40 datapoints).
In subgroup analyses, including studies with only nitrogen or amino acid analysis used to quantitate protein in the meta-regression (16 datapoints, 15 studies), there was again no significant association (β: 0.21 g/L; 95% CI: −0.31, 0.73; P = 0.40, I2 = 97.7%). The meta-regression of 24 datapoints (22 studies) using other techniques also showed no significant association (β: 0.20 g/L; 95% CI: −0.18, 0.58; P = 0.28, I2 = 99.0%). Colorimetry and infrared spectrophotometry, 2 commonly used techniques to quantitate human-milk total protein, were assessed in meta-regression subgroup analyses one at a time in combination with nitrogen and amino acid analysis (Supplemental Table 6). The association between maternal BMI and total protein was not statistically significant in either of these meta-regression analyses, although there was a trend towards a positive relation when examining the 29 datapoints that used nitrogen and amino acid analysis and colorimetry (β: 0.28 g/L; 95% CI: −0.041, 0.61; P = 0.084, I2 = 97.5%).
As with the subgroup analyses for maternal BMI and human-milk energy and fat, respectively, exploration of subgroups did not give insight into the sources of the high statistical heterogeneity based on the I2 values.
Human-milk lactose
An additional meta-regression of human-milk lactose, which included 20 datapoints (17 studies), did not show a significant relation between maternal BMI and lactose (β: −0.45 g/L; 95% CI: −1.8, 0.88; P = 0.49, I2 = 99.6%) (Supplemental Figure 5).
Certainty of the evidence
The GRADE assessment indicated that the certainty of the evidence for human-milk energy was low, whereas the certainty of evidence for human-milk fat and total protein were very low (Supplemental Table 7). The risk of bias was low for all 3 of the outcomes examined. However, the quality of the evidence scores for all 3 outcomes was downgraded as there were limited studies including mothers with BMI in the underweight and obese categories. Second, the evidence quality score for all outcomes was downgraded due to high unexplained heterogeneity in the meta-regression analyses for all 3 outcomes. Finally, the certainty of the 3 outcomes was downgraded due to differences in exclusivity of breastfeeding across studies, the range of strategies used to collect human-milk samples, including whether or not a complete breast expression was performed, and different techniques used to quantitate human-milk fat and total protein. Specifically, 36 studies out of 62 studies (58.1%) including term-born infants stated that mothers were exclusively breastfeeding. Thirty-four studies (54.8%) specified that they collected fully expressed human milk. Sixteen studies (25.8%) collected human milk over 24 h, which is the ideal method for collecting human milk, particularly for human-milk energy and fat analysis. However, subgroup analyses did not show differences in statistical heterogeneity in relation to these factors.
Discussion
Results from this systematic review showed a positive association between maternal BMI and human-milk fat in term-born infants between 1 and 6 mo postpartum. Specifically, the meta-regression analysis of maternal BMI and human-milk fat in the present systematic review (63 datapoints) suggests that every 1-kg/m2 increment in maternal BMI is associated with a 0.56-g/L higher milk-fat concentration. Across a modest BMI difference of 5 kg/m2 this translates to ∼7.2% higher human-milk fat. No significant association was observed between maternal BMI and human-milk energy or total protein.
Evidence for the significant association between maternal BMI and human-milk fat was of very low quality, as assessed using the GRADE approach, meaning that the certainty in these results is highly limited. The certainty of the evidence for human-milk energy and total protein was low and very low, respectively, using the GRADE assessment (20). One of the reasons was that several human-milk quantification techniques were used, particularly for fat and total protein. However, subgroup analyses for each of the 3 outcomes did not indicate that these methods explained the considerable statistical heterogeneity.
Several years ago, Prentice et al. (93) in their summative review examined the relation between average reported maternal BMI and human-milk volume, energy, and fat composition in the literature between 1980 and 1992 from countries of all income levels. They reported that a number of original studies in the literature found positive associations between maternal BMI and human-milk fat but not energy, albeit acknowledged that other studies reported no significant association or a negative association between maternal BMI and human-milk fat. This review did not consider the relation between maternal BMI and human-milk protein. It is noteworthy that the highest mean BMI of studies in the Prentice et al. review was below the BMI category cutoff for overweight. In their recent systematic review, Leghi et al. (6) examined original studies that tested the association between maternal BMI and human-milk macronutrient content and reported that mothers with overweight or obesity have higher human-milk fat than normal-weight mothers based on a meta-analysis of 6 studies; no difference was found in the association between maternal adiposity and human-milk protein (n = 5 studies).
There was no significant relation between maternal BMI and human-milk energy based on the meta-regression, similar to the earlier findings by Prentice et al. Based on the positive relation between maternal BMI and human-milk fat, it could be hypothesized that energy would also be greater from mothers with overweight or obesity since fat is the most energy dense of the macronutrients and contributes ∼50% of milk energy content (94–96). Additional original research studies are needed to elucidate the simultaneous relations between maternal BMI and human-milk energy and macronutrients.
Under normal circumstances, infants modify their consumption to some degree based on the energy and macronutrient composition of their enteral feeds (97). Regulation of volume intake was first supported by the early controlled study by Fomon et al (98). where term-born infants exhibited an early capacity to regulate intake in response to the energy density of formula provided. The association between macronutrient concentration and volume intake has been reported by numerous others in both formula-fed and breastfed infants subsequently (97, 99–101). Whether infants are able to adjust the volume of intake over the range of fat concentrations observed in the present systematic review is unknown and is worthy of future research. Understanding these associations in mothers across the BMI spectrum is important as mothers with obesity often have delayed lactogenesis and reduced exclusivity and duration of breastfeeding (97, 102). Beyond infancy, data pooled from 37 cohorts have shown that higher maternal prepregnancy BMI is associated with overweight and obesity in children (103), although it is unclear how human-milk energy and macronutrients might mediate this relation. Other milk components, including human-milk oligosaccharides and other bioactives, may also be related to growth and require further exploration in relation to maternal factors (104).
Limitations of this systematic review include the fact that BMI does not differentiate between lean body mass and fat mass and may not represent metabolic status precisely. BMI was considered in mothers either before pregnancy or during lactation, depending on available data, which may reduce the precision of results. Only 6 studies reporting on human-milk macronutrient composition from mothers of preterm infants met the inclusion criteria and none of these had a mean maternal BMI in the underweight or obese categories. We are therefore unable to make conclusions about the associations between maternal BMI and human-milk energy, fat, and/or total protein in this population. Even among mothers of term-born infants, there was a limited number of studies with women across the spectrum of BMI, with just 1 study with a mean BMI in the underweight category and 3 studies with a mean BMI in the obese category. Furthermore, only the human-milk collection time point closest to 3 mo was considered for each of the 21 studies that collected human milk at multiple times. While there is variability in human-milk composition for some nutrients over the first 6 mo postpartum, and this conceivably may be impacted by maternal BMI, a previous systematic review reported comparable human-milk energy, protein, and fat between 1 and 6 mo postpartum (105).
With regard to the statistical analysis, the variance in maternal BMI as the predictor variable was not reflected in the meta-regression. To account for this, for studies that categorized mothers by >1 BMI category, these were included as separate datapoints in the analyses; only 5 studies disaggregated the data by BMI category. Further, given the limited number of studies at the low and high end of the maternal BMI distribution, we cannot be certain the relations between maternal BMI and human-milk fat and total protein are linear; however, visual inspection of the meta-regression suggests this is the case. That said, further studies are needed to confirm the pattern of association between maternal BMI and human-milk composition.
In conclusion, this systematic review showed a statistically significant positive association between maternal BMI and human-milk fat in term-born infants between 1 and 6 mo. No significant associations were found between maternal BMI and human-milk energy or total protein. This systematic review further found the certainty of evidence for these findings was low to very low. Future studies investigating the relation between maternal nutritional status, variation in human-milk fat content, and the implications for child growth and development are required.
Supplementary Material
ACKNOWLEDGEMENTS
The authors’ responsibilities were as follows—AID, SS, CB, MM, RHB, and DLO: designed the research; AID, SS, SI, and DLO: conducted research; AID and SS: analyzed data with support from AK; AID: wrote the manuscript; DLO: has primary responsibility for the final content; and all authors: read and approved the final manuscript. The authors report no conflicts of interest.
Notes
Trainee support for this project was awarded from the Canadian Institutes of Health Research (AID) and an endowed Vitamin Chair fund at the University of Toronto (SI). The sources of support had no role in the design or conduct of this review, statistical analyses, data interpretation, or writing of the manuscript.
Supplemental Figures 1–5 and Supplemental Tables 1–7 are available from the “Supplementary data” link in the online posting of the article and from the same link in the online table of contents at https://academic.oup.com/ajcn/.
Abbreviations used: GRADE, Grading of Recommendations Assessment, Development, and Evaluation; PRISMA, Preferred Reporting Items for Systematic Reviews and Meta-Analyses; REDCap, Research Electronic Data Capture.
Contributor Information
Allison I Daniel, Centre for Global Child Health, Hospital for Sick Children, Toronto, Ontario, Canada; Translational Medicine Program, Hospital for Sick Children, Toronto, Ontario, Canada; Department of Nutritional Sciences, Temerty Faculty of Medicine, University of Toronto, Toronto, Ontario, Canada.
Sara Shama, Translational Medicine Program, Hospital for Sick Children, Toronto, Ontario, Canada; Department of Nutritional Sciences, Temerty Faculty of Medicine, University of Toronto, Toronto, Ontario, Canada.
Samantha Ismail, Translational Medicine Program, Hospital for Sick Children, Toronto, Ontario, Canada; Department of Nutritional Sciences, Temerty Faculty of Medicine, University of Toronto, Toronto, Ontario, Canada.
Celine Bourdon, Translational Medicine Program, Hospital for Sick Children, Toronto, Ontario, Canada; The Childhood Acute Illness & Nutrition Network (CHAIN), Nairobi, Kenya.
Alex Kiss, Department of Research Design and Biostatistics, Sunnybrook Research Institute, Toronto, Ontario, Canada.
Martha Mwangome, The Childhood Acute Illness & Nutrition Network (CHAIN), Nairobi, Kenya; Kenya Medical Research Institute (KEMRI)/Wellcome Trust Research Program, Kilifi, Kenya.
Robert H J Bandsma, Centre for Global Child Health, Hospital for Sick Children, Toronto, Ontario, Canada; Translational Medicine Program, Hospital for Sick Children, Toronto, Ontario, Canada; Department of Nutritional Sciences, Temerty Faculty of Medicine, University of Toronto, Toronto, Ontario, Canada; The Childhood Acute Illness & Nutrition Network (CHAIN), Nairobi, Kenya; Department of Biomedical Sciences, College of Medicine, University of Malawi, Blantyre, Malawi.
Deborah L O'Connor, Translational Medicine Program, Hospital for Sick Children, Toronto, Ontario, Canada; Department of Nutritional Sciences, Temerty Faculty of Medicine, University of Toronto, Toronto, Ontario, Canada.
Data Availability
Data described in the manuscript, code book, and analytic code will be made available upon request pending application and approval.
References
- 1. Victora CG, Bahl R, Barros AJD, França GVA, Horton S, Krasevec J, Murch S, Sankar MJ, Walker N, Rollins NCet al. Breastfeeding in the 21st century: epidemiology, mechanisms, and lifelong effect. Lancet North Am Ed. 2016;387:475–90. [DOI] [PubMed] [Google Scholar]
- 2. World Health Organization . Global strategy on infant and young child feeding. Geneva (Switzerland): World Health Organization; 2002. [Google Scholar]
- 3. Otten JJ, Hellwig JP, Meyers LD, Linda DM, . Dietary Reference Intakes: the essential guide to nutrient requirements. National Academy of Sciences. Washington (DC): National Academies Press; 2006. [Google Scholar]
- 4. Bravi F, Wiens F, Decarli A, Dal Pont A, Agostoni C, Ferraroni M. Impact of maternal nutrition on breast-milk composition: a systematic review. Am J Clin Nutr. 2016;104:646–62. [DOI] [PubMed] [Google Scholar]
- 5. Dror DK, Allen LH.. Overview of nutrients in human milk. Adv Nutr. 2018;9:278S–294S. [DOI] [PMC free article] [PubMed] [Google Scholar]
- 6. Leghi GE, Netting MJ, Middleton PF, Wlodek ME, Geddes DT, Muhlhausler BS. The impact of maternal obesity on human milk macronutrient composition: a systematic review and meta-analysis. Nutrients. 2020;12:934. [DOI] [PMC free article] [PubMed] [Google Scholar]
- 7. Casavale KO, Ahuja JKC, Wu X, Li Y, Quam J, Olson R, Pehrsson P, Allen L, Balentine D, Hanspal M. NIH workshop on human milk composition: summary and visions. Am J Clin Nutr. 2019;110:769–79. [DOI] [PMC free article] [PubMed] [Google Scholar]
- 8. Penman AD, Johnson WD.. The changing shape of the body mass index distribution curve in the population: implications for public health policy to reduce the prevalence of adult obesity. Prev Chronic Dis. 2006;3:A74. [PMC free article] [PubMed] [Google Scholar]
- 9. NCD Risk Factor Collaboration (NCD-RisC) . Trends in adult body-mass index in 200 countries from 1975 to 2014: a pooled analysis of 1698 population-based measurement studies with 19.2 million participants. Lancet. 2016;387:1377–96. [DOI] [PMC free article] [PubMed] [Google Scholar]
- 10. Moher D, Liberati A, Tetzlaff J, Altman DG; PRISMA Group . Preferred Reporting Items for Systematic Reviews and Meta-Analyses: the PRISMA statement. Ann Intern Med. 2009;339:b2535.[Internet]. Available from: https://www.bmj.com/content/339/bmj.b2535 (accessed 23 March 2020). [PMC free article] [PubMed] [Google Scholar]
- 11. World Health Organization . Obesity: preventing and managing the global epidemic. Geneva (Switzerland): World Health Organization; 2000. [PubMed] [Google Scholar]
- 12. Du J, Gay MCL, Lai CT, Trengove RD, Hartmann PE, Geddes DT. Comparison of gravimetric, creamatocrit and esterified fatty acid methods for determination of total fat content in human milk. Food Chem. 2017;217:505–10. [DOI] [PubMed] [Google Scholar]
- 13. Choi A, Fusch G, Rochow N, Sheikh N, Fusch C. Establishment of micromethods for macronutrient contents analysis in breast milk. Matern Child Nutr. 2015;11:761–72. [DOI] [PMC free article] [PubMed] [Google Scholar]
- 14. Boyce C, Watson M, Lazidis G, Reeve S, Dods K, Simmer K, McLeod G. Preterm human milk composition: a systematic literature review. Br J Nutr. 2016;116(6):1033–45.. [DOI] [PubMed] [Google Scholar]
- 15. McGuire MK, O'Connor DL, editors. Human milk: sampling and measurement of energy-yielding nutrients and other macromolecules. 1st edition. London (United Kingdom): Academic Press; 2021. [Google Scholar]
- 16. Veritas Health Innovation . Covidence systematic review software. [Internet]. Melbourne (Australia); 2018. Version current 23 March 2020. Available from: www.covidence.org (accessed 23 March 2020). [Google Scholar]
- 17. Harris PA, Taylor R, Thielke R, Payne J, Gonzalez N, Conde JG. Research electronic data capture (REDCap)—a metadata-driven methodology and workflow process for providing translational research informatics support. J Biomed Inform. 2009;42:377–81. [DOI] [PMC free article] [PubMed] [Google Scholar]
- 18. Sims C, Lipsmeyer M, Turner D, Andres A. Human milk composition differs by maternal BMI in the first 9 months postpartum. Am J Clin Nutr. 2020;112(3):548–57. [DOI] [PMC free article] [PubMed] [Google Scholar]
- 19. The World Bank . World Bank Country and Lending Groups. [Internet]. The World Bank Group; 2020. Version current 23 March 2020. Available from: https://datahelpdesk.worldbank.org/knowledgebase/articles/906519-world-bank-country-and-lending-groups (accessed 23 March 2020). [Google Scholar]
- 20. Guyatt GH, Oxman AD, Vist GE, Kunz R, Falck-Ytter Y, Alonso-Coello P, Schünemann HJ. GRADE: an emerging consensus on rating quality of evidence and strength of recommendations. BMJ. 2008;336:924–6. [DOI] [PMC free article] [PubMed] [Google Scholar]
- 21. Lonnerdal B, Erdmann P, Thakkar SK, Sauser J, Destaillats F. Longitudinal evolution of true protein, amino acids and bioactive proteins in breast milk: a developmental perspective. J Nutr Biochem. 2017;41:1–11. [DOI] [PubMed] [Google Scholar]
- 22. StataCorp . Stata statistical software: release 14. College Station (TX): StataCorp LP; 2015. [Google Scholar]
- 23. Knapp G, Hartung J.. Improved tests for a random effects meta-regression with a single covariate. Stat Med. 2003;22:2693–710. [DOI] [PubMed] [Google Scholar]
- 24. Agostoni C, Marangoni F, Grandi F, Lammardo AM, Giovannini M, Riva E, Galli C. Earlier smoking habits are associated with higher serum lipids and lower milk fat and polyunsaturated fatty acid content in the first 6 months of lactation. Eur J Clin Nutr. 2003;57:1466–72. [DOI] [PubMed] [Google Scholar]
- 25. Bumrungpert A, Somboonpanyakul P, Pavadhgul P, Thaninthranon S. Effects of fenugreek, ginger, and turmeric supplementation on human milk volume and nutrient content in breastfeeding mothers: A randomized double-blind controlled trial. Breastfeed Med. 2018;13:645–50. [DOI] [PubMed] [Google Scholar]
- 26. Butte NF, Garza C, Stuff JE, Smith EO, Nichols BL. Effect of maternal diet and body composition on lactational performance. Am J Clin Nutr. 1984;39:296–306. [DOI] [PubMed] [Google Scholar]
- 27. Butte NF, Garza C, Johnson CA, Smith EO, Nichols BL. Longitudinal changes in milk composition of mothers delivering preterm and term infants. Early Hum Dev. 1984;9:153–62. [DOI] [PubMed] [Google Scholar]
- 28. Butts CA, Hedderley DI, Herath TD, Paturi G, Glyn-Jones S, Wiens F, Stahl B, Gopal P, Paturi G, Glyn-Jones Set al. Human milk composition and dietary intakes of breastfeeding women of different ethnicity from the Manawatu-Wanganui region of New Zealand. Nutrients. 2018;10:1231. [DOI] [PMC free article] [PubMed] [Google Scholar]
- 29. Bzikowska-Jura A, Czerwonogrodzka-Senczyna A, Olędzka G, Szostak-Węgierek D, Weker H, Wesołowska Aet al. Maternal nutrition and body composition during breastfeeding: association with human milk composition. Nutrients. 2018;10:1379. [DOI] [PMC free article] [PubMed] [Google Scholar]
- 30. Cannon AM, Kakulas F, Hepworth AR, Lai CT, Hartmann PE, Geddes DT. The effects of leptin on breastfeeding behaviour. IJERPH. 2015;12:12340–55. [DOI] [PMC free article] [PubMed] [Google Scholar]
- 31. Carratù B, Boniglia C, Scalise F, Ambruzzi AM, Sanzini E. Nitrogenous components of human milk: non-protein nitrogen, true protein and free amino acids. Food Chem. 2003;81:357–62. [Google Scholar]
- 32. Chang N, Jung JA, Kim H, Jo A, Kang S, Lee S-WW, Yi H, Kim J, Yim J-GG, Jung B-MM. Macronutrient composition of human milk from Korean mothers of full term infants born at 37–42 gestational weeks. Nutr Res Pract. 2015;9:433–8. [DOI] [PMC free article] [PubMed] [Google Scholar]
- 33. Cissé AS, Dossou N, Ndiaye M, Guèye AL, Diop EHI, Diaham B, Guiro AT, Cissé D, Sarr CSB, Wade Set al. Stable isotope aided evaluation of community nutrition program: effect of food supplementation schemes on maternal and infant nutritional status. Food Nutr Bull. 2002;23:169–73. [PubMed] [Google Scholar]
- 34. Dagnelie PC, Vanstaveren WA, Roos AH, Tuinstra L, Burema J. Nutrients and contaminants in human-milk from mothers on macrobiotic and omnivorous diets. Eur J Clin Nutr. 1992;46:355–66. [PubMed] [Google Scholar]
- 35. Aleali F, Fallahi M, Kazemian M, Fakhraee SH, Afjeh A. Longitudinal changes in the macronutrient contents of breast milk in the mothers with preterm delivery. Iran J Neonatol. 2018;9:29–36. [Google Scholar]
- 36. Alvarez de Acosta T, Cluet de Rodríguez I, Rossell Pineda M, Valbuena E, Ugueto E, Acosta L. Macronutrients in mature milk of teenagers and adult mothers. Arch Latinoam Nutr. 2013;63:46–52. [PubMed] [Google Scholar]
- 37. Del Prado M, Villalpando S, Elizondo A, Rodríguez M, Demmelmair H, Koletzko B. Contribution of dietary and newly formed arachidonic acid to human milk lipids in women eating a low-fat diet. Am J Clin Nutr. 2001;74:242–7. [DOI] [PubMed] [Google Scholar]
- 38. De Luca A, Frasquet-Darrieux M, Gaud MA, Christin P, Boquien CY, Millet C, Herviou M, Darmaun D, Robins RJ, Ingrand Pet al. Higher leptin but not human milk macronutrient concentration distinguishes normal-weight from obese mothers at 1-month postpartum. PLoS One. 2016;11:e0168568. [DOI] [PMC free article] [PubMed] [Google Scholar]
- 39. de Pee S, Yuniar Y, West CE, Muhilal. Evaluation of biochemical indicators of vitamin A status in breast-feeding and non-breast-feeding Indonesian women. Am J Clin Nutr. 1997;66:160–7. [DOI] [PubMed] [Google Scholar]
- 40. Dewey KG, Heinig MJ, Nommsen LA, Lonnerdal B. Maternal versus infant factors related to breast milk intake and residual milk volume: the DARLING study. Pediatrics. 1991;87:829–37. [PubMed] [Google Scholar]
- 41. Dewey KG, Lovelady CA, Nommsen-Rivers LA, Mccrory MA, Lonnerdal B. A randomized study of the effects of aerobic exercise by lactating women on breast-milk volume and composition. N Engl J Med. 1994;330:449–53. [DOI] [PubMed] [Google Scholar]
- 42. Du J, Gridneva Z, Gay MCL, Trengove RD, Hartmann PE, Geddes DT. Pesticides in human milk of Western Australian women and their influence on infant growth outcomes: a cross-sectional study. Chemosphere. 2017;167:247–54. [DOI] [PubMed] [Google Scholar]
- 43. Dusdieker LB, Hemingway DL, Stumbo PJ. Is milk production impaired by dieting during lactation?. Am J Clin Nutr. 1994;59:833–40. [DOI] [PubMed] [Google Scholar]
- 44. Fornes NS, Dorea JG. Subcutaneous fat changes in low-income lactating mothers and growth of breast-fed infants. J Am Coll Nutr. 1995;14:61–5. [DOI] [PubMed] [Google Scholar]
- 45. Gridneva Z, Tie WJ, Rea A, Lai CT, Ward LC, Murray K, Hartmann PE, Geddes DT, Rea A, Ward LCet al. Human milk casein and whey protein and infant body composition over the first 12 months of lactation. Nutrients. 2018;10:1332. [DOI] [PMC free article] [PubMed] [Google Scholar]
- 46. Anastácio AdS, da Silveira CLP, Miekeley N, Donangelo CMet al. Distribution of lead in human milk fractions—relationship with essential minerals and maternal blood lead. BTER. 2004;102:027. [DOI] [PubMed] [Google Scholar]
- 47. Hampel D, Shahab-Ferdows S, Islam MM, Peerson JM, Allen LH. Vitamin concentrations in human milk vary with time within feed, circadian rhythm, and single-dose supplementation. J Nutr. 2017;147:603–11. [DOI] [PMC free article] [PubMed] [Google Scholar]
- 48. Hascoët J-M, Chauvin M, Pierret C, Skweres S, Van Egroo L-D, Rougé C, Franck Pet al. Impact of maternal nutrition and perinatal factors on breast milk composition after premature delivery. Nutrients. 2019;11:366. [DOI] [PMC free article] [PubMed] [Google Scholar]
- 49. Hopkinson JM, Schanler RJ, Fraley JK, Garza C. Milk production by mothers of premature infants: Influence of cigarette smoking. Pediatrics. 1992;90:934–8. [PubMed] [Google Scholar]
- 50. Hsu Y-CC, Chen C-HH, Lin M-CC, Tsai C-RR, Liang J-TT, Wang T-MM. Changes in preterm breast milk nutrient content in the first month. Pediatr Neonatol. 2014;55:449–54. [DOI] [PubMed] [Google Scholar]
- 51. Jans G, Devlieger R, De Preter V, Ameye L, Roelens K, Lannoo M, Van der Schueren B, Verhaeghe J, Matthys C. Bariatric surgery does not appear to affect women's breast-milk composition. J Nutr. 2018;148:1096–102. [DOI] [PubMed] [Google Scholar]
- 52. Kugananthan S, Gridneva Z, Lai C, Hepworth A, Mark P, Kakulas F, Geddes D. Associations between maternal body composition and appetite hormones and macronutrients in human milk. Nutrients. 2017;9:252. [DOI] [PMC free article] [PubMed] [Google Scholar]
- 53. Kurniati AM, Sunardi D, Sungkar A, Bardosono S, Kartinah NT. Associations of maternal body composition and nutritional intake with fat content of Indonesian mothers’ breast milk. Paediatr Indones. 2016;56:297–303. [Google Scholar]
- 54. Ley S, Hanley A, Sermer M, Zinman B, O'Connor DL. Associations of prenatal metabolic abnormalities with insulin and adiponectin concentrations in human milk. Am J Clin Nutr. 2012;95:867–74. [DOI] [PubMed] [Google Scholar]
- 55. Liyanage C, Hettiarachchi M, Mangalajeewa P, Malawipathirana S. Adequacy of vitamin A and fat in the breast milk of lactating women in south Sri Lanka. Public Health Nutr. 2008;11:747–50. [DOI] [PubMed] [Google Scholar]
- 56. Lovelady CA, Lonnerdal B, Dewey KG. Lactation performance of exercising women. Am J Clin Nutr. 1990;52:103–9. [DOI] [PubMed] [Google Scholar]
- 57. Antonakou A, Chiou A, Andrikopoulos NK, Bakoula C, Matalas A-LL. Breast milk tocopherol content during the first six months in exclusively breastfeeding Greek women. Eur J Nutr. 2011;50:195–202. [DOI] [PubMed] [Google Scholar]
- 58. Mandel D, Lubetzky R, Dollberg S, Barak S, Mimouni FB. Fat and energy contents of expressed human breast milk in prolonged lactation. Pediatrics. 2005;116:e432–5. [DOI] [PubMed] [Google Scholar]
- 59. Marangoni F, Agostoni C, Lammardo AM, Giovannini M, Galli C, Riva E. Polyunsaturated fatty acid concentrations in human hindmilk are stable throughout 12-months of lactation and provide a sustained intake to the infant during exclusive breastfeeding: an Italian study. Br J Nutr. 2000;84:103–9. [PubMed] [Google Scholar]
- 60. McCrory MA, Nommsen-Rivers LA, Molé PA, Lönnerdal B, Dewey KG. Randomized trial of the short-term effects of dieting compared with dieting plus aerobic exercise on lactation performance. Am J Clin Nutr. 1999;69:959–67. [DOI] [PubMed] [Google Scholar]
- 61. Michaelsen KF, Larsen PS, Thomsen BL, Samuelson G. The Copenhagen Cohort Study on infant nutrition and growth: breast-milk intake, human milk macronutrient content, and influencing factors. Am J Clin Nutr. 1994;59:600–11. [DOI] [PubMed] [Google Scholar]
- 62. Mohammad MA, Sunehag AL, Rodriguez LA, Haymond MW. Galactose promotes fat mobilization in obese lactating and nonlactating women. Am J Clin Nutr. 2011;93:374–81. [DOI] [PMC free article] [PubMed] [Google Scholar]
- 63. Moran-Lev H, Mimouni FB, Ovental A, Mangel L, Mandel D, Lubetzky R. Circadian macronutrients variations over the first 7 weeks of human milk feeding of preterm infants. Breastfeed Med. 2015;10:366–70. [DOI] [PubMed] [Google Scholar]
- 64. Motil KJ, Thotathuchery M, Bahar A, Montandon CM. Marginal dietary protein restriction reduced nonprotein nitrogen, but not protein nitrogen, components of human milk. J Am Coll Nutr. 1995;14:184–91. [DOI] [PubMed] [Google Scholar]
- 65. Nikniaz L Jr, Mahdavi R, Arefhoesseini SR, Sowti Khiabani M. Association between fat content of breast milk and maternal nutritional status and infants’ weight in Tabriz, Iran. Malays J Nutr. 2009;15:37–44. [PubMed] [Google Scholar]
- 66. Nommsen LA, Lovelady CA, Heinig MJ, Lönnerdal B, Dewey KG. Determinants of energy, protein, lipid, and lactose concentrations in human milk during the first 12 mo of lactation: the DARLING study. Am J Clin Nutr. 1991;53:457–65. [DOI] [PubMed] [Google Scholar]
- 67. Pérez-Escamilla R, Cohen RJ, Brown KH, Landa Rivera L, Canahuati J, Dewey KG. Maternal anthropometric status and lactation performance in a low-income Honduran population: evidence for the role of infants. Am J Clin Nutr. 1995;61:528–34. [DOI] [PubMed] [Google Scholar]
- 68. Antonakou A, Skenderi KP, Chiou A, Anastasiou CA, Bakoula C, Matalas A-LL. Breast milk fat concentration and fatty acid pattern during the first six months in exclusively breastfeeding Greek women. Eur J Nutr. 2013;52:963–73. [DOI] [PubMed] [Google Scholar]
- 69. Perrella SL, Geddes DT.. A case report of a breastfed infant's excessive weight gains over 14 months. J Hum Lact. 2016;32:364–8. [DOI] [PubMed] [Google Scholar]
- 70. Pines N, Mandel D, Mimouni FB, Moran-Lev HM, Mangel L, Lubetzky R. The effect of between-breast differences on human milk macronutrients content. J Perinatol. 2016;36:549–51. [DOI] [PubMed] [Google Scholar]
- 71. Prentice P, Ong KK, Schoemaker MH, Van Tol EAF, Vervoort J, Hughes IA, Acerini CL, Dunger DB. Breast milk nutrient content and infancy growth. Acta Paediatr. 2016;105:641–7. [DOI] [PMC free article] [PubMed] [Google Scholar]
- 72. Rakicioğlu N, Samur G, Topcu A, Topcu AA. The effect of Ramadan on maternal nutrition and composition of breast milk. Pediatr Int. 2006;48:278–83. [DOI] [PubMed] [Google Scholar]
- 73. Rice AL, Stoltzfus RJ, De Francisco A, Kjolhede CL. Evaluation of serum retinol, the modified-relative-dose-response ratio, and breast-milk vitamin A as indicators of response to postpartum maternal vitamin A supplementation. Am J Clin Nutr. 2000;71:799. [DOI] [PubMed] [Google Scholar]
- 74. Rocquelin G, Tapsoba S, Dop MC, Mbemba F, Traissac P, Martin-Prével Y. Lipid content and essential fatty acid (EFA) composition of mature Congolese breast milk are influenced by mothers’ nutritional status: impact on infants’ EFA supply. Eur J Clin Nutr. 1998;52:164–71. [DOI] [PubMed] [Google Scholar]
- 75. Ruel MT, Dewey KG, Martinez C, Flores R, Brown KH. Validation of single daytime samples of human milk to estimate the 24-h concentration of lipids in urban Guatemalan mothers. Am J Clin Nutr. 1997;65:439–44. [DOI] [PubMed] [Google Scholar]
- 76. Sadurskis A, Kabir N, Wager J, Forsum E. Energy metabolism, body composition, and milk production in healthy Swedish women during lactation. Am J Clin Nutr. 1988;48:44–9. [DOI] [PubMed] [Google Scholar]
- 77. Shehadeh N, Aslih N, Shihab S, Werman MJ, Sheinman R, Shamir R. Human milk beyond one year post-partum: lower content of protein, calcium, and saturated very long-chain fatty acids. J Pediatr. 2006;148:122–4. [DOI] [PubMed] [Google Scholar]
- 78. Thakkar SK, Giuffrida F, Bertschy E, De Castro A, Destaillats F, Lee Y. Protein evolution of human milk. Nestle Nutr Inst Workshop Ser. 2016;86:77–85. [DOI] [PubMed] [Google Scholar]
- 79. Ayah RA, Mwaniki DL, Magnussen P, Tedstone AE, Marshall T, Alusala D, Luoba A, Kaestel P, Michaelsen KF, Friis H. The effects of maternal and infant vitamin A supplementation on vitamin A status: a randomised trial in Kenya. Br J Nutr. 2007;98:422–30. [DOI] [PubMed] [Google Scholar]
- 80. Thakkar SK, Giuffrida F, Cristina C-HH, De Castro CA, Mukherjee R, Tran L-A, Steenhout P, Lee LY, Destaillats FF. Dynamics of human milk nutrient composition of women from Singapore with a special focus on lipids. Am J Hum Biol. 2013;25:770–9. [DOI] [PubMed] [Google Scholar]
- 81. Urteaga N, San Miguel JL, Aguilar AM, Muñoz M, Slater C. Nutritional status and human milk intake of exclusively breast-fed infants at high altitude in La Paz, Bolivia. Br J Nutr. 2018;120:158–63. [DOI] [PubMed] [Google Scholar]
- 82. van Steenbergen WM, Kusin JA, de With C, Lacko E, Jansen AA. Lactation performance of mothers with contrasting nutritional status in rural Kenya. Acta Paediatr. 1983;72:805–10. [DOI] [PubMed] [Google Scholar]
- 83. Villalpando SF, Butte NF, Wong WW, Flores-Huerta S, De Jesus Hernandez-Beltran M, Smith EO, Garza C. Lactation performance of rural Mesoamerindians. Eur J Clin Nutr. 1992;46:337–48. [PubMed] [Google Scholar]
- 84. Yang TT, Zhang YM, Ning YB, You LL, Ma DF, Zheng YD, Yang XG, Li WJ, Wang JK, Wang PY. Breast milk macronutrient composition and the associated factors in urban Chinese mothers. Chin Med J. 2014;127:1721–5. [PubMed] [Google Scholar]
- 85. Young BE, Patinkin ZW, Pyle L, de la Houssaye B, Davidson BS, Geraghty S, Morrow AL, Krebs N. Markers of oxidative stress in human milk do not differ by maternal BMI but are related to infant growth trajectories. Matern Child Health J. 2017;21:1367–76. [DOI] [PMC free article] [PubMed] [Google Scholar]
- 86. Abdul Basir SM, Ghani RA, Ibrahim M, Khattak M, Omar MN, Shukri NAM. Maternal diet and its association with human milk energy and macronutrient composition among exclusively breastfeeding Malaysian Malay mothers. Mal J Nutr. 2019;25:309–20. [Google Scholar]
- 87. Minato T, Nomura K, Asakura H, Aihara A, Hiraike H, Hino Y, Isojima T, Kodama H. Maternal undernutrition and breast milk macronutrient content are not associated with weight in breastfed infants at 1 and 3 months after delivery. IJERPH. 2019;16:3315. [DOI] [PMC free article] [PubMed] [Google Scholar]
- 88. Be'er M, Mandel D, Yelak A, Gal DL, Mangel L, Lubetzky R. The effect of physical activity on human milk macronutrient content and its volume. Breastfeed Med. 2020;15:1–5. [DOI] [PubMed] [Google Scholar]
- 89. Barbosa L, Butte NF, Villalpando S, Wong WW, Smith EO. Maternal energy balance and lactation performance of Mesoamerindians as a function of body mass index. Am J Clin Nutr. 1997;66:575–83. [DOI] [PubMed] [Google Scholar]
- 90. Boniglia C, Carratu B, Chiarotti F, Giammarioli S, Sanzini E. Influence of maternal protein intake on nitrogen fractions of human milk. Int J Vitam Nutr Res. 2003;73:447–52. [DOI] [PubMed] [Google Scholar]
- 91. Brown KH, Akhtar NA, Robertson AD, Ahmed MG. Lactational capacity of marginally nourished mothers: relationships between maternal nutritional status and quantity and proximate composition of milk. Pediatrics. 1986;78:909–19. [PubMed] [Google Scholar]
- 92. Higgins JPT, Thomas J, Chandler J, Cumpston M, Li T, Page MJ, Welch VAeditors. Cochrane handbook for systematic reviews of interventions. Version 6.0. [Internet] [updated July 2019]. Cochrane Collaboration; 2019. Available from: www.training.cochrane.org/handbook. [Google Scholar]
- 93. Prentice AM, Goldberg GR, Prentice A. Body mass index and lactation performance. Eur J Clin Nutr. 1994;48(Suppl 3):S78–86.; discussion S86–9. [PubMed] [Google Scholar]
- 94. Meier PP, Engstrom JL, Murtaugh MA, Vasan U, Meier WA, Schanler RJ. Mothers’ milk feedings in the neonatal intensive care unit: accuracy of the creamatocrit technique. J Perinatol. 2002;22:646–9. [DOI] [PubMed] [Google Scholar]
- 95. Barbas KH, O'Brien K, Forbes PW, Belfort MB, Connor JA, Thiagarajan RR, Huh SY. Macronutrient analysis of modified-fat breast milk produced by 3 methods of fat removal. J Parenter Enter Nutr. 2019;44:895–902. [DOI] [PubMed] [Google Scholar]
- 96. Lucas A, Gibbs JAH, Baum JD, Lyster RLJ. Creamatocrit: simple clinical technique for estimating fat concentration and energy value of human milk. BMJ. 1978;1:1018–20. [DOI] [PMC free article] [PubMed] [Google Scholar]
- 97. Diana A, Haszard JJ, Houghton LA, Gibson RS. Breastmilk intake among exclusively breastfed Indonesian infants is negatively associated with maternal fat mass. Eur J Clin Nutr. 2019;73:1206. [DOI] [PMC free article] [PubMed] [Google Scholar]
- 98. Fomon SJ, FilmerLJ, Jr, Thomas LN, Anderson TA, Nelson SE. Influence of formula concentration on caloric intake and growth of normal infants. Acta Paediatr Scand. 1975;64(2):172–181. [DOI] [PubMed] [Google Scholar]
- 99. O'Connor DL, Khan S, Weishuhn K, Vaughan J, Jefferies A, Campbell DM, Asztalos E, Feldman M, Rovet J, Westall Cet al. Growth and nutrient intakes of human milk-fed preterm infants provided with extra energy and nutrients after hospital discharge. Pediatrics. 2008;121:766–76. [DOI] [PubMed] [Google Scholar]
- 100. Fleddermann M, Demmelmair H, Grote V, Nikolic T, Trisic B, Koletzko B. Infant formula composition affects energetic efficiency for growth: the BeMIM study, a randomized controlled trial. Clin Nutr. 2014;33:588–95. [DOI] [PubMed] [Google Scholar]
- 101. Timby N, Domellof E, Hernell O, Lonnerdal B, Domellof M. Neurodevelopment, nutrition, and growth until 12 mo of age in infants fed a low-energy, low-protein formula supplemented with bovine milk fat globule membranes: a randomized controlled trial. Am J Clin Nutr. 2014;99:860–8. [DOI] [PubMed] [Google Scholar]
- 102. O'Sullivan EJ, Perrine CG, Rasmussen KM. Early breastfeeding problems mediate the negative association between maternal obesity and exclusive breastfeeding at 1 and 2 months postpartum. J Nutr. 2015;145:2369–78. [DOI] [PMC free article] [PubMed] [Google Scholar]
- 103. Voerman E, Santos S, Patro Golab B, Amiano P, Ballester F, Barros H, Bergström A, Charles M-A, Chatzi L, Chevrier Cet al. Maternal body mass index, gestational weight gain, and the risk of overweight and obesity across childhood: an individual participant data meta-analysis. PLoS Med. 2019;16:e1002744. [DOI] [PMC free article] [PubMed] [Google Scholar]
- 104. Ballard O, Morrow AL. Human milk composition: nutrients and bioactive factors. Pediatr Clin North Am. 2013;60:49–74. [DOI] [PMC free article] [PubMed] [Google Scholar]
- 105. Gidrewicz DA, Fenton TR, Kramer M, Kakuma R, Agostoni C, Buonocore G, Carnielli V, De Curtis M, Darmaun D, Decsi Tet al. A systematic review and meta-analysis of the nutrient content of preterm and term breast milk. BMC Pediatr. 2014;14:216. [DOI] [PMC free article] [PubMed] [Google Scholar]
Associated Data
This section collects any data citations, data availability statements, or supplementary materials included in this article.
Supplementary Materials
Data Availability Statement
Data described in the manuscript, code book, and analytic code will be made available upon request pending application and approval.