

Abstract
Primary motor cortex (M1) consists of a stack of interconnected but distinct layers (L1-L6) which affect motor control through large-scale networks. However, the brain-wide functional influence of each layer is poorly understood. We sought to expand our knowledge of these layers’ circuitry by combining Cre-driver mouse lines, optogenetics, fMRI, and electrophysiology. Neuronal activities initiated in Drd3 neurons (within L2/3) were mainly confined within M1, while stimulation of Scnn1a, Rbp4, and Ntsr1 neurons (within L4, L5, and L6, respectively) evoked distinct responses in M1 and motor-related subcortical regions, including striatum and motor thalamus. We also found that fMRI responses from targeted stimulations correlated with both local field potentials (LFPs) and spike changes. This study represents a step forward in our understanding of how different layers of primary motor cortex are embedded in brain-wide circuitry.
Introduction
Primary motor cortex (M1) plays a prominent role in motor behavior and cortical control of movements through large-scale networks. Long-range inputs converge onto M1 through cortico-cortical, thalamo-cortical and neuromodulatory projections, while M1 outputs project to spinal/bulbar motor centers, striatum, thalamus, subthalamus, red nucleus, and pons1,2. Like the sensory cortices, M1 consists of a stack of interconnected but distinct layers. Traditionally, layers 2/3 (L2/3) are considered to be a prominent source of intracortical excitation of L53,4. Additionally, L5 has output connections to the ventral anterior thalamus (VA), striatum, and spinal cord, while L6 has output connections to the ventral lateral thalamus (VL)3. Recently, L4 has been proposed to have prototypical synaptic circuit connectivity5. Despite this seemingly well-defined structural organization, the brain-wide functional influences of M1 layer-specific pathways have yet to be elucidated at the whole-brain scale.
Historically, it has been difficult to disentangle the functional properties of different cortical layers as they are highly anatomically intermingled. However, some neurons which have layer-specific pathways share distinct neurochemical identities, suggesting that the activation of such neurons may result in unique brain-wide responses. In particular, some neurons in L2/3 express the dopamine receptor D3 (Drd3); some neurons of L4 express sodium channel non-voltage-gated 1 alpha (Scnn1a); some in L5 express retinol binding protein 4 (Rbp4); and some neurons in L6 express neurotensin receptor type 1 (Ntsr1). Advances in molecular genetics, such as the advent of Cre-recombinase driver lines6 and optogenetic tools7, have made it possible to selectively express transgenes in specific neocortical neurons. Several studies have exploited this capability to selectively excite specific layers and measure the downstream effects using in vivo electrophysiology. For example, in the somatosensory cortex, L2/3 was shown to suppress L5. The effect of this suppression is to enhance the selectivity and output range of downstream activity for finely-tuned cortical coding8. L4 activity of the somatosensory cortex was also shown to directly inhibit L5, which sharpened the spatial representation of L5 neurons9. In addition, L6 corticothalamic neurons in the visual cortex have been shown to activate L5 cortical outputs10 and to regulate the strength of cortical responses11. The above studies have mainly characterized the downstream activities within the cortex. Only a few L5 studies have investigated long-range pathways such as the corticotectal projections in the visual system12 and corticofugal projections in the auditory system13. Furthermore, these studies have focused on the sensory cortices (auditory, somatosensory, and visual cortices), which are structurally and functionally distinct from M1. Since layer-specific M1 activities distinctly contribute to cortical control of movements, and since different layers in M1 have distinct contributions to motor-related dysfunctions, it is essential to strive to characterize the downstream effects of layer-specific M1 excitation. However, to date, there has been no direct evidence of differential effects of M1 layer-specific pathways on brain-wide circuit function.
Recent developments in high spatial resolution fMRI provide opportunities for in vivo measurements of layer-specific cortical responses14. This could help address key cognitive neuroscience questions by distinguishing bottom-up from top-down cortical responses and investigating the interactions between the two15. High resolution fMRI could also be used to examine theories of brain-wide circuit function by assigning specific computational roles to different cortical layers16. However, layer-specific fMRI representation of neuronal activity has not been well established.
The integration of optogenetic stimulation with fMRI (ofMRI) has enabled direct measurement of the causal influences of genetically defined neuronal populations17–22. Here, we combined targeted optogenetic stimulation of Drd3, Scnn1a, Rbp4, and Ntsr1 neurons in M1 (cells which are specific to L2/3, L4, L5, and L6 respectively) with high-resolution fMRI to study how activity originating in those cell populations influences brain-wide regions, including thalamus, caudate putamen (Cpu), and the M1 layers themselves. Subsequently, we investigated those regions both locally and remotely using in vivo electrophysiology, to better understand the neuronal underpinnings of the fMRI responses.
Results
Stimulations of neurons specific to each layer of M1 activate distinct brain-wide networks
To selectively activate Drd3, Scnn1a, Rbp4, or Ntsr1 neurons of primary motor cortex (corresponding to L2/3, L4, L5, or L6 respectively) in vivo, we used transgenic mouse lines expressing Cre-recombinase9,23–25 under control of Drd3, Scnn1a, Rbp4 or Ntsr1 receptor regulatory elements, respectively. An AAV5 virus was injected into the M1 to express the excitatory opsin ChR2 in Cre-positive neurons, thus enabling selective optogenetic control of those neuron populations in M1. Histological and immunohistochemical examination confirmed that ChR2-EYFP was localized to the neurons in their respective layers and intra-cortical projections (Fig. 1). Specifically, ChR2-EYFP expression was observed in L2/3 M1 neurons and their L5 projections for the Drd3 Cre-line, in L4 M1 neurons and their L2/3 projections for the Scnn1a Cre-line, in L5 M1 neurons and their L2/3 projections for the Rbp4 Cre-line, and in L6 M1 neurons and their L4 projections for the Ntsr1 Cre-line.
Figure 1: Histology reveals ChR2 expression of Drd3 L2/3, Scnn1a L4, Rbp4 L5 and Ntsr1 L6 Cre-line mice in their respective M1 layers and their projections.
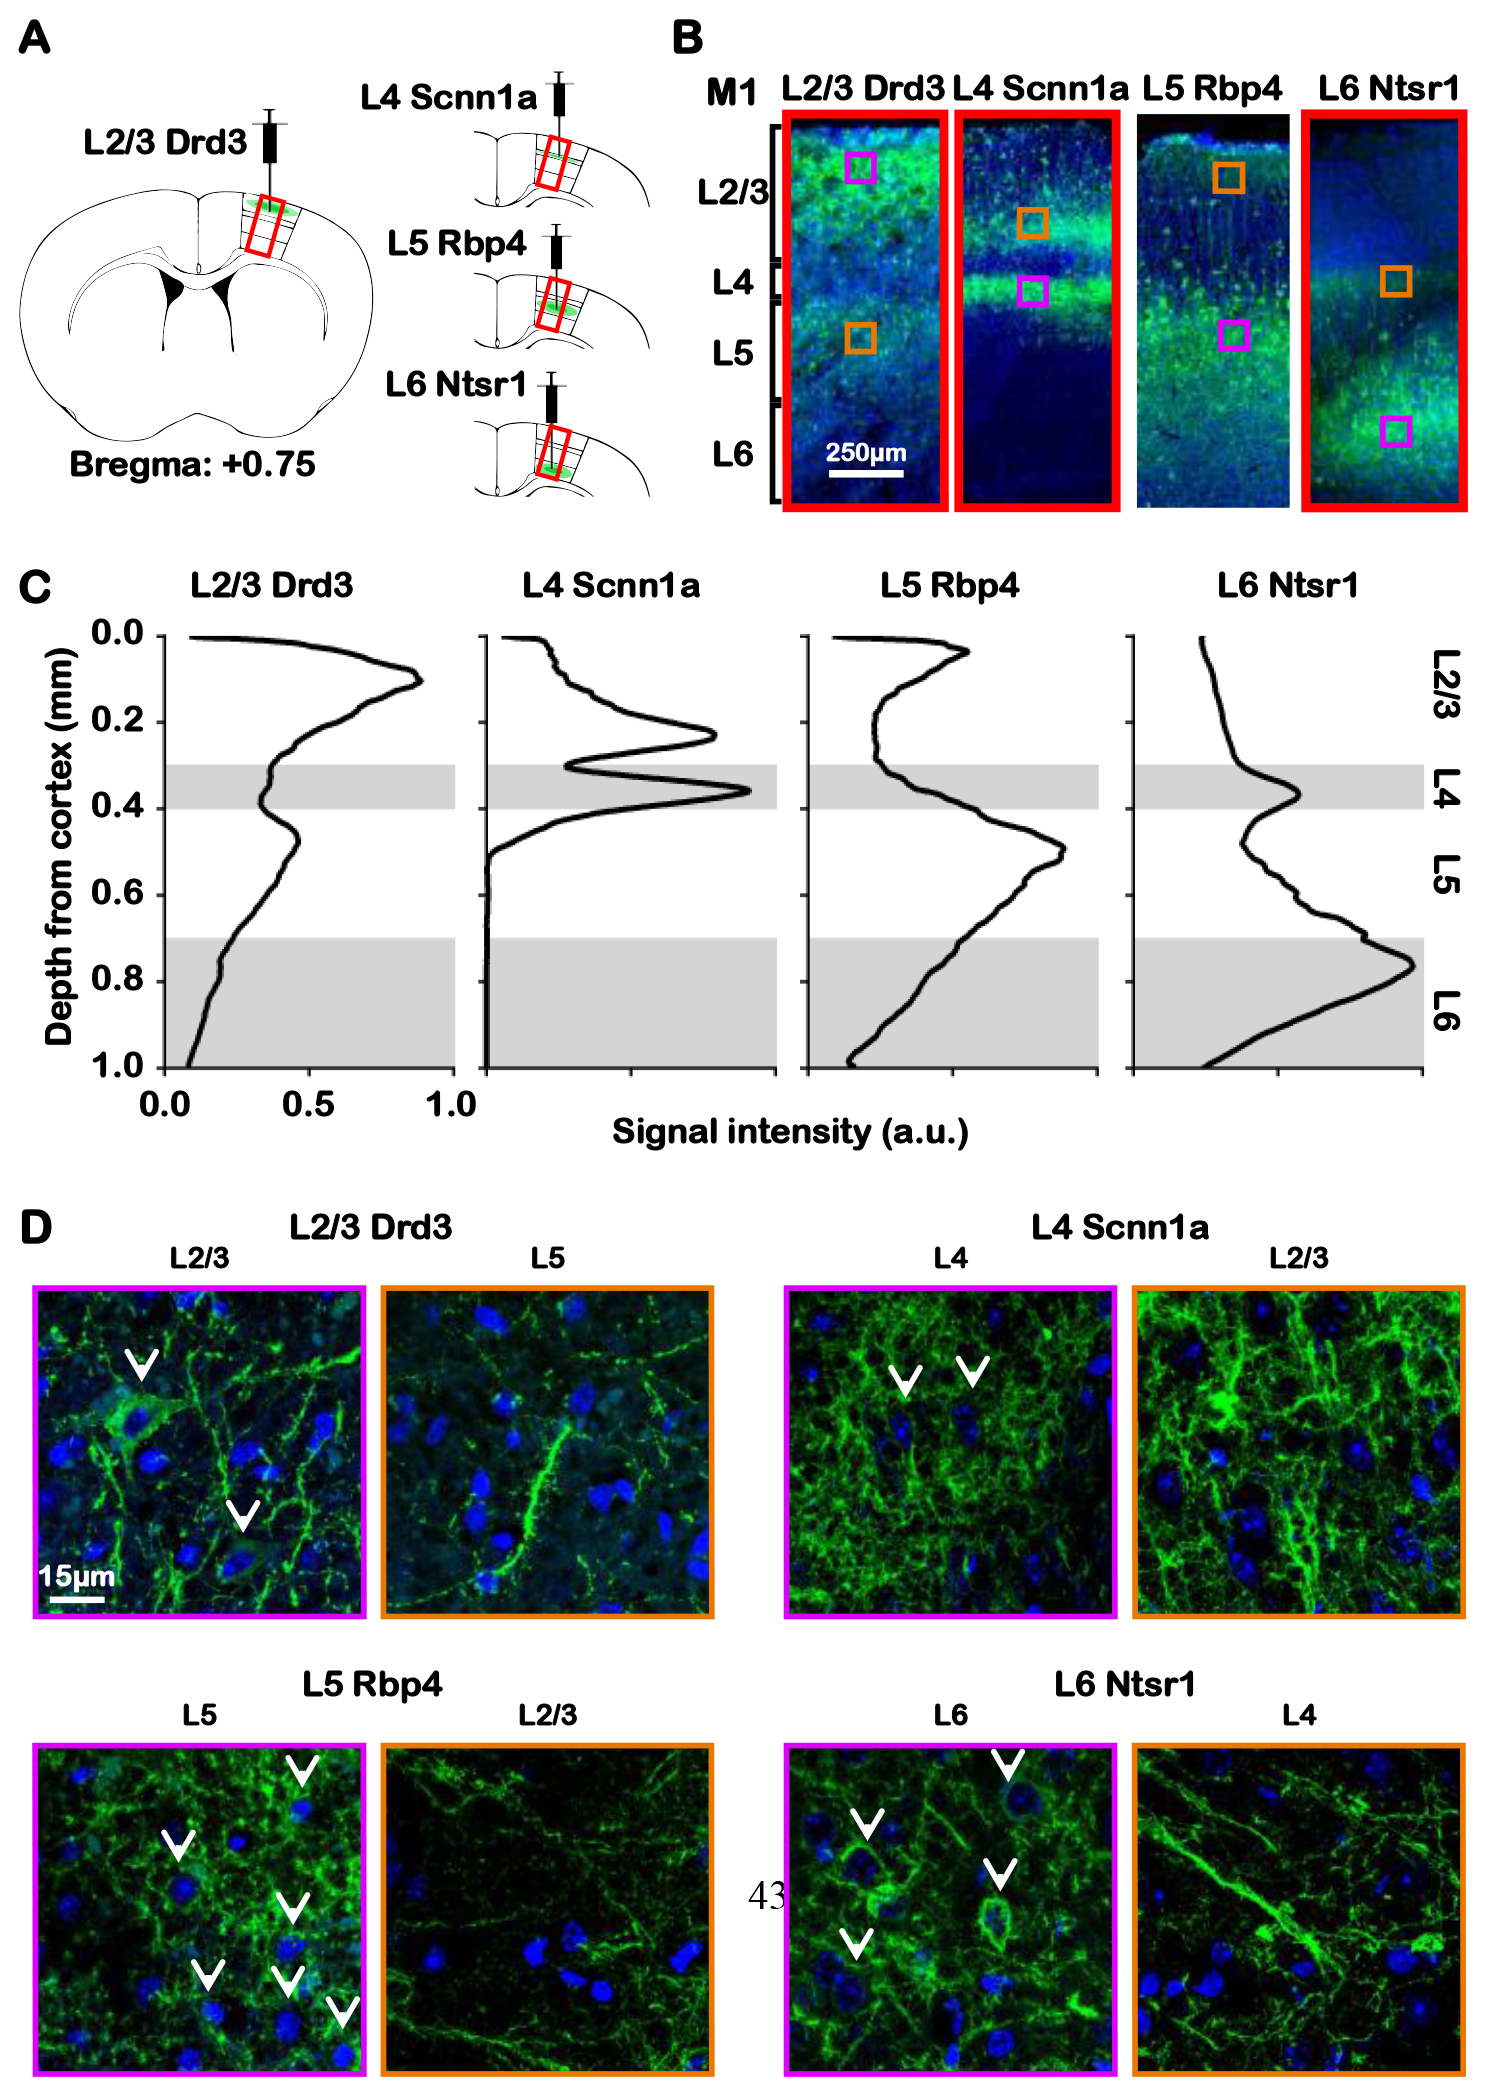
(A) Illustration presents the viral injection sites in respective layers of M1. (B) Representative fluorescence images from the four layer-specific Cre-lines show robust ChR2-EYFP expression throughout their respective layers and intra-cortical projections in the M1. (C) Normalized signal intensity plots along the M1 cortical depth show a local peak throughout their respective layers and intra-cortical projections. (D) Merged representative confocal images of ChR2-EYFP and stained nuclear marker DAPI confirmed colocalization of ChR2-EYFP and M1 neurons throughout their respective layers (white arrows), but not their intra-cortical projections. Together, ChR2-EYFP expression is observed in L2/3 M1 neurons and L5 projections for Drd3 L2/3 Cre-line, in L4 M1 neurons and L2/3 projections for Scnn1a L4 Cre-line, in L5 M1 neurons and L2/3 projections for Rbp4 L5 Cre-line, and in L6 M1 neurons and L4 projections for Ntsr1 L6 Cre-line.
Whole-brain ofMRI was used to determine spatiotemporal characteristics of brain-wide evoked responses driven by neuron-specific M1 stimulation. Mice were lightly anesthetized and sedated using a combination of isoflurane (0.25 %) and dexmedetomidine (0.1 mg/kg/hr). Optical pulses were delivered at 5 Hz (30 % pulse width duty cycle; light intensity, 30-50 mW/mm2) and a general linear model (GLM) was used to identify voxels significantly modulated during stimulation. fMRI activation maps (Fig. 2A, p < 0.001, false discovery rate (FDR) corrected, n = 12) and blood oxygen level dependent (BOLD) signal-vs-time profiles (Fig. 2G) show that neuron-specific M1 stimulations at 5 Hz activated distinct brain-wide networks. BOLD signal-vs-time profiles were extracted using atlas-based, anatomically-defined regions of interest (ROIs; Fig. 2B). Stimulation of Drd3 neurons (within L2/3) activated only ipsilateral M1 (Figs. 2A and 2G). Stimulation of Scnn1a neurons (within L4) activated ipsilateral M1, with negative BOLD responses observed in contralateral M1, ipsilateral CPu, contralateral CPu, and ipsilateral VL (Figs. 2A and 2G). Stimulation of Rbp4 neurons (within L5) evoked robust ipsilateral M1, bilateral CPu, ipsilateral VL, ipsilateral posterior nucleus, and ipsilateral perifascicular thalamic nucleus activations, with relatively small BOLD responses detected in contralateral M1 (Fig. 2A, Fig. 2G, SFig. 11). Note that the BOLD signal in the contralateral CPu peaked after the stimulation period (Fig. 2G). Lastly, stimulation of Ntsr1 neurons (within L6) evoked robust ipsilateral VL, ipsilateral posterior nucleus, and ipsilateral perifascicular thalamic nucleus activations (Fig. 2A, Fig. 2G, SFig. 11). Bilateral M1 and CPu responses were also observed during Ntsr1 stimulation (within L6) with the BOLD signal transitioning from negative to positive (Fig. 2G).
Figure 2: Stimulations of neurons specific to M1 layers evoke distinct brain-wide ofMRI responses.
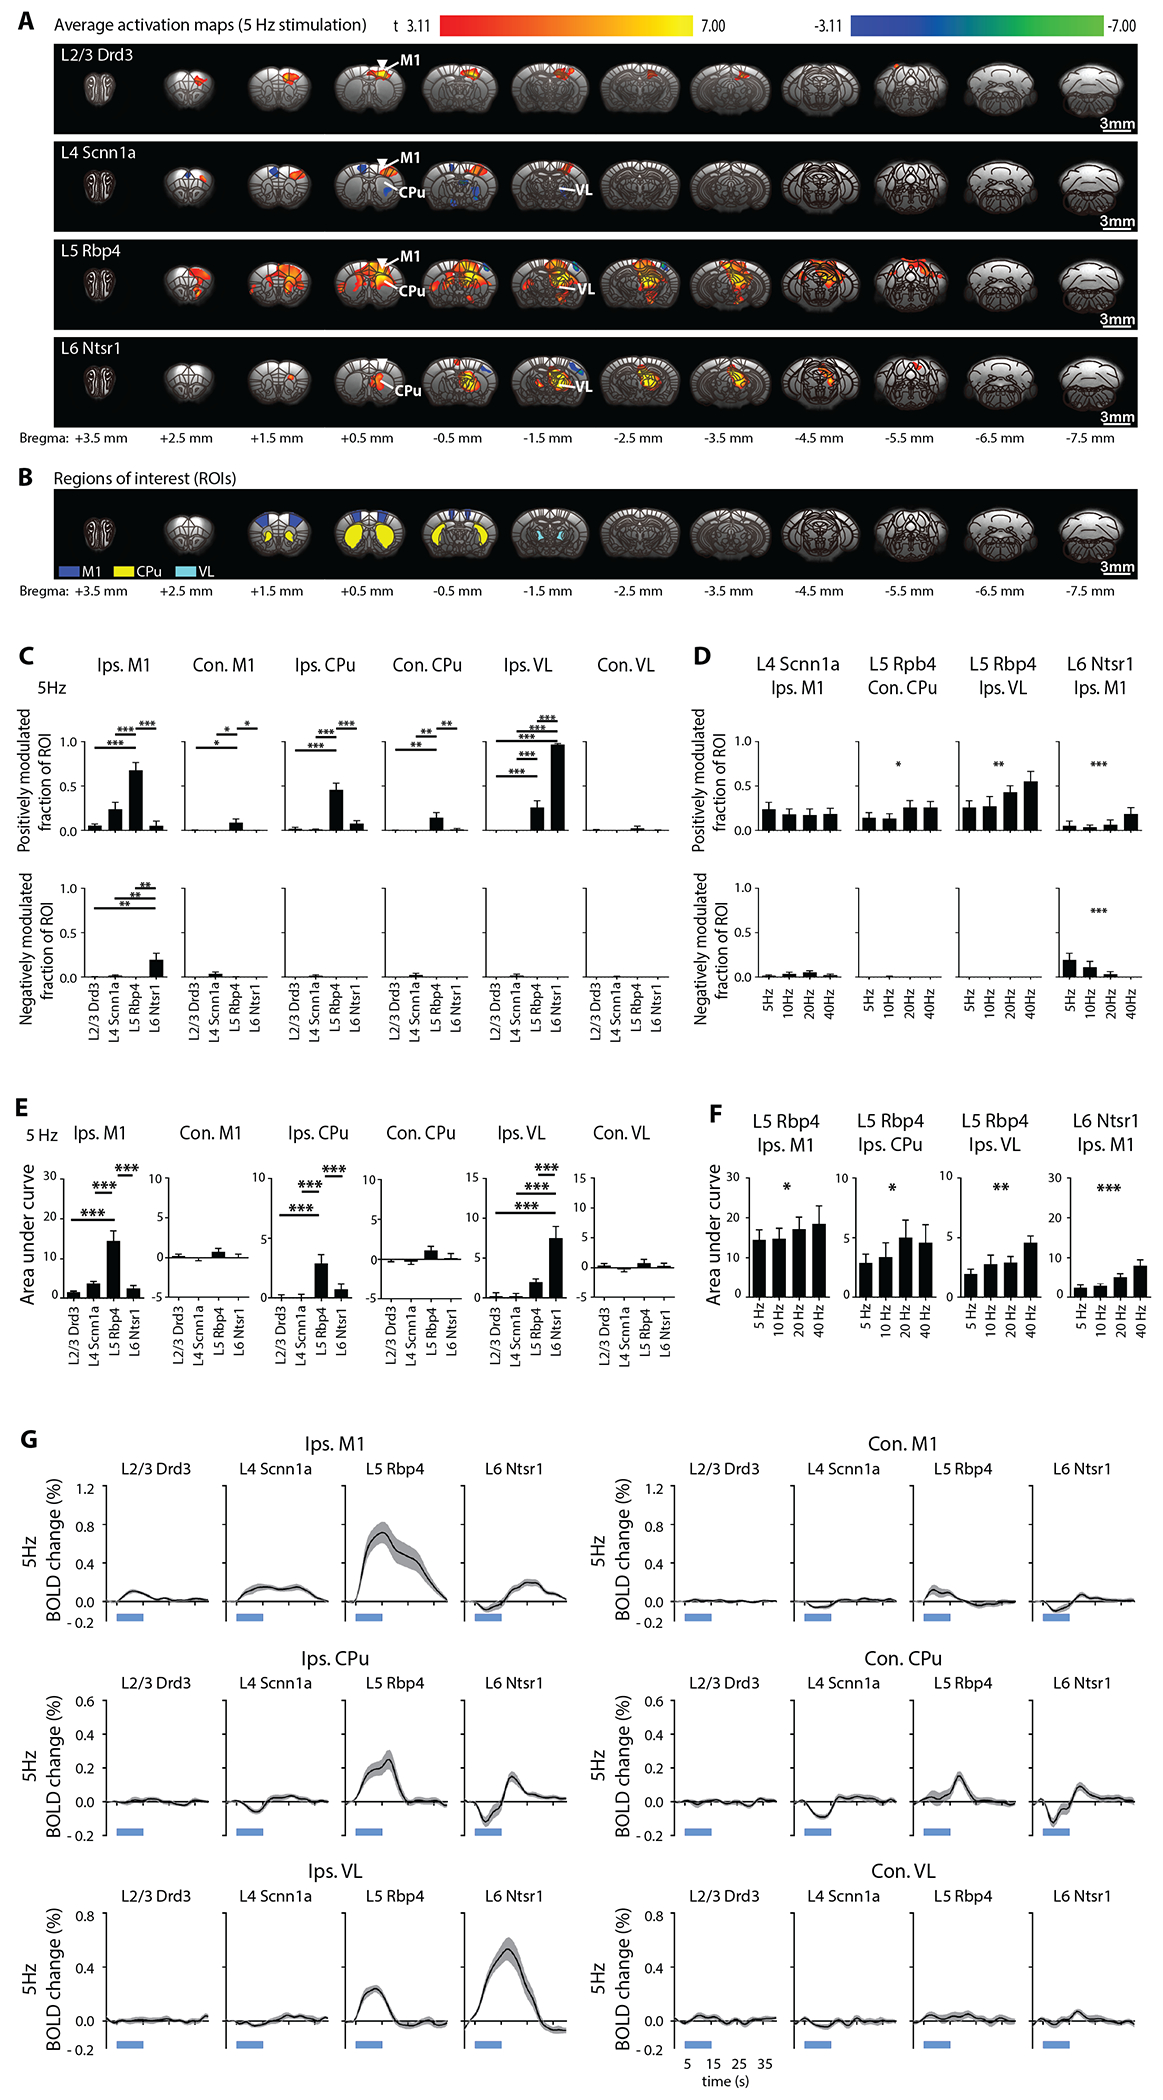
(A) Group-level activation maps during Drd3 (within L2/3), Scnn1a (within L4), Rbp4 (within L5), and Ntsr1 (within L6) M1 stimulation at 5 Hz (n = 12 animals per Cre-line, total N = 48 animals; p < 0.001, FDR-corrected). Inverted white triangle indicates site of stimulation; warm and cool colors indicate positive and negative t-scores, respectively. Abbreviations: primary motor cortex (M1), caudate putamen (CPu), ventrolateral thalamic nucleus (VL). (B) Regions of interest (ROIs) are defined based on the mouse brain atlas to quantify the activation maps. (C) Fraction of ROI positively (top) and negatively (bottom) modulated were extracted. Drd3 (within L2/3) stimulation activated only ipsilateral M1. Scnn1a (within L4) stimulation activated ipsilateral M1, while small negative responses were observed in contralateral M1, ipsilateral CPu and ipsilateral VL. Rbp4 (within L5) stimulation evoked robust ipsilateral M1, bilateral CPu and ipsilateral VL activations. Ntsr1 (within L6) stimulation evoked negative ipsilateral M1 response, positive ipsilateral CPu response and robust VL activations. Rbp4 (within L5) stimulation evoked the strongest responses in ipsilateral M1 and bilateral CPu compared to stimulations within L2/3, L4 and L6. For ipsilateral VL, Ntsr1 (within L6) stimulation evoked the strongest activations, while Rbp4 (within L5) stimulation evoked stronger activations compared to stimulations within L2/3 and L4. One-way ANOVA followed by Bonferroni’s post hoc test was used (*p < 0.05, **p < 0.01 and ***p < 0.001; error bars indicate ±SEM). (D) Fraction of ROI positively (top) and negatively (bottom) modulated were extracted to compare ofMRI responses between different frequencies (5, 10, 20, and 40 Hz). The fraction of ROI positively modulated had an increasing trend with frequency in contralateral CPu and ipsilateral VL during Rbp4 (within L5) stimulation. For Ntsr1 (within L6) stimulation, ipsilateral M1 responses had increasing trends with increasing stimulation frequency for fraction of ROI positively modulated, while a decreasing trend with frequency was observed for fraction of ROI negatively modulated. One-way ANOVA followed by trend analysis was applied (*p < 0.05, **p < 0.01 and ***p < 0.001; error bars indicate ±SEM). (E) Area under the curve (AUC) was calculated for the comparison of the extracted BOLD signal. Rbp4 (within L5) stimulation evoked the strongest responses in ipsilateral M1 and ipsilateral CPu compared to stimulations within L2/3, L4, and L6, while Ntsr1 (within L6) stimulation evoked the strongest ipsilateral VL activations. One-way ANOVA followed by Bonferroni’s post hoc test was used (n = 12 animals per Cre-line, total N = 48 animals; *p < 0.05, **p < 0.01 and ***p < 0.001; error bars indicate ±SEM). (F) Similarly, AUC was calculated for the comparison of the extracted BOLD signal between different frequencies (5, 10, 20, and 40 Hz). AUC had an increasing trend in ipsilateral M1 during Rbp4 (within L5) and Ntsr1 (within L6) stimulations, as well as ipsilateral CPu and VL during ~L5 stimulation. One-way ANOVA followed by trend analysis was applied (*p < 0.05, **p < 0.01 and ***p < 0.001; error bars indicate ±SEM). (G) BOLD signal profiles. The short, thick, blue line under the x-axis indicates the 10-s light-on period. Abbreviations: primary motor cortex (M1), caudate putamen (CPu), ventrolateral thalamic nucleus (VL).
To compare response patterns between different neuron-specific stimulations, for each atlas-based anatomically-defined ROI we calculated the fraction of ROI positively and negatively modulated, and area under the extracted BOLD signal profile (Figs. 2C and 2E; one-way ANOVA, Bonferroni’s post hoc test). Comparing the different neuron-specific stimulations, Rbp4 (within L5) stimulation evoked the strongest ipsilateral M1 and bilateral CPu activations (Figs. 2C and 2E). Rbp4 (within L5) stimulation evoked significantly stronger activations than Drd3 (within L2/3) and Scnn1a (within L4). Ntsr1 (within L6) stimulation evoked the strongest ipsilateral VL activations (Figs. 2C and 2E).
Since the CPu and VL were robustly activated during Rbp4 (within L5) and Ntsr1 (within L6) stimulations, respectively, histology and immunohistochemistry of these regions were examined. Long-range M1 L5 and L6 projections were revealed in the CPu and VL (SFig. 1), respectively, supporting our fMRI results.
Since stimulation frequency can evoke distinct local and brain-wide response18,21,22,26, we also applied 10, 20, and 40-Hz neuron-specific M1 stimulations within the same animals to investigate frequency-dependent spatiotemporal network characteristics. The BOLD responses evoked by these stimulation frequencies largely resembled responses evoked by 5-Hz stimulation (SFig. 2). The fraction of ROI positively modulated had an increasing trend with frequency in contralateral CPu and ipsilateral VL during Rbp4 (within L5) stimulation (Fig. 2D; one-way ANOVA followed by trend analysis). For Ntsr1 (within L6) stimulation and ipsilateral M1 response, the fraction of ROI positively modulated tended to increase with increasing stimulation frequency, while the fraction of ROI negatively modulated tended to decrease with frequency (Fig. 2D; one-way ANOVA followed by trend analysis). The area under the curve of the BOLD signal tended to increase with stimulation frequency in ipsilateral M1 during Rbp4 (within L5) and Ntsr1 (within L6) stimulations, as well as ipsilateral CPu and VL during Rbp4 (within L5) stimulation (Fig. 2F; one-way ANOVA followed by trend analysis). In addition, the BOLD signal in the ipsilateral M1 transitioned from negative to positive during 5 and 10-Hz stimulations within L6, but not 20 and 40-Hz stimulations (SFig. 3A). No evoked responses were observed in a naïve animal (SFig. 4), indicating that the observed responses were a direct consequence of ChR2 stimulation rather than heat induced artifacts or undesired light-induced activations27,28. It should be noted that there are potential limitations in resolving layer specific signals with the fMRI parameters used (raw spatial resolution = 267 x 267 x 1000 mm3, spatial smoothing applied with FWHM = 2 pixels), and inter-subject averaging.
Neuronal underpinnings of the brain-wide fMRI responses
The ofMRI experiments revealed robust BOLD activation patterns in many regions, including ipsilateral M1, CPu, and VL (Fig. 2). Since CPu and VL have direct projections from M1 (SFig. 1), we focused on those regions for the electrophysiology experiments. We obtained simultaneous in vivo extracellular recordings in ipsilateral M1, CPu, and VL under the same conditions as the ofMRI experiments (5-Hz stimulations: Figs. 3 and 4; 10, 20, and 40-Hz stimulations: SFigs. 5 and 6; n = 4 for each neuron-specific Cre-line). Local field potential (LFP) recordings revealed that Drd3 (within L2/3) stimulation mainly evoked responses in ipsilateral M1 (Fig. 3B and SFig. 5A). On the other hand, stimulation of Scnn1a (within L4), Rbp4 (within L5), and Ntsr1 (within L6) evoked distinct LFP responses in the ipsilateral M1, CPu, and VL (Fig. 3B and SFig. 5A): For example, Rbp4 stimulation resulted in a larger amplitude in ipsilateral M1 and smaller amplitude in ipsilateral VL, relative to Scnn1a and Ntsr1 stimulation. Moreover, Ntsr1 stimulation (within L6) resulted in a larger amplitude in ipsilateral VL, relative to Scnn1a and Rbp4 stimulation. Rbp4 (within L5) stimulation caused the strongest change in evoked LFP response in ipsilateral M1 (compared to ipsilateral CPu and VL), whereas Ntsr1 (within L6) stimulation caused the strongest change in ipsilateral VL (compared to ipsilateral M1 and CPu), consistent with our fMRI results (Fig. 2). Evoked LFP responses correlated with the BOLD-fMRI responses (p < 0.001; Fig. 3D). After the first second of stimulation, the amplitude of the LFP response generally decreased with stimulation frequency for all four neuron-specific stimulations (SFig. 5C). During the first second of stimulation, however, the polarity (positive or negative) and amplitude of the LFP response was relatively constant across stimulation frequencies (SFig. 5A).
Figure 3: LFP recordings reveal activations in M1 for all stimulations of neurons specific to M1 layers, and in CPu and VL for stimulations within L4, L5, and L6 only, which correlates with fMRI activations.
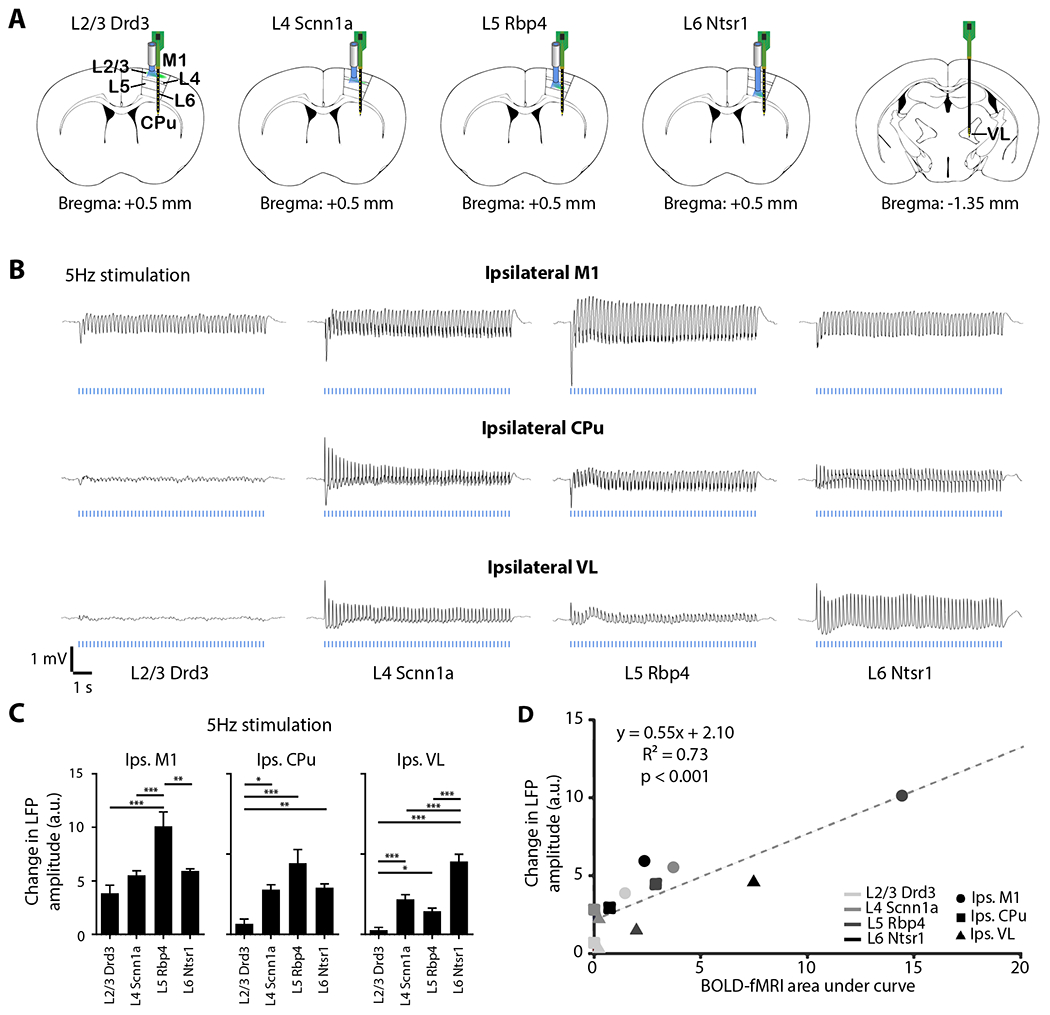
(A) Schematic shows recording optrode and electrode locations in ipsilateral M1, CPu, and VL. (B) Average LFP (n = 4 animals per Cre-line, total N = 16 animals) from ipsilateral M1, VL, and CPu neuron-specific M1 stimulation at 5 Hz shows robust activation in M1 for all Cre-lines, and in CPu and VL for Scnn1a (within L4), Rbp4 (within L5) and Ntsr1 (within L6) Cre-lines. (C) Change in LFP amplitude during stimulation was calculated to quantify the LFP traces. Rbp4 (within L5) stimulation evoked the strongest change in LFP amplitude in ipsilateral M1. Drd3 (within L2/3) stimulation evoked the weakest change in LFP amplitude in ipsilateral CPu. For ipsilateral VL, Ntsr1 (within L6) stimulation evoked the strongest change in LFP amplitude, while Rbp4 (within L5) and Scnn1a (within L4) stimulation evoked stronger activations compared to Drd3 (within L2/3). These LFP results are similar to the fMRI results. One-way ANOVA followed by Bonferroni’s post hoc test was used (*p < 0.05, **p < 0.01 and ***p < 0.001; error bars indicate ±SEM). (D) Scatter plot shows correlation between change in LFP amplitude and BOLD-fMRI area under the curve in ipsilateral M1, CPu, and VL for all Cre-lines (p < 0.001).
Figure 4: Distinct spike responses and dynamics evoked by stimulations of neurons specific to M1 layers correlating with fMRI results.
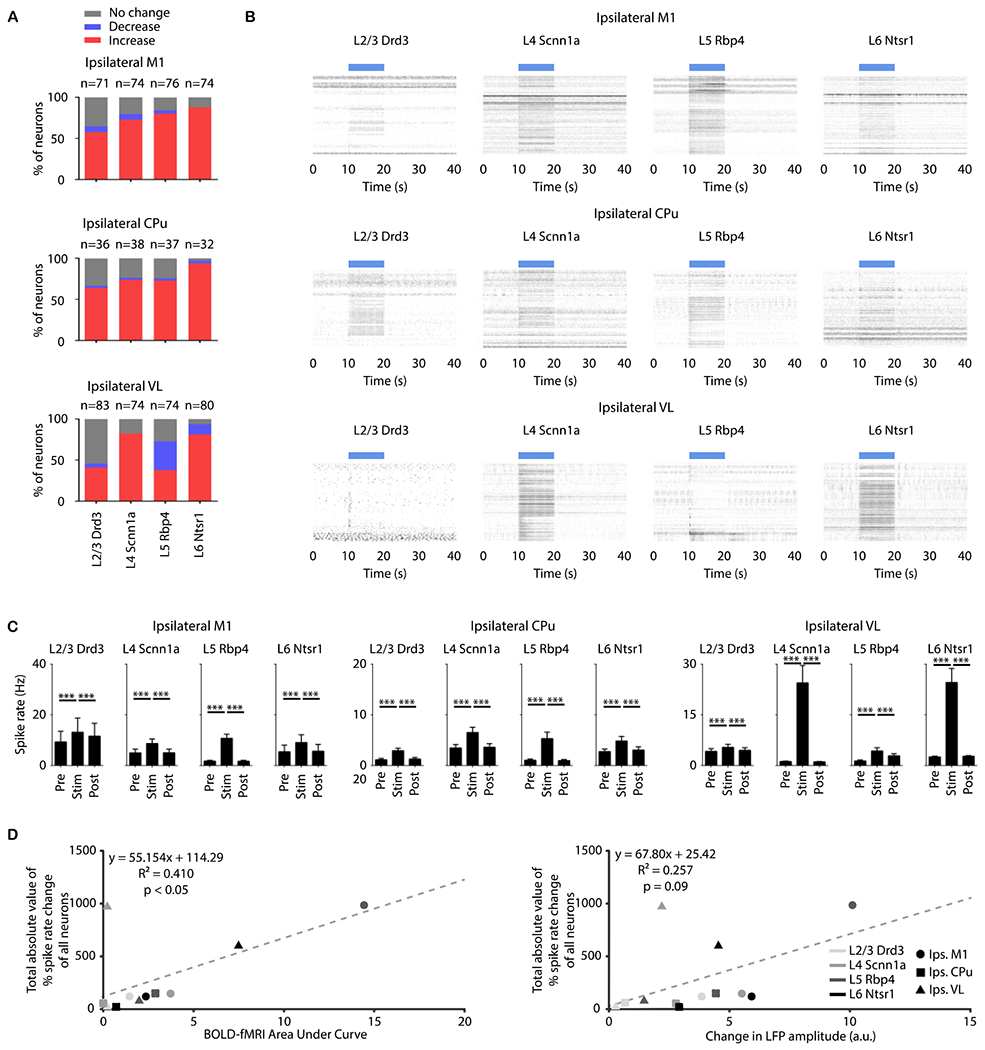
(A) Quantification of significant changes in firing rate across recorded units. For each unit, paired student t-test was applied and results with p < 0.05 were considered significant (n = 4 animals per Cre-line, total N = 16 animals). Red, blue, and gray indicate units with significant increase, significant decrease, and no significant change, respectively, during stimulation. Over half were modulated by nearly all M1 stimulations at 5 Hz. Nearly all modulated units exhibited a significant increase in firing rate except for those in the ipsilateral VL during Rbp4 (within L5) and Ntsr1 (within L6) stimulations. (B) Spike raster plots across all units with significant increased firing rates in the ipsilateral M1, CPu, and VL during layer-specific stimulation. Robust increases in spike rates were observed in the ipsilateral M1 and CPu during stimulation within L2/3, L4, L5, and L6, while robust increase in spike rate in ipsilateral VL was only observed during stimulation within L4, L5, and L6. (C) Average firing rates of units with significant increase before, during, and after stimulation (10 s periods, one-way ANOVA followed by Bonferroni’s post hoc test; *p < 0.05, **p < 0.01 and ***p < 0.001; error bars indicate ±SEM). (D) Scatter plots of total absolute value of percentage spike rate change of all neurons against BOLD-fMRI area under the curve and against change in LFP amplitude.
Since the BOLD signal is thought to be associated with spiking output, we also analyzed the spike recordings in ipsilateral M1, CPu, and VL. With the exception of ipsilateral VL with Drd3 stimulation, over half of the units were modulated (either positively or negatively) by the stimulation of every neuron type (Fig. 4A and Supplementary Table 1; n = 4 for each specific Cre-line; 20 trials per frequency per animal). Most modulated units exhibited a significant increase in firing rate except for those in the ipsilateral VL during Rbp4 (within L5) stimulation (Fig. 4A and Supplementary Table 2). Among the units with significantly increased firing rates (red bars of Fig. 4A), the spike rates in the ipsilateral M1, ipsilateral CPu, and ipsilateral VL significantly increased during all neuron-specific stimulations at all frequencies (Fig. 4C and SFig. 6E; p < 0.001; one-way ANOVA, Bonferroni’s post hoc test). Since BOLD-fMRI and LFP responses reflect large scale net activity within a region, we included all recorded units when exploring the association between spiking, BOLD-fMRI, and LFP. For stimulation frequencies of 5 Hz, the total absolute value of % spike rate change of all neurons (defined as the sum, across all units, of the absolute value of % spike rate change) is reasonably well correlated with BOLD-fMRI area under the curve (p < 0.05), but less so with change in LFP amplitude (p = 0.09; Fig. 4D and SFig. 6H and 6I). Some units exhibited a significant decrease in firing rate in the ipsilateral VL during Rbp4 (within L5) and Ntsr1 (within L6) stimulations (Fig. 4A, SFig. 6A, 6F and 6G, and Supplementary Table 3). No evoked responses were observed in the naïve animal (SFig. 7), indicating that the observed responses were direct consequences of ChR2 stimulation and not photovoltaic induced artifacts or undesired light-induced activations29,30.
Layer-specific fMRI responses and their neuronal origins
To examine layer-specific fMRI representation of neuronal activity, we first analyzed the local fMRI responses during stimulation of neurons specific to each M1 layer. Local fMRI activation maps show that neuron-specific M1 stimulation activates distinct locations (Fig. 5A; p < 0.001, FDR corrected, n = 12). Within local M1 regions, fMRI response tended to increase along the cortical depth (Fig. 5B; one-way ANOVA followed by trend analysis). For Ntsr1 (within L6) stimulation, the BOLD signal showed a strong negative response during the stimulation (first few seconds of the curve), which gradually went away with cortical depth (Fig. 5C) and higher stimulation frequency (SFig. 8C).
Figure 5: Distinct laminar ofMRI responses evoked by 5-Hz stimulations of neurons specific to M1 layers.
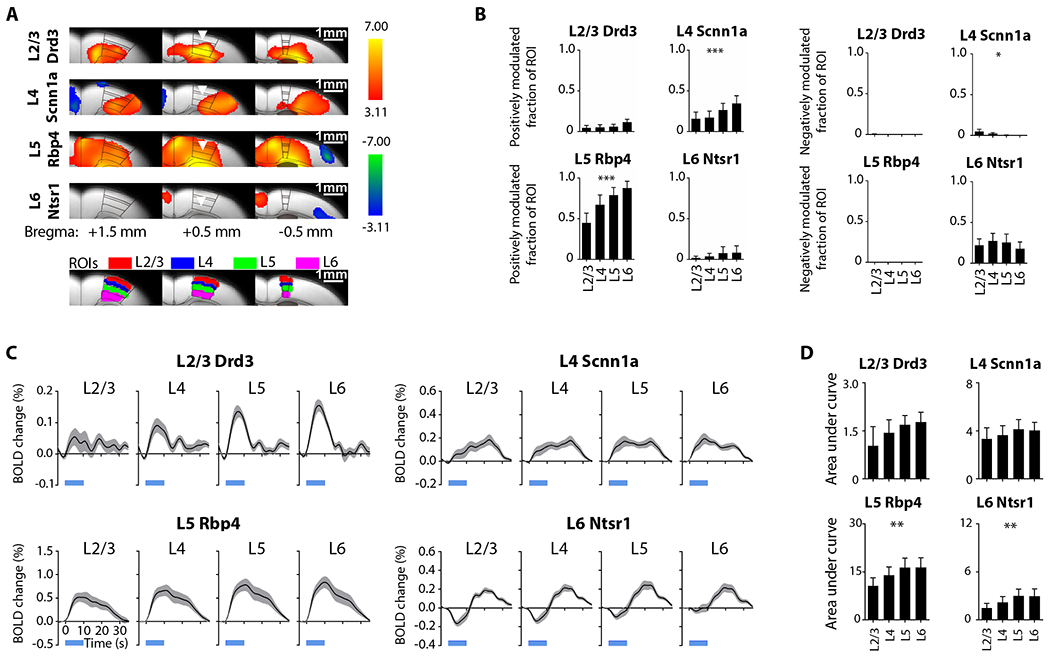
(A) Group-level M1 local activation maps during M1 stimulation within L2/3, L4, L5, and L6 at 5 Hz (n=12 animals per Cre-line, total N = 48 animals; p < 0.001, FDR-corrected). Distinct laminar fMRI responses were observed. Inverted triangle indicates site of stimulation; warm and cool colors indicate positive and negative t-scores, respectively. Regions of interest (ROIs; bottom) were defined based on the mouse brain atlas to quantify the layer-specific activations at the local ipsilateral M1. (B) Extracted fraction of ROI positively (left) and negatively (right) modulated for the comparison of ofMRI responses across different layers. Fraction of ROI positively modulated exhibit an increasing trend along the cortical depth during Scnn1a (within L4) and Rbp4 (within L5) stimulations, while fraction of ROI negatively modulated exhibit a decreasing trend along the cortical depth during Scnn1a (within L4) stimulation. (C) BOLD signal profiles extracted from the ROIs. These BOLD signal profiles also appear to exhibit an increasing trend along the cortical depth. (D) Area under the curve (AUC) was calculated form the extracted BOLD profiles for the comparison across different layers. AUC exhibit an increasing trend along the cortical depth during stimulations within L5 and L6. One-way ANOVA followed by trend analysis was applied (*p < 0.05, **p < 0.01 and ***p < 0.001). Error bars indicate ±SEM.
To understand the origins of such layer-specific fMRI responses, we analyzed in vivo extracellular recordings obtained along the M1 cortical depth (Figs. 6 and 7). The LFP amplitude decreased along the cortical depth during Drd3 (within L2/3) and Rbp4 (within L5) stimulations, but increased during Scnn1a (within L4) and Ntsr1 (within L6) stimulation (Fig. 6B and 6C). There was an overall correlation between the LFP and laminar BOLD-fMRI signal across all four neuron-specific stimulations and resulting responses in all layers (p < 0.05; Fig. 6D). The amplitude of the LFP responses generally decreased with stimulation frequency with all four neuron-specific stimulations (SFig. 9C). LFP responses during the first second of stimulation had similar polarity (positive or negative) and similar amplitude across stimulation frequencies (SFig. 9A). We also examined neuronal spiking activity along the M1 cortical depth in response to M1 neuron-specific stimulations (Fig. 7). Over half of all recorded units were modulated (either positively or negatively) by the selective stimulation of each neuron type (Fig. 7A and Supplementary Table 4; n = 4 for each Cre-line, 20 trials per frequency per animal). Furthermore, nearly all modulated units exhibited a significant increase in firing rate (Fig. 7A and Supplementary Tables 5 and 6; 4 animals per neuron-specific stimulation, 20 trials per frequency per animal). The spike rates significantly increased in all layers during Rbp4 (within L5) and Ntsr1 (within L6) stimulations (Fig. 7C; one-way ANOVA, Bonferroni’s post hoc test). The scatter plots show that spike rate correlates with the laminar BOLD-fMRI signal (p < 0.01) and the change in LFP (p < 0.001) (Fig. 7D and SFig. 10).
Figure 6: Laminar LFP recordings along M1 cortical depth reveal layer-specific activations which correlate with laminar fMRI responses.
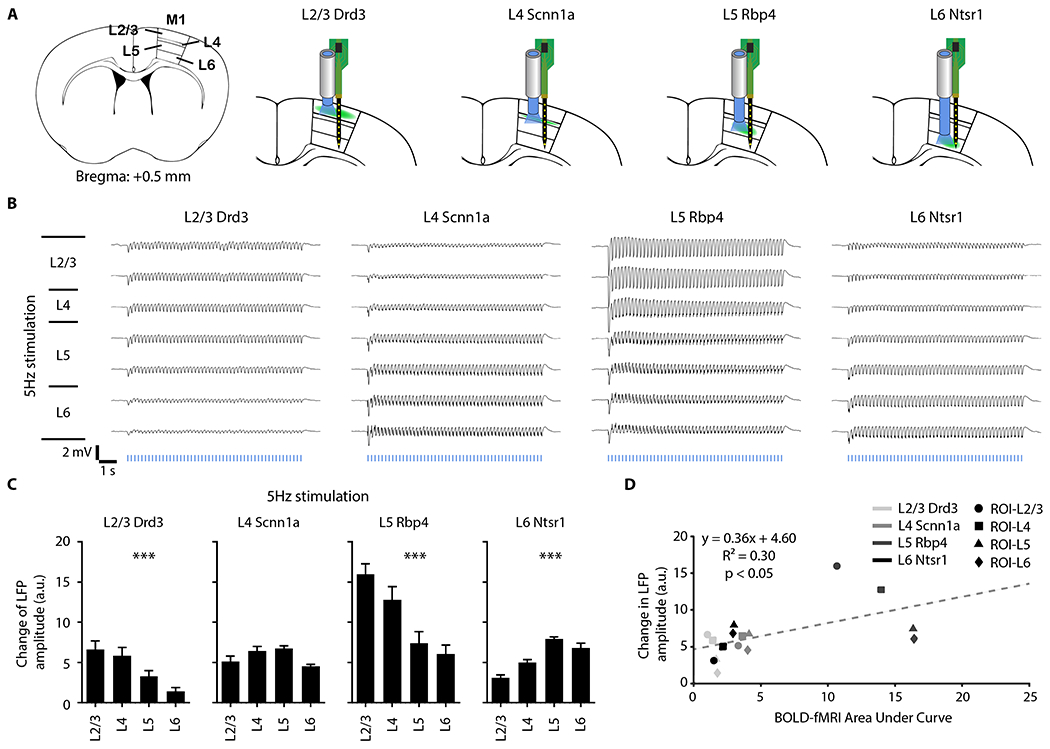
(A) Schematic shows laminar recording optrode location in ipsilateral M1 along cortical depth. (B) Average LFP traces (n = 4 animals per Cre-line, total N = 16 animals) of ipsilateral M1 along cortical depth at 5-Hz neuron-specific optogenetic stimulation. (C) Change in LFP amplitude during stimulation was calculated to quantify the LFP traces. The change in LFP amplitude decreased along the cortical depth during Drd3 (within L2/3) and Rbp4 (within L5) stimulation, while the amplitude increased along the cortical depth during Ntsr1 (within L6) stimulation. One-way ANOVA followed by trend analysis was applied (*p < 0.05, **p < 0.01 and ***p < 0.001). Error bars indicate ±SEM. (D) Scatter plot of change in LFP amplitude against BOLD-fMRI area under the curve along the cortical depth in ipsilateral M1 for all Cre-lines (p < 0.05) shows that our LFP and fMRI results are correlated.
Figure 7: Distinct laminar spiking dynamics evoked by neuron-specific M1 stimulation at 5 Hz correlated with laminar fMRI responses and change in LFP amplitude.
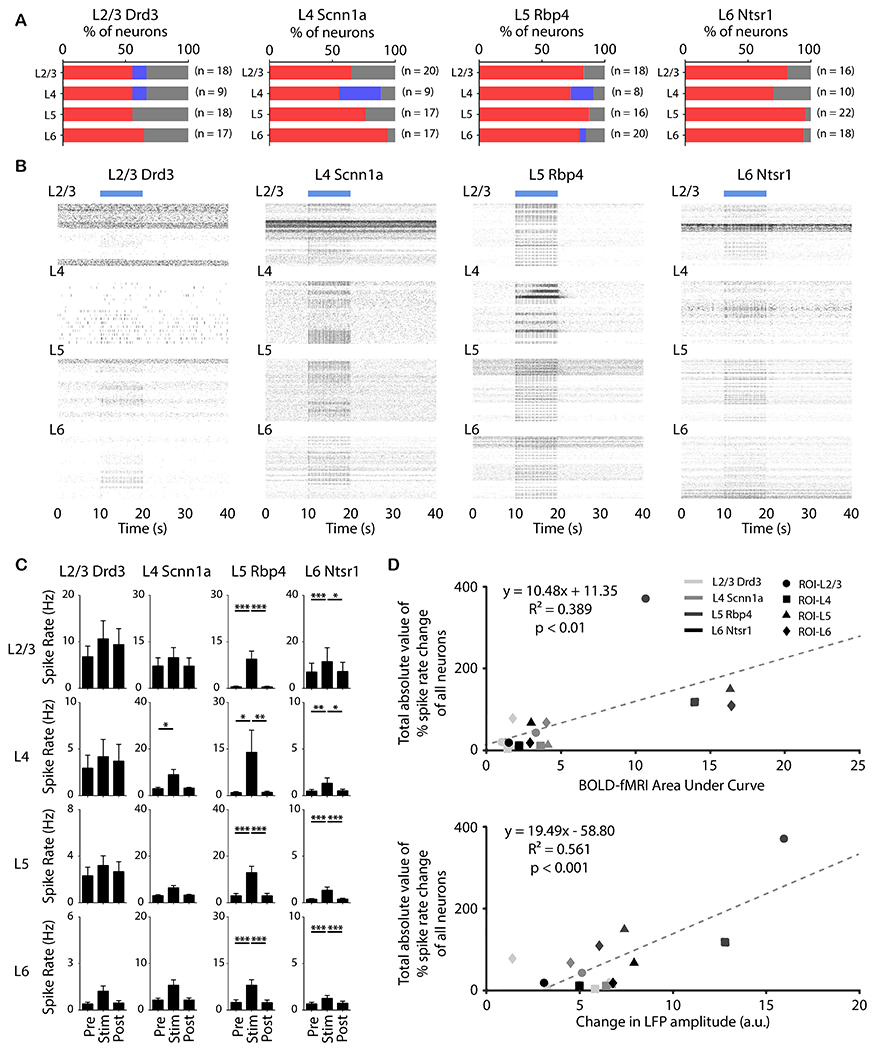
(A) Quantification of significant changes in firing rate across recorded units. For each unit, paired student t-test was applied and results with p < 0.05 were considered significant (n = 4 animals per Cre-line, total N = 16 animals). Red, blue, and gray indicate units with significant increase, significant decrease, and no significant change, respectively, during stimulation. Over half of the recording units were modulated by the selective stimulation of neurons within each layer. Furthermore, nearly all modulated units exhibited a significant increase in firing rate. (B) Spike raster plot across all units which had significant increased firing rates along ipsilateral M1 cortical depth during stimulation within L2/3, L4, L5, and L6 at 5 Hz. Interestingly, a robust increase in spike rates was observed in L6 during Drd3 (within L2/3) stimulation. (C) Average firing rates of units which had significant increase before, during, and after stimulation (10 s periods, one-way ANOVA followed by Bonferroni’s post hoc test; *p < 0.05, **p < 0.01 and ***p < 0.001; error bars indicate ±SEM). (D) Scatter plots of total absolute value of percentage spike rate change of all neurons against BOLD-fMRI area under the curve (p < 0.01) and against change in LFP amplitude (p < 0.001).
The summary of the R2 values of the scatter plots between spiking parameters and brain-wide BOLD-fMRI (Supplementary Table 7), between spiking parameters and long-range LFP recordings (Supplementary Table 8), between spiking parameters and laminar BOLD-fMRI (Supplementary Table 9), and between spiking parameters and laminar LFP recordings (Supplementary Table 10) generally showed that the spiking parameter, total absolute value of percentage spike rate change of all neurons, tends to yield the highest correlation.
Discussion
In this work, we combined neuron-specific Cre-driver mouse lines, optogenetics, fMRI, and electrophysiological recordings to increase our understanding of brain-wide (Figs. 2 – 4) and local (Figs. 5 – 7) M1 layer-specific networks. Our results showed that BOLD (Fig. 2), LFP (Fig. 3), and spike (Fig. 4) responses were mainly confined within M1 during Drd3 (within L2/3) stimulations, while in contrast, Rbp4 (within L5) stimulations evoked local (M1) and brain-wide (e.g. CPu and VL) responses. Since L2/3 of the somatosensory cortex can suppress L58, we speculate that M1 L2/3 stimulation limits activity in the deeper layers of M1 and inhibits downstream propagation to regions such as the CPu and VL. Closer examination of local responses in M1 showed that BOLD-fMRI (Fig. 5) responses occurred mostly within the deeper layers (L5 and L6) of M1 during Drd3 (within L2/3) stimulations, while Rbp4 (within L5) stimulations evoked strong responses in all layers. Collectively considering all neuron-specific stimulations, LFP amplitude (Fig. 6) and spike rate change (Fig. 7) correlated with BOLD-fMRI area under the curve. Future studies may address the role(s) of each layer in coordinating and gating large-scale motor networks.
Originally, M1 was considered an agranular cortical area with no cytologically distinct L431,32. Studies eventually revealed the existence of an L4 composed of a thin band of pyramidal cells33,34 with thalamic afferents innervated at the middle of M135,36. Further research demonstrated functional characteristics of the L45,37. While recent studies support the existence of an L4 in M157,58, controversies still remain. In the present work, our data strongly support the presence of L4 in M1.Our florescence images clearly showed ChR2-EYFP expression in L4 neurons for the Scnn1a Cre-line mice in M1 (Figs. 1B – D). The thickness of the ChR2-EYFP expression in L4 was ~100 μm (Figs. 1B – C) which is consistent with previous reports5. ChR2-EYFP expression was observed in L2/3 projections from L4, which is also consistent with the literature5. From a functional perspective, our electrophysiological recordings demonstrated that M1 L4 responses can be evoked by optogenetic stimulation of neurons within L4, L2/3, L5, or L6 (Figs. 6–7). Activities initiated from M1 L4 can even propagate downstream to the CPu and VL (Figs. 2–4). Our histology, electrophysiology, and ofMRI results support the presence of L4 in M1 from the perspectives of both structure and function.
Motor cortex stimulation is used as a treatment for chronic neuropathic pain38–40 or for rehabilitation after stroke41–43,55. However, the success of these treatments has been mixed. One current technical limitation for human treatments is that different layers or different neuronal elements within a region cannot be selectively modulated. This makes it difficult to identify the exact mechanisms of motor cortex stimulation. By using optogenetics to achieve layer specificity for stimulation of M1, we found that each layer drives unique responses in terms of amplitude, polarity, and spatial location. Future therapeutic applications may wish to investigate targeting particular layers within this circuit. We also showed that the effect of stimulating M1 neurons depends on the stimulation frequency. Frequency could thus be a key parameter in optimizing the efficacy of motor cortex stimulation18,21,22,26,44.
The nature of neurovascular coupling remains an active area of research45,46. Various studies suggest that positive BOLD signals reflect increases in synaptic input47. Other studies link the BOLD signal to spiking activity17,18,48. In the current study, we examined neurovascular coupling between layer-specific M1 stimulation and core motor-function-related regions including cortex, striatum, and thalamus. Overall, we found that both LFP amplitude change and total absolute value of % spike rate change were significantly correlated with BOLD-fMRI area under the curve. There were a few exceptions to this: First, at 20-Hz stimulation, the correlation between LFP amplitude change and BOLD-fMRI area under the curve was not strong (SFig. 9D, p=0.09). Second, stimulation of Scnn1a neurons within L4 at 5 Hz resulted in a ratio of total absolute value of % spike rate change to BOLD fMRI area under the curve which was 10x higher in ipsilateral VL compared to other regions and stimulations (Fig. 4D). This high ratio may indicate diminished neurovascular coupling for that particular case, as the BOLD fMRI area under the curve may be considered much smaller than what is expected from the overall regression. This same ratio was also found to be disproportionately high in the following regions after stimulation of Rbp4 neurons within L5: L2/3 after 5-Hz stimulation (Fig. 7D); L4 after 40-Hz stimulation (SFig. 10D); and ipsilateral M1 after 10-40 Hz stimulation (SFig. 6H). Finally, the amplitude of LFP responses decreased with increasing stimulation frequency (SFig. 5C), while the BOLD fMRI area under the curve generally increased with stimulation frequency (SFig. 3C). In future work, it would be interesting to study these exceptions in more detail, to gain a better understanding of neurovascular coupling.
For the first half of our study, which focused on large-scale long-range BOLD fMRI and long-range electrophysiology, the correlation between BOLD fMRI and LFP (R2 = 0.73, Fig. 3D) was stronger than that of BOLD fMRI vs. spiking (R2 = 0.41, Fig. 4D). These results are in line with two previous studies63,64 which also studied long-range fMRI using large ROIs. For the second half of our study, we focused on laminar ofMRI and laminar electrophysiology. It is interesting that the correlation between laminar BOLD fMRI and laminar LFP (R2 = 0.30, Fig. 6D) was weaker than that of BOLD fMRI vs. spiking (R2 = 0.39, Fig. 7D). To our knowledge, there are no mouse studies that optogenetically stimulated different M1 layers and then looked at layer-specific ROIs from BOLD fMRI. Our results may suggest that the relationship between laminar BOLD fMRI and laminar electrophysiology is different from conventional BOLD fMRI and electrophysiology. It should be noted that optogenetic stimulation was applied in this study, and such cell type specific synchronous stimulation may play a role in our observations.
More recently, neurovascular coupling research has employed high resolution fMRI14,49. Among the M1 cortical layers in mice, L4 is considered the thinnest at ~100 μm, with L5 and L6 being the thickest at ~300 μm5. As mentioned above, it should be noted that there are potential limitations in resolving layer specific signals, given the fMRI parameters (raw spatial resolution = 267 x 267 x 1000 mm3, spatial smoothing applied with FWHM = 2 pixels) and LFP point spread function (hundreds of μm)66. With this caution in mind, we nevertheless did observe some statistically significant differences in fMRI BOLD response between the different layers. For example, L4 or L5 stimulation resulted in different fractions of positively modulated pixels (Fig. 5B), and L5 or L6 stimulation resulted in different areas under the curve (Fig. 5D). For 5-20 Hz stimulations of Ntsr1 neurons (within L6), the BOLD-fMRI signal change in superficial layers transitioned from negative (during stimulation) to positive (after stimulation) (SFig. 8C, right columns), with the negative component gradually disappearing with cortical depth. In contrast, the change in LFP amplitude (Fig. 6) and the increase in spike rate (Fig. 7) were detected across all cortical layers, with no consistent trend as a function of cortical depth. These subtle discrepancies between fMRI, LFP, and spiking are interesting and merit future investigation.
Persistent BOLD signal change post-stimulation was observed in the ipsilateral M1 during Scnn1a (within L4), Rbp4 (within L5), and Ntsr1 (within L6) stimulation and in the ipsilateral VL during Ntsr1 (within L6) stimulation (Fig. 2G). However, this was not observed in electrophysiological experiments (Fig. 3B, large initial change in LFP amplitude which quickly decays to steady-state). This suggests that the persistent post-stimulation BOLD signal may not necessarily have neural origins, and future studies may investigate the underlying mechanism of these hemodynamics.
Harris et al.59 and the Allen Institute have reported detailed anatomical connectivity with extensive cortical connections in M1 L2/3, L4, and L5 projections, and little in L6 projections. These anatomical data are partially in-line with our ofMRI results, yet discrepancies can be observed, e.g., strong monosynaptic corticocortical connections observed in tracing data were not detected by fMRI. These discrepancies are expected since optogenetic fMRI is detecting activity rather than anatomical connectivity. We also expect that optogenetic stimulation frequency18,26, and/or pattern, cell type stimulated48 to impact the resulting activation as has been observed in previous ofMRI studies18,26,48. L5 and L6 stimulations evoked activities in VL, PO and PF (SFig. 11), which is consistent with the existence of anatomical corticothalamic projections59.
L4 and L6 stimulations induced negative BOLD responses in CPu. These CPu results are supported by previous striatal studies which show that negative BOLD is associated with large increases in neuronal activities48,60–62. L5 stimulation induced a positive BOLD response in CPu, which is consistent with previous striatal studies showing that positive BOLD is associated with increases in neuronal activities4.
In this study, we injected 1.5 μl volume of virus to ensure transfection. A slow flow rate (75 nL/min) was used to avoid cortical damage, the success of which was confirmed with anatomical MRI images. The transfection included mostly the motor cortex, which is 2 mm wide (SFig. 12A). While the viral expression was largely confined to M1, the M1 specificity was further ensured through localization of the optical fiber. For example, light intensity to S1 was minimal (< 1 mW/mm2) given the large distance between S1 and the optical fiber implanted in M1 (> 750 μm). The optical fiber was implanted at different depths of M1 for different groups: + 0.15 mm, + 0.35 mm, + 0.6 mm, and + 0.8 mm dorsal-ventral for L2/3, L4, L5, and L6, respectively (same as injections, SFig. 12B). The light intensity used in this study was 30-50 mW/mm2, which is estimated to decrease to 13-25 mW/mm2 after penetrating 100 μm of tissue, 5-10 mW/mm2 after penetrating 250 μm of tissue, and < 1 mW/mm2 after penetrating 750 μm of tissue (https://web.stanford.edu/group/dlab/cgi-bin/graph/chart.php). Stimulation of the deepest M1 layer (L6) could have theoretically resulted in a low intensity of light (< 10mW/mm2) being delivered to the CPu, but the CPu had no ChR2 expression ensuring layer specific stimulations (SFig. 1).
Previous studies have demonstrated the effects of different anesthesia protocols on BOLD signal, LFP, and multi-unit activity in fMRI and electrophysiological experiments50–52. For fMRI, recent studies have recommended combining low dose isoflurane with medetomidine, which we did for this study50. To investigate how this light anesthesia might alter the effects of M1 layer stimulation, we performed a small pilot study on awake mice, where we applied 5-40 Hz optogenetic stimulations and recorded movement responses. We observed forelimb movements during Rbp4 (within L5) and Ntsr1 (within L6) stimulations. The limbs of the mice were restrained, and no head movements or discomfort were observed during fMRI experiments. In addition, no movements were observed during electrophysiological experiments. These observations suggest that light anesthesia might have subtle effects on layer-specific motor circuit functions. Future work may study layer-specific networks in both anesthetized and awake animals, to explore how anesthesia, sensory feedback, and movement responses are related to the observed activation patterns.
For each neuron-specific stimulation, the within-M1 fMRI positively modulated fraction of ROI and area under the curve both increased with cortical depth (Fig. 5). These values also all increased as the optical fiber was implanted deeper, presumably causing more surgical damage (L2/3 to L5 in Fig. 5). The echo planar imaging (EPI) fMRI images were of high quality (SFig. 13), with no artifacts in CPu and VL, and minimal artifacts in M1. Therefore, the increase in local fMRI response with cortical depth was likely not due to surgical damage in superficial layers or EPI artifacts, but rather may be due to spatial variations in neurovasculature dynamics. Previous studies showed that the highest BOLD responses are found at the cortical surface69–72. However, our study utilizes direct, synchronous optogenetic stimulation of different M1 layers, which is likely to result in distinct cortical responses.
It is important to note that the Cre-lines used in this study do not allow direct targeting of layers, but rather cell types (Drd3, Scnn1a, Rbp4, and Ntsr1) with restricted laminar distributions. Future studies may investigate other cell types for further understanding of layer-specific motor circuit functions. The mice used were on a CD-1 background rather than C57BL/6J background which are more commonly used. Future studies may explore the effects of different mouse strains on layer-specific responses. Although optogenetic experiments perturb the system in a well-controlled manner, the responses may not be necessarily the same across individuals. Our individual fMRI, LFP, and spike responses did not look exactly the same across animals (SFigs. 14–21), which is consistent with previous studies demonstrating heterogeneous responses across individuals53,54.
In this work, fMRI was performed with conventional BOLD contrast. It is also possible to acquire fMRI data with cerebral blood volume (CBV) weighting, using iron-loaded intravascular contrast agents26. CBV-weighted fMRI provides functional data which has enhanced sensitivity and specificity compared to BOLD fMRI. In an fMRI study of olfactory bulb layers in the rat, Poplawsky et al concluded that CBV fMRI matched the locations of expected neuronal activity better than BOLD fMRI56. In future studies probing motor cortex layers, it might be useful to investigate CBV fMRI responses in addition to BOLD.
In conclusion, optogenetic stimulation of cells in each layer of M1 produced a distinct activation pattern on BOLD fMRI. Neurons stimulated in L2/3 activated only ipsilateral M1, leading us to speculate that L2/3 stimulation limits activity in the deeper layers of M1 and inhibits downstream propagation to regions such as the CPu and VL. Neurons stimulated in L4-6 caused variable activation in bilateral M1, bilateral CPu, and ipsilateral VL. Neurons stimulated in L5-6 also activated ipsilateral posterior nucleus and ipsilateral perifascicular thalamic nucleus. Changing the stimulation frequency did not significantly alter spatial activation patterns, but did affect activation intensity. Electrophysiology recordings showed that optogenetic stimulation in L2/3 mainly evoked responses in ipsilateral M1, whereas stimulation in L4-6 evoked distinct responses in the ipsilateral M1, CPu, and VL, much like BOLD fMRI. LFP and spike rate changes correlated overall with BOLD-fMRI, although there were discrepancies which merit future investigation. For example, electrophysiology measurements did not show the persistent post-stimulation signals seen in BOLD fMRI.
Materials and Methods
Transgenic mice
CD-1 male mice (35 – 50 g, N = 64 total, n = 15 for each mouse line) were used for the experiments in this study. All transgenic mouse lines were obtained from the Adesnik Lab, UC Berkeley9,23–25,65. For optogenetic targeting of cells in layers L2/3, L4, L5, or L6, the mice used were heterozygous for dopamine receptor d3-Cre (drd3-Cre, MMRRC strain KL196), sodium channel non-voltage-gated 1-Cre (scnn1-Cre, JAX stock # 009613), retinol binding protein 4-Cre (Rbp4-Cre, GENSAT line # KL100), or neurotensin receptor type 1-Cre (Ntsr1-Cre, GENSAT line # GN220), respectively9,65. In these mouse lines, the Cre-mediated viral expression of opsins is exclusive to excitatory cortical neurons9. Mice were housed in cohorts of five or less with a light:dark cycle of 12:12 h with access to food and water ad libitum. All experimental procedures and animal husbandry were performed in strict accordance with the NIH and Stanford University Institutional Animal Care and Use Committee guidelines. For each transgenic mouse line, 12 were used for ofMRI, 1 for histology and immunohistochemistry, and 4 for electrophysiological recordings.
Viral Expression and Stereotaxic Surgery
A double-floxed inverted open reading frame (DIO) recombinant AAV5 virus was used to express ChR2-EYFP in Cre-expressing neurons. The recombinant AAV vector was packaged by the University of North Carolina viral vector core (titer of 4 x 10¹² particles/mL). All stereotactic surgeries were performed with mice at 8 – 10 weeks of age. Animals were anesthetized with isoflurane (induction 5%, maintenance 1.5% – 2%; Sigma-Aldrich) and secured in a stereotactic frame with nonrupturing ear bars (Kopf Instruments). A heating pad was used to maintain body temperature, and sterile ocular lubricant was applied to the eyes to prevent desiccation during surgery. Buprenorphine (1 mg/kg) was injected subcutaneously for analgesia. After a midline incision along the scalp, a small craniotomy and viral injection/cannula implantation were performed at the primary motor cortex (+ 0.75 mm AP [anterior-posterior], − 1.5 mm ML [medial-lateral], injection and fiber implantation at + 0.15 mm, + 0.35 mm, + 0.6 mm, or + 0.8 mm DV [dorsal-ventral] for L2/3, L4, L5, and L6, respectively). 1.5 μL of the AAV5/DIO-ChR2–EYFP virus was delivered using a 10 μL syringe with a 34G metal needle (World Precision Instruments Inc.) at a 75 nL/min flow rate driven by a micro-syringe pump controller. Following injection, the injection needle was held in place for 10 min before slowly retracting it from the brain. A custom-designed fiber-optic cannula was mounted and secured on the skull using light-cured dental cement (Kuraray Inc.), with the optical fiber extending from the cannula’s base to the desired depth (0.1 mm above the injection site). Following surgery, mice were kept on a heating pad until recovery from anesthesia and were given carprofen (5 mg/kg, subcutaneously [s.c.]) daily for 2 days to minimize post-operative discomfort. All experiments were conducted at least 4 weeks following virus injection to ensure optimal ChR2 expression. Probe locations were validated in all animals used for ofMRI experiments with T2-weighed structural MRI images (SFig. 12B).
Histology and immunohistochemistry to validate expression of ChR2
To confirm the precise targeting of ChR2 to L2/3, L4, L5 or L6, a cohort of mice injected with the DIO-recombinant virus was deeply anesthetized with pentobarbital and transcardially perfused with 0.1 M PBS followed by ice-cold 4% paraformaldehyde (PFA) in PBS. Brains were extracted and fixed in 4 % PFA overnight at 4 °C. The brains were equilibrated in 20 % sucrose in PBS at 4 °C overnight. Axial sections of 50 μm thickness were prepared on a freezing microtome (Micron HM550 Microtome, Thermo Scientific Inc.). For immunohistochemistry, free floating sections were washed with 0.1 M PBS for 20 mins at room temperature. Sections were then exposed to 200 ng/ml of DAPI in PBS at room temperature for 20 mins. Slices were then washed and mounted using Fluoromount-G (SouthernBiotech, Birmingham, AL). Immuno-fluorescence was assessed with a laser confocal microscope (LSM 880 inverted confocal with Airyscan, Zeiss Inc.) at the Cell Sciences Imaging Facility at Beckman Center for Molecular and Genetics Medicine. The images were then analyzed to validate the expression of ChR2. Since the primary motor cortex is 1000 μm thick, and since the AAV5 spread is roughly 500 μm, region of interest (Fig. 1A) was defined as a 500 μm x 1000 μm (width x height) rectangular box centered at the injection site. Anatomical landmarks including the midline, corpus callosum, cortex and striatum were identified and the ROI was defined based on the mouse brain atlas and injection site location to ensure consistency. The number of cells with expression of ChR2 divided by the total number of cells in the injection site was defined as sensitivity, and the number of cells with expression of ChR2 in that specific layer divided by the total number of cells with expression was defined as specificity. For sensitivity, 12%, 15%, 23% and 15% of cells identified within the injection area were ChR2-EYFP-positive for Drd3-Cre (within L2/3), Scnn1-Cre (within L4), Rbp4-Cre (within L5), or Ntsr1-Cre (within L6) mouse lines, respectively. All mouse lines have 100% specificity.
ofMRI Experiments
All MRI experiments were carried out on a 7 Tesla Bruker Biospec small animal MRI system at the SCI3 facility at Clark Center using a transmit-only birdcage coil in combination with a custom-designed actively decoupled 1-cm diameter receive-only surface coil. This MRI system was formerly a GE/Agilent MR 901 Discovery, which was then converted to the current Bruker system with Bruker gradients, RF coils, and console, and was used for the experiments reported here. Animals were initially anesthetized in an induction chamber with 5% isoflurane before placement into the restraining apparatus. The restrained animal was then placed onto the MRI-compatible cradle with ears, teeth, and head secured. To maximize signal-to-noise ratio, the receiver coil was first placed on top of the head and centered over the brain and then placed into the iso-center of the magnet. The animals were lightly anesthetized and sedated using a combination of isoflurane and dexmedetomidine (0.25% isoflurane mixed with O2 and medical air; an initial bolus of 0.1 mg/kg dexmedetomidine; continuous infusion at 0.1 mg/kg/hr during scanning). During all fMRI experiments, continuous physiological monitoring was performed using an MRI-compatible system (SA Instruments). Vital signs were within normal physiological ranges (rectal temperature: 36.5 – 37.5 °C, heart rate: 260 – 420 beat/min, breathing: 80 – 120 breath/min, oxygen saturation: > 90%) throughout the duration of the experiments.
Fourteen contiguous 1.0-mm slices were positioned in the transverse orientation according to the mouse brain atlas to cover the whole brain. T2-weighted high-resolution anatomical images were acquired prior to fMRI to check for brain damage and confirm accurate probe location. These anatomical images were acquired using a rapid acquisition with relaxation enhancement (RARE) sequence with field of view (FOV) = 20 x 20 mm2, matrix = 256 x 256, RARE factor = 8, echo time (TE) = 33 ms, repetition time (TR) = 4,000 ms. ofMRI measurements were obtained for the same slices using a single-shot Gradient-Echo Echo-Planar-Imaging (GE-EPI) sequence with FOV = 20 x 20 mm2, matrix = 75 x 75, flip angle = 40°, TE = 14 ms, TR = 1,000 ms.
The MRI scanner and laser for optogenetic stimulation were synchronized using a Master pulse stimulator system (A.M.P.I.). The light delivery system was kept outside the magnet and long optical cables (within 5 m) were used to deliver light into the scanner bore. Blue light was delivered using a 473-nm DPSS laser measured before scanning as 3 mW at the fiber tip (250 μm) corresponding to a light intensity of 60 mW/mm2 for optogenetic stimulation. To determine the frequency-dependent spatiotemporal characteristics of evoked M1 layer-specific responses, four frequencies were used (5, 10, 20, and 40 Hz with 30% duty cycle). M1 layer-specific neurons were stimulated with a standard block design paradigm that consisted of 10-s light-on and 30-s light-off periods. Three to four trials were recorded for each frequency in a pseudo-random manner in each animal.
fMRI Data Analysis
fMRI data were preprocessed with SPM12 (http://www.fil.ion.ucl.ac.uk/spm). For each animal, fMRI image timestamps were adjusted to account for slice timing differences. This was necessary because, for a given time point (i.e. a single repetition), slices were acquired one after the other, not simultaneously. Data were smoothed using a Gaussian kernel (FWHM = 2 pixels) and corrected for motion using 6-parameter rigid registration. The fMRI data were then temporally linear detrended and temporally band-pass filtered. The detrending was used to minimize baseline drift caused by system instability, and the band-pass filter (0.01-0.25 Hz) was used to reduce physiological noise. For detrending, a global linear trend was first calculated using linear regression of the temporal signal obtained from the whole brain. Then, this global linear trend was subtracted from the temporal signal of each voxel. T2-weighted images from each animal were registered to a custom-made brain template acquired with the same settings. Registration was performed by affine transformation and Gaussian smoothing to maximize normalized mutual information.
A double gamma basis set function was utilized to convolve the stimulation block, and a general linear model (GLM) was used to produce activation maps. Student’s t test was performed to identify activated voxels using the threshold p < 0.001. The mapped responses were then compared between each animal to assess the quality of the result before group level analysis. At the group level, realigned, registered images corresponding to the same fMRI session were averaged across all animals. To quantify the activation maps, ROIs were first defined based on anatomy (mouse brain atlas). The number of positively and negatively modulated voxels within the ROI were then identified. Next, the fraction of the ROI which was positively or negatively modulated was calculated. For example, the fraction of the ROI positively modulated = (positively modulated voxels within the ROI) / (total number of voxels in the ROI). BOLD temporal profiles for each stimulation frequency were also extracted from identical ROIs delineated from the mouse brain atlas by regional averaging across the whole ROI. The area under the curve (AUC) of each BOLD profile was then obtained by summing the real values of the profile over all time points. This AUC value was calculated to represent the net activity change in that brain area67,68. AUC values were then averaged across animals within the same group.
In Vivo Electrophysiology
In vivo electrophysiology was performed to directly measure the neuronal activity of the ipsilateral M1, CPu and VL. Similar to ofMRI experiments, the animals were lightly anesthetized and sedated using a combination of isoflurane and dexmedetomidine (0.25% isoflurane mixed with O2 and medical air; an initial bolus of 0.1 mg/kg dexmedetomidine; continuous infusion at 0.1 mg/kg/hr during experiment). Throughout the procedure, body temperature was maintained at 37 °C using a thermoresistive heating pad (FHC, Inc., ME, USA). After securing the animal within a stereotactic frame, an optrode composed of an optical fiber glued to the 16-channel linear-array electrode (NeuroNexus Technologies, MI, USA; A1x16-5mm-150-703-A16 electrode array) was inserted at the stimulation site (+ 0.75 mm AP [anterior-posterior], − 1.5 mm ML [medial-lateral], covering between +0.00 mm and +2.40 mm DV [dorsal-ventral]) and a 16-channel microelectrode array (NeuroNexus Technologies, MI, USA; A1x16-5mm-50-703-A16 electrode array) was inserted at the ipsilateral VL (−1.35 mm AP, +1.00 mm ML, covering between +3.30 mm and +3.70 mm DV). The inter-channel distance for this electrode is 150 μm. A microdrive was used to lower the electrode into the brain, with depth determined primarily by brain atlas reference. Fine adjustments to the depth were guided by real-time monitoring of spontaneous LFP and spiking. As the electrode was lowered, the signal changing from clipped noise to silence indicated we were entering the cortex. When the electrode passed through each cortical layer of cell bodies, significantly more spiking was observed. When targeting M1 layers, we performed minor depth adjustments to obtain the most spiking. For L4, although it is only 100 μm thick, it is densely packed with cell bodies and spiking could be detected. While positioning the electrode, no spiking was observed at the white matter tract, which also provided an indication of electrode depth. To target the correct depth for deeper structures (e.g. VL), the real-time monitoring of spontaneous LFP and spiking was used to locate the ventral edge of the cortex and/or the white matter tract, which served as landmarks from which atlas reference distances were measured.
Identical optogenetic stimulation paradigms were applied. Recordings were acquired at 40 kHz sampling rate using the Plexon OmniPlex system with PlexControl software (Plexon Inc., TX, USA). The Plexon multichannel acquisition processor was used to amplify and low-pass filter (cutoff frequency: 200 Hz) the acquired signal for local field potential (LFP) recordings or high-pass filter (cutoff frequency: 300 Hz) for spike recordings.
Electrophysiology Data Analysis
For LFP recordings, raw data were initially imported into Matlab software and a notch filter centered at 60 Hz was applied to remove power-line noise. Individual animal LFPs were averaged across stimulation blocks to generate a single LFP trace for each stimulation frequency, which was then averaged across animals. Spikes were automatically identified and sorted online using the Plexon OmniPlex System. Subsequent LFP and spike analyses were performed in MATLAB (version R2020a). For spike recordings, two-tailed paired t-tests (ttest.m) were used to identify significant changes in firing rate within each unit between pre-stimulation and stimulation periods (10 seconds each). Only units with significant (p < 0.05) change (either increase or decrease) were included in the following analysis. Peri-event time histograms were averaged across stimulation blocks and units to generate an average peri-event time histogram for each stimulation frequency. One-way ANOVA (anova1.m) followed by Bonferroni’s post hoc test (multcompare.m) was applied to compare pre-stimulation, stimulation, and post stimulation periods.
BOLD-fMRI and LFP responses reflect the overall signal within a region, and all recorded units should be considered when exploring the association between spiking, BOLD-fMRI and LFP. Nevertheless, we still examined different spiking parameters, namely percentage of positively modulated neurons, percentage of negatively modulated neurons, percentage of modulated neurons, average percentage spike rate change of positively modulated neurons, average percentage spike rate change of negatively modulated neurons, average percentage spike rate change of all modulated neurons, average absolute value of percentage spike rate change of all modulated neurons, average percentage spike rate change of all neurons, average absolute value of percentage spike rate change of all neurons, total percentage spike rate change of positively modulated neurons, total percentage spike rate change of negatively modulated neurons, total percentage spike rate change of all modulated neuron, total absolute value of percentage spike rate change of all modulated neurons, total percentage spike rate change of all neurons, and total absolute value of percentage spike rate change of all neurons. The last quantity (total absolute value of percentage spike rate change of all neurons) is shown against BOLD-fMRI in Fig. 4D.
The data points in the scatter plots were mean values of ROIs in different mouse lines, since we did not apply ofMRI and electrophysiology in the same mouse. As such, we had a sample size of 12 (Figs. 3 and 4) or 16 (Figs. 6 and 7). Each data point was equally weighted in the linear regression analyses. For bar charts, one-way ANOVA (anova1.m) followed by Bonferroni’s post hoc test (multcompare.m) was used.
Supplementary Material
Acknowledgments
This work was supported by NIH/NIHM R01MH111444, NIH/NIMH RF1 MH114227, NIH S10 OD025176, NIH/NINDS DP1 NS116783, NIH/NIA R01 AG064051, and NIH/NIBIB R01 EB030884.
Footnotes
Competing Interest Statement: HJL is an employee and shareholder of LVIS. JHL is a founder, shareholder, and consultant for LVIS.
References
- 1.Ebbesen CL & Brecht M Motor cortex - to act or not to act?. Nature reviews. Neuroscience 18, 694–705, doi: 10.1038/nrn.2017.119 (2017). [DOI] [PubMed] [Google Scholar]
- 2.Weiler N, Wood L, Yu J, Solla SA & Shepherd GM Top-down laminar organization of the excitatory network in motor cortex. Nature neuroscience 11, 360–366, doi: 10.1038/nn2049 (2008). [DOI] [PMC free article] [PubMed] [Google Scholar]
- 3.Gerfen CR, Economo MN & Chandrashekar J Long distance projections of cortical pyramidal neurons. Journal of neuroscience research 96, 1467–1475, doi: 10.1002/jnr.23978 (2018). [DOI] [PMC free article] [PubMed] [Google Scholar]
- 4.Anderson CT, Sheets PL, Kiritani T & Shepherd GM Sublayer-specific microcircuits of corticospinal and corticostriatal neurons in motor cortex. Nature neuroscience 13, 739–744, doi: 10.1038/nn.2538 (2010). [DOI] [PMC free article] [PubMed] [Google Scholar]
- 5.Yamawaki N, Borges K, Suter BA, Harris KD & Shepherd GM A genuine layer 4 in motor cortex with prototypical synaptic circuit connectivity. eLife 3, e05422, doi: 10.7554/eLife.05422 (2014). [DOI] [PMC free article] [PubMed] [Google Scholar]
- 6.Daigle TL et al. A Suite of Transgenic Driver and Reporter Mouse Lines with Enhanced Brain-Cell-Type Targeting and Functionality. Cell 174, 465–480 e422, doi: 10.1016/j.cell.2018.06.035 (2018). [DOI] [PMC free article] [PubMed] [Google Scholar]
- 7.Boyden ES, Zhang F, Bamberg E, Nagel G & Deisseroth K Millisecond-timescale, genetically targeted optical control of neural activity. Nature neuroscience 8, 1263–1268, doi: 10.1038/nn1525 (2005). [DOI] [PubMed] [Google Scholar]
- 8.Pluta SR, Telian GI, Naka A & Adesnik H Superficial layers suppress the deep layers to fine tune cortical coding. The Journal of neuroscience : the official journal of the Society for Neuroscience, doi: 10.1523/JNEUROSCI.1459-18.2018 (2019). [DOI] [PMC free article] [PubMed] [Google Scholar]
- 9.Pluta S et al. A direct translaminar inhibitory circuit tunes cortical output. Nature neuroscience 18, 1631–1640, doi: 10.1038/nn.4123 (2015). [DOI] [PMC free article] [PubMed] [Google Scholar]
- 10.Bortone DS, Olsen SR & Scanziani M Translaminar inhibitory cells recruited by layer 6 corticothalamic neurons suppress visual cortex. Neuron 82, 474–485, doi: 10.1016/j.neuron.2014.02.021 (2014). [DOI] [PMC free article] [PubMed] [Google Scholar]
- 11.Kim J, Matney CJ, Blankenship A, Hestrin S & Brown SP Layer 6 corticothalamic neurons activate a cortical output layer, layer 5a. The Journal of neuroscience : the official journal of the Society for Neuroscience 34, 9656–9664, doi: 10.1523/JNEUROSCI.1325-14.2014 (2014). [DOI] [PMC free article] [PubMed] [Google Scholar]
- 12.Xiong XR et al. Auditory cortex controls sound-driven innate defense behaviour through corticofugal projections to inferior colliculus. Nature communications 6, 7224, doi: 10.1038/ncomms8224 (2015). [DOI] [PMC free article] [PubMed] [Google Scholar]
- 13.Liang F et al. Sensory Cortical Control of a Visually Induced Arrest Behavior via Corticotectal Projections. Neuron 86, 755–767, doi: 10.1016/j.neuron.2015.03.048 (2015). [DOI] [PMC free article] [PubMed] [Google Scholar]
- 14.Huber L et al. High-Resolution CBV-fMRI Allows Mapping of Laminar Activity and Connectivity of Cortical Input and Output in Human M1. Neuron 96, 1253-1263 e1257, doi: 10.1016/j.neuron.2017.11.005 (2017). [DOI] [PMC free article] [PubMed] [Google Scholar]
- 15.Lawrence SJD, Formisano E, Muckli L & de Lange FP Laminar fMRI: Applications for cognitive neuroscience. NeuroImage 197, 785–791, doi: 10.1016/j.neuroimage.2017.07.004 (2019). [DOI] [PubMed] [Google Scholar]
- 16.Stephan KE et al. Laminar fMRI and computational theories of brain function. NeuroImage 197, 699–706, doi: 10.1016/j.neuroimage.2017.11.001 (2019). [DOI] [PubMed] [Google Scholar]
- 17.Lee JH et al. Global and local fMRI signals driven by neurons defined optogenetically by type and wiring. Nature 465, 788–792, doi: 10.1038/nature09108 (2010). [DOI] [PMC free article] [PubMed] [Google Scholar]
- 18.Liu J et al. Frequency-selective control of cortical and subcortical networks by central thalamus. Elife 4, e09215, doi: 10.7554/eLife.09215 (2015). [DOI] [PMC free article] [PubMed] [Google Scholar]
- 19.Lee JH, Kreitzer AC, Singer AC & Schiff ND Illuminating Neural Circuits: From Molecules to MRI. The Journal of neuroscience : the official journal of the Society for Neuroscience 37, 10817–10825, doi: 10.1523/JNEUROSCI.2569-17.2017 (2017). [DOI] [PMC free article] [PubMed] [Google Scholar]
- 20.Duffy BA, Choy M, Chuapoco MR, Madsen M & Lee JH MRI compatible optrodes for simultaneous LFP and optogenetic fMRI investigation of seizure-like afterdischarges. NeuroImage 123, 173–184, doi: 10.1016/j.neuroimage.2015.07.038 (2015). [DOI] [PMC free article] [PubMed] [Google Scholar]
- 21.Weitz AJ et al. Optogenetic fMRI reveals distinct, frequency-dependent networks recruited by dorsal and intermediate hippocampus stimulations. Neuroimage 107, 229–241, doi: 10.1016/j.neuroimage.2014.10.039 (2015). [DOI] [PMC free article] [PubMed] [Google Scholar]
- 22.Chan RW et al. Low-frequency hippocampal-cortical activity drives brain-wide resting-state functional MRI connectivity. Proc Natl Acad Sci U S A 114, E6972–E6981, doi: 10.1073/pnas.1703309114 (2017). [DOI] [PMC free article] [PubMed] [Google Scholar]
- 23.Gong S et al. Targeting Cre recombinase to specific neuron populations with bacterial artificial chromosome constructs. The Journal of neuroscience : the official journal of the Society for Neuroscience 27, 9817–9823, doi: 10.1523/JNEUROSCI.2707-07.2007 (2007). [DOI] [PMC free article] [PubMed] [Google Scholar]
- 24.Madisen L et al. A robust and high-throughput Cre reporting and characterization system for the whole mouse brain. Nature neuroscience 13, 133–140, doi: 10.1038/nn.2467 (2010). [DOI] [PMC free article] [PubMed] [Google Scholar]
- 25.Adesnik H & Scanziani M Lateral competition for cortical space by layer-specific horizontal circuits. Nature 464, 1155–1160, doi: 10.1038/nature08935 (2010). [DOI] [PMC free article] [PubMed] [Google Scholar]
- 26.Weitz AJ, Lee HJ, Choy M & Lee JH Thalamic Input to Orbitofrontal Cortex Drives Brain-wide, Frequency-Dependent Inhibition Mediated by GABA and Zona Incerta. Neuron 104, 1153-1167 e1154, doi: 10.1016/j.neuron.2019.09.023 (2019). [DOI] [PMC free article] [PubMed] [Google Scholar]
- 27.Christie IN et al. fMRI response to blue light delivery in the naive brain: implications for combined optogenetic fMRI studies. NeuroImage 66, 634–641, doi: 10.1016/j.neuroimage.2012.10.074 (2013). [DOI] [PubMed] [Google Scholar]
- 28.Schmid F et al. True and apparent optogenetic BOLD fMRI signals. Magnetic resonance in medicine 77, 126–136, doi: 10.1002/mrm.26095 (2017). [DOI] [PubMed] [Google Scholar]
- 29.Kozai TD & Vazquez AL Photoelectric artefact from optogenetics and imaging on microelectrodes and bioelectronics: New Challenges and Opportunities. Journal of materials chemistry. B 3, 4965–4978, doi: 10.1039/C5TB00108K (2015). [DOI] [PMC free article] [PubMed] [Google Scholar]
- 30.Mikulovic S et al. On the photovoltaic effect in local field potential recordings. Neurophotonics 3, 015002, doi: 10.1117/1.NPh.3.1.015002 (2016). [DOI] [PMC free article] [PubMed] [Google Scholar]
- 31.Brodmann K Brodmann’s Localisation in the Cerebral Cortex Translated from German by Laurence J Garey. Imperial College Press; (1909). [Google Scholar]
- 32.Bastos AM et al. Canonical microcircuits for predictive coding. Neuron 76, 695–711, doi: 10.1016/j.neuron.2012.10.038 (2012). [DOI] [PMC free article] [PubMed] [Google Scholar]
- 33.Krieg WJ Connections of the cerebral cortex; the albino rat; structure of the cortical areas. The Journal of comparative neurology 84, 277–323, doi: 10.1002/cne.900840302 (1946). [DOI] [PubMed] [Google Scholar]
- 34.Garcia-Cabezas MA & Barbas H Area 4 has layer IV in adult primates. The European journal of neuroscience 39, 1824–1834, doi: 10.1111/ejn.12585 (2014). [DOI] [PMC free article] [PubMed] [Google Scholar]
- 35.Strick PL & Sterling P Synaptic termination of afferents from the ventrolateral nucleus of the thalamus in the cat motor cortex. A light and electron microscopy study. The Journal of comparative neurology 153, 77–106, doi: 10.1002/cne.901530107 (1974). [DOI] [PubMed] [Google Scholar]
- 36.Kuramoto E et al. Two types of thalamocortical projections from the motor thalamic nuclei of the rat: a single neuron-tracing study using viral vectors. Cerebral cortex 19, 2065–2077, doi: 10.1093/cercor/bhn231 (2009). [DOI] [PubMed] [Google Scholar]
- 37.Bopp R, Holler-Rickauer S, Martin KA & Schuhknecht GF An Ultrastructural Study of the Thalamic Input to Layer 4 of Primary Motor and Primary Somatosensory Cortex in the Mouse. The Journal of neuroscience : the official journal of the Society for Neuroscience 37, 2435–2448, doi: 10.1523/JNEUROSCI.2557-16.2017 (2017). [DOI] [PMC free article] [PubMed] [Google Scholar]
- 38.Carroll D et al. Motor cortex stimulation for chronic neuropathic pain: a preliminary study of 10 cases. Pain 84, 431–437, doi: 10.1016/s0304-3959(99)00245-6 (2000). [DOI] [PubMed] [Google Scholar]
- 39.Rasche D, Ruppolt M, Stippich C, Unterberg A & Tronnier VM Motor cortex stimulation for long-term relief of chronic neuropathic pain: a 10 year experience. Pain 121, 43–52, doi: 10.1016/j.pain.2005.12.006 (2006). [DOI] [PubMed] [Google Scholar]
- 40.Lefaucheur JP, Drouot X, Menard-Lefaucheur I, Keravel Y & Nguyen JP Motor cortex rTMS restores defective intracortical inhibition in chronic neuropathic pain. Neurology 67, 1568–1574, doi: 10.1212/01.wnl.0000242731.10074.3c (2006). [DOI] [PubMed] [Google Scholar]
- 41.Nouri S & Cramer SC Anatomy and physiology predict response to motor cortex stimulation after stroke. Neurology 77, 1076–1083, doi: 10.1212/WNL.0b013e31822e1482 (2011). [DOI] [PMC free article] [PubMed] [Google Scholar]
- 42.Schlaug G, Renga V & Nair D Transcranial direct current stimulation in stroke recovery. Archives of neurology 65, 1571–1576, doi: 10.1001/archneur.65.12.1571 (2008). [DOI] [PMC free article] [PubMed] [Google Scholar]
- 43.Brown JA, Lutsep HL, Weinand M & Cramer SC Motor cortex stimulation for the enhancement of recovery from stroke: a prospective, multicenter safety study. Neurosurgery 58, 464–473, doi: 10.1227/01.NEU.0000197100.63931.04 (2006). [DOI] [PubMed] [Google Scholar]
- 44.Leong AT et al. Long-range projections coordinate distributed brain-wide neural activity with a specific spatiotemporal profile. Proc Natl Acad Sci U S A 113, E8306–E8315, doi: 10.1073/pnas.1616361113 (2016). [DOI] [PMC free article] [PubMed] [Google Scholar]
- 45.Logothetis NK What we can do and what we cannot do with fMRI. Nature 453, 869–878, doi: 10.1038/nature06976 (2008). [DOI] [PubMed] [Google Scholar]
- 46.Uhlirova H et al. Cell type specificity of neurovascular coupling in cerebral cortex. eLife 5, doi: 10.7554/eLife.14315 (2016). [DOI] [PMC free article] [PubMed] [Google Scholar]
- 47.Berens P, Logothetis N & Tolias A Local field potentials, BOLD and spiking activity – relationships and physiological mechanisms. Nature Precedings, doi: 10.1038/npre.2010.5216.1 (2010). [DOI] [Google Scholar]
- 48.Lee HJ et al. Activation of Direct and Indirect Pathway Medium Spiny Neurons Drives Distinct Brain-wide Responses. Neuron 91, 412–424, doi: 10.1016/j.neuron.2016.06.010 (2016). [DOI] [PMC free article] [PubMed] [Google Scholar]
- 49.Goense JB & Logothetis NK Laminar specificity in monkey V1 using high-resolution SE-fMRI. Magnetic resonance imaging 24, 381–392, doi: 10.1016/j.mri.2005.12.032 (2006). [DOI] [PubMed] [Google Scholar]
- 50.Grandjean J, Schroeter A, Batata I & Rudin M Optimization of anesthesia protocol for resting-state fMRI in mice based on differential effects of anesthetics on functional connectivity patterns. Neuroimage 102 Pt 2, 838–847, doi: 10.1016/j.neuroimage.2014.08.043 (2014). [DOI] [PubMed] [Google Scholar]
- 51.Aksenov DP, Li L, Miller MJ, Iordanescu G & Wyrwicz AM Effects of anesthesia on BOLD signal and neuronal activity in the somatosensory cortex. J Cereb Blood Flow Metab 35, 1819–1826, doi: 10.1038/jcbfm.2015.130 (2015). [DOI] [PMC free article] [PubMed] [Google Scholar]
- 52.Zhao F, Zhao T, Zhou L, Wu Q & Hu X BOLD study of stimulation-induced neural activity and resting-state connectivity in medetomidine-sedated rat. Neuroimage 39, 248–260, doi: 10.1016/j.neuroimage.2007.07.063 (2008). [DOI] [PMC free article] [PubMed] [Google Scholar]
- 53.Mueller S et al. Individual variability in functional connectivity architecture of the human brain. Neuron 77, 586–595, doi: 10.1016/j.neuron.2012.12.028 (2013). [DOI] [PMC free article] [PubMed] [Google Scholar]
- 54.Fox MD, Snyder AZ, Vincent JL & Raichle ME Intrinsic fluctuations within cortical systems account for intertrial variability in human behavior. Neuron 56, 171–184, doi: 10.1016/j.neuron.2007.08.023 (2007). [DOI] [PubMed] [Google Scholar]
- 55.Vhadat S, Pendharkar AV, Chiang T, Harvey S, Uchino H, Cao Z, Kim A, Choy M, Chen H, Lee HJ, Cheng MY, Lee JH, Steinberg G Brain-wide neural dynamics of post-stroke recovery induced by optogenetic stimulation. Science Advances 7, doi: 10.1126/sciadv.abd9465 (2021). [DOI] [PMC free article] [PubMed] [Google Scholar]
- 56.Poplawsky AJ, Fukuda M, Murphy M, Kim SG Layer-specific fMRI responses to excitatory and inhibitory neuronal activities in the olfactory bulb. Journal of Neuroscience 35, 15263–15275, doi: 10.1523/JNEUROSCI.1015-15.2015 (2015). [DOI] [PMC free article] [PubMed] [Google Scholar]
- 57.McColgan P, Joubert J, Tabrizi SJ, et al. The human motor cortex microcircuit: insights for neurodegenerative disease. Nat Rev Neurosci 21, 401–415. 10.1038/s41583-020-0315-1 (2020). [DOI] [PubMed] [Google Scholar]
- 58.Barbas H, Garcia-Cabezas MA Motor cortex layer 4: less is more. Trends in Neurosciences 38, 259–261. 10.1016/j.tins.2015.03.005 (2015). [DOI] [PMC free article] [PubMed] [Google Scholar]
- 59.Harris JA, Mihalas S, Hirokawa KE, Whitesell JD, Choi H, Bernard A, Bohn P, Caldejon S, Casal L, Cho A, Feiner A Hierarchical organization of the cortical and thalamic connectivity. Nature 575, 195–202. 10.1038/s41586-019-1716-z (2019). [DOI] [PMC free article] [PubMed] [Google Scholar]
- 60.Mishra Asht Mangal, Ellens Damien J., Schridde Ulrich, Motelow Joshua E., Purcaro Michael J., DeSalvo Matthew N., Enev Miro, Sanganahalli Basavaraju G., Hyder Fahmeed, and Blumenfeld Hal. Where fMRI and electrophysiology agree to disagree: corticothalamic and striatal activity patterns in the WAG/Rij rat. Journal of Neuroscience 31, 15053–15064 10.1523/JNEUROSCI.0101-11.2011 (2011). [DOI] [PMC free article] [PubMed] [Google Scholar]
- 61.Schridde Ulrich, Khubchandani Manjula, Motelow Joshua E., Sanganahalli Basavaraju G., Hyder Fahmeed, and Blumenfeld Hal. Negative BOLD with large increases in neuronal activity. Cerebral cortex 18, 1814–1827 10.1093/cercor/bhm208 (2008). [DOI] [PMC free article] [PubMed] [Google Scholar]
- 62.Shih Yen-Yu I., Chen Chiao-Chi V., Shyu Bai-Chuang, Lin Zi-Jun, Chiang Yun-Chen, Jaw Fu-Shan, Chen You-Yin, and Chang Chen. A new scenario for negative functional magnetic resonance imaging signals: endogenous neurotransmission. Journal of Neuroscience 29, 3036–3044 10.1523/JNEUROSCI.3447-08.2009 (2009). [DOI] [PMC free article] [PubMed] [Google Scholar]
- 63.Vazquez Alberto L., Fukuda Mitsuhiro, Crowley Justin C., and Kim Seong-Gi. Neural and hemodynamic responses elicited by forelimb-and photo-stimulation in channelrhodopsin-2 mice: insights into the hemodynamic point spread function. Cerebral cortex 24, 2908–2919 10.1093/cercor/bht147 (2014). [DOI] [PMC free article] [PubMed] [Google Scholar]
- 64.Iordanova Bistra, Vazquez Alberto L., Poplawsky Alexander J., Fukuda Mitsuhiro, and Kim Seong-Gi. Neural and hemodynamic responses to optogenetic and sensory stimulation in the rat somatosensory cortex. Journal of Cerebral Blood Flow & Metabolism 35, 922–932 10.1038/jcbfm.2015.10 (2015). [DOI] [PMC free article] [PubMed] [Google Scholar]
- 65.Adesnik Hillel. “Layer‐specific excitation/inhibition balances during neuronal synchronization in the visual cortex.” The Journal of physiology 596, 1639–1657 10.1113/JP274986 (2018). [DOI] [PMC free article] [PubMed] [Google Scholar]
- 66.Katzner Steffen, Nauhaus Ian, Benucci Andrea, Bonin Vincent, Ringach Dario L., and Carandini Matteo. Local origin of field potentials in visual cortex. Neuron 61, 35–41. 10.1016/j.neuron.2008.11.016 (2009). [DOI] [PMC free article] [PubMed] [Google Scholar]
- 67.Abe Yoshifumi, Tsurugizawa Tomokazu, Bihan Denis Le, and Ciobanu Luisa. Spatial contribution of hippocampal BOLD activation in high-resolution fMRI. Scientific reports 9, 1–9. 10.1038/s41598-019-39614-3 (2019). [DOI] [PMC free article] [PubMed] [Google Scholar]
- 68.Borst Jelmer P., Taatgen Niels A., Stocco Andrea, and Van Rijn Hedderik. The neural correlates of problem states: Testing fMRI predictions of a computational model of multitasking. PloS one 5, e12966. 10.1371/journal.pone.0012966 (2010). [DOI] [PMC free article] [PubMed] [Google Scholar]
- 69.Havlicek Martin, and Uludağ Kâmil. A dynamical model of the laminar BOLD response. NeuroImage 204 116209. 10.1016/j.neuroimage.2019.116209 (2020). [DOI] [PubMed] [Google Scholar]
- 70.Jin Tao, and Kim Seong-Gi. Cortical layer-dependent dynamic blood oxygenation, cerebral blood flow and cerebral blood volume responses during visual stimulation. Neuroimage 43, 1–9. 10.1016/j.neuroimage.2008.06.029 (2008) [DOI] [PMC free article] [PubMed] [Google Scholar]
- 71.Silva Afonso C., and Koretsky Alan P.. Laminar specificity of functional MRI onset times during somatosensory stimulation in rat. Proceedings of the National Academy of Sciences 99, 15182–15187. 10.1073/pnas.222561899 (2002). [DOI] [PMC free article] [PubMed] [Google Scholar]
- 72.Tian Peifang, Teng Ivan C., May Larry D., Kurz Ronald, Lu Kun, Scadeng Miriam, Hillman Elizabeth MC et al. Cortical depth-specific microvascular dilation underlies laminar differences in blood oxygenation level-dependent functional MRI signal. Proceedings of the National Academy of Sciences 107, 15246–15251. 10.1073/pnas.1006735107 (2010). [DOI] [PMC free article] [PubMed] [Google Scholar]
Associated Data
This section collects any data citations, data availability statements, or supplementary materials included in this article.