Abstract
Gene regulatory networks ensure that important genes are expressed at precise levels. When gene expression is sufficiently perturbed, it can lead to disease. To understand how gene expression disruptions percolate through a network, we must first map connections between regulatory genes and their downstream targets. However, we lack comprehensive knowledge of the upstream regulators of most genes. Here, we developed an approach for systematic discovery of upstream regulators of critical immune factors—IL2RA, IL-2 and CTLA4—in primary human T cells. Then, we mapped the network of the target genes of these regulators and putative cis-regulatory elements using CRISPR perturbations, RNA-seq and ATAC-seq. These regulators form densely interconnected networks with extensive feedback loops. Furthermore, this network is enriched for immune-associated disease variants and genes. These results provide insight into how immune-associated disease genes are regulated in T cells and broader principles about the structure of human gene regulatory networks.
Human genetic studies can reveal the genes that cause disease and identify new therapeutic targets. Genome-wide association studies (GWAS) have identified thousands of disease-associated genetic variants1; however, determining their functional consequences has been difficult. Initial efforts have focused on mapping the cis-regulatory effects of these variants2. However, in many cases, identifying the genes that are altered in cis does not elucidate the disease etiology. Many cis-regulated genes are likely not directly involved in a disease-relevant process, but instead trans-regulate other genes that are directly involved3–5. Therefore, mapping trans-regulatory connections is crucial to identifying the most salient disease genes.
Only a few studies have successfully untangled the trans-regulatory impact of disease-associated variants6–8. In these studies, identifying the trans-regulated genes of a given single nucleotide polymorphism (SNP) enabled understanding of how each variant affects disease risk. These examples support the utility of mapping trans-regulatory connections, but measuring trans-regulation is proving harder than measuring cis-regulation, and is a largely unsolved problem.
Mapping trans-regulation using trans-eQTLs (expression quantitative trait loci) is difficult as trans-eQTLs generally have small effects and therefore require large sample sizes to detect5,9. An alternative approach is to perturb a gene experimentally and measure the effects on expression of other genes. These regulatory relationships are likely cell-type-specific so must be mapped in disease-relevant cells10. To perform mechanistic studies in cells relevant for immune-mediated diseases, we have pioneered the use of CRISPR in primary human T cells using Cas9 ribonucleo-proteins (RNPs) and SLICE (sgRNA lentiviral infection with Cas9 electroporation)11,12. Here, we focus on CD4+ T cells as autoimmune disease-associated SNPs are highly enriched in active chromatin in these cells13–16.
Methods such as Perturb-seq use CRISPR to knock out a selected set of genes and measure changes in gene expression17–20. We previously used these methods to perturb genes of interest and identify their downstream targets in human T cells12,21. We refer to this approach as ‘downstream mapping’, as it identifies genes that are downstream of the knocked-out genes in a transcriptional network. However, such methods require a priori knowledge of the regulatory genes to select for disruption. In contrast, ‘upstream mapping’ would enable us to start with genes of interest and unbiasedly discover the upstream regulators that control their expression. Upstream mapping could be used to identify the regulators of known disease genes and infer how disease-associated genetic variants that cis-regulate the upstream genes likely also trans-regulate the downstream disease genes.
Here, we identified the upstream regulators of three key immune gene products: IL2RA (also known as CD25), IL-2 and CTLA4. IL-2 is an important cytokine that binds to the high affinity IL-2 receptor IL2RA to promote T cell proliferation and survival22,23. CTLA4 limits T cell activation by inhibiting CD28-costimulation from CD80/CD86 on antigen-presenting cells24. We mapped the regulatory network around these genes as their proper expression is critical for immune homeostasis and their disruption is associated with numerous complex and Mendelian immune diseases25–33.
After identifying upstream regulators, we performed downstream mapping by individually knocking out 24 of the regulators and measuring genome-wide changes in chromatin accessibility and gene expression. Combining upstream and downstream mapping enabled us to generate a comprehensive map of trans-regulatory connections in primary human cells (Fig. 1a). Furthermore, these data provided insights into the regulatory architecture of human gene networks, revealing a highly interconnected network that contains extensive feedback loops, and is enriched for immune disease variants and genes. Our results provide a roadmap for identifying networks of disease-associated genes by starting with several important seed genes and then prioritizing variants that disrupt components of these networks.
Fig. 1 |. Approach to map disease gene networks in human T cells.
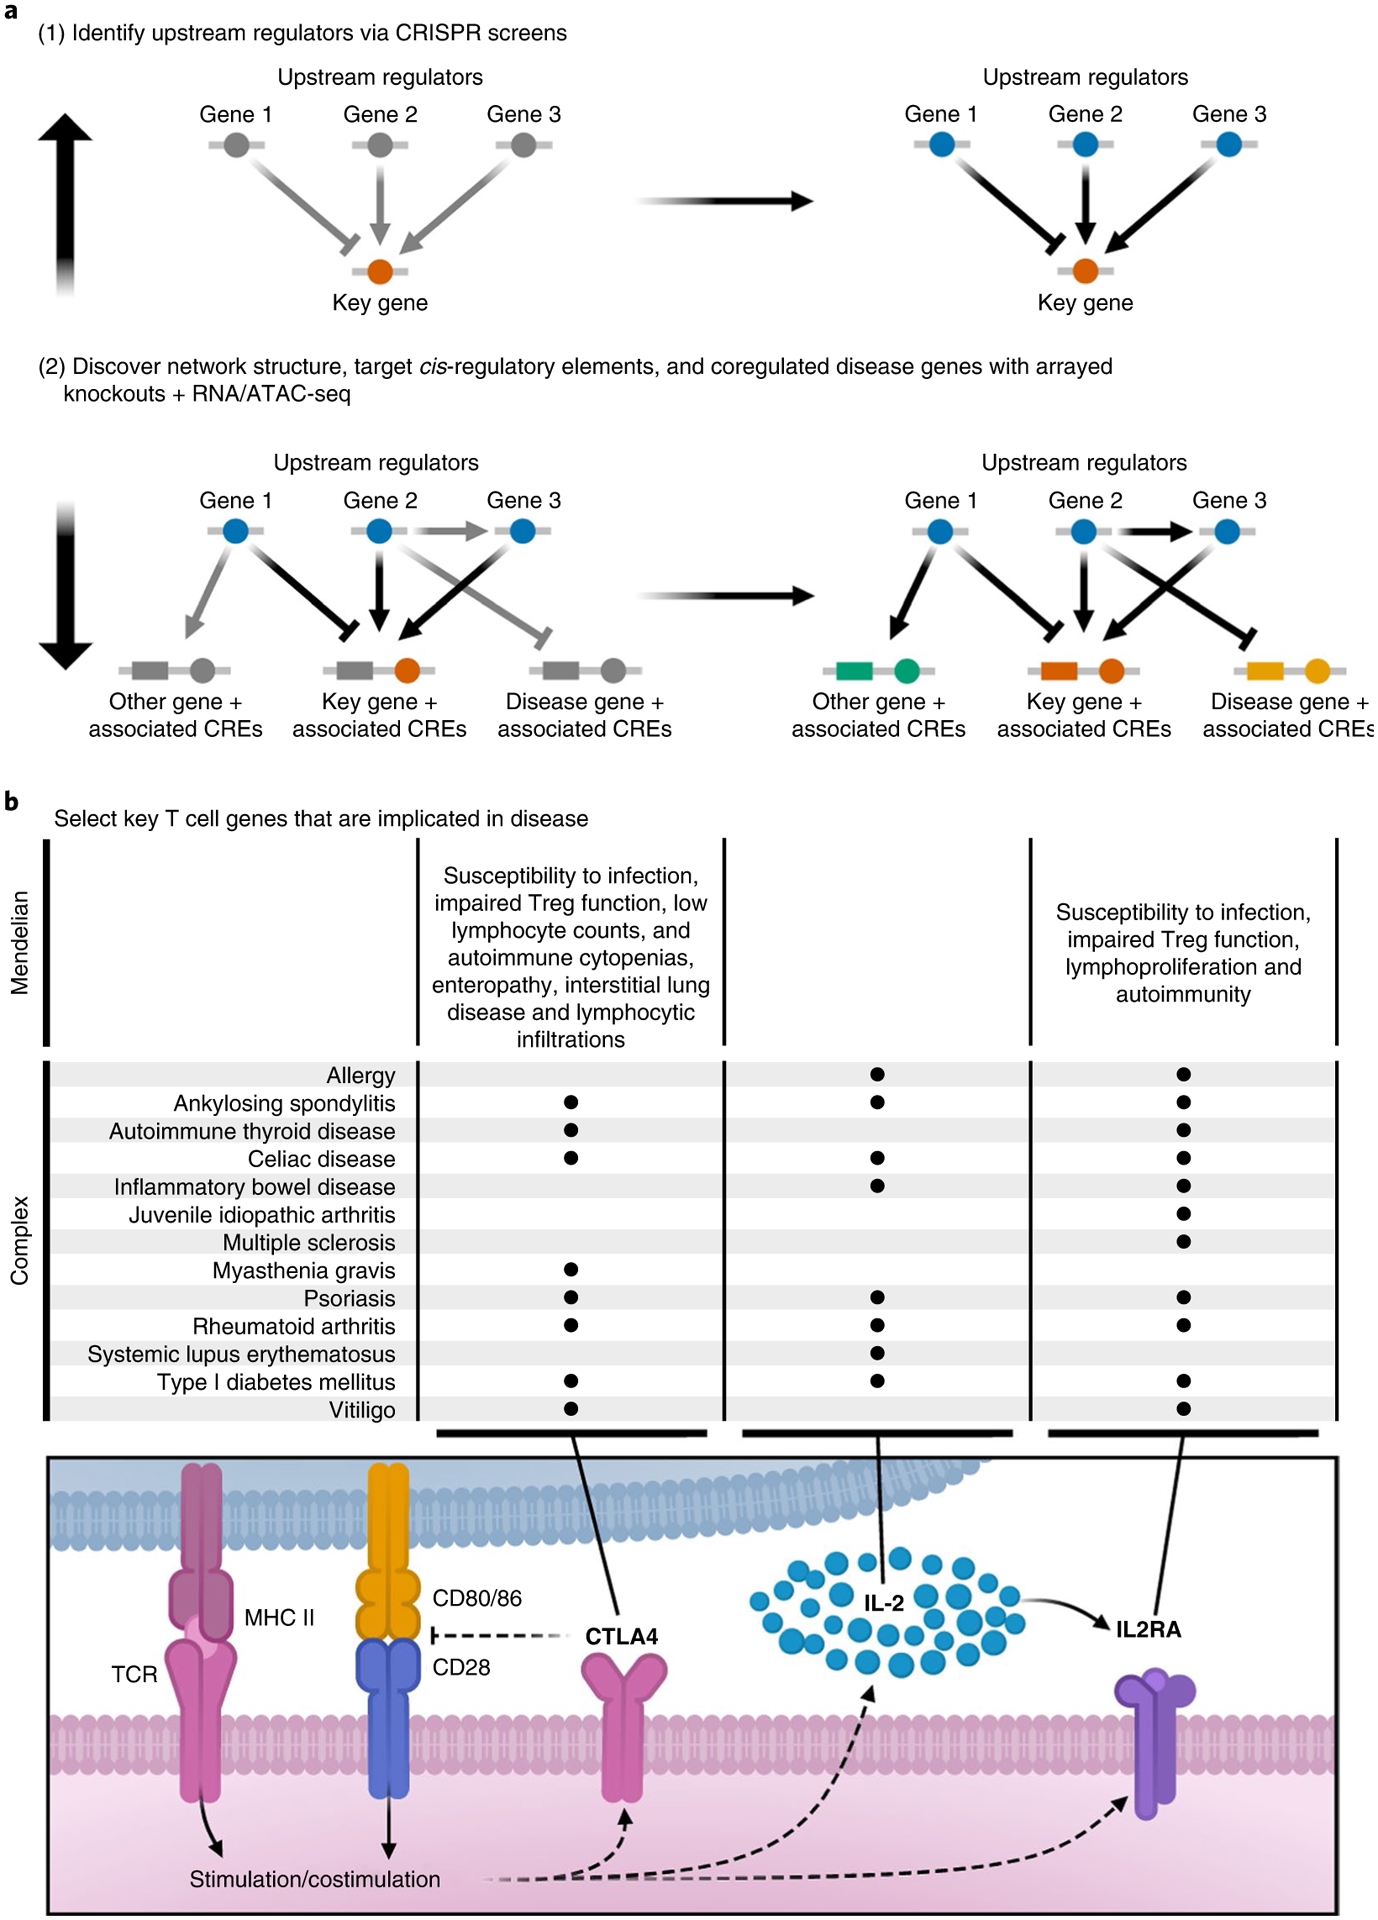
a, In step 1, we use pooled CRISPR loss-of-function screening coupled with FACS to identify the upstream regulators of key immune gene products. In step 2, we individually knocked out regulators identified in step 1 and measured downstream changes in chromatin accessibility and gene expression using ATAC-seq and RNA-seq to identify the network structure, putative cis-regulatory element (CRE) targets and coregulated disease genes. b, Schematic depicting the role of CTLA4, IL-2 and IL2RA in CD4+ T cells and a noncomprehensive list of common autoimmune diseases associated with dysregulation of these genes. Treg, regulatory T-cell.
Results
Discovery of upstream regulators of IL2RA, IL-2 and CTLA4.
As an initial step to understand the complete wiring of human T cells, we first sought to measure a fraction of the global network centered around three important immune gene products—IL2RA, IL-2 and CTLA4—that play critical roles in T cells and are implicated in multiple autoimmune diseases (Fig. 1b). We hypothesized that, by building out the network around these genes, we could identify central components of the immune regulatory network.
We combined SLICE, to knock out thousands of genes in a pool of primary human T cells, with fluorescence-activated cell sorting (FACS) to discover which factors are upstream regulators of these three gene products (Fig. 2a). Since we were interested in identifying trans-regulatory genes, we built a 6,000 single guide RNA (sgRNA) library targeting 1,198 transcription factors plus additional candidate genes and controls (Supplementary Table 1)34,35. We isolated CD4+ CD25− T cells from healthy human blood donors, stimulated the cells, infected them with lentivirus containing the sgRNAs and a green fluorescent protein (GFP) reporter, and then electroporated Cas9 RNPs to generate a pool of knockout (KO) T cells (see Methods for optimized SLICE protocol). We stained for IL2RA, IL-2 and CTLA4 and used FACS to sort the cells based on the top and bottom 15% of expression of these three proteins (Fig. 2a and Extended Data Fig. 1a). We sequenced the sorted cells to determine which sgRNAs were differentially enriched and thus identified genes that regulate the levels of IL2RA, IL-2 and CTLA4.
Fig. 2 |. Discovery of upstream regulators of IL2RA, IL-2 and CTLA4.
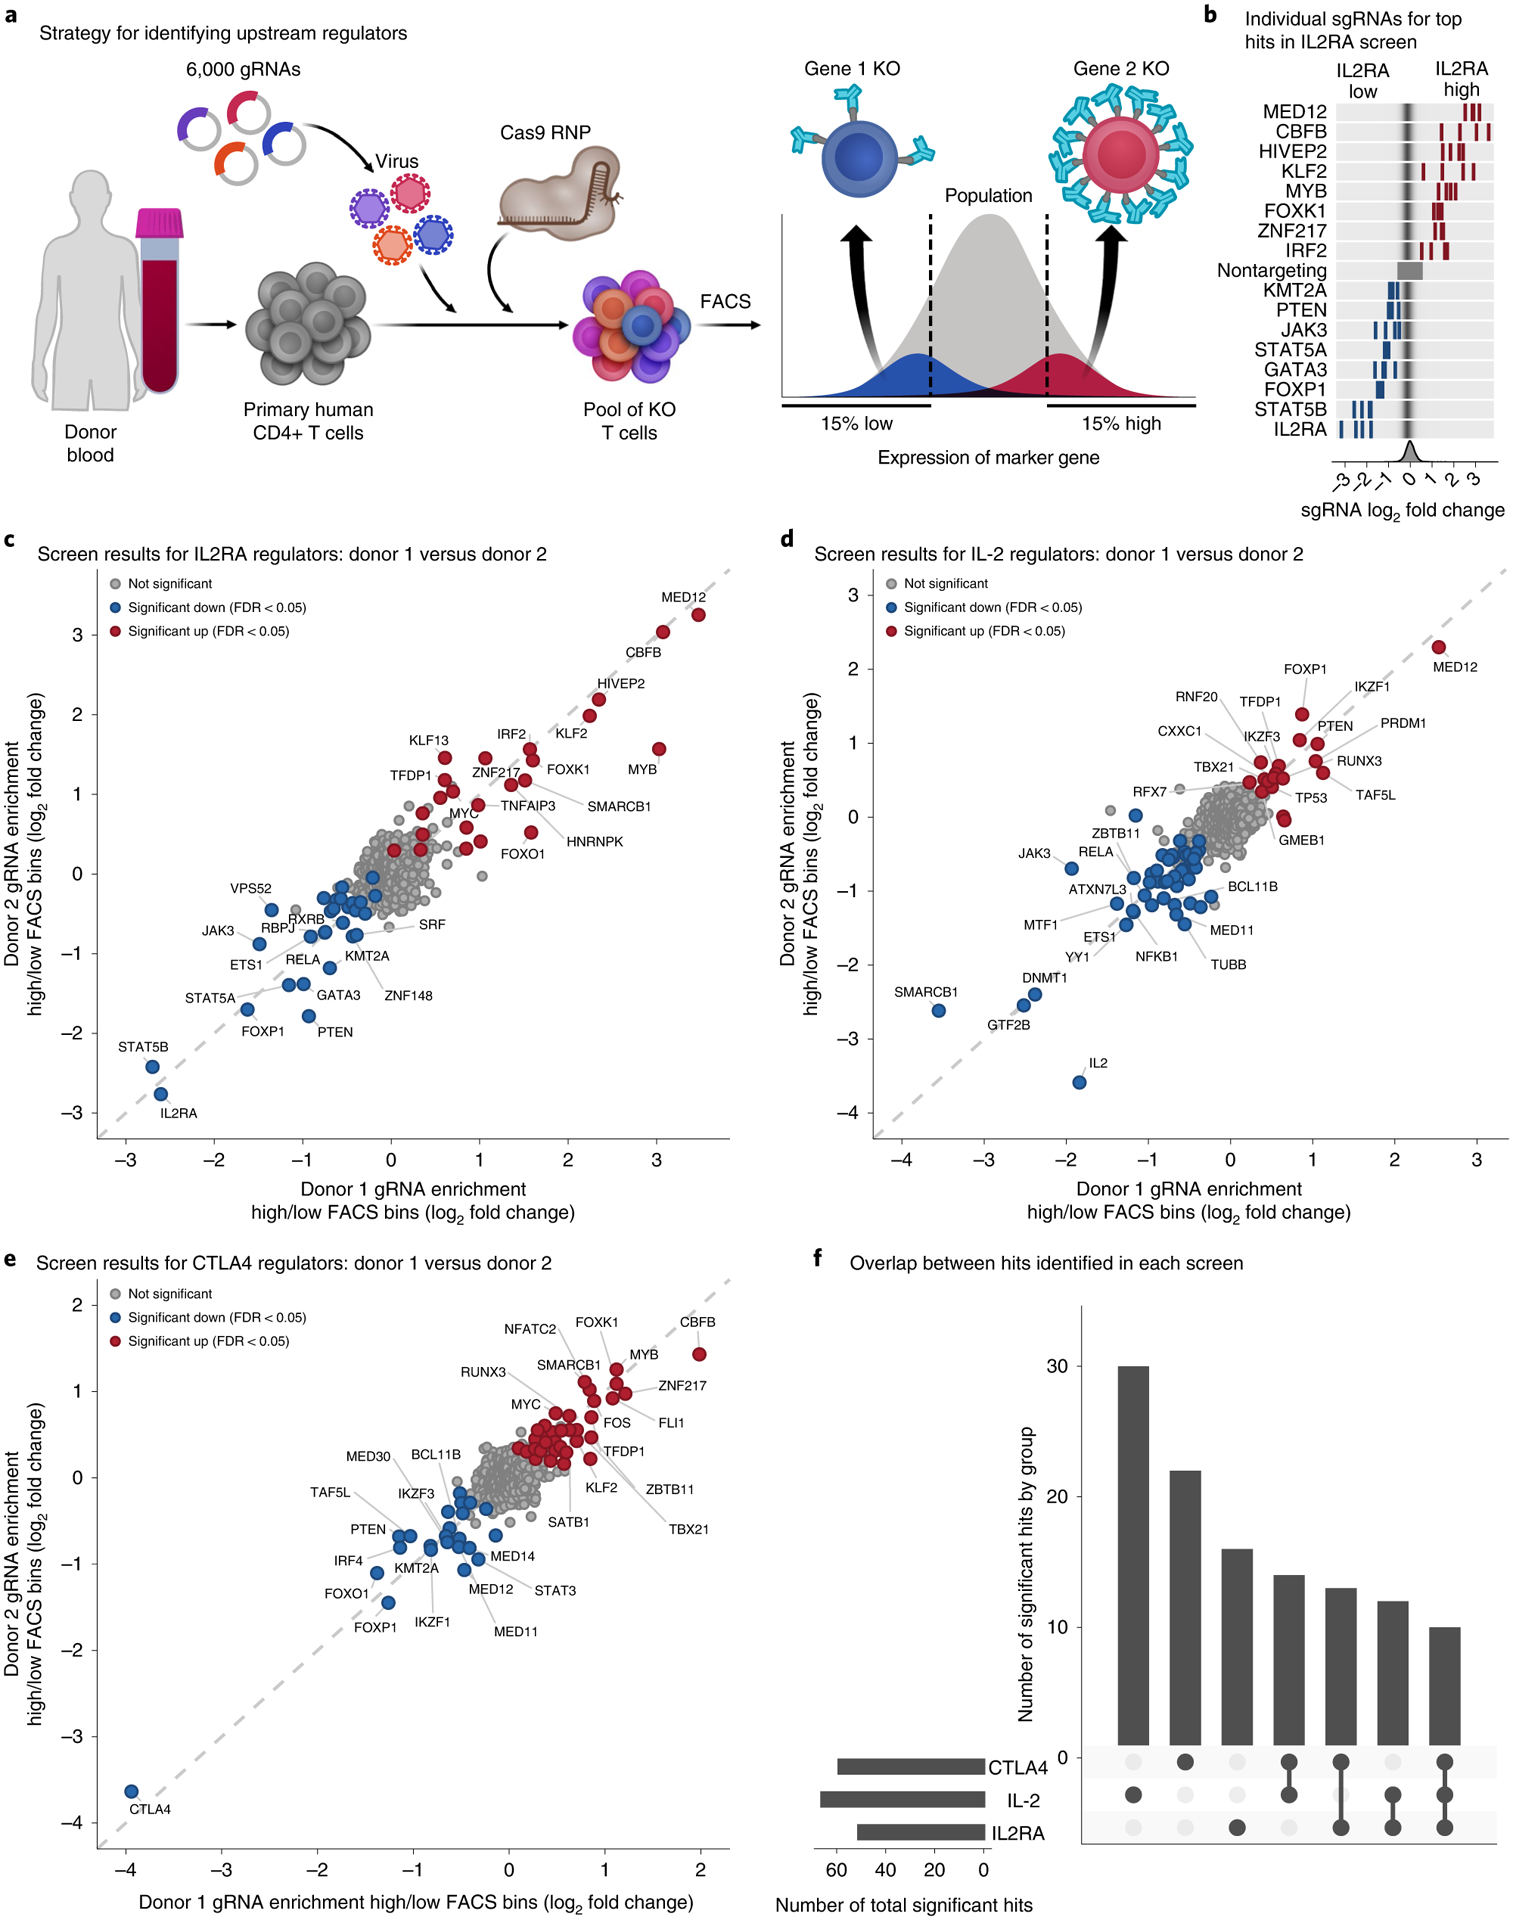
a, Strategy for identifying upstream regulators. We used SLICE to generate a pool of knocked out (KO) primary human CD4+ T cells. Knockout T cells were sorted into 15% high- or low-expression bins with FACS based on the expression of IL2RA, IL-2 or CTLA4. The sgRNAs in each bin were sequenced to identify positive or negative regulators of IL2RA, IL-2 or CTLA4 levels. b, Top, enrichment of individual sgRNAs in the high- or low-expression bins for the top hits in the IL2RA screen. Bottom, distribution of enrichment for all sgRNAs. c–e, Enrichment of sgRNAs in the high- or low-expression bins for the IL2RA (n = 3), IL-2 (n = 2) and CTLA4 (n = 2) screens. Individual sgRNAs against the same gene were collapsed to the gene level. Significant hits were identified with MAGeCK, and genes with an FDR-adjusted P < 0.05 across all donors are highlighted. f, Number of significant hits shared between the three screens. See also Extended Data Fig. 1.
We first validated SLICE editing efficiency (Supplementary Note). Next, we analyzed the results from the IL2RA, IL-2 and CTLA4 screens, which identified 51, 66 and 59 significant hits, respectively (Fig. 2c–e and Supplementary Tables 2 and 3). Significant hits were highly reproducible between biological donors, and distinct sgRNAs targeting the top genes had concordant effects (Fig. 2b). As expected, positive control sgRNAs targeting IL2RA, IL-2 or CTLA4 were highly enriched in the low FACS bin in their respective screens. We successfully detected JAK3, STAT5A and STAT5B as hits, which are known positive regulators of IL2RA (Fig. 2c)23,36,37. We also identified a number of new hits. For example, MED12 has not been implicated in IL-2 signaling, but we identified it as a regulator of both IL2RA and IL-2 (Fig. 2c,d). Together, these results provide a comprehensive picture of how IL2RA, IL-2 and CTLA4 levels are regulated in human T cells.
Many of the hits were shared among the screens, suggesting that IL2RA, IL-2 and CTLA4 are highly coregulated. Of the 117 gene hits identified among the screens, 39 were significant in two of the screens, and 10 were significant in all three (Fig. 2f). We analyzed whether the genes identified in multiple screens had concordant effects on IL2RA, IL-2 and CTLA4 levels. IL2RA promotes the fitness and proliferation of T cells, while CTLA4 inhibits T cell activation22,24. Most genes that regulate both IL2RA and CTLA4 regulate them in the same direction, suggesting that this network may help balance the consequences of T cell activation (Extended Data Fig. 1f). However, several perturbations push IL2RA and CTLA4 in opposite directions and may dictate whether the overarching immune response is activating or inhibitory. These genes could represent interesting clinical targets to either strongly activate or limit T cell stimulation.
Arrayed knockouts validate and characterize screen results.
To validate and further characterize how the screen hits regulate IL2RA, IL-2 or CTLA4, we performed arrayed knockouts coupled with flow cytometry (Fig. 3a,b) (Supplementary Note). The arrayed knockout results were highly concordant with the pooled screen results, confirming the biological reproducibility of our findings and demonstrating the power of the pooled screening approach (Fig. 3c and Extended Data Fig. 2a–d). We were particularly interested in the genes that coregulate IL2RA, IL-2 and CTLA4, as these genes might control important immune networks. The arrayed knockout data confirmed that many regulators coregulate IL2RA, IL-2 and CTLA4 (Fig. 3d). This validated dataset provides a comprehensive functional map of regulatory connections between key immune genes and their upstream regulators in human T cells.
Fig. 3 |. Arrayed knockouts validate and characterize screen results.
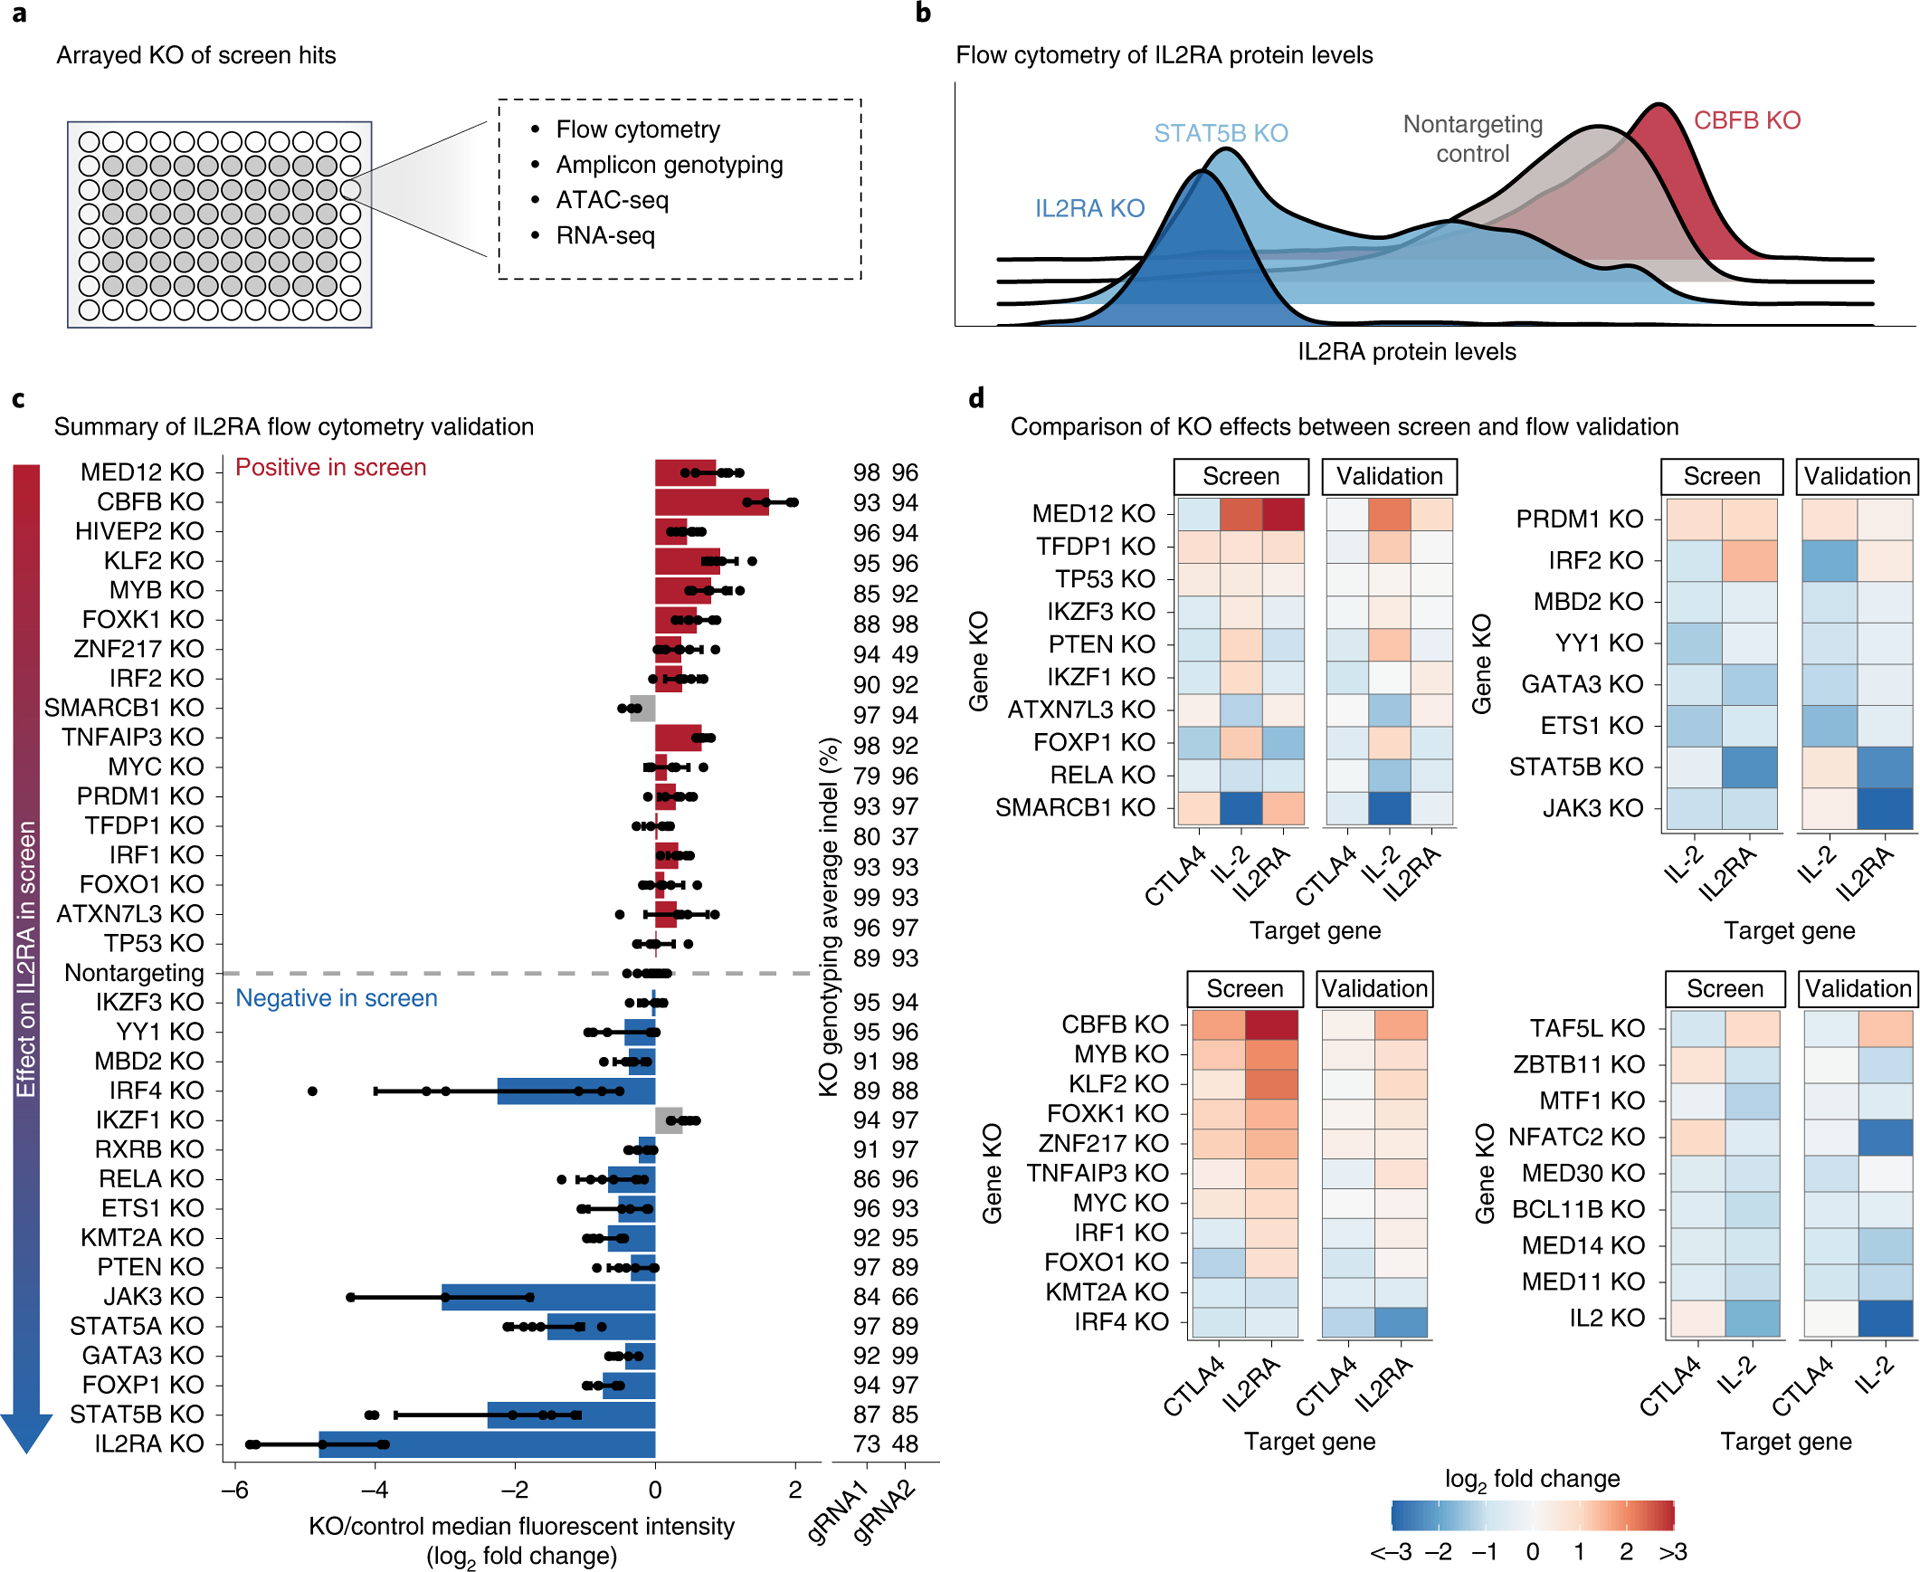
a, Arrayed knockout of screen hits using Cas9 RNPs, followed by in-depth phenotyping. b, Representative flow cytometry plots for IL2RA protein levels after knockout of top screen hits. Knockouts that decrease or increase IL2RA levels are shown in blue or red, respectively. c, Summary of changes in IL2RA levels measured using flow cytometry. Screen hits selected for validation are displayed on the y axis ordered by their effect size in the pooled CRISPR screen. For each knockout, bars show the average change in IL2RA median fluorescence intensity relative to nontargeting controls. Dots show individual data points, and error bars show s.d. across two gRNAs and three donors per gRNA. Concordant changes between the screen and validation that increase or decrease IL2RA levels are shown in red or blue, respectively. Discordant changes are shown in gray. The average insertion/deletion (indel) percentage at the genomic target site across multiple donors for gRNA 1 (n = 3) and gRNA 2 (n = 2) is shown to the right. d, Heatmaps summarizing the validation for IL2RA, IL-2 and CTLA4 screens focused on regulators that affect multiple targets. Heatmaps are grouped on the basis of which of the three target genes a hit regulates. See also Extended Data Fig. 2.
Mapping downstream target genes and CREs of IL2RA regulators.
In the second phase of the experiments, we switched to downstream mapping to identify other targets downstream of the regulators identified in the screens (Fig. 1a). Since many of the screen hits coregulate IL2RA, IL-2 and CTLA4, we thought that these regulators might control a broader, interconnected immune network. We focused on 24 regulators of IL2RA that had the largest effects on IL2RA levels in the validation dataset, including IL2RA itself. For controls, we used guide RNAs (gRNAs) targeting the safe harbor locus AAVS1. To identify downstream target genes and putative cis-regulatory elements (CREs) for each regulator, we performed arrayed RNP knockouts in T cells from three human donors followed by bulk RNA-seq and ATAC-seq (Fig. 3a, Supplementary Table 4 and Supplementary Data 1 and 2). This approach enabled us to measure thousands of additional gene expression and chromatin changes compared with alternative single-cell sequencing methods.
We confirmed that the regulatory effects of knockouts can be ascertained from the sequencing data (Supplementary Note). The number of chromatin regions and genes affected by each knockout varied greatly. For example, FOXK1 knockout affected only 548 ATAC-Seq peaks, while CBFB knockout affected 34,379 peaks (FDR-adjusted P < 0.05; Extended Data Fig. 3e). In the RNA-seq data, HIVEP2 knockout affected the expression of only 19 genes, while MED12 knockout affected the expression of 4,641 genes (FDR-adjusted P < 0.05; Extended Data Fig. 3d). While the number of significant changes in gene expression and chromatin accessibility were roughly correlated, there were interesting exceptions: YY1 knockout results in many gene expression changes, but comparatively few chromatin accessibility changes. These data indicate that the knockout effects on chromatin and the transcriptome vary widely across regulators.
Individual regulators act at distinct IL2RA CREs.
We next analyzed how knocking out each IL2RA regulator affected chromatin accessibility at the IL2RA locus and IL2RA expression. As expected, knocking out negative regulators of IL2RA tended to increase both IL2RA expression and chromatin accessibility (Fig. 4a). Conversely, knocking out positive regulators of IL2RA tended to decrease IL2RA expression and chromatin accessibility (Fig. 4a). We observed that knockouts had distinct effects on accessibility at different noncoding elements in the locus (Fig. 4b). CBFB and TNFAIP3 knockouts increased chromatin accessibility and IL2RA expression but affected different putative CREs. CBFB knockout broadly increased accessibility around an element in the first intron of IL2RA that was unaffected by TNFAIP3 knockout. TNFAIP3 knockout increased accessibility at a 3′ element that was largely unchanged in the CBFB knockout. Similarly, IRF4 and STAT5B knockouts decreased chromatin accessibility and IL2RA expression but affected distinct putative CREs (Fig. 4b). These examples reveal how regulators act on distinct putative CREs to control the precise levels of IL2RA. Many of these regulators bind directly to the IL2RA locus (Extended Data Fig. 4). Furthermore, many of these altered CREs overlap regions identified by a CRISPRa screen in Jurkat cells38, demonstrating that these regions are functionally capable of driving IL2RA expression (Extended Data Fig. 4). Broadly, these data demonstrate how genetic perturbations can be coupled with ATAC-seq and RNA-seq to understand how transcriptional pathways influence specific putative CREs and target gene expression.
Fig. 4 |. Individual regulators act at distinct IL2RA CREs.
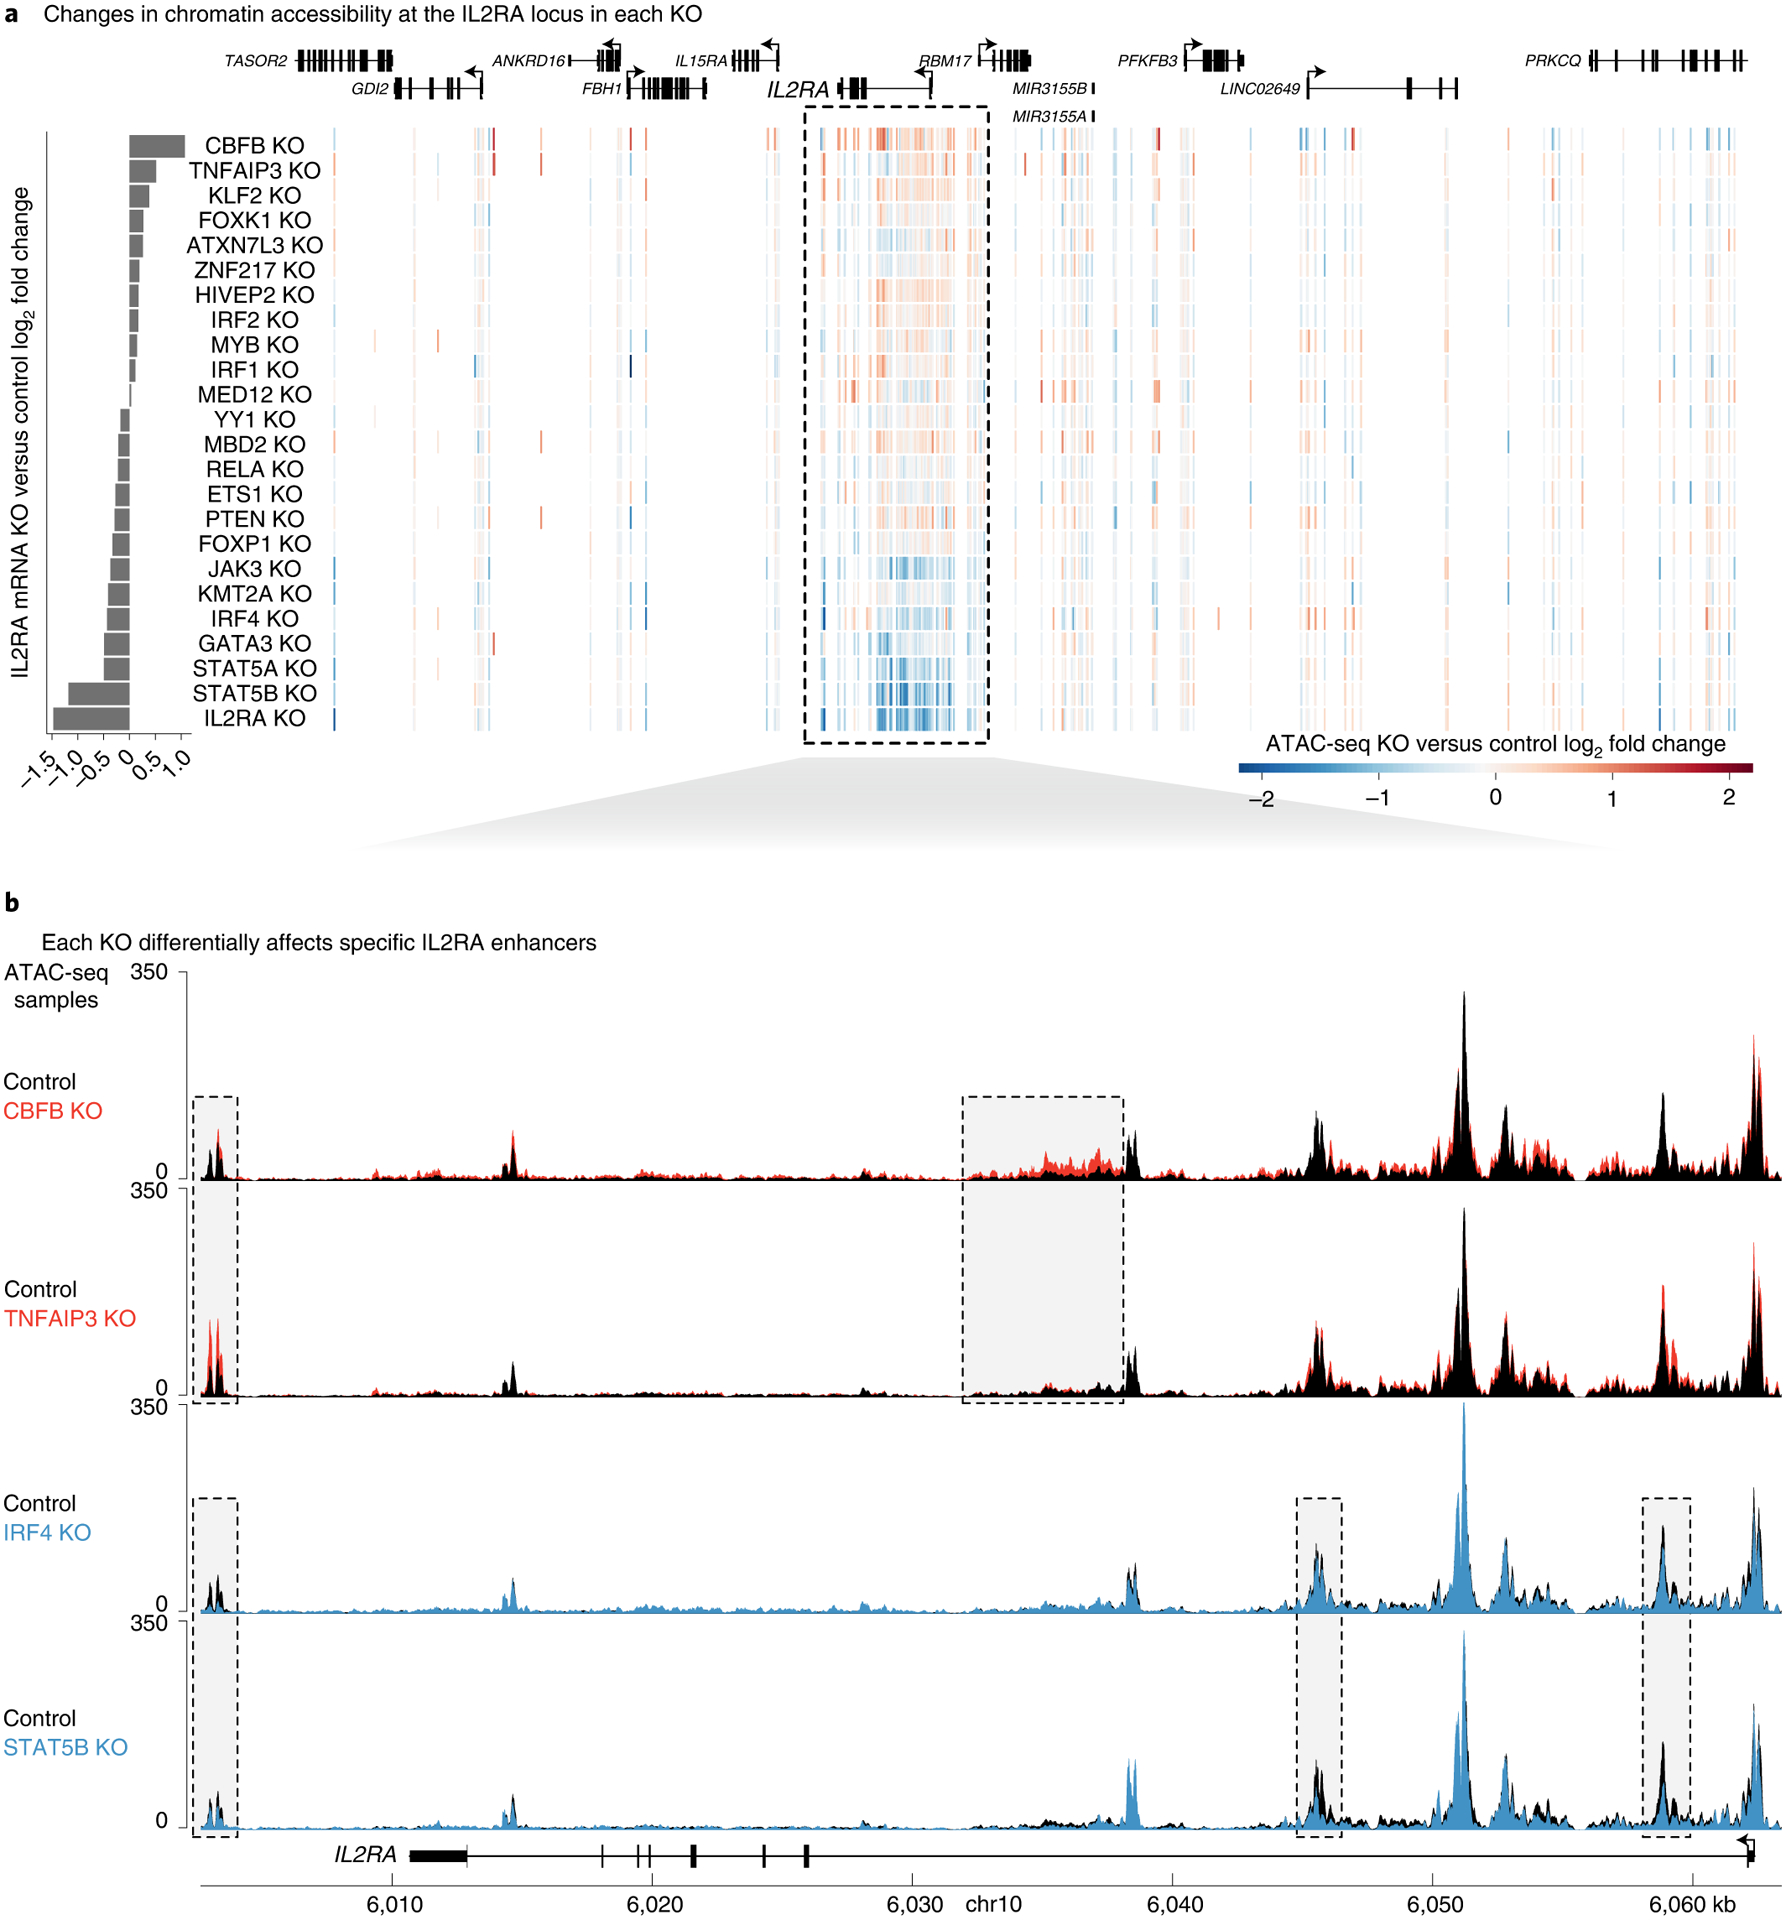
a, Heatmap of changes in chromatin accessibility around the IL2RA locus. Each row is a different knockout, and each vertical line is an ATAC-seq peak. Peaks with increased or decreased accessibility are shown in red or blue, respectively. Changes in IL2RA expression are shown at the left. b, Changes in chromatin accessibility at specific putative CREs throughout the IL2RA locus in CBFB, TNFAIP3, IRF4 and STAT5B knockouts. ATAC-seq data are shown as normalized read coverage; samples were normalized using the size factors from DESeq2. Examples of putative CRE dynamics that differ between the knockouts are boxed. n = 3 donors for RNA-seq and ATAC-seq. chr, chromosome. See also Extended Data Figs. 3 and 4.
IL2RA regulators form highly interconnected gene networks.
Large perturbation studies have revealed the architecture of gene networks in bacteria and yeast39–41. However, as it has been difficult to perturb primary human cells efficiently, efforts to construct human gene networks have relied largely on observational coexpression data42–46. However, such data cannot reliably determine the directions of effects in gene networks. To overcome this limitation, we generated a large dataset to understand how perturbations affect chromatin regulation and gene expression in primary human cells.
We wondered whether the IL2RA regulators act independently or as part of an interconnected network. We first analyzed how each knockout affects the expression of the other IL2RA regulators. The loss of each regulator significantly altered the expression of between 1 and 18 (median 9.5) out of 24 other IL2RA regulators (including IL2RA itself) (Fig. 5a and Supplementary Table 5). These changes are probably not all due to direct regulation but highlight the complexity of human gene networks in which perturbing one regulator leads to a cascade of both direct and indirect effects on other regulators that cumulatively contribute to altered phenotypes.
Fig. 5 |. IL2RA regulators form highly interconnected gene networks.
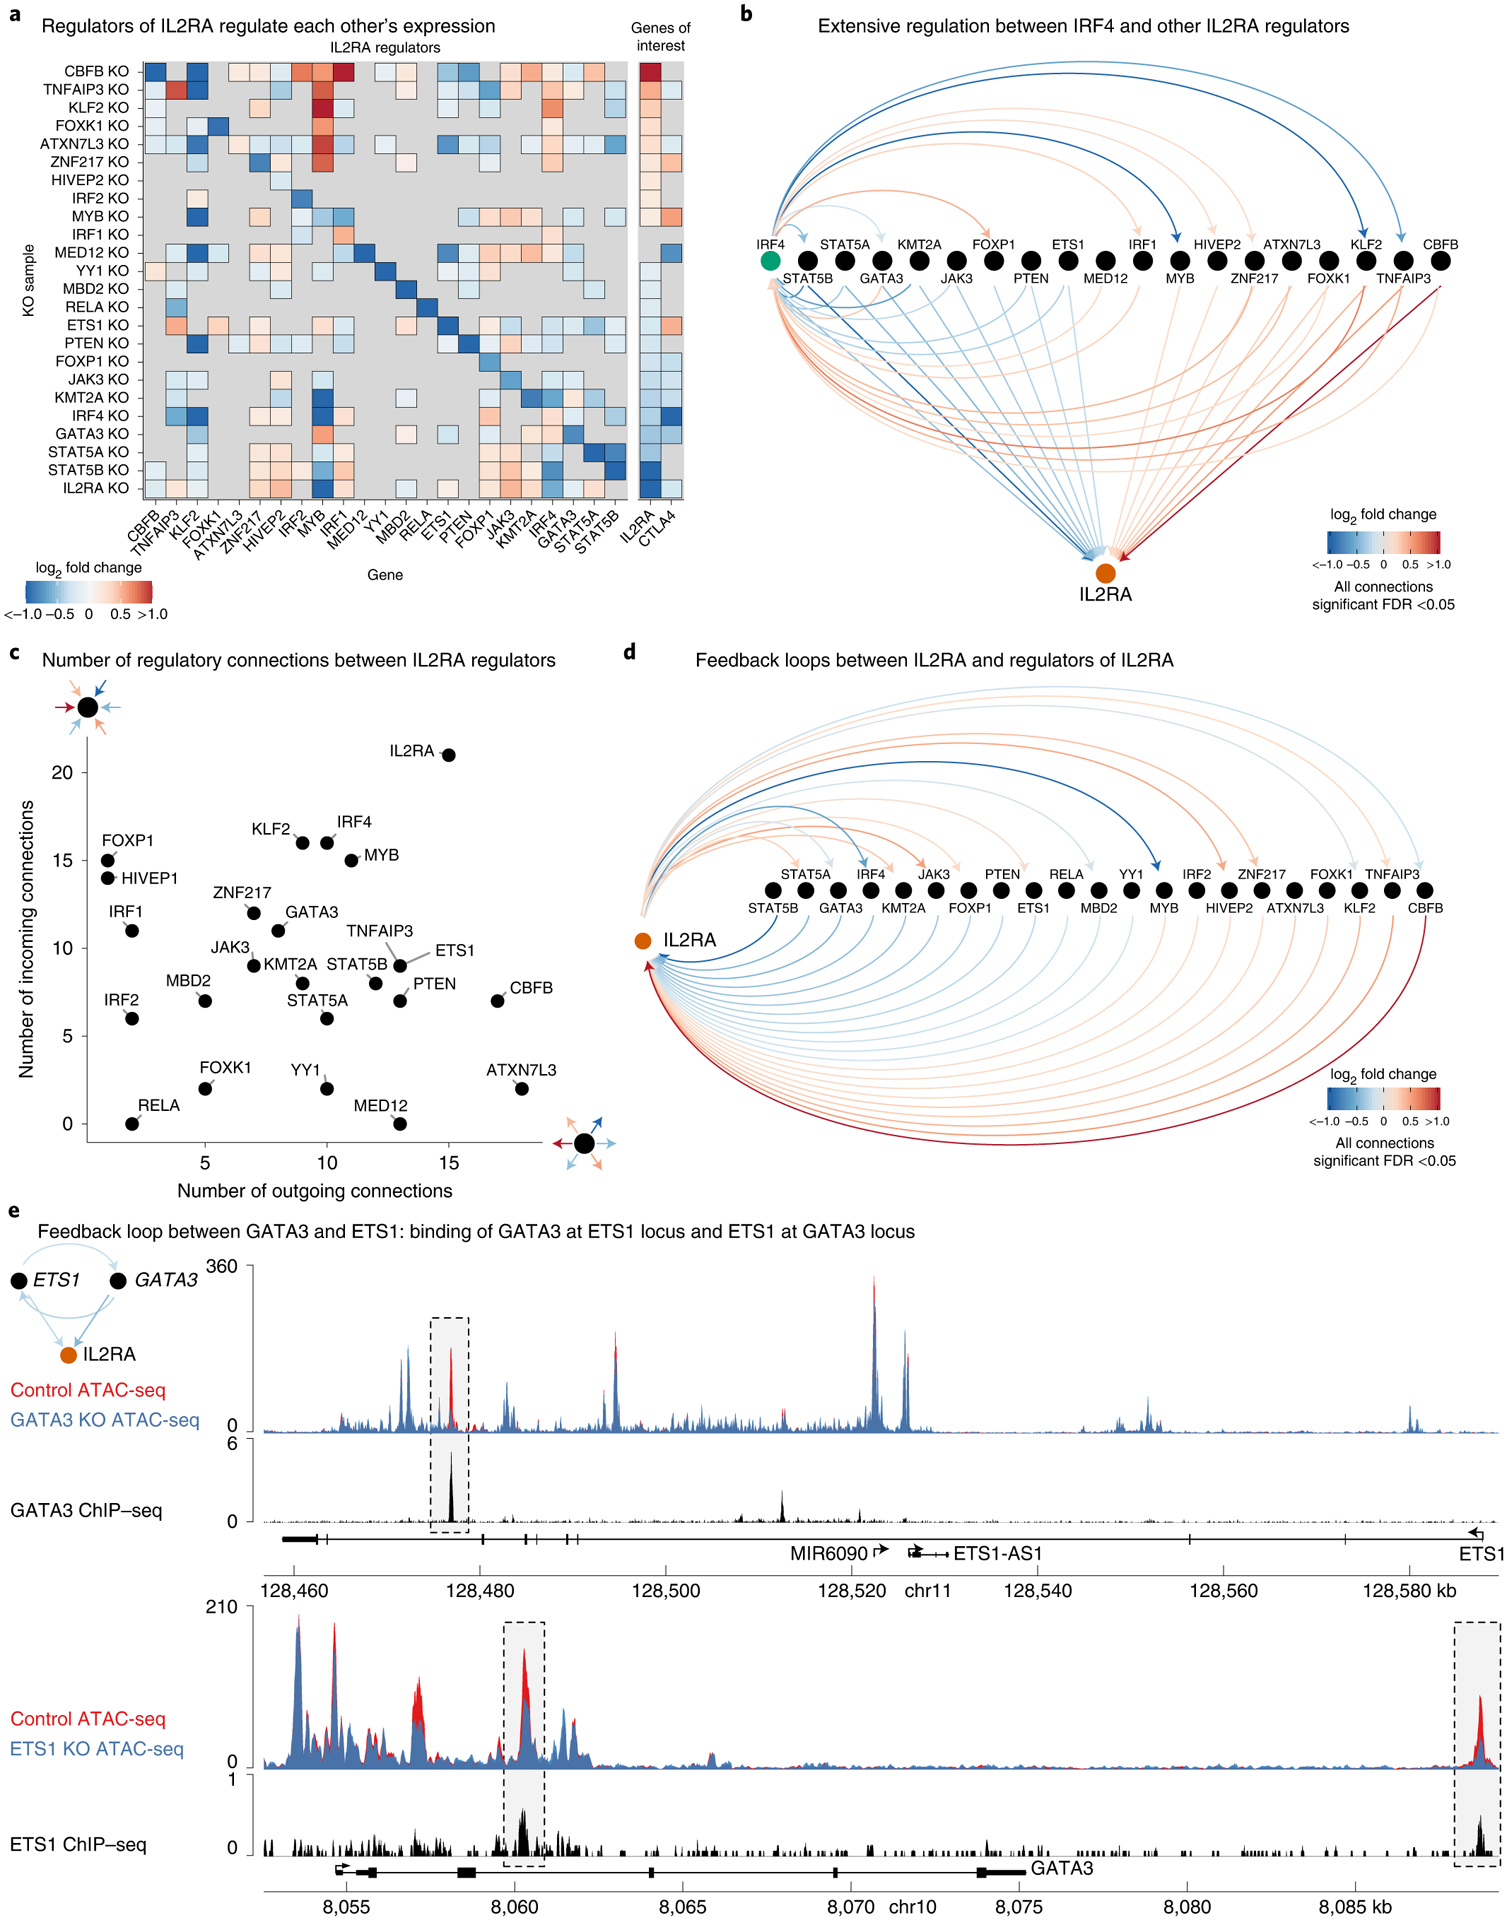
a, Significant changes in the expression of IL2RA regulators, IL2RA and CTLA4 in each knockout sample (FDR-adjusted P < 0.05 from Limma for all changes shown). b, Map of regulatory connections between IRF4 and other IL2RA regulators detected via RNA-seq in each knockout sample. Arrows point towards the target gene perturbed in each knockout sample, while the color of lines shows the fold change of the target (FDR-adjusted P < 0.05 from Limma for all changes shown). c, Number of outgoing and incoming regulatory connections between each IL2RA regulator and all other IL2RA regulators. d, Map of regulatory connections between IL2RA and regulators of IL2RA as described in b. e, Feedback loop between ETS1 and GATA3; connections as described in b. Top tracks, changes in chromatin accessibility in GATA3 knockout cells and ChIP–seq of GATA3 binding at the ETS1 locus. Bottom tracks, changes in chromatin accessibility in ETS1 knockout cells and ChIP–seq of ETS1 binding at the GATA3 locus. ATAC-seq data are shown as normalized read coverage; samples were normalized using the size factors from DESeq2. ChIP–seq data are shown as background subtracted binding in reads per million. GATA3 ChIP–seq from Kanhere et al.47 and ETS1 ChIP–seq from Schmidl et al.48. n = 3 donors for RNA-seq and ATAC-seq. chr, chromosome.
The transcription factor IRF4 exemplified the extensive connections between IL2RA regulators. IRF4 knockout significantly altered the expression of 9 other regulators, while 15 other knockouts significantly altered the expression of IRF4 (Fig. 5b). The number of connections between IRF4 and other regulators illustrates how even this subnetwork of 24 genes is highly interconnected and suggests that the full network is likely even more interconnected.
To understand the architecture of this network better, we analyzed the number of ‘outgoing’ and ‘incoming’ connections for each IL2RA regulator (Fig. 5c). Outgoing connections represent the number of other IL2RA regulators affected by a given knockout. Incoming connections represent the number of knockouts that affect a given regulator. CBFB and ATXN7L3 had many outgoing connections, but few incoming connections, suggesting that they may serve as more upstream regulators. Conversely, HIVEP2 and FOXP1 had many incoming connections, but very few outgoing connections, revealing that they are relatively more targeted in regulating IL2RA. To gain further insight into regulator–regulator epistatic interactions, we performed combinatorial perturbations of five of the strongest regulators of IL2RA. Most combinatorial perturbations had roughly additive effects on IL2RA levels, suggesting that they operate through independent pathways (Extended Data Fig. 3f). The impact on IL2RA levels was dependent on the efficacy of the knockouts in the donors (Extended Data Fig. 3g). The combinatorial knockout data suggest that JAK3 and STAT5B are epistatic, consistent with the literature on the well-characterized JAK/STAT pathway37. Additionally, CBFB and IRF4 had a possible epistatic relationship, with CBFB knockout dampening the effect of IRF4 knockout, suggesting an interesting future direction of investigation to explore the relationships between regulators.
Strikingly, IL2RA itself had a high number of both incoming and outgoing connections (Fig. 5c). The high number of incoming connections was expected given our experimental design, but the number of outgoing connections suggests that IL2RA is involved in extensive feedback loops. We analyzed how many IL2RA regulators were differentially expressed in the IL2RA knockout and observed numerous feedback loops between IL2RA regulators and IL2RA itself (Fig. 5d). We also identified feedback loops between IL2RA regulators. For example, knockout of GATA3 and ETS1 decreased each other’s expression (Fig. 5e). To determine whether this reciprocal regulation is direct, we analyzed public ETS1 and GATA3 chromatin immunoprecipitation sequencing (ChIP–seq)47,48 in human CD4+ T cells with our ETS1 and GATA3 knockout ATAC-seq data. In the GATA3 knockout ATAC-seq data, there was a specific loss of chromatin accessibility at a GATA3 ChIP–seq peak in the ETS1 locus. Similarly, in the ETS1 knockout ATAC-seq data, there was a loss of chromatin accessibility at two ETS1 ChIP–seq peaks in the GATA3 locus. Together, these data suggest that ETS1 and GATA3 directly control specific sites of chromatin accessibility at each other’s loci and regulate each other’s expression. To date, feedback loops likely have been underdetected in human gene networks because their identification requires the reciprocal perturbations performed in this study.
Coregulated gene sets are enriched for immune disease genes.
Since the IL2RA regulators form a highly interconnected network, we were interested to know whether they coregulate genes with critical roles in T cells. We identified genes that are coregulated to different degrees on the basis of the number of knockout samples where the gene is differentially expressed (Fig. 6a). Most genes were differentially expressed in one to six knockouts, but hundreds of genes were differentially expressed in ten or more knockouts, indicating that they are highly coregulated by IL2RA regulators (Fig. 6b). These highly coregulated genes were significantly enriched for annotated immune genes (Fig. 6b). We were interested in whether the IL2RA regulators also coregulate either Mendelian or GWAS immune disease genes49–51. Strikingly, the IL2RA coregulated network was significantly enriched for Mendelian and GWAS disease genes (Fig. 6b). This finding suggests that key immune disease genes sit in a highly connected central network. To our knowledge, a highly connected network of disease genes has not been demonstrated experimentally, but is consistent with recent theoretical models suggesting that peripheral regulatory connections converge on a set of core genes that are directly involved in disease-relevant cellular processes3,52.
Fig. 6 |. Coregulated gene sets are enriched for immune disease genes.
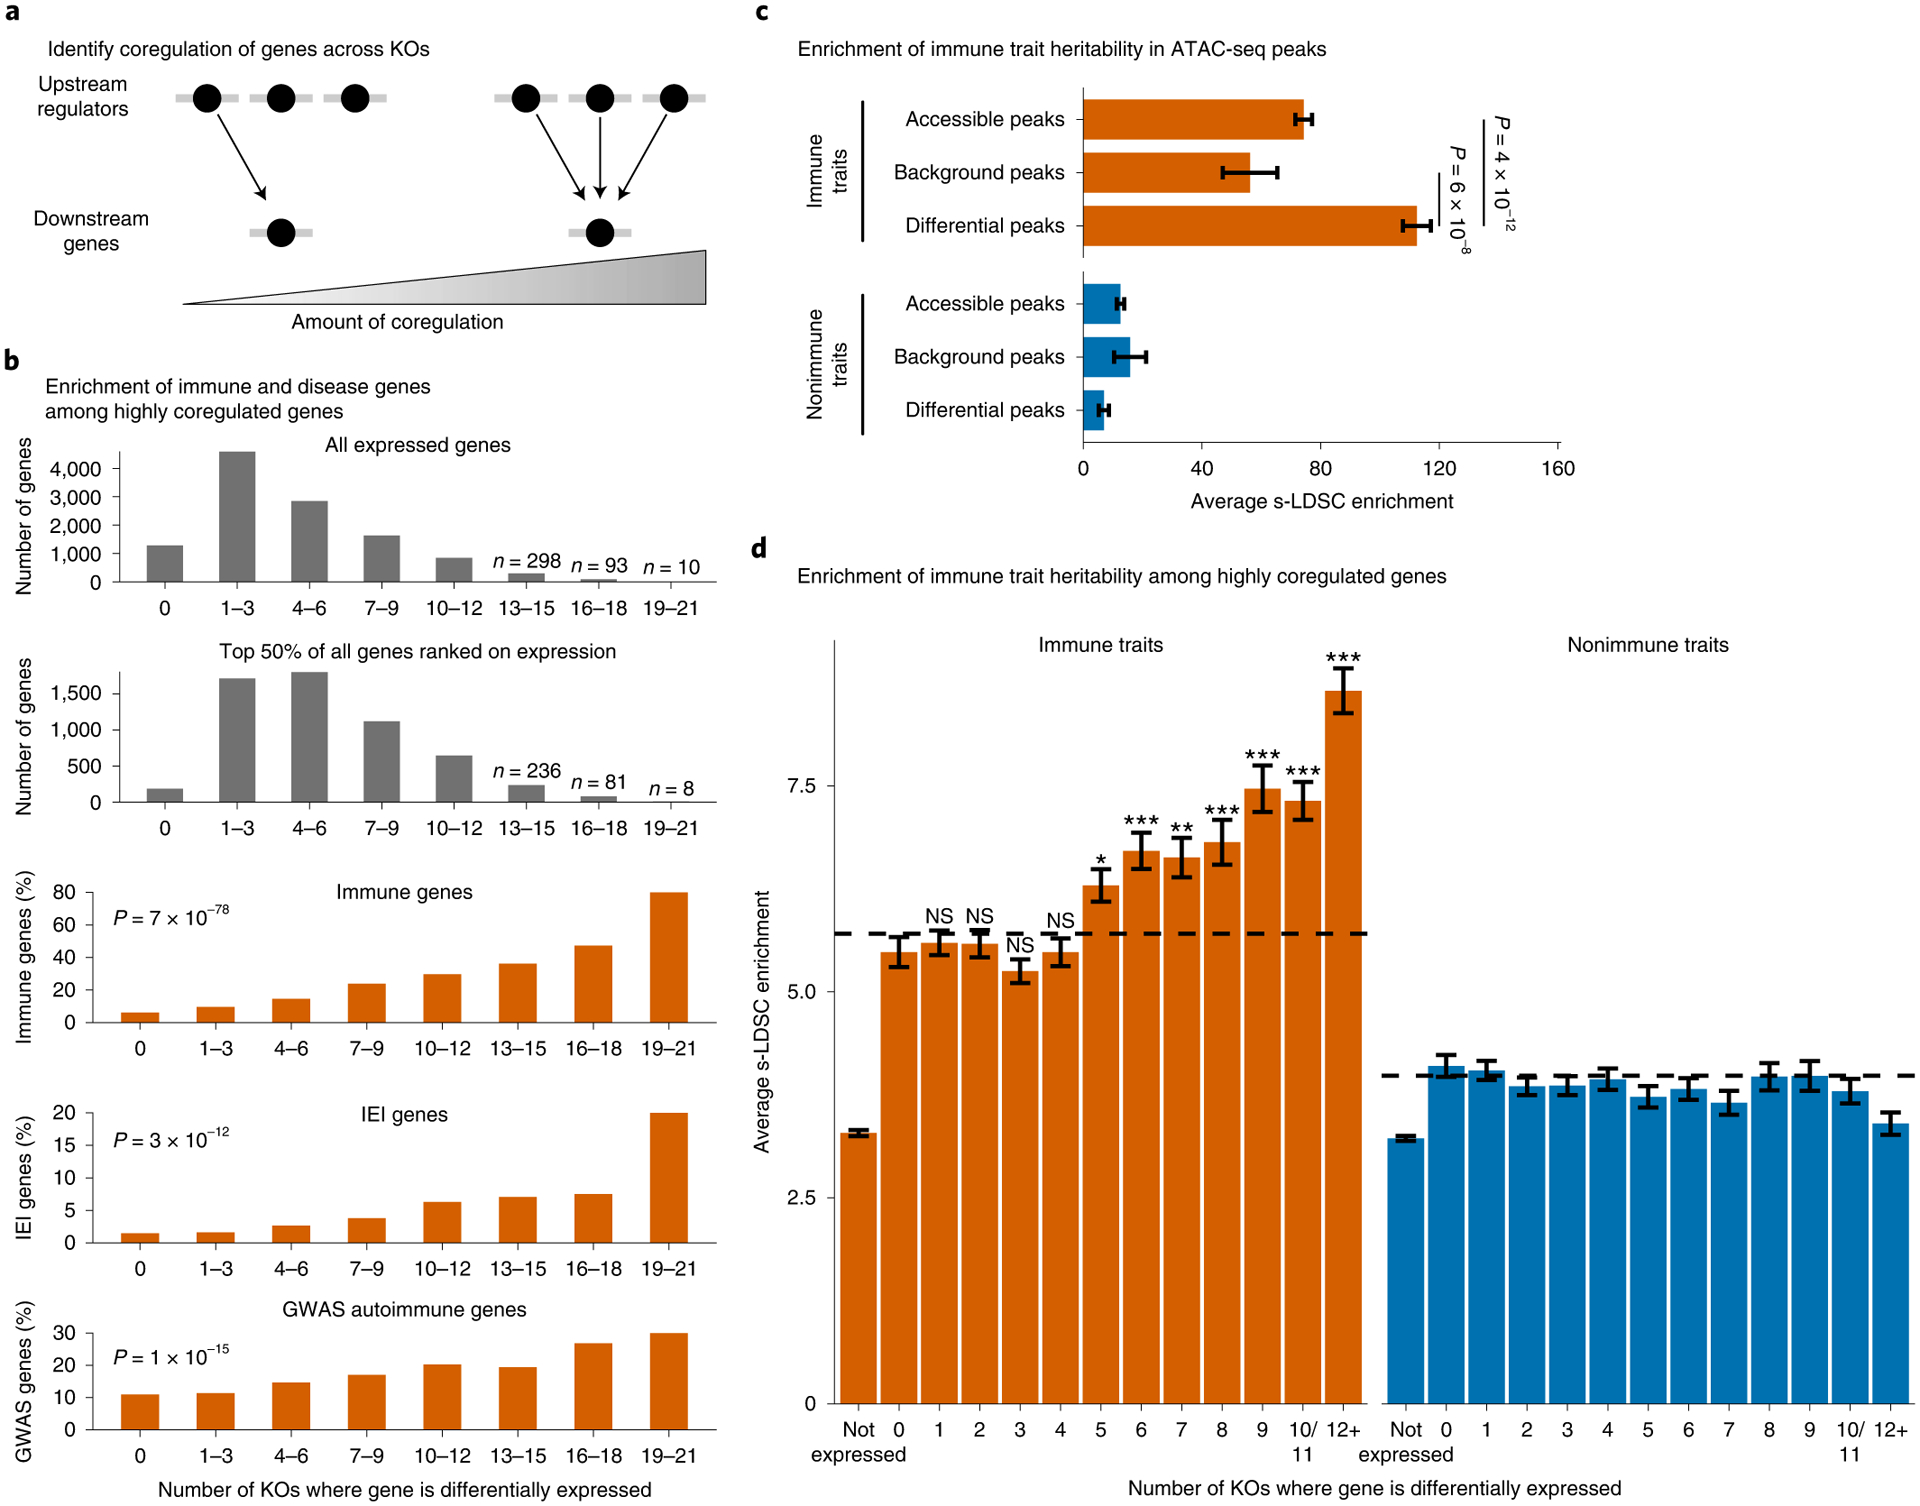
a, Define the degree of gene coregulation based on the number of knockouts where a gene is differentially expressed. b, Total number of genes that are significantly differentially expressed in each knockout bin or the percent of differentially expressed genes that are classified as ‘immune system process’ genes by gene ontology, inborn errors of immunity (IEI) Mendelian disease genes, or autoimmune GWAS genes. (P values calculated with a logistic regression using average expression and coregulation bins as inputs. IL2RA, IL-2 and CTLA4 excluded from analysis.) c,d, Enrichment of heritability for immune traits compared with nonimmune traits in all ATAC-seq peaks or significantly differentially accessible ATAC-seq peaks (c) or in a 100-kb window around highly coregulated genes (d). Average background enrichment across coregulation bins is shown as dashed lines in d. Enrichment calculated using stratified LD score regression. Traits were meta-analyzed using inverse variance weighting; average enrichment and standard error shown. P values were calculated by first converting the difference in average enrichments to Z scores, and then converting Z scores to two-sided P values (Methods). For d, Bonferroni-corrected P values range from 3 × 10⁻² to 4 × 10⁻²¹ for bins 5–12 versus bin 0. NS, not significant. n = 16 immune traits and n = 15 nonimmune traits for c and d. See also Extended Data Fig. 5.
To further explore how IL2RA regulators and their targets might be involved in complex forms of immune disease, we used stratified linkage disequilibrium (LD) score (s-LDSC) regression to calculate the enrichment of immune and nonimmune trait heritability in ATAC-Seq peaks53. Consistent with previous analyses13–16,54, heritability for immune traits is enriched in T cell accessible chromatin compared with nonimmune traits (Fig. 6c). We also found that ATAC-seq peaks that were significantly changed in at least one knockout were further enriched for immune trait heritability (Fig. 6c). We confirmed that this signal was not driven by just a few of the regulators (Extended Data Fig. 5a). This enrichment suggests that IL2RA regulators control a set of critical chromatin accessibility sites that can be altered by genetic variants and contribute to immune disease risk, revealing a network of coregulated noncoding elements that could help to prioritize and characterize candidate GWAS hits.
We next wanted to test whether highly coregulated genes are specifically enriched for immune trait heritability rather than complex trait heritability more generally. We used s-LDSC to measure the enrichment of heritability in regions surrounding genes coregulated to different degrees for immune and nonimmune traits14. Highly coregulated genes were enriched for immune trait heritability compared with nonimmune traits or immune genes that are not highly coregulated (Fig. 6d). To control for immune genes being more highly expressed in T cells, and thus easier to detect as differentially expressed, we generated a background set of genes for each coregulation bin. These background sets were sampled from genes that were differentially expressed in less than five knockouts and were matched to the differentially expressed genes in each coregulation bin based on expression. Highly coregulated genes were more enriched than their corresponding background sets, demonstrating that the enrichment is not just driven by levels of expression (Fig. 6d and Extended Data Fig. 5b). Overall, these data show that regulators of IL2RA coregulate a network of other immune disease genes. Furthermore, this process of identifying the regulators of key disease genes and then mapping their downstream targets could serve as a general strategy to map disease networks.
IL2RA regulators affect CREs and genes associated with multiple sclerosis.
Among immune traits, multiple sclerosis (MS) heritability was markedly enriched in our ATAC-seq peaks (Extended Data Fig. 6a). To explore how IL2RA regulators affect putative CREs and genes associated with MS, we used the probabilistic identification of causal (PICS)13,51 algorithm to identify likely causal SNPs from a recent MS GWAS meta-analysis55. Of 100 MS-associated SNPs with a PICS probability greater than 50%, 28 were within an ATAC-seq peak (Fig. 7a). Remarkably, 17 of these SNPs were in ATAC-seq peaks that were altered upon knockout of an IL2RA regulator (Fig. 7a; P = 0.004, one-sided hypergeometric test). This finding reveals specific regulators that affect noncoding elements containing fine-mapped MS variants and places a large set of MS variants into a newly defined gene regulatory network.
Fig. 7 |. IL2RA regulators affect CREs and genes associated with multiple sclerosis.
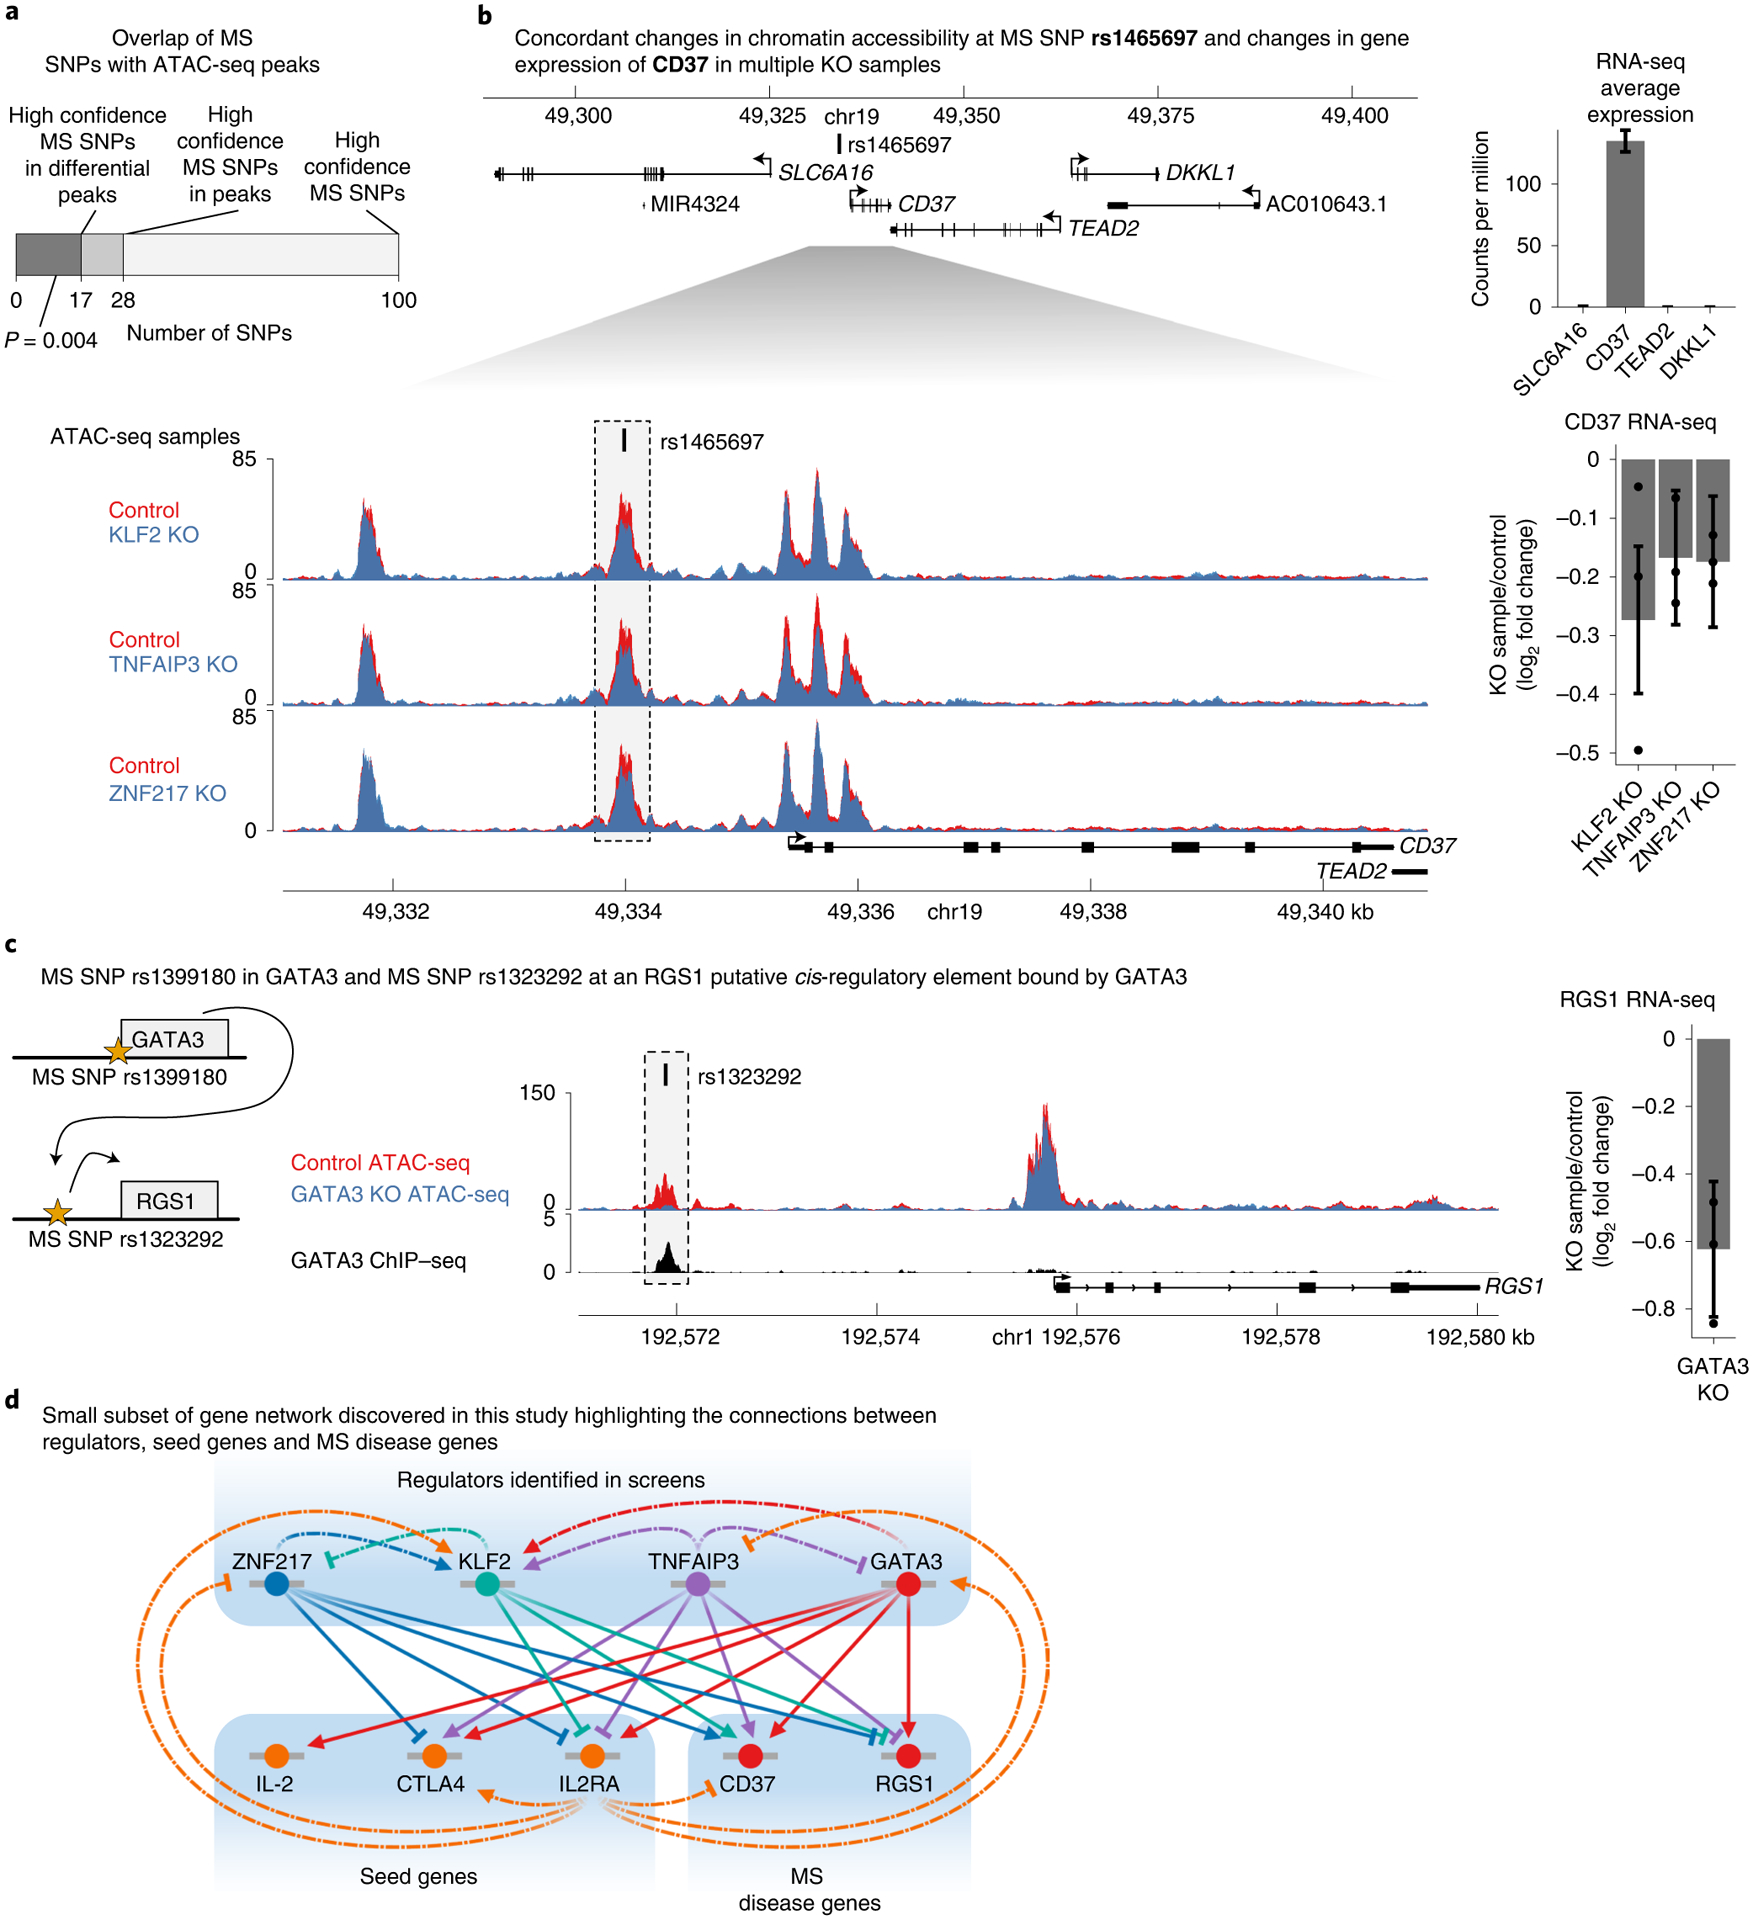
a, The number of high confidence MS SNPs with a PICS probability >0.5 in the genome, in all ATAC-seq peaks, or in differentially accessible ATAC-seq peaks (for which the P value was calculated with one-sided hypergeometric test). b, Top, expression of genes surrounding MS SNP rs1465697 in CD4+ T cells. Data are presented as mean ± s.d. Bottom, changes in chromatin accessibility at rs1465697 and accompanying changes in CD37 expression in KLF2, TNFAIP3 and ZNF217 knockouts. ATAC-seq data are shown as normalized read coverage; samples were normalized using the size factors from DESeq2. RNA-seq data are presented as the effect size from Limma with error bars showing the 95% confidence interval. c, Cartoon illustrating MS SNPs both at GATA3 and at a putative CRE upstream of RGS1. Changes in chromatin accessibility at rs1323292 and accompanying changes in RGS1 expression in GATA3 knockout. ChIP–seq of GATA3 binding at rs1323292. ATAC-seq data are shown as normalized read coverage; samples were normalized using the size factors from DESeq2. ChIP–seq data are shown as background subtracted binding in reads per million. RNA-seq data are presented as the effect size from Limma, with error bars showing the 95% confidence interval. chr, chromosome. d, A small subset of the regulatory connections identified in this study between seed immune disease genes, their upstream regulators and MS disease genes. This subnetwork is focused on regulators that have a significant effect on CD37 or RGS1 chromatin accessibility and gene expression. n = 3 donors for all RNA-seq and ATAC-seq data in b and c. See also Extended Data Fig. 6.
To explore how MS SNPs might disrupt this network, we sought to link knockouts of IL2RA regulators to changes in putative CREs containing MS SNPs and to changes in the expression of nearby genes. For each SNP within a differential ATAC-seq peak, we analyzed how many protein-coding genes within 100 kb were differentially expressed in at least one knockout (Extended Data Fig. 6b). The MS SNP rs1465697 is an eQTL in various cell types for CD37, DKKL1, TEAD2 and SLC6A16 (ref.32). However, only CD37 was expressed in our data (Fig. 7b). Knockout of KLF2, TNFAIP3 and ZNF217 decreased chromatin accessibility at the putative CRE containing rs1465697 and CD37 expression (Fig. 7b). These concordant changes across different knockouts strongly link this putative CRE to CD37 as the relevant target gene in T cells.
We used CRISPR to edit this putative CRE and test the effect on CD37 expression. We sorted the edited cells based on CD37 levels and sequenced the CRE. Cells containing the reference allele were enriched in CD37 high cells, while insertions/deletions around the SNP were enriched in CD37 low cells (Extended Data Fig. 6c). Furthermore, the average deletion size was larger in the CD37 low cells (Extended Data Fig. 6d). These data suggest that this CRE can act as an enhancer for CD37. However, single basepair edits at the SNP or the naturally occurring SNP in the case of donor 3 were not differentially enriched between the CD37 high and low cells (Extended Data Fig. 6c). The SNP is an eQTL for CD37 in other cells, suggesting it can regulate CD37, but its effects may be time- or context-dependent32,38. Overall, these results suggest that analyzing concordant effects on putative CREs and nearby genes across multiple knockouts could be a generalizable strategy to link CREs to their target genes.
Distinct SNPs associated with the same disease might also disrupt multiple components of a regulatory cascade. The MS SNP and eQTL rs1399180 (ref.32) is in the intron of GATA3, suggesting that altered GATA3 levels contribute to MS risk. We next asked whether GATA3 regulates any putative CREs containing an MS SNP. Using public GATA3 ChIP–seq47 and our GATA3 knockout ATAC-seq, we found a putative CRE directly bound by GATA3 upstream of RGS1 that harbors the MS SNP rs1323292 (Fig. 7c). GATA3 knockout significantly decreased chromatin accessibility at this CRE and RGS1 expression (Fig. 7c). These data suggest that RGS1 expression and accessibility at its MS-associated CRE depend directly on GATA3. Furthermore, these data demonstrate how disease SNPs can affect multiple genes within a single regulatory cascade. We also performed a motif analysis to predict the transcription factor binding motifs that might be disrupted by these SNPs (Supplementary Table 6). Together, these examples illustrate how we can combine genetic perturbations, ATAC-seq and RNA-seq to understand how disease SNPs disrupt regulatory connections within gene networks, highlighting key regulators, putative CREs and downstream target genes required for immune homeostasis (Fig. 7d).
Discussion
Limited understanding of trans-regulatory networks has hampered our understanding of how disease-associated variants affect disease risk. To map trans-regulatory networks, the field has traditionally faced a tradeoff between performing observational studies in disease-relevant primary cells or functional studies in less relevant cell lines or animal models. To overcome limitations with each of these approaches, we combined CRISPR perturbations, RNA-seq and ATAC-seq in primary human T cells to decipher the regulation of human disease genes and putative CREs.
Although trans-regulation can be inferred through trans-eQTL studies, such studies require thousands of samples to detect a modest number of trans-eQTLs5,9. These sample sizes are prohibitive to map trans-regulatory connections comprehensively, especially since they must be repeated in each cell type of interest. In contrast, we identified dozens of upstream regulators and thousands of downstream targets by performing genetic perturbations directly in disease-relevant primary cells.
Functional studies to identify upstream regulators have been performed primarily in cell lines or mouse models35,56–58, which are not ideal for understanding disease biology. By using primary human cells, we could integrate the regulatory connections that we identified with genetics data to link regulators with a network of immune disease genes and putative CREs. While these studies were performed ex vivo and do not fully recapitulate the in vivo environment, the fact that immune trait SNPs were significantly enriched in the ATAC-seq peaks suggests that we are capturing biology relevant for understanding in vivo disease networks. Future work will be needed to assess regulatory connections in distinct T cell subsets, in response to stimuli, or in disease settings.
We comprehensively mapped connections between 24 IL2RA regulators and thousands of downstream target genes and putative CREs. Identifying the downstream targets of each regulator in primary cells is an important step toward elucidating the processes that these factors regulate. Additionally, while gene coexpression is used commonly to construct gene regulatory networks, such observations are merely correlative42–46. Previous perturbation studies were limited by the number of genes studied, less robust siRNA perturbations, or less sensitive microarray measurements59,60. Consistent with our observations, several studies combining CRISPR perturbations with single-cell sequencing observed highly interconnected regulation between a limited set of transcription factors18,61,62. However, since we generated knockout populations with high efficiencies, we could use bulk ATAC-seq and RNA-seq to capture thousands of additional changes compared with single-cell approaches. These additional data are especially important to map regulatory connections between transcription factors, which are expressed in low amounts63 and can be more difficult to measure using single-cell RNA-seq.
These regulatory maps showed the highly interconnected structure of human gene networks. As we measured a subnetwork focused on only 24 individual knockouts, the full network probably contains many additional feedback loops. Future work focused on combinatorial perturbations would be interesting to map epi-static interactions more comprehensively. As technology improves, genome-wide perturbations and profiling will likely be needed to map gene regulatory networks comprehensively.
Our strategy to map gene networks is likely broadly applicable to situations where we know a few genes of interest but have yet to discover what other genes and noncoding elements are involved. Perturbation of 1,484 genes coupled with profiling in yeast demonstrated that this approach can assign many genes to functional pathways39. As similar scale experiments are not yet feasible in mammalian systems, we developed a two-step approach. We first identified the most important regulatory genes and then performed a focused set of perturbations coupled with RNA-seq and ATAC-seq. The strong enrichment for immune genes among coregulated genes suggests that this is a powerful and broadly applicable approach for identifying functionally related genes and putative CREs.
The identified IL2RA regulators coregulate a central network significantly enriched for genes that are associated with immune diseases. This network architecture is consistent with the omnigenic model that we proposed, in which a set of core genes act directly on a trait, but perturbations of many peripheral genes affect the expression of these core genes3,52. This network structure could explain how the dysregulation of many seemingly unrelated GWAS hits could disrupt a central network of important disease genes. Importantly, using perturbations to map gene networks can also identify connections between disease genes and upstream regulators that themselves have not been genetically associated with the disease. Furthermore, this network could be relevant for diagnosing candidate genetic variants found in clinical genome sequencing that have not been implicated in immunodeficiencies or autoimmune diseases, but map to genes in this network. Lastly, IL2RA, IL-2 and CTLA4, which served as seeds for this network, are established targets of drug development for cancer and autoimmune diseases64,65, so this network will likely help to identify promising new drug targets.
Finally, assembling gene network maps can also be used to engineer immune cell therapies. Better understanding of T cell regulatory networks will enable improved cell therapies and safer manipulation of genes with a more holistic understanding of the downstream consequences of such manipulation.
Methods
Sample collection.
This study was approved by the University of California San Francisco (UCSF) Committee on Human Research and Stanford University Panel on Medical Human Subjects (IRB 53302) and written consent was obtained from all donors. Primary human T cells were obtained from whole blood donors through a protocol approved by the UCSF Committee on Human Research (CHR 13–11950) or through consented Leukopaks (STEMCELL). For some experiments that did not involve amplicon-, RNA-seq or ATAC-seq, primary human T cells were obtained from residuals from leukoreduction chambers after apheresis (Blood Centers of the Pacific).
Isolation, culture and expansion of human CD4+ CD25– effector T cells.
Peripheral blood mononuclear cells were isolated by size separation using Lymphoprep (STEMCELL, catalog no. 07861) in SepMate tubes (STEMCELL, catalog no. 85460), according to the manufacturer’s protocol. To exclude CD4+ CD25+ regulatory T cells, CD4+ CD25− effector T cells were isolated using the StemCell EasySep Human Isolation Kit (catalog no. 18063). Isolated cells were then stimulated with Immunocult Human CD3/CD28/CD2 T Cell Activator (STEMCELL, catalog no. 10970) at 6.25 μl per 1 × 10⁶ cells, cultured in RPMI with 50 U ml−1 IL-2 (Amerisource Bergen, catalog no. 10101641) at a concentration of 1 × 10⁶ cells ml−1.
Pooled CRISPR screen.
The IL2RA, IL-2 and CTLA4 screens were performed in cells from the same two donors; on the collection day, the CRISPR-edited cells were divided, stained for each target independently, and then sorted based on the expression of each target. The IL2RA screen was performed in cells from one additional donor.
Lentiviral transduction.
At around 24 h poststimulation, lentivirus containing the sgRNA library was added directly to cultured T cells in a dropwise fashion while tilting the flasks to distribute evenly, targeting a multiplicity of infection of 0.4. After an additional 24 h, excess lentivirus was removed from the supernatant and washed off the cells. Cells were then incubated at 37 °C.
Cas9-RNP preparation.
Cas9 protein (MacroLab, Berkeley, 40 μM stock) was delivered into the cells using a modified Guide Swap technique66. Lyophilized Dharmacon Edit-R crRNA nontargeting Control 3 (Dharmacon, catalog no. U-007503–01-05) and Dharmacon Edit-R CRISPR-Cas9 Synthetic tracrRNA (Dharmacon, catalog no. U-002005–20) were resuspended at a stock concentration of 160 μM in 10 mM Tris-HCl (pH 7.4) with 150 mM KCl. They were mixed at a 1:1 ratio, creating an 80 μM solution and incubated on a heat block at 37 °C for 30 min. Single-stranded donor oligonucleotides (ssODN; sequence: TTAGCTCTGTTTACGTCCCAGCGGGCATGAGAGTAACAAGAGGGTGT GGTAATATTACGGTACCGAGCACTATCGATACAATATGTGTCATACGGACACG) were then added at a 1:1 molar ratio of the final Cas9–Guide complex, and mixed well by pipetting. The solution was incubated for an additional 5 min at 37 °C on the heat block. Cas9 was then added slowly at a 1:1 volume:volume ratio, taking care to avoid precipitation, pipetting up and down several times to ensure complete resuspension of the RNP complex, and incubated at 37 °C for 15 min.
Electroporation.
At around 24 h after virus was washed from the culture, cells were centrifuged at 100g for 10 min to pellet them, and resuspended in room temperature Lonza P3 electroporation buffer (Lonza, catalog no. V4XP-3032) at 1 × 10⁶–2 × 10⁶ cells per 17.8 μl. Then, 7.2 μl of the RNP-ssODN complex was added for every 17.8 μl of cells and mixed well. Using a multichannel pipette, 23 μl of the cells-RNP-ssODN mixture was added to each well of a 96-well electroporation cuvette plate (Lonza, catalog no. VVPA-1002), and nucleofected using the pulse code EH-115. Immediately after electroporation, 90 μl of prewarmed medium was added to each well and incubated at 37 °C for 15 min. Cells were then pooled, transferred to incubation flasks, and diluted with prewarmed medium to a final concentration of 1 × 10⁶ cells ml−1 and incubated at 37 °C. Cells were passaged at around 48 h postelectroporation, and subsequently maintained in culture at 1 × 10⁶ cells ml−1.
Screen phenotyping and cell sorting.
Cells were collected for analysis 6 days after electroporation, and 10–20 × 106 cells were portioned off and sorted based on GFP expression only. The remaining cells were sorted based on GFP positivity, as well as target expression using an APC fluorescent antibody targeting either IL2RA (CD25) (Tonbo, catalog no. 20–0259-T100), IL-2 (Biolegend, catalog no. 500310) or CTLA4 (Biolegend, catalog no. 349908). All antibodies were used at a 1:25 dilution for staining. Cells sorted for IL2RA underwent surface staining according to the manufacturer’s protocol. Cells sorted for IL-2 were treated with Cell Activation Cocktail with Brefeldin A (Biolegend, catalog no. 423304) for 4 h before fixation, and were fixed using the BD Cytofix/Cytoperm kit (Becton Dickinson, catalog no. 554714) according to the manufacturer’s protocol. Cells sorted for CTLA4 were treated with Cell Activation Cocktail without Brefeldin A (Biolegend, catalog no. 423302) for 4 h before fixation, and were fixed using the Foxp3 Fix/Perm buffer set (Biolegend, catalog no. 421403) according to the manufacturer’s protocol. Cells were sorted using a BD FACS Aria II and FACSDiva v.8.0.1.
RNA-seq.
RNA was submitted to the UC Davis DNA Technologies and Expression Analysis Core to generate 3′ Tag-seq libraries with unique molecular indices (UMIs). Barcoded sequencing libraries were prepared using the QuantSeq FWD kit (Lexogen) for multiplexed sequencing according to the recommendations of the manufacturer. The fragment size distribution of the libraries was verified via microcapillary gel electrophoresis on a Bioanalyzer 2100 (Agilent). The libraries were quantified by fluorometry on a Qubit fluorometer (LifeTechnologies) and pooled in equimolar ratios. Samples were sequenced on a HiSeq 4000 sequencer (Illumina).
Plate-ATAC protocol.
We harvested, counted and treated each T cell culture with 200 U ml−1 of DNase (Worthington catalog no. LS002007) for 30 min at 37 °C. We then transferred 60,000 cells of each T cell culture into individual wells of a 96-well plate and washed cells once with PBS and once with RSB (10 mM Tris-HCl pH 7.5, 10 mM NaCl, 3 mM MgCl2). Cells were lysed in 50 μl of cell lysis buffer (0.1% NP40, 0.1% Tween-20, 0.01% Digitonin in RSB) on ice for 3 min. We then added 150 μl of RSB with 0.1% Tween-20 to each well and pelleted nuclei at 500g for 10 min at 4 °C. Cells were resuspended in 50 μl transposition mix (25 μl 2× TD buffer [20% dimethylformamide, 20 mM Tris-HCl, pH 7.6, 10 mM MgCl2], 16.5 μl 1× PBS, 0.5 μl 10% Tween, 0.5 μl 1% Digitonin, 2.5 μl Tn5 transposase and 5 μl H2O) and transposition was performed at 37 °C for 30 min with 300 rpm shaking. Transposed fragments were purified using ZR-96 DNA Clean & Concentrator-5 Kit (Zymo D4024) and libraries were generated using PCR amplification with Nextera adapters and purified using Ampure beads. ATAC-seq libraries were sequenced on a Novaseq with paired-end 100-bp reads. The following samples produced low yield libraries and were not carried forward with sequencing: donor 1 PTEN knockout, donor 3 STAT5B knockout, donor 3 AAVS1_4 control.
Analysis of pooled screens.
A table of individual guide abundance in each sample was generated using the count command in MAGeCK v.0.5.8 (ref.67). Two individual sgRNAs (s_991 and s_3329) were filtered out due to extreme outlier counts. The MAGeCK test command was used to identify differentially enriched sgRNA targets between the low and high bins. All genes with an FDR-adjusted P < 0.05 were considered significant. For screen QC, classification of essential genes, fitness and nonessential genes were taken from Hart et al.68. Screen targets were classified as expressed if they had a count greater than zero transcripts per million in CD4+ T cell RNA-seq from Calderon et al.16.
Analysis of RNA-seq data.
Adapters were trimmed from fastq files using cutadapt v.2.10 (ref.69) with default settings keeping a minimum read length of 20 bp. Reads were mapped to the human genome GRCh38 keeping only uniquely mapping reads using STAR v.2.7.5b70 with the following settings ‘–outFilterMultimapNmax 1.’ UMIs were extracted from fastqs using umi_tools v.1.0.1 (ref.71) extract command with the following settings ‘–extract-method=regex–bc-pattern = ‘(?P < umi_1 >. {{6}})(?P < discard_1 > .{{4}}).*”. Reads were then deduplicated using umi_tools dedup command with default settings. Deduplicated reads overlapping genes were then counted using featureCounts v.2.0.1 (ref.72) with the following settings ‘-s 1’ and using the Gencode v.35 basic transcriptome annotation.
To identify differentially expressed genes, UMI deduplicated counts between each knockout sample and AAVS1 control samples were compared; sample donor 4 AAVS1 number 6 was excluded as an outlier. A minimum count per million was calculated based on the read depth of the samples being compared using the following command ‘ceiling(10/(min(colSums(count_mat))/1e6))’ in R; only genes with more reads than this minimum count across at least three samples were kept. Significantly differentially expressed genes for each knockout were then identified using Limma v.3.44.3 (ref.73) while controlling for any differences between donors. Significant differentially expressed genes were defined as having a FDR-adjusted P < 0.05.
Analysis of ATAC-seq data.
Adapters were trimmed from fastq files using cutadapt v.2.10 (ref.69) with default settings keeping a minimum read length of 20 bp. Reads were then mapped to the human genome GRCh38 using bowtie2 v.2.4.1 (ref.74) with the following settings ‘-X 2000–very-sensitive’. Low-quality reads were filtered using SAMtools v.1.10 (ref.75) using the following command ‘samtools view -h -b -F 1804 -f 2 -q 30.’ Reads mapping within the ENCODE blacklist region were removed using bedtools v.2.29.2 (ref.76) using bedtools intersect. Duplicated reads were removed using picard v.2.23.3 (http://broadinstitute.github.io/picard/) using the following settings ‘VALIDATION_ STRINGENCY = LENIENT’. Reads mapping to ChrX, ChrY and ChrM were excluded from further analysis. Reads were converted to single nucleotide ATAC insertion sites using the following command “bedtools bamtobed -i {input.bam} | awk ‘BEGIN {{OFS = “\t”}} $6 == “+” {{$2 = $2 + 4; $3 = $2 + 1; print}} $6 == “-” {{$3 = $3 – 4; $2 = $3 – 1; print}}’ | sort -k1,1 -k2,2n > {output.bed}”. For each sample, peaks were called using MACS2 v.2.2.7.1 (ref.77) using the ATAC insertion site bed files as input with the following settings ‘–format BED–shift −75–extsize 150–nomodel–call-summits–nolambda–keep-dup all -B–SPMR -q 0.01.’
Peaks called in individual samples were merged into a consensus peak file in the following way using single nucleotide peak summits from MACS2. For each knockout or control condition, peak summits that were within 75 bp of another peak summit in two out of three donors and were supported by at least ten ATAC-seq reads were merged into reproducible summit clusters. Across all samples, reproducible summits from each knockout or controls were aggregated with other summits within 150 bp of each other. For each aggregate cluster, we calculated an average summit location based on the location of all of the summits within the cluster. Each average summit location was then extended to 350-bp peaks centered on the average summit location to generate a consensus peak list. For each sample, the number of ATAC-seq insertion sites that overlap each consensus peak was counted using the summarizeOverlaps function in the GenomicAlignments package v.1.24.0 (ref.78).
To identify differentially accessible peaks, counts between each knockout sample and all AAVS1 control samples were compared. A minimum count per million was calculated based on the read depth of the samples being compared using the following command ‘ceiling(10/(min(colSums(count_mat))/1e6))’ in R; peaks with less reads than this minimum across at least three samples were filtered out. Significantly differentially accessible peaks for each knockout were then identified using DESeq2 v.1.28.1 (ref.79) while controlling for both donor and the enrichment of reads at the transcription start site (TSS), which controls for the sample quality of individual ATAC-seq samples. Significant differentially accessible peaks were defined as having a FDR-adjusted P < 0.05.
Analysis of ChIP–seq data.
Preprocessed ChIP–seq coverage bigwigs for transcription factors in various subsets of human CD4+ T cells (STAT5A, STAT5B, ETS1, GATA3, MYB) or engineered bulk T cells (IRF4) were downloaded from ChIP-Atlas80. ChIP-Atlas maps ChIP–seq data to the human genome GRCh38 using Bowtie2, removes PCR duplicates with SAMtools, and calculates coverage in reads per million mapped reads using bedtools. All ChIP–seq tracks show background subtracted binding. ChIP–seq data were originally generated in the following papers: ETS1 (refs.48,81), GATA3 (ref.47), IRF4 (ref.82), MYB83, STAT5A and STAT5B84.
Enrichment of immune genes, Mendelian disease genes and autoimmune GWAS genes.
Genes were associated with the gene ontology term ‘immune system process’ (GO:0002376) using the bioconductor package org.Hs.eg.db v.3.11.4 (ref.85). A list of inborn errors of immunity (IEI) Mendelian disease genes were downloaded from the International Union of Immunological Societies website (https://iuis.org/committees/iei/) December 2019 dataset or taken from the 2021 update49. Genome-wide significant SNPs (P < 5 × 10⁻⁸) associated with 24 autoimmune diseases were taken from Taylor et al.51. Genes were categorized as autoimmune GWAS genes if their TSS is within 100 kb of one of these SNPs. The average gene expression level for all expressed genes was calculated as the log2 average count per million across control AAVS1 1, 2, 3, 4, 5, 7, 8 samples across all three donors. AAVS1 6 was excluded due to one outlier sample. The significance of the association between these three gene categories and how highly a gene is coregulated was calculated with the glm function in R using coregulation bin and average gene expression as inputs.
S-LDSC analysis.
GWAS summary statistics were downloaded from the Price laboratory website (https://alkesgroup.broadinstitute.org/sumstats_formatted/ and https://alkesgroup.broadinstitute.org/UKBB/). LD scores were created for each annotation (corresponding to a set of differential ATAC-seq peaks or SNPs within 100 kb of genes or their corresponding matched background sets) using the 1000G Phase 3 population reference. Each annotation’s heritability enrichment for a given trait was computed by adding the annotation to the baselineLD model and regressing against trait chi-squared statistics using HapMap3 SNPs with the stratified LD score regression package v.1.0.1 (ref.53). Heritability enrichments were meta-analyzed across immune or nonimmune traits using inverse variance weighting. The ATAC-seq background set was generated by randomly sampling peaks from all unchanged peaks. The ATAC-seq peaks in the background set were matched to significant differential ATAC-seq peaks based on deciles of chromatin accessibility in AAVS1 control cells. ATAC-seq background peaks in each accessibility decile were further matched to differential peaks based on the percentage of proximal peaks (defined as within 2 kb of a TSS). For each coregulation bin, RNA-seq background genes were sampled from the set of genes that were differentially expressed in fewer than five samples. RNA-seq background genes were matched to significant differential RNA-seq genes in each bin based on deciles of gene expression in AAVS1 control cells.
To calculate P values for the S-LDSC enrichment between differential and background ATAC-seq peaks or between coregulated gene sets, the difference in average enrichments was first converted into Z scores and then the Z scores were converted to two-sided P values using the following equations in R: z = abs(differential$avg_enrichment - background$avg_enrichment) / sqrt(differential$avg_var + background$avg_var) 2*pnorm(z, mean = 0, sd = 1, lower.tail = FALSE)
Plots and genomic tracks.
All plots were generated in ggplot2 in R v.4.0.2 (ref.86). Network connections were visualized with ggraph package v.2.0.4 in R (https://CRAN.R-project.org/package=ggraph). Heatmap of ATAC-Seq changes at the IL2RA locus was visualized with Gviz v.1.32.0 in R87. For all ATAC-seq coverage tracks, ATAC-seq reads were extended to 100 bp centered on the ATAC-seq insertion site. Size factors for normalization for each sample were estimated using the number of ATAC-seq reads that fall in peaks with the estimateSizeFactorsForMatrix function from the DESeq2 package in R79. Reads at a particular genomic locus were then normalized by that sample’s size factor. Per base read coverage was averaged across all three donors and exported as a bigwig file. Of AAVS1 controls 1–8, AAVS1 control 4 was excluded from coverage calculations due to an insufficient number of reads sequenced across all three donors. ATAC-seq and ChIP–seq coverage at a particular locus was visualized using the pygenometracks package v.3.6 (ref.88) with 25 bp bins.
Reporting summary.
Further information on research design is available in the Nature Research Reporting Summary linked to this article.
Data availability
The raw sequencing files generated during this study are available at GEO under accession GSE171737. Transcription factor binding motifs used in this study were downloaded from JASPAR2020 (https://doi.org/10.18129/B9.bioc.JASPAR2020), HOCOMOCO v.11 (https://hocomoco11.autosome.org/) and CIS-BP (http://cisbp.ccbr.utoronto.ca/index.php).
Extended Data
Extended Data Fig. 1 |. Quality control of the CRISPR screens.
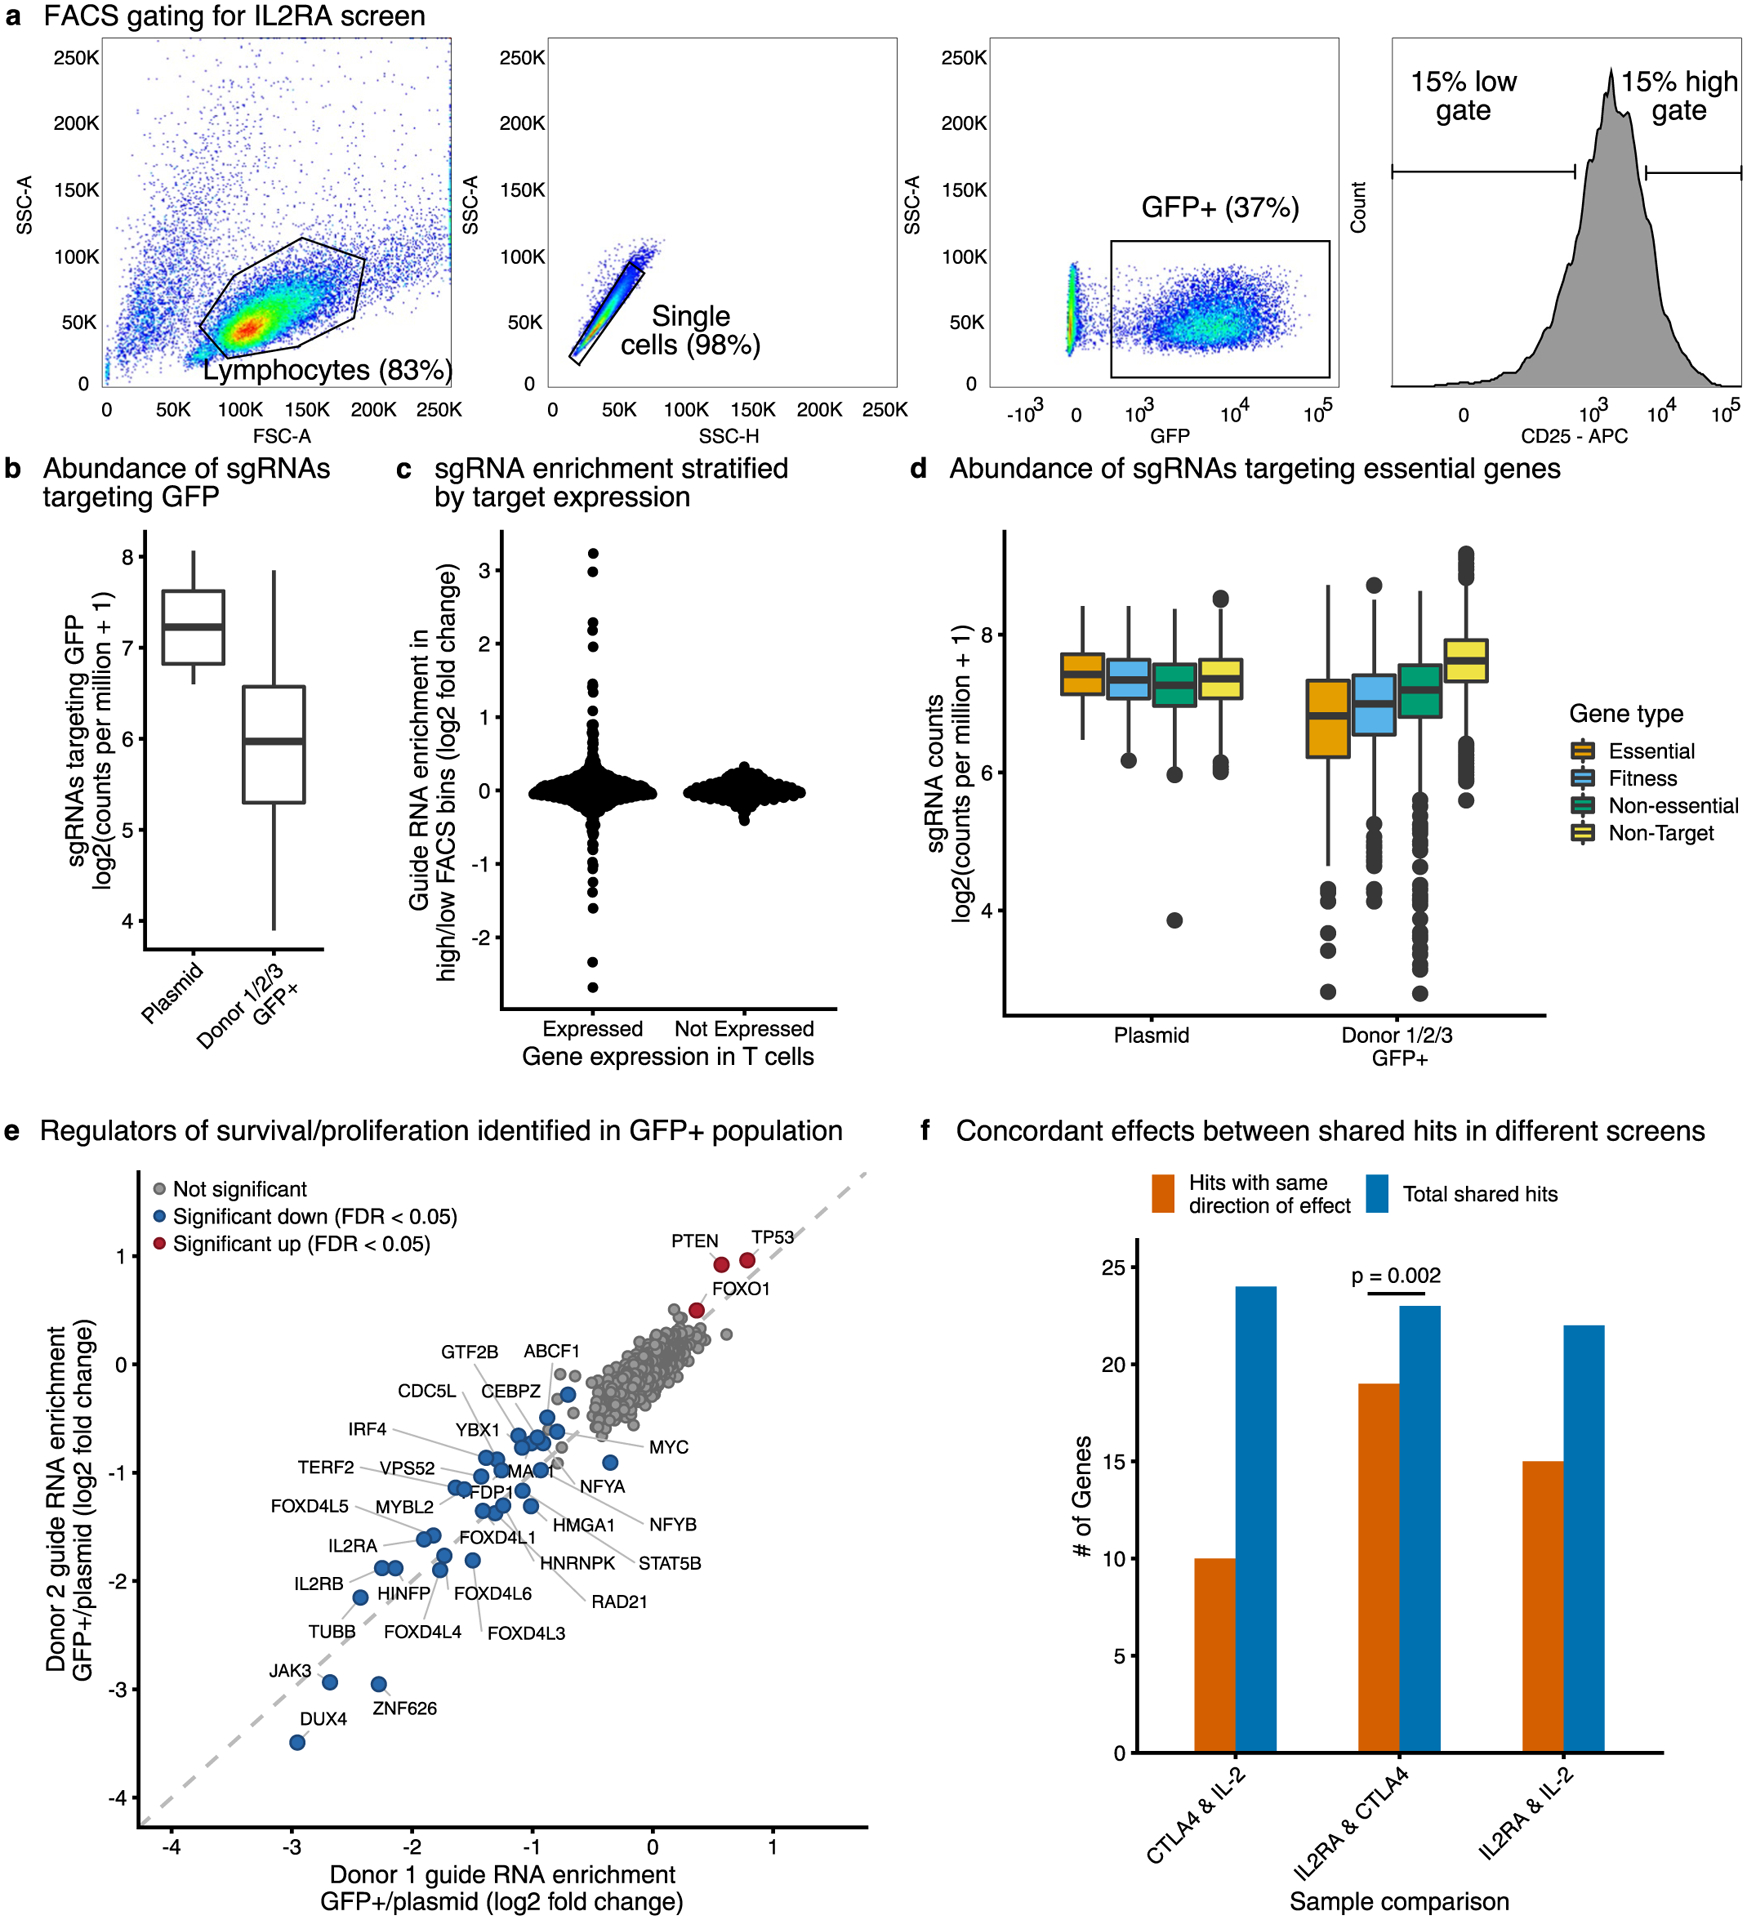
a, Fluorescence activated cell sorting (FACS) gating for IL2RA, IL-2, and CTLA4 screens. Representative example from the IL2RA screen is shown. b, Abundance of sgRNAs targeting GFP in either the starting plasmid or in the GFP+sorted population (n=3 donors, 1 plasmid pool). c, Differential enrichment between the high- and low-expression bins for sgRNAs targeting genes that are either expressed or not expressed in CD4 + T cells based on RNA-Seq. d, Abundance of sgRNAs targeting essential genes, fitness genes, non-essential genes, or non-targeting guides in the starting plasmid (n = 1) or in the GFP + sorted samples (n = 3 donors). e, Enrichment of sgRNAs between the GFP + sorted population and starting plasmid. Results from Donor 1 and Donor 2 are depicted. Significant hits were identified with MAGeCK and genes with an FDR-adjusted P < 0.05 across all donors are highlighted. f, Comparison of the number of shared significant hits between the different screens and whether those hits have the same direction of effect on their targets. Two-sided sign test P = 0.002, shared direction of effect = 82%, 95% confidence interval 61–95%. All boxplots show the median, first and third quartiles, and 1.5x the interquartile range.
Extended Data Fig. 2 |. Arrayed knockouts validate IL-2 and CTLA4 screen results.
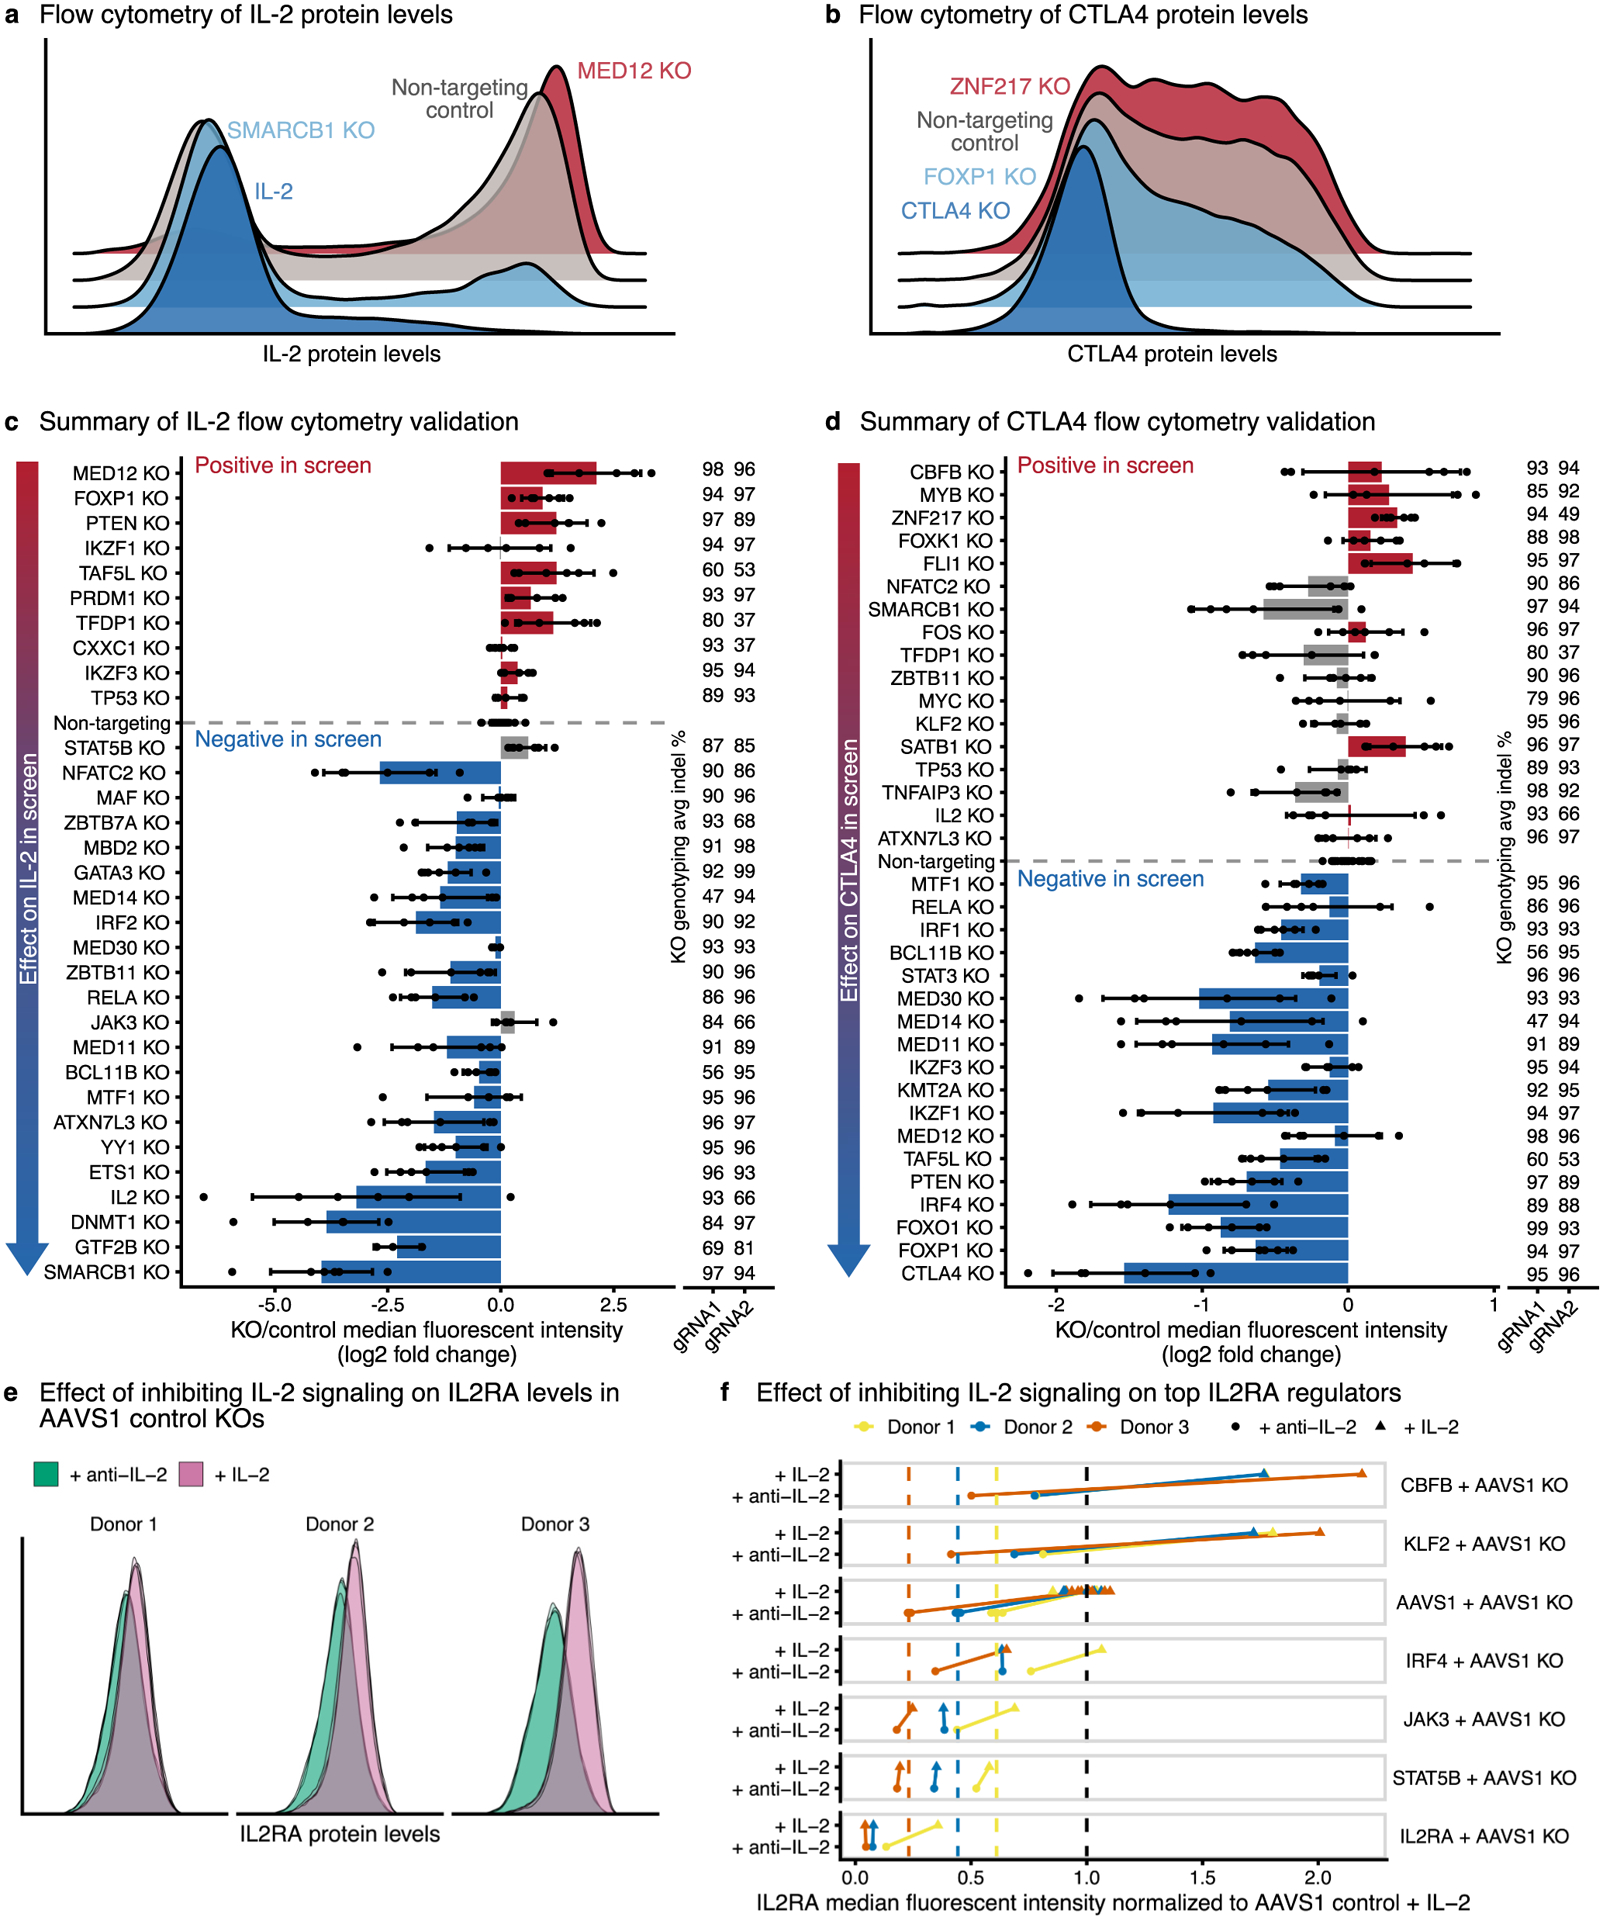
a,b, Representative flow cytometry density plots for IL-2 (a) or CTLA4 (b) protein levels after knockout of top screen hits. Knockout of hits that decrease target levels are shown in blue, and knockout of hits that increase target levels are shown in red. c,d, Summary of changes in IL-2 (c) or CTLA4 (d) levels measured using flow cytometry. Screen hits selected for validation are displayed on the y-axis ordered by their effect size in the pooled CRISPR screen. For each knockout, bars show the average change in IL-2 or CTLA4 median fluorescence intensity relative to non-targeting controls. Dots show individual data points, and error bars show standard deviation across two guide RNAs and three donors per guide RNA. Concordant changes between the screen and validation that increase or decrease IL-2/CTLA4 levels are shown in red or blue, respectively. Discordant changes are shown in grey. The average insertion/deletion (indel) percentage at the genomic target site across multiple donors for guide RNA 1 (n = 3) and guide RNA 2 (n = 2) is shown to the right. e, Representative flow cytometry density plots for IL2RA protein levels after cells are grown with exogenous IL-2 or without IL-2 + blocking anti-IL-2 antibody. f, Knockout of top regulators of IL2RA in cells cultured with exogenous IL-2 or without IL-2 + blocking anti-IL-2 antibody. IL2RA median fluorescent values are normalized to AAVS1 control knockouts with exogenous IL-2 (black dashed line). Colored dashed lines show the normalized IL2RA median fluorescent intensity averaged across the AAVS1 control knockouts without IL-2 + blocking anti-IL-2 antibody in each donor.
Extended Data Fig. 3 |. Downstream mapping of genes and chromatin sites controlled by each IL2RA regulator.
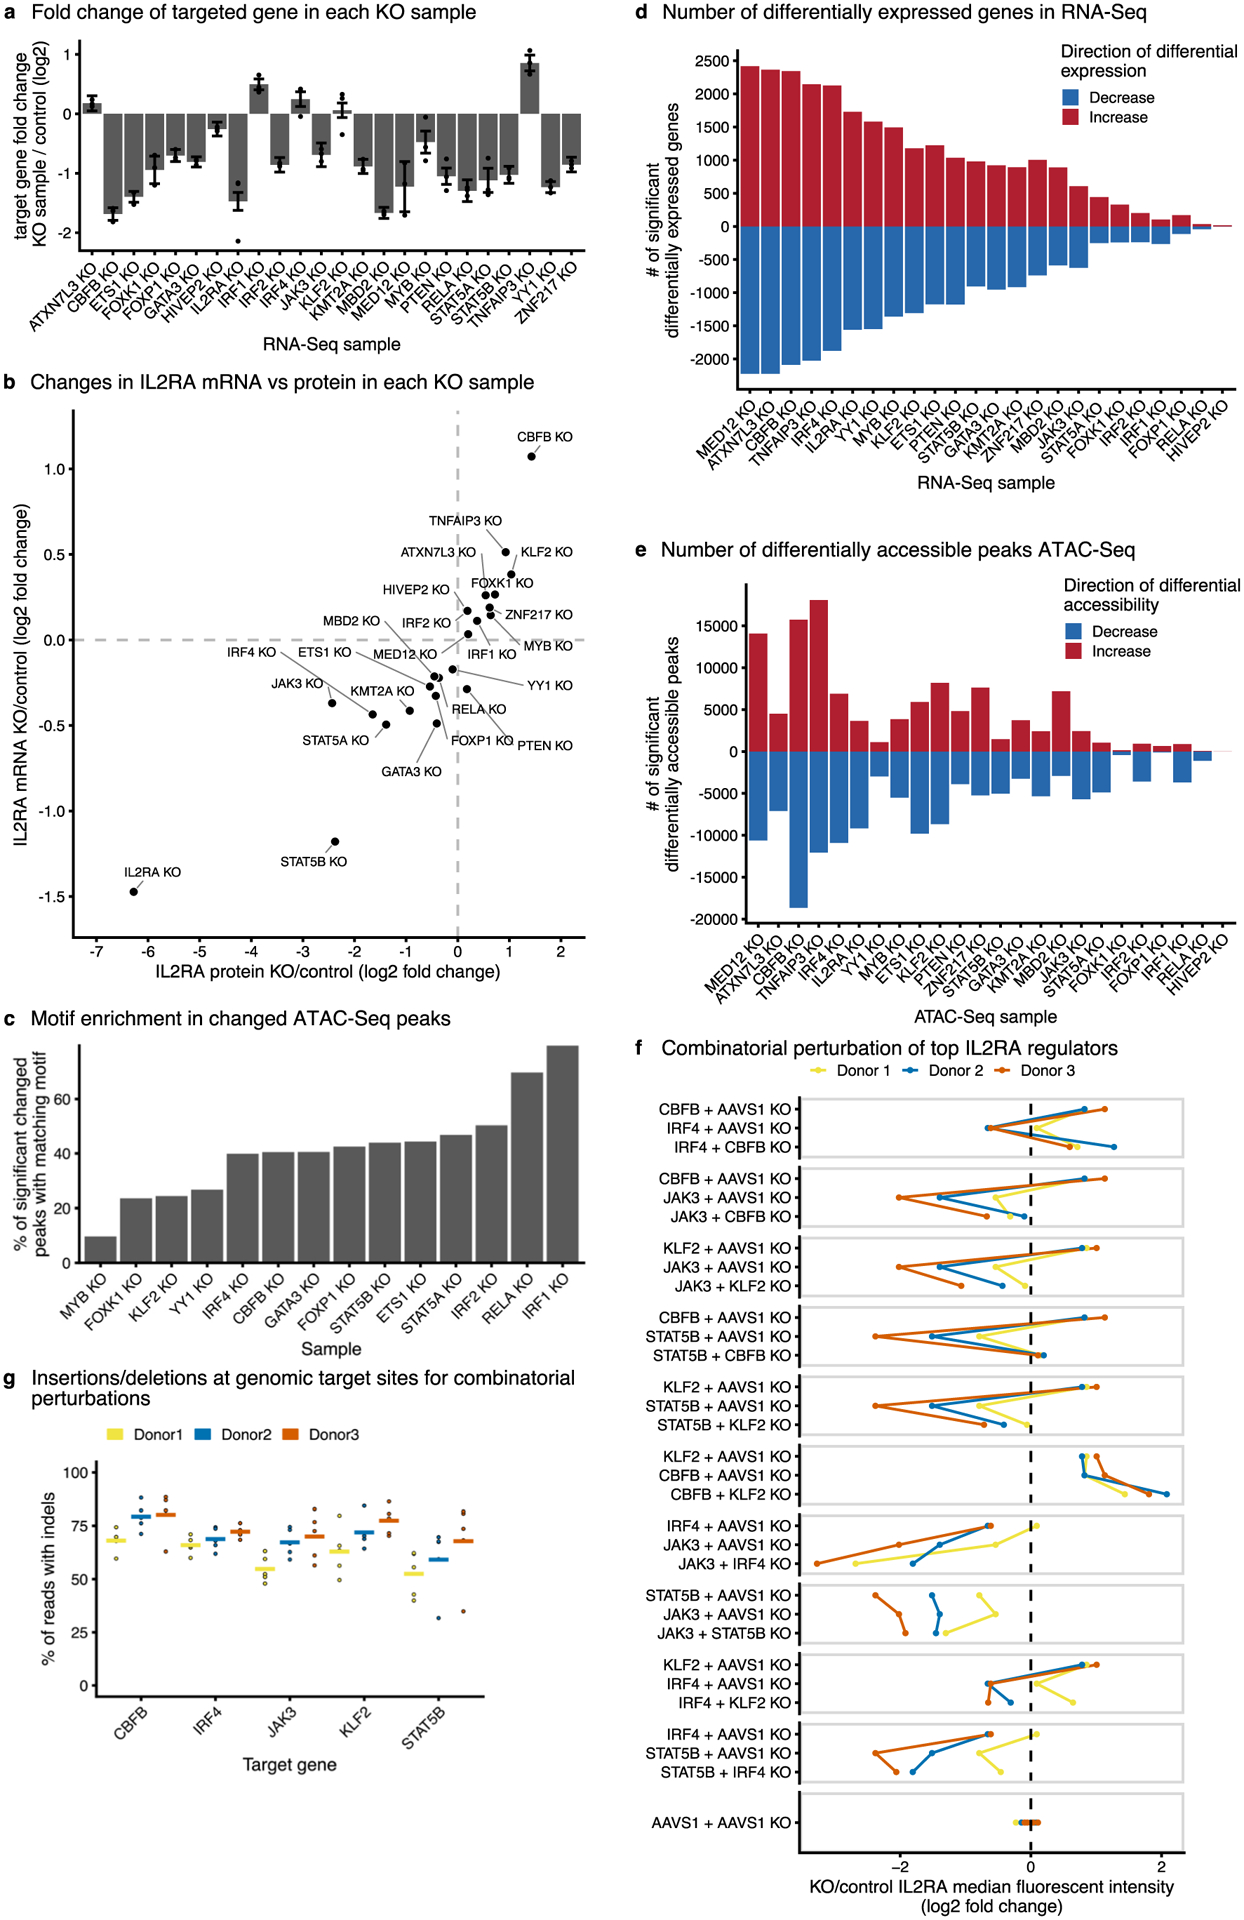
a, mRNA fold change for the CRISPR targeted gene in each knockout sample. Data are presented as the effect size from Limma, with error bars showing the 95% confidence interval. b, Comparison of average changes in IL2RA mRNA levels (RNA-Seq) and protein levels (flow cytometry) for each knockout sample collected for RNA-Seq and ATAC-Seq. c, Percent of significantly changed ATAC-Seq peaks in each knockout sample that contain a known motif for the knocked out transcription factor. d,e, The total number of significantly changed genes (d) or peaks (e) detected via RNA-Seq and ATAC-Seq in each knockout sample. For a-e, n = 3 donors for the RNA-Seq and ATAC-Seq data. f, Summary of changes in IL2RA levels measured using flow cytometry. For each knockout, the change in IL2RA median fluorescence intensity is normalized to AAVS1 knockout alone controls. g, The percent of reads containing insertions/deletions (indels) at the genomic target sites for the guide RNAs and samples in f. Solid line indicates the mean indel percentage across different perturbation combinations.
Extended Data Fig. 4 |. Direct binding of IL2RA regulators at the IL2RA locus.
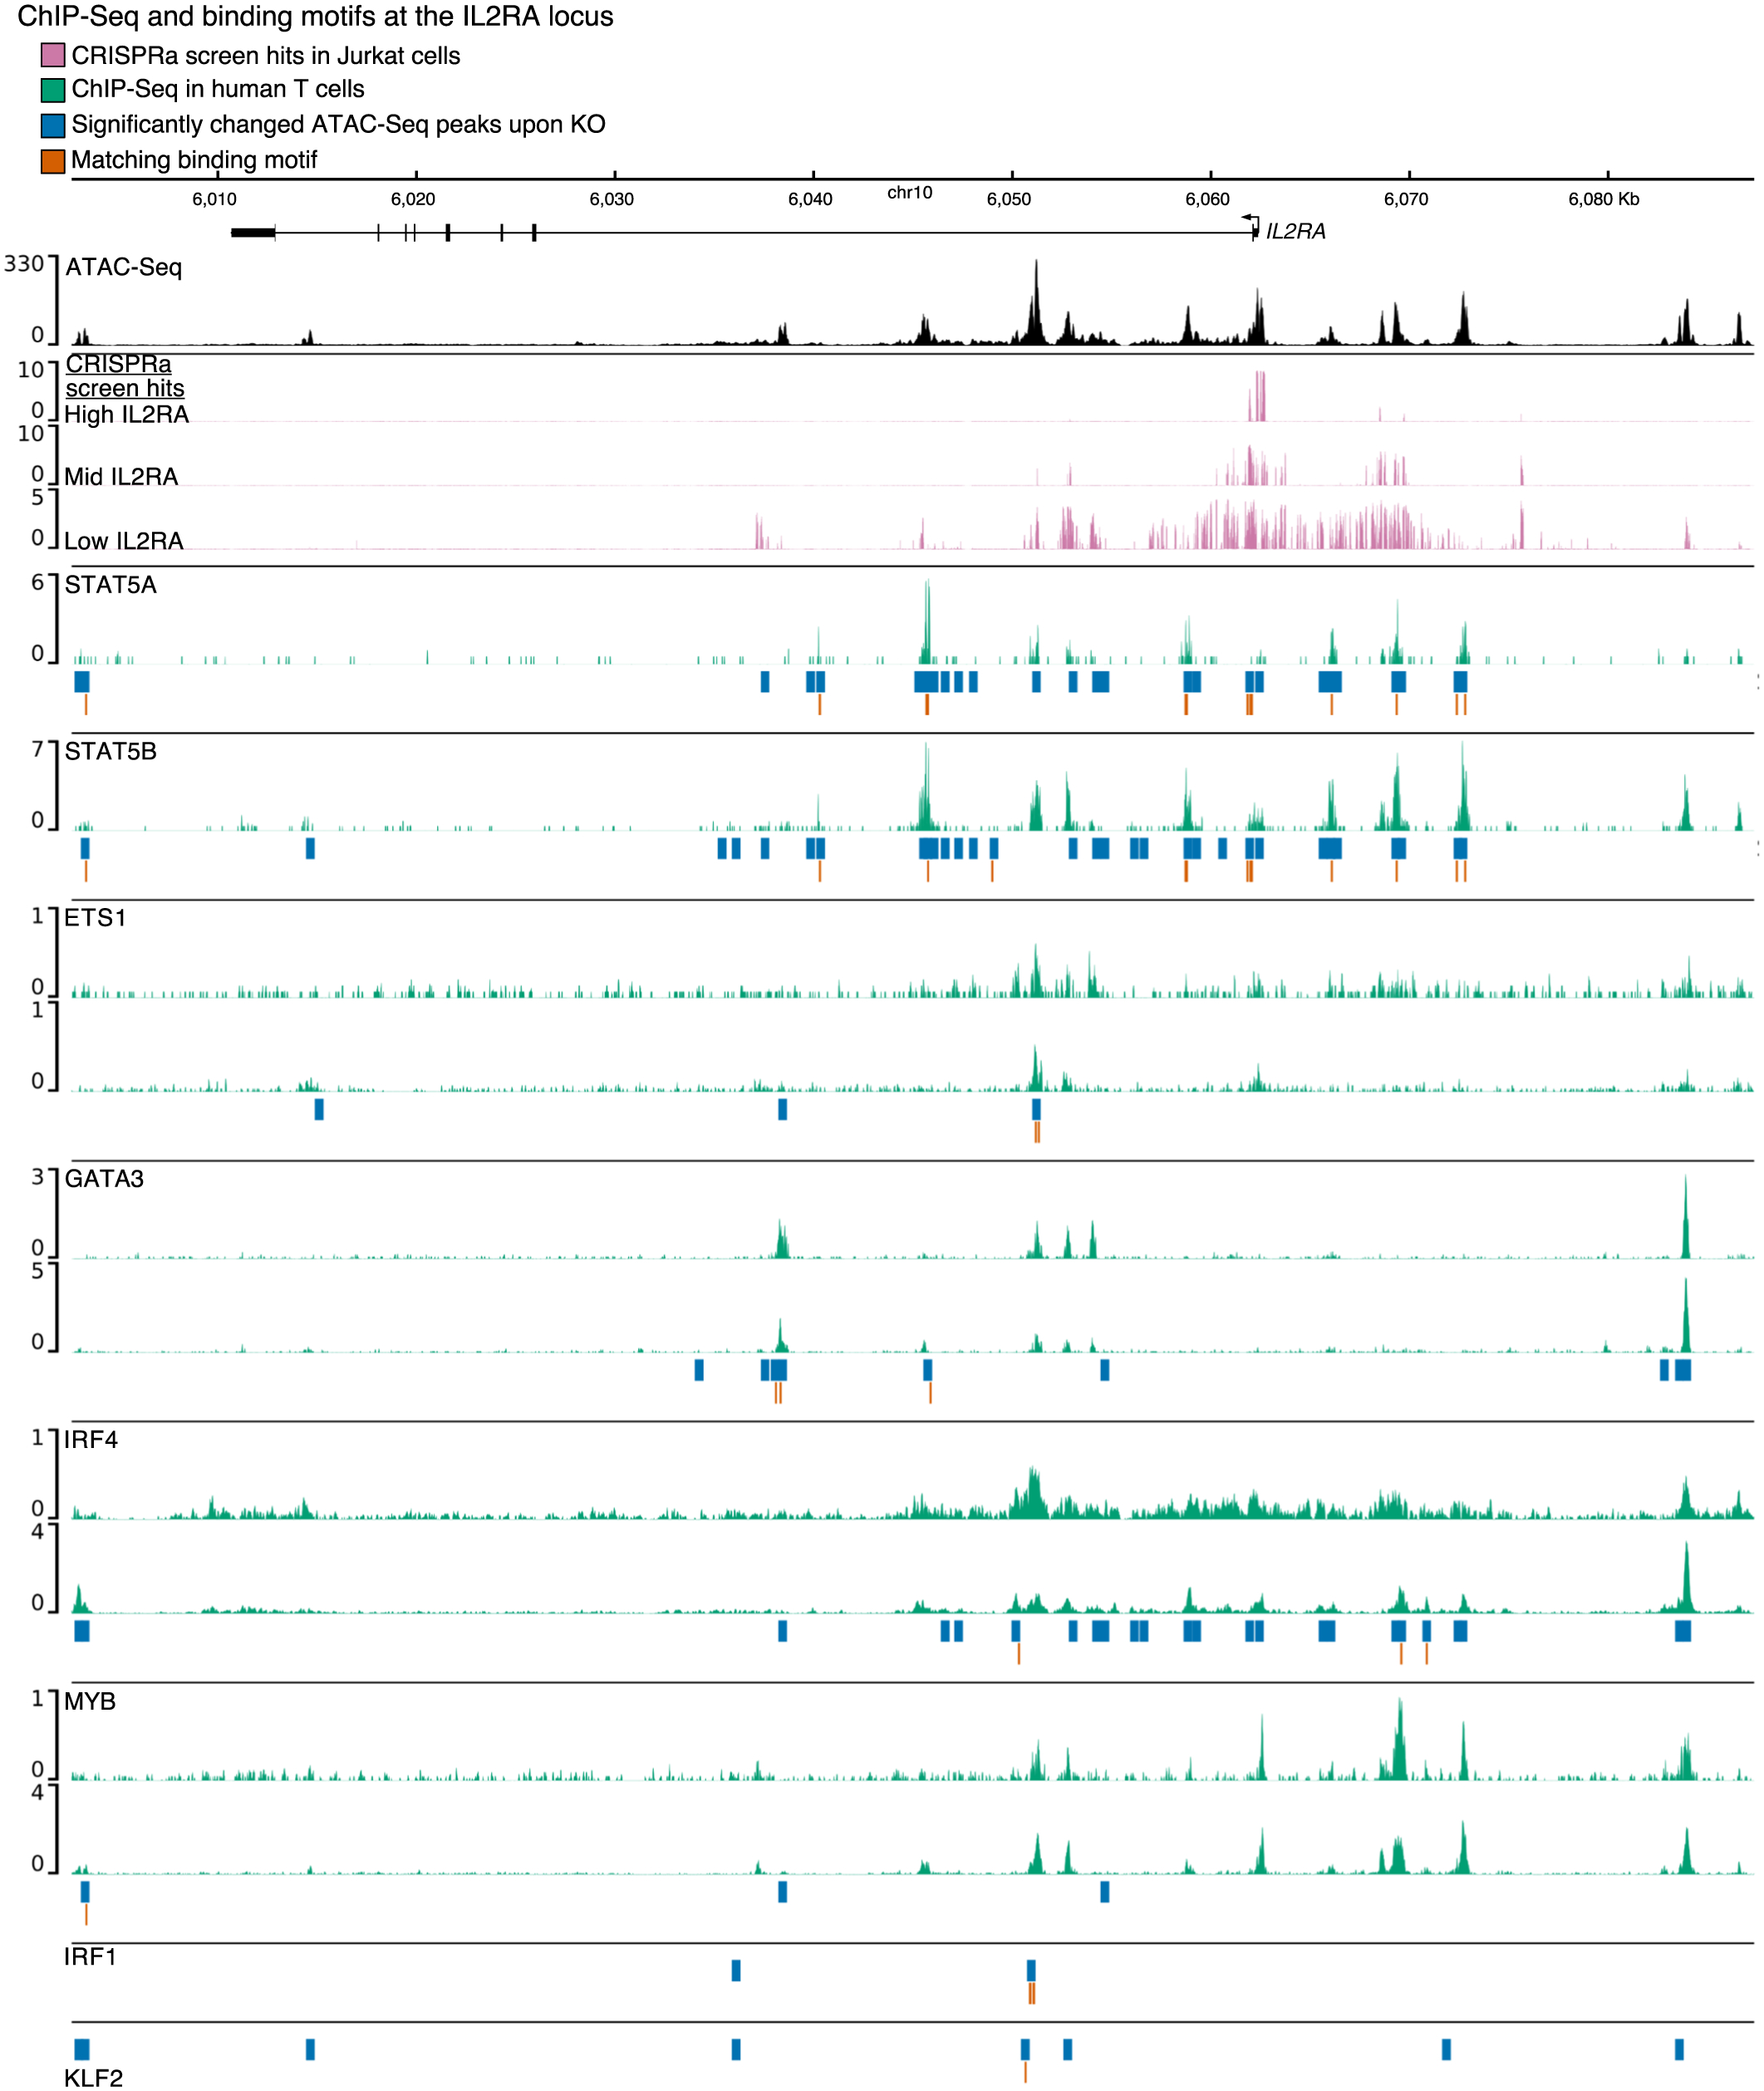
Chromatin accessibility measured by ATAC-Seq in AAVS1 control knockouts is shown in black. ATAC-Seq data are shown as normalized read coverage; samples were normalized using the size factors from DESeq2. Results from previous CRISPR activation (CRISPRa) screen38 tiling the IL2RA locus in Jurkat cells is shown in pink. CRISPRa tracks show the log2 enrichment of guide RNAs in cells expressing high, mid, or low levels of IL2RA compared to background. Public ChIP-Seq data for IL2RA regulators in various subsets of human CD4 + T cells (STAT5A, STAT5B, ETS1, GATA3, MYB) or engineered bulk T cells (IRF4) are shown in green. ChIP-Seq data are shown as background subtracted binding in reads per million. ATAC-Seq peaks that were significantly differentially accessible in each knockout are shown in blue. The location of a matching binding motif in a significantly differentially accessible peak for each transcription factor is shown in orange. Where available, public ChIP-Seq tracks are from either two independent studies or individual donors: ETS148,81, GATA347, IRF482, MYB83, STAT5A and STAT5B84. chr, chromosome.
Extended Data Fig. 5 |. Highly co-regulated gene sets are enriched for immune disease genes.
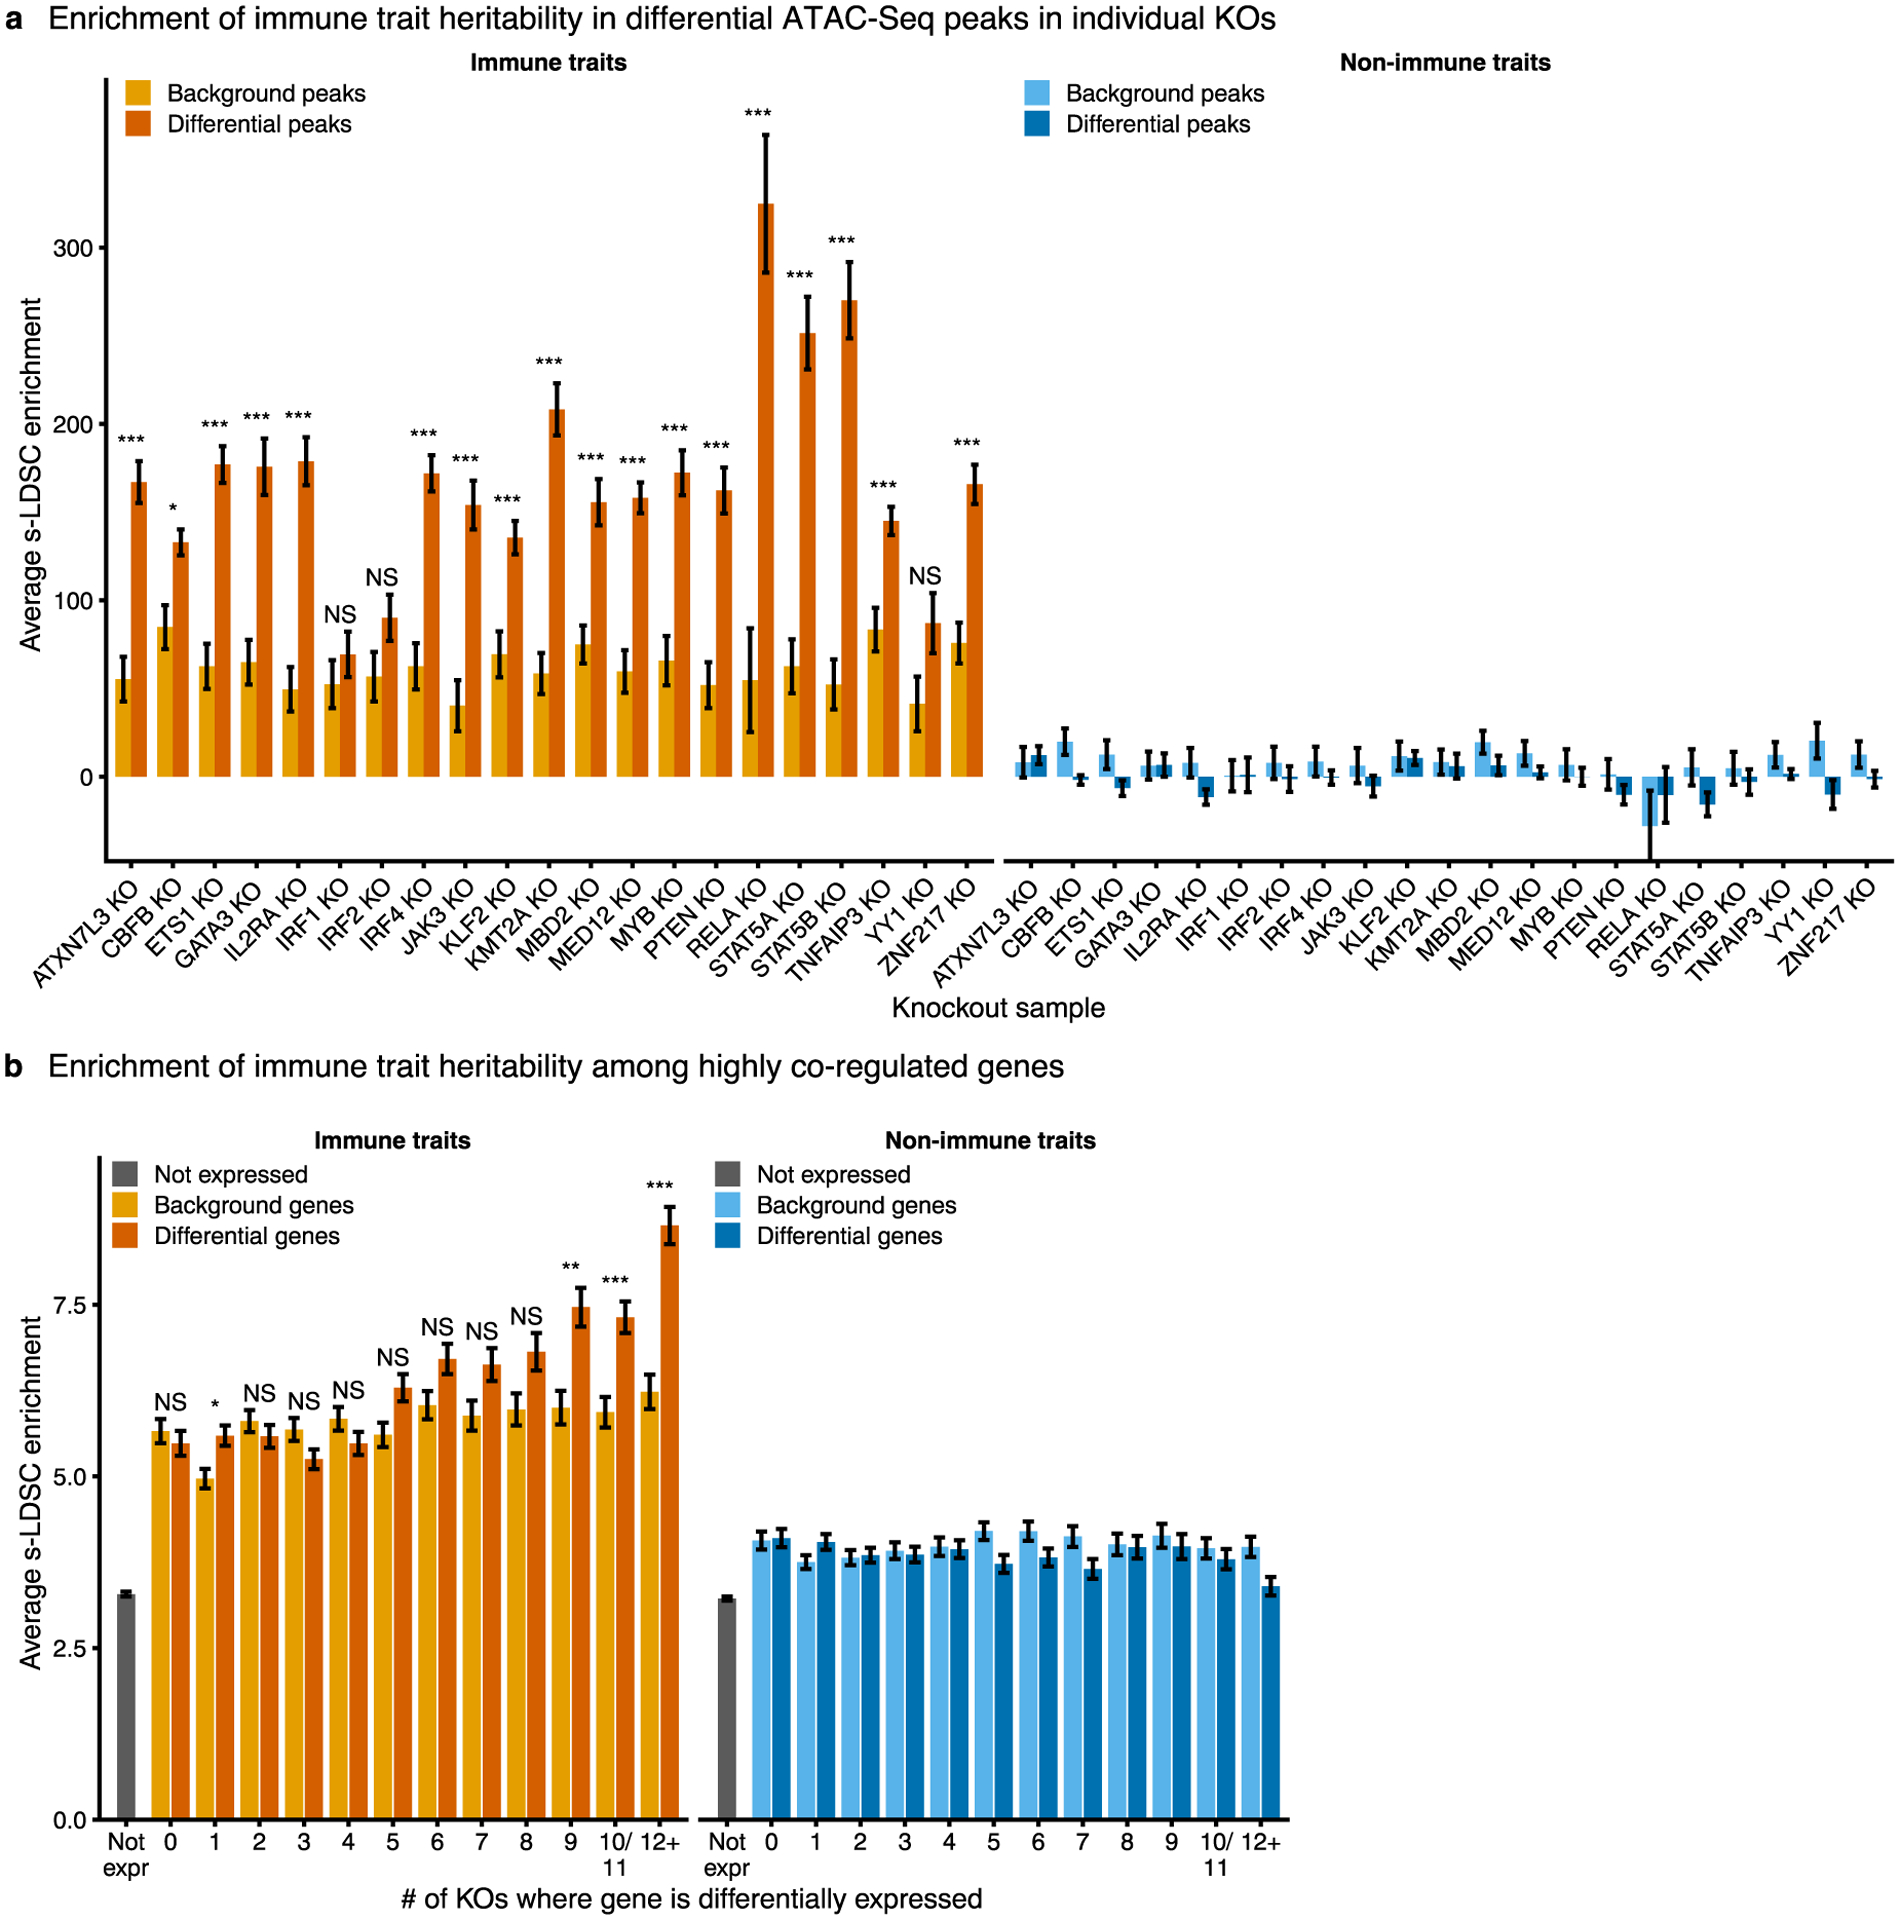
a, Enrichment of heritability for immune traits compared to non-immune traits in significantly differentially accessible ATAC-Seq peaks for each knockout. Only knockouts with at least 1,000 significantly differentially accessible ATAC-Seq peaks are shown. b, Enrichment of heritability for immune traits compared to non-immune traits in a 100-kb window around co-regulated genes. Enrichment for matched background sets for each knockout (a) or each co-regulation bin (b) are shown. Enrichment calculated using stratified LD score regression. Traits were meta-analyzed using inverse-variance weighting; average enrichment and standard error shown. P-values were calculated by first converting the difference in average enrichments to Z-scores, and then converting Z-scores to two-sided P-values (see Methods). For a, Bonferroni-corrected P-values range from 1.8 × 10⁻² to 7.5 × 10⁻¹⁶. For b, Bonferroni corrected P-values range from 2.7 × 10⁻² to 6.6 × 10⁻¹⁰. NS, not significant. n = 16 immune traits and n = 15 non-immune traits for a and b.
Extended Data Fig. 6 |. Multiple sclerosis SNPs within CD4 + T cell ATAC-Seq peaks.
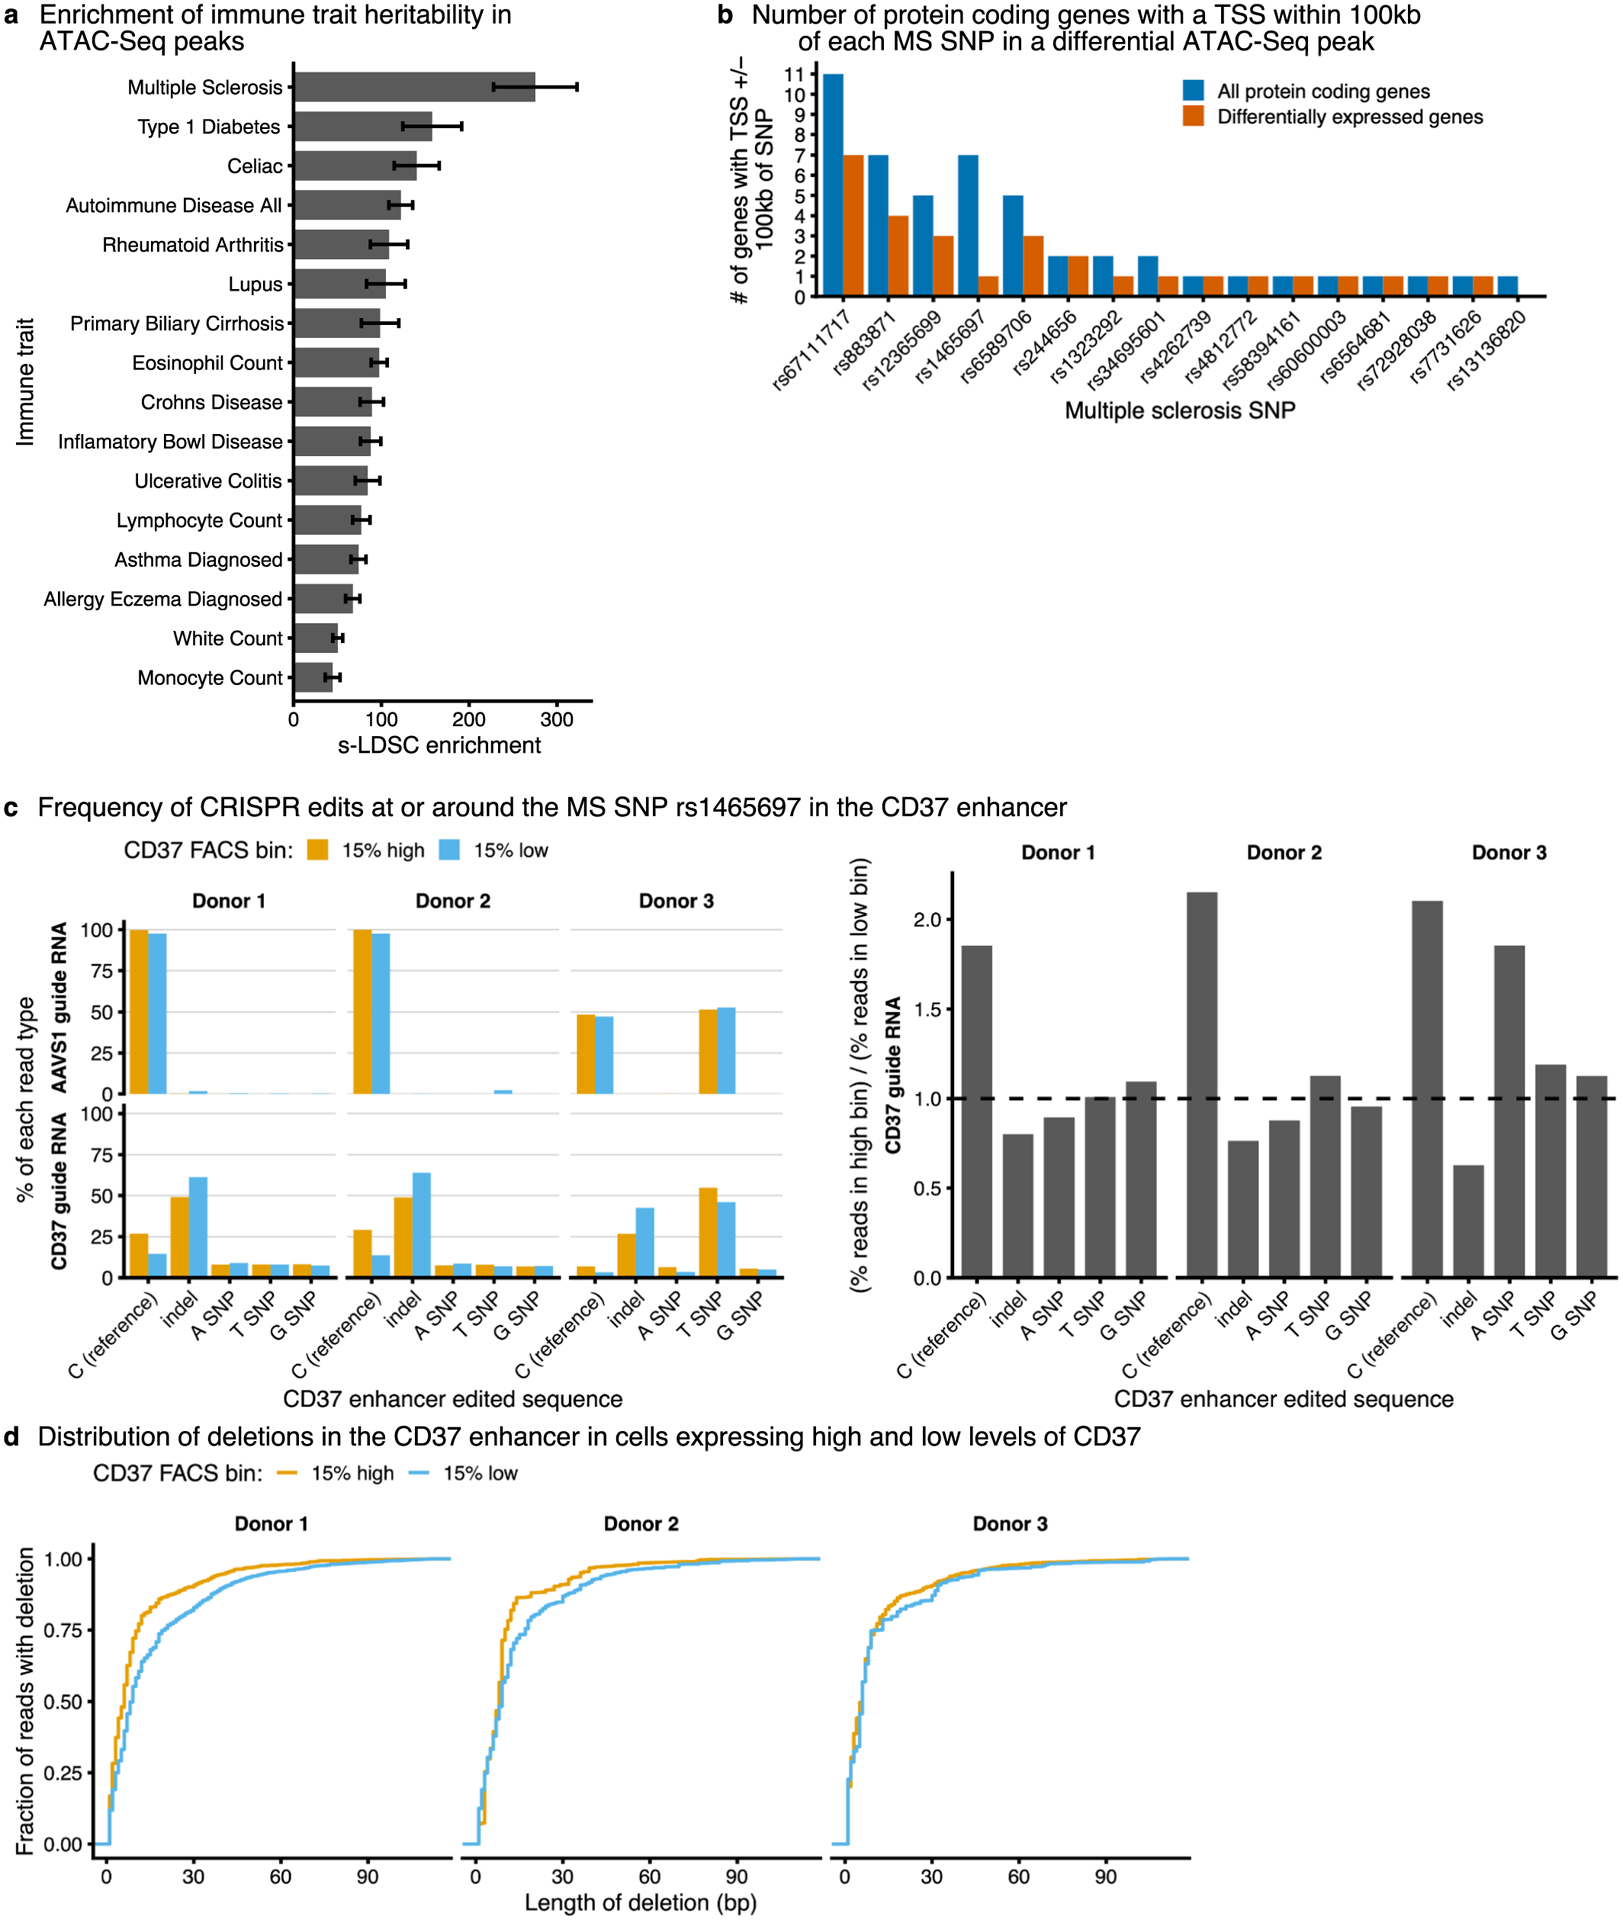
a, Enrichment of heritability in accessible ATAC-Seq peaks for different immune traits. Data are presented as estimated enrichment +/− standard error estimated from stratified LD score regression. b, The number of all protein-coding genes and differentially expressed protein-coding genes with a TSS within 100 kb of a multiple sclerosis SNP. Only high confidence multiple sclerosis SNPs (PICS probability greater than 50%) within differentially accessible ATAC-Seq peaks are shown. c, Editing outcomes in CD37 low and high-expressing cells after using CRISPR/Cas9 and homology-directed repair templates to edit the SNP rs1465697. Editing was performed with guide RNAs targeting the CD37 CRE (CD37 guide RNA) or a control region (AAVS1 guide RNA). d, Length of deletions after CRISPR editing in CD37 low- and high-expressing cells.
Supplementary Material
Acknowledgements
We thank members of the Marson and Pritchard laboratories for helpful discussions and manuscript feedback. We thank H. Pimentel for advice on analysis. This research was supported by National Institutes of Health (NIH) grants R01HG008140 (J.K.P.) and RM1-HG007735 (W.J.G.). A.M. held a Career Award for Medical Scientists from the Burroughs Wellcome Fund, is a member of the Parker Institute for Cancer Immunotherapy (PICI), was an investigator at the Chan Zuckerberg Biohub and has received funding from the Innovative Genomics Institute (IGI), the American Endowment Foundation, the Cancer Research Institute (CRI) Lloyd J. Old STAR award, a gift from the Jordan Family, a gift from the Byers family and a gift from B. Bakar. O.S. was supported by the NIH grant T32AI125222. S.N. was supported by a Helen Hay Whitney Fellowship. N.S.-A. was supported by a Stanford Graduate Fellowship and CEHG Fellowship. A.F.C. was supported by an NIH F32 postdoctoral fellowship (5F32GM135996-02). Sorting was carried out at the UCSF Flow Cytometry Core (RRID:SCR_018206) supported in part by NIH grant P30 DK063720 and by the NIH S10 instrumentation grant S10 1S10OD021822-01 and the Gladstone Flow Cytometry Core supported by the James B. Pendleton Charitable Trust. RNA-seq was carried out at the DNA Technologies and Expression Analysis Cores at the UC Davis Genome Center, supported by NIH Shared Instrumentation Grant 1S10OD010786-01. Other sequencing was carried out at the UCSF CAT, supported by a PBBR grant. Some of the computing for this project was performed on the Sherlock cluster. We thank Stanford University and the Stanford Research Computing Center for providing computational resources and support that contributed to these research results.
Footnotes
Online content
Any methods, additional references, Nature Research reporting summaries, source data, extended data, supplementary information, acknowledgements, peer review information; details of author contributions and competing interests; and statements of data and code availability are available at https://doi.org/10.1038/s41588-022-01106-y.
Code availability
The code for this paper is available at https://doi.org/10.5281/zenodo.637164689.
Competing interests
A.M. is a compensated cofounder, member of the boards of directors and a member of the scientific advisory boards of Spotlight Therapeutics and Arsenal Biosciences. A.M. is a cofounder, member of the boards of directors and a member of the scientific advisory board of Survey Genomics. A.M. is a compensated member of the scientific advisory board of NewLimit. A.M. owns stock in Arsenal Biosciences, Spotlight Therapeutics, NewLimit, Survey Genomics, PACT Pharma and Merck. A.M. has received fees from 23andMe, PACT Pharma, Juno Therapeutics, Trizell, Vertex, Merck, Amgen, Genentech, AlphaSights, Rupert Case Management, Bernstein and ALDA. A.M. is an investor in and informal advisor to Offline Ventures and a client of EPIQ. The Marson laboratory has received research support from Juno Therapeutics, Epinomics, Sanofi, GlaxoSmithKline, Gilead and Anthem. W.J.G. is a consultant for 10x Genomics, which has licensed IP associated with ATAC-seq. W.J.G. has additional affiliations with Guardant Health (consultant) and Protillion Biosciences (cofounder and consultant). J.W.F. is a consultant for NewLimit. J.W.F., O.S., J.K.P. and A.M. are listed as inventors on a patent application related to this work. The remaining authors declare no competing interests.
Extended data is available for this paper at https://doi.org/10.1038/s41588-022-01106-y.
Supplementary information The online version contains supplementary material available at https://doi.org/10.1038/s41588-022-01106-y.
References
- 1.Buniello A et al. The NHGRI-EBI GWAS Catalog of published genome-wide association studies, targeted arrays and summary statistics 2019. Nucleic Acids Res. 47, D1005–D1012 (2019). [DOI] [PMC free article] [PubMed] [Google Scholar]
- 2.Gallagher MD & Chen-Plotkin AS The post-GWAS era: from association to function. Am. J. Hum. Genet 102, 717–730 (2018). [DOI] [PMC free article] [PubMed] [Google Scholar]
- 3.Liu X, Li YI & Pritchard JK Trans effects on gene expression can drive omnigenic inheritance. Cell 177, 1022–1034.e6 (2019). [DOI] [PMC free article] [PubMed] [Google Scholar]
- 4.Westra H-J et al. Systematic identification of trans eQTLs as putative drivers of known disease associations. Nat. Genet 45, 1238–1243 (2013). [DOI] [PMC free article] [PubMed] [Google Scholar]
- 5.Võsa U et al. Large-scale cis- and trans-eQTL analyses identify thousands of genetic loci and polygenic scores that regulate blood gene expression.Nat. Genet 53, 1300–1310 (2021). [DOI] [PMC free article] [PubMed] [Google Scholar]
- 6.Claussnitzer M et al. FTO obesity variant circuitry and adipocyte browning in humans. N. Engl. J. Med 373, 895–907 (2015). [DOI] [PMC free article] [PubMed] [Google Scholar]
- 7.Smemo S et al. Obesity-associated variants within FTO form long-range functional connections with IRX3. Nature 507, 371–375 (2014). [DOI] [PMC free article] [PubMed] [Google Scholar]
- 8.Small KS et al. Regulatory variants at KLF14 influence type 2 diabetes risk via a female-specific effect on adipocyte size and body composition. Nat. Genet 50, 572–580 (2018). [DOI] [PMC free article] [PubMed] [Google Scholar]
- 9.The GTEx Consortium. The GTEx Consortium atlas of genetic regulatory effects across human tissues. Science 369, 1318–1330 (2020). [DOI] [PMC free article] [PubMed] [Google Scholar]
- 10.Califano A, Butte AJ, Friend S, Ideker T & Schadt E Leveraging models of cell regulation and GWAS data in integrative network-based association studies. Nat. Genet 44, 841–847 (2012). [DOI] [PMC free article] [PubMed] [Google Scholar]
- 11.Schumann K et al. Generation of knock-in primary human T cells using Cas9 ribonucleoproteins. Proc. Natl Acad. Sci. USA 112, 10437–10442 (2015). [DOI] [PMC free article] [PubMed] [Google Scholar]
- 12.Shifrut E et al. Genome-wide CRISPR screens in primary human T cells reveal key regulators of immune function. Cell 175, 1958–1971.e15 (2018). [DOI] [PMC free article] [PubMed] [Google Scholar]
- 13.Farh KK-H et al. Genetic and epigenetic fine mapping of causal autoimmune disease variants. Nature 518, 337–343 (2015). [DOI] [PMC free article] [PubMed] [Google Scholar]
- 14.Finucane HK et al. Heritability enrichment of specifically expressed genes identifies disease-relevant tissues and cell types. Nat. Genet 50, 621–629 (2018). [DOI] [PMC free article] [PubMed] [Google Scholar]
- 15.Soskic B et al. Chromatin activity at GWAS loci identifies T cell states driving complex immune diseases. Nat. Genet 51, 1486–1493 (2019). [DOI] [PMC free article] [PubMed] [Google Scholar]
- 16.Calderon D et al. Landscape of stimulation-responsive chromatin across diverse human immune cells. Nat. Genet 51, 1494–1505 (2019). [DOI] [PMC free article] [PubMed] [Google Scholar]
- 17.Adamson B et al. A multiplexed single-cell CRISPR screening platform enables systematic dissection of the unfolded protein response. Cell 167, 1867–1882.e21 (2016). [DOI] [PMC free article] [PubMed] [Google Scholar]
- 18.Dixit A et al. Perturb-seq: dissecting molecular circuits with scalable single- cell RNA profiling of pooled genetic screens. Cell 167, 1853–1866.e17 (2016). [DOI] [PMC free article] [PubMed] [Google Scholar]
- 19.Datlinger P et al. Pooled CRISPR screening with single-cell transcriptome readout. Nat. Methods 14, 297–301 (2017). [DOI] [PMC free article] [PubMed] [Google Scholar]
- 20.Jaitin DA et al. Dissecting immune circuits by linking CRISPR-pooled screens with single-cell RNA-seq. Cell 167, 1883–1896.e15 (2016). [DOI] [PubMed] [Google Scholar]
- 21.Schumann K et al. Functional CRISPR dissection of gene networks controlling human regulatory T cell identity. Nat. Immunol 21, 1456–1466 (2020). [DOI] [PMC free article] [PubMed] [Google Scholar]
- 22.Abbas AK, Trotta E, Simeonov RD, Marson A & Bluestone JA Revisiting IL-2: biology and therapeutic prospects. Sci. Immunol 3, eaat1482 (2018). [DOI] [PubMed] [Google Scholar]
- 23.Spolski R, Li P & Leonard WJ Biology and regulation of IL-2: from molecular mechanisms to human therapy. Nat. Rev. Immunol 18, 648–659 (2018). [DOI] [PubMed] [Google Scholar]
- 24.Bayry J CTLA-4: a key protein in autoimmunity. Nat. Rev. Rheumatol 5, 244–245 (2009). [DOI] [PubMed] [Google Scholar]
- 25.Caudy AA, Reddy ST, Chatila T, Atkinson JP & Verbsky JW CD25 deficiency causes an immune dysregulation, polyendocrinopathy, enteropathy, X-linked-like syndrome, and defective IL-10 expression from CD4 lymphocytes. J. Allergy Clin. Immunol 119, 482–487 (2007). [DOI] [PubMed] [Google Scholar]
- 26.Linker-Israeli M et al. Defective production of interleukin 1 and interleukin 2 in patients with systemic lupus erythematosus (SLE). J. Immunol 130, 2651–2655 (1983). [PubMed] [Google Scholar]
- 27.Schubert D et al. Autosomal dominant immune dysregulation syndrome in humans with CTLA4 mutations. Nat. Med 20, 1410–1416 (2014). [DOI] [PMC free article] [PubMed] [Google Scholar]
- 28.Sharfe N, Dadi HK, Shahar M & Roifman CM Human immune disorder arising from mutation of the chain of the interleukin-2 receptor. Proc. Natl Acad. Sci. USA 94, 3168–3171 (1997). [DOI] [PMC free article] [PubMed] [Google Scholar]
- 29.Goudy K et al. Human IL2RA null mutation mediates immunodeficiency with lymphoproliferation and autoimmunity. Clin. Immunol 146, 248–261 (2013). [DOI] [PMC free article] [PubMed] [Google Scholar]
- 30.Bezrodnik L, Caldirola MS, Seminario AG, Moreira I & Gaillard MI Follicular bronchiolitis as phenotype associated with CD25 deficiency. Clin. Exp. Immunol 175, 227–234 (2014). [DOI] [PMC free article] [PubMed] [Google Scholar]
- 31.Kuehn HS et al. Immune dysregulation in human subjects with heterozygous germline mutations in CTLA4. Science 345, 1623–1627 (2014). [DOI] [PMC free article] [PubMed] [Google Scholar]
- 32.Ochoa D et al. Open Targets Platform: supporting systematic drug–target identification and prioritisation. Nucleic Acids Res. 49, D1302–D1310 (2021). [DOI] [PMC free article] [PubMed] [Google Scholar]
- 33.Bousfiha A et al. Human inborn errors of immunity: 2019 update of the IUIS phenotypical classification. J. Clin. Immunol 40, 66–81 (2020). [DOI] [PMC free article] [PubMed] [Google Scholar]
- 34.Lambert SA et al. The human transcription factors. Cell 175, 598–599 (2018). [DOI] [PubMed] [Google Scholar]
- 35.Cortez JT et al. CRISPR screen in regulatory T cells reveals modulators of Foxp3. Nature 582, 416–420 (2020). [DOI] [PMC free article] [PubMed] [Google Scholar]
- 36.Li P et al. STAT5-mediated chromatin interactions in superenhancers activate IL-2 highly inducible genes: functional dissection of the gene locus. Proc. Natl Acad. Sci. USA 114, 12111–12119 (2017). [DOI] [PMC free article] [PubMed] [Google Scholar]
- 37.Liao W, Lin J-X & Leonard WJ Interleukin-2 at the crossroads of effector responses, tolerance, and immunotherapy. Immunity 38, 13–25 (2013). [DOI] [PMC free article] [PubMed] [Google Scholar]
- 38.Simeonov DR et al. Discovery of stimulation-responsive immune enhancers with CRISPR activation. Nature 549, 111–115 (2017). [DOI] [PMC free article] [PubMed] [Google Scholar]
- 39.Kemmeren P et al. Large-scale genetic perturbations reveal regulatory networks and an abundance of gene-specific repressors. Cell 157, 740–752 (2014). [DOI] [PubMed] [Google Scholar]
- 40.Hughes TR & de Boer CG Mapping yeast transcriptional networks. Genetics 195, 9–36 (2013). [DOI] [PMC free article] [PubMed] [Google Scholar]
- 41.Alon U Network motifs: theory and experimental approaches. Nat. Rev. Genet 8, 450–461 (2007). [DOI] [PubMed] [Google Scholar]
- 42.Langfelder P & Horvath S WGCNA: an R package for weighted correlation network analysis. BMC Bioinf. 9, 559 (2008). [DOI] [PMC free article] [PubMed] [Google Scholar]
- 43.Aibar S et al. SCENIC: single-cell regulatory network inference and clustering. Nat. Methods 14, 1083–1086 (2017). [DOI] [PMC free article] [PubMed] [Google Scholar]
- 44.Fiers MWEJ et al. Mapping gene regulatory networks from single-cell omics data. Brief. Funct. Genomics 17, 246–254 (2018). [DOI] [PMC free article] [PubMed] [Google Scholar]
- 45.van Dam S, Võsa U, van der Graaf A, Franke L & de Magalhães JP Gene co-expression analysis for functional classification and gene-disease predictions. Brief. Bioinform 19, 575–592 (2018). [DOI] [PMC free article] [PubMed] [Google Scholar]
- 46.Margolin AA et al. ARACNE: an algorithm for the reconstruction of gene regulatory networks in a mammalian cellular context. BMC Bioinf. 7, S7 (2006). [DOI] [PMC free article] [PubMed] [Google Scholar]
- 47.Kanhere A et al. T-bet and GATA3 orchestrate Th1 and Th2 differentiation through lineage-specific targeting of distal regulatory elements. Nat. Commun 3, 1268 (2012). [DOI] [PMC free article] [PubMed] [Google Scholar]
- 48.Schmidl C et al. The enhancer and promoter landscape of human regulatory and conventional T-cell subpopulations. Blood 123, e68–e78 (2014). [DOI] [PubMed] [Google Scholar]
- 49.Tangye SG et al. The ever-increasing array of novel inborn errors of immunity: an interim update by the IUIS Committee. J. Clin. Immunol 41, 666–679 (2021). [DOI] [PMC free article] [PubMed] [Google Scholar]
- 50.Tangye SG et al. Human inborn errors of immunity: 2019 update on the classification from the International Union of Immunological Societies Expert Committee. J. Clin. Immunol 40, 24–64 (2020). [DOI] [PMC free article] [PubMed] [Google Scholar]
- 51.Taylor KE, Ansel KM, Marson A, Criswell LA & Farh KK-H PICS2: next-generation fine mapping via probabilistic identification of causal SNPs. Bioinformatics 37, 3004–3007 (2021). [DOI] [PMC free article] [PubMed] [Google Scholar]
- 52.Boyle EA, Li YI & Pritchard JK An expanded view of complex traits: from polygenic to omnigenic. Cell 169, 1177–1186 (2017). [DOI] [PMC free article] [PubMed] [Google Scholar]
- 53.Finucane HK et al. Partitioning heritability by functional annotation using genome-wide association summary statistics. Nat. Genet 47, 1228–1235 (2015). [DOI] [PMC free article] [PubMed] [Google Scholar]
- 54.Maurano MT et al. Systematic localization of common disease-associated variation in regulatory DNA. Science 337, 1190–1195 (2012). [DOI] [PMC free article] [PubMed] [Google Scholar]
- 55.International Multiple Sclerosis Genetics Consortium. Multiple sclerosis genomic map implicates peripheral immune cells and microglia in susceptibility. Science 365, eaav7188 (2019). [DOI] [PMC free article] [PubMed] [Google Scholar]
- 56.Parnas O et al. A genome-wide CRISPR screen in primary immune cells to dissect regulatory networks. Cell 162, 675–686 (2015). [DOI] [PMC free article] [PubMed] [Google Scholar]
- 57.Henriksson J et al. Genome-wide CRISPR screens in T helper cells reveal pervasive crosstalk between activation and differentiation. Cell 176, 882–896. e18 (2019). [DOI] [PMC free article] [PubMed] [Google Scholar]
- 58.Brockmann M et al. Genetic wiring maps of single-cell protein states reveal an off-switch for GPCR signalling. Nature 546, 307–311 (2017). [DOI] [PubMed] [Google Scholar]
- 59.Amit I et al. Unbiased reconstruction of a mammalian transcriptional network mediating pathogen responses. Science 326, 257–263 (2009). [DOI] [PMC free article] [PubMed] [Google Scholar]
- 60.Cusanovich DA, Pavlovic B, Pritchard JK & Gilad Y The functional consequences of variation in transcription factor binding. PLoS Genet. 10, e1004226 (2014). [DOI] [PMC free article] [PubMed] [Google Scholar]
- 61.Rubin AJ et al. Coupled single-cell CRISPR screening and epigenomic profiling reveals causal gene regulatory networks. Cell 176, 361–376.e17 (2019). [DOI] [PMC free article] [PubMed] [Google Scholar]
- 62.Qiu X et al. Inferring causal gene regulatory networks from coupled single- cell expression dynamics using Scribe. Cell Syst. 10, 265–274.e11 (2020). [DOI] [PMC free article] [PubMed] [Google Scholar]
- 63.Vaquerizas JM, Kummerfeld SK, Teichmann SA & Luscombe NM A census of human transcription factors: function, expression and evolution. Nat. Rev. Genet 10, 252–263 (2009). [DOI] [PubMed] [Google Scholar]
- 64.Mullard A Restoring IL-2 to its cancer immunotherapy glory. Nat. Rev. Drug Discov 20, 163–165 (2021). [DOI] [PubMed] [Google Scholar]
- 65.Rowshanravan B, Halliday N & Sansom DM CTLA-4: a moving target in immunotherapy. Blood 131, 58–67 (2018). [DOI] [PMC free article] [PubMed] [Google Scholar]
- 66.Ting PY et al. Guide Swap enables genome-scale pooled CRISPR-Cas9 screening in human primary cells. Nat. Methods 15, 941–946 (2018). [DOI] [PubMed] [Google Scholar]
- 67.Li W et al. MAGeCK enables robust identification of essential genes from genome-scale CRISPR/Cas9 knockout screens. Genome Biol. 15, 554 (2014). [DOI] [PMC free article] [PubMed] [Google Scholar]
- 68.Hart T & Moffat J BAGEL: a computational framework for identifying essential genes from pooled library screens. BMC Bioinf. 17, 164 (2016). [DOI] [PMC free article] [PubMed] [Google Scholar]
- 69.Martin M Cutadapt removes adapter sequences from high-throughput sequencing reads. EMBnet. J 17, 10–12 (2011). [Google Scholar]
- 70.Dobin A et al. STAR: ultrafast universal RNA-seq aligner. Bioinformatics 29, 15–21 (2013). [DOI] [PMC free article] [PubMed] [Google Scholar]
- 71.Smith T, Heger A & Sudbery I UMI-tools: modeling sequencing errors in unique molecular identifiers to improve quantification accuracy. Genome Res. 27, 491–499 (2017). [DOI] [PMC free article] [PubMed] [Google Scholar]
- 72.Liao Y, Smyth GK & Shi W featureCounts: an efficient general purpose program for assigning sequence reads to genomic features. Bioinformatics 30, 923–930 (2014). [DOI] [PubMed] [Google Scholar]
- 73.Ritchie ME et al. limma powers differential expression analyses for RNA-sequencing and microarray studies. Nucleic Acids Res. 43, e47 (2015). [DOI] [PMC free article] [PubMed] [Google Scholar]
- 74.Langmead B & Salzberg SL Fast gapped-read alignment with Bowtie 2. Nat. Methods 9, 357–359 (2012). [DOI] [PMC free article] [PubMed] [Google Scholar]
- 75.Li H et al. The sequence alignment/map format and SAMtools. Bioinformatics 25, 2078–2079 (2009). [DOI] [PMC free article] [PubMed] [Google Scholar]
- 76.Quinlan AR & Hall IM BEDTools: a flexible suite of utilities for comparing genomic features. Bioinformatics 26, 841–842 (2010). [DOI] [PMC free article] [PubMed] [Google Scholar]
- 77.Zhang Y et al. Model-based analysis of ChIP–Seq (MACS). Genome Biol. 9, R137 (2008). [DOI] [PMC free article] [PubMed] [Google Scholar]
- 78.Lawrence M et al. Software for computing and annotating genomic ranges. PLoS Comput. Biol 9, e1003118 (2013). [DOI] [PMC free article] [PubMed] [Google Scholar]
- 79.Love MI, Huber W & Anders S Moderated estimation of fold change and dispersion for RNA-seq data with DESeq2. Genome Biol. 15, 550 (2014). [DOI] [PMC free article] [PubMed] [Google Scholar]
- 80.Oki S et al. ChIP-Atlas: a data-mining suite powered by full integration of public ChIP-seq data. EMBO Rep. 19, e46255 (2018). [DOI] [PMC free article] [PubMed] [Google Scholar]
- 81.Wolf T et al. Dynamics in protein translation sustaining T cell preparedness. Nat. Immunol 21, 927–937 (2020). [DOI] [PMC free article] [PubMed] [Google Scholar]
- 82.Lynn RC et al. c-Jun overexpression in CAR T cells induces exhaustion resistance. Nature 576, 293–300 (2019). [DOI] [PMC free article] [PubMed] [Google Scholar]
- 83.Gustafsson M et al. A validated gene regulatory network and GWAS identifies early regulators of T cell-associated diseases. Sci. Transl. Med 7, 313ra178 (2015). [DOI] [PubMed] [Google Scholar]
- 84.Liao W, Lin J-X, Wang L, Li P & Leonard WJ Modulation of cytokine receptors by IL-2 broadly regulates differentiation into helper T cell lineages. Nat. Immunol 12, 551–559 (2011). [DOI] [PMC free article] [PubMed] [Google Scholar]
- 85.Carlson M org.Hs.eg.db: Genome wide annotation for Human. R package version 3.8.2 10.18129/B9.BIOC.ORG.HS.EG.DB (2019). [DOI] [Google Scholar]
- 86.Wickham H ggplot2: Elegant Graphics for Data Analysis (Springer Science & Business Media, 2009). [Google Scholar]
- 87.Hahne F & Ivanek R Visualizing genomic data using Gviz and Bioconductor. Methods Mol. Biol 1418, 335–351 (2016). [DOI] [PubMed] [Google Scholar]
- 88.Lopez-Delisle L et al. pyGenomeTracks: reproducible plots for multivariate genomic datasets. Bioinformatics 37, 422–423 (2021). [DOI] [PMC free article] [PubMed] [Google Scholar]
- 89.Jake. jfreimer/immune_network_paper: Release of pipeline for publication. Zenodo 10.5281/zenodo.6371647 (2022). [DOI] [Google Scholar]
Associated Data
This section collects any data citations, data availability statements, or supplementary materials included in this article.
Supplementary Materials
Data Availability Statement
The raw sequencing files generated during this study are available at GEO under accession GSE171737. Transcription factor binding motifs used in this study were downloaded from JASPAR2020 (https://doi.org/10.18129/B9.bioc.JASPAR2020), HOCOMOCO v.11 (https://hocomoco11.autosome.org/) and CIS-BP (http://cisbp.ccbr.utoronto.ca/index.php).


