Abstract
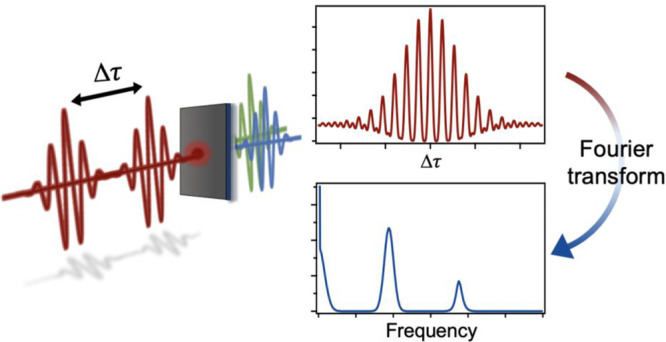
Fourier transform nonlinear optics (FT-NLO) is a powerful experimental physical chemistry tool that provides insightful spectroscopic and imaging data. FT-NLO has revealed key steps in both intramolecular and intermolecular energy flow. Using phase-stabilized pulse sequences, FT-NLO is employed to resolve coherence dynamics in molecules and nanoparticle colloids. Recent advances in time-domain NLO interferometry using collinear beam geometries makes determination of molecular and material linear and nonlinear excitation spectra, homogeneous line width, and nonlinear excitation pathways straightforward. When combined with optical microscopy, rapid acquisition of hyperspectral images with the information content of FT-NLO spectroscopy is possible. With FT-NLO microscopy, molecules and nanoparticles colocated within the optical diffraction limit can be distinguished based on their excitation spectra. The suitability of certain nonlinear signals for statistical localization present exciting prospects for using FT-NLO to visualize energy flow on chemically relevant length scales. In this tutorial review, descriptions of FT-NLO experimental implementations are provided along with theoretical formalisms for obtaining spectral information from time-domain data. Select case studies that illustrate the use of FT-NLO are presented. Finally, strategies for extending super-resolution imaging capabilities based on polarization-selective spectroscopy are offered.
Keywords: Fourier transform spectroscopy, super-resolution imaging, multidimensional spectroscopy, interferometry, hyperspectral imaging, second harmonic generation, photoluminescence, nonlinear optical microscopy, nanoparticles, 2D materials
1. Introduction
Nonlinear optical spectroscopy and microscopy have been adopted in the life and materials sciences1−3 thanks to their superior selectivity and contrast compared to linear optical signals, where variations in structure and composition cause relatively small changes in the linear absorption or scattering of a sample. Nonlinear optical signals are very sensitive to changes to the material structure and resonances, offering a probe of local symmetry and chemical composition. In this review we will discuss Fourier transform nonlinear optical (FT-NLO) spectroscopy and imaging, a family of measurements which combine the advantages of nonlinear optics and time-domain spectroscopy.
The detected signal in FT-NLO spectroscopy arises from a nonlinear polarization PNL induced in the sample by the exciting electric field E:
Information about the material’s interaction with light is encoded in the nonlinear susceptibility, χ(n), which is an n + 1 rank tensor. Analysis of the elements of the tensor through polarization-resolved spectroscopy can provide insight into material symmetry and structural ordering.4−6 The nonlinear susceptibility is also a frequency-dependent quantity, reflecting resonances in the nonlinear medium. Fourier-transform nonlinear optical spectroscopy uses the nonlinear emission from a sample as an action spectrum to reconstruct the frequency dependence of the χ(n) tensor. The nonlinear optical action spectrum can be based on χ(2) effects like second harmonic generation and χ(3) phenomena like coherent anti-Stokes Raman scattering and two-photon fluorescence, along with higher-order effects. Some of the types of nonlinear emission used in FT-NLO including second harmonic generation (SHG), sum frequency generation (SFG), third harmonic generation (THG), coherent anti-Stokes Raman scattering (CARS), and multiphoton photoluminescence (MPPL) are depicted in Figure 1.
Figure 1.
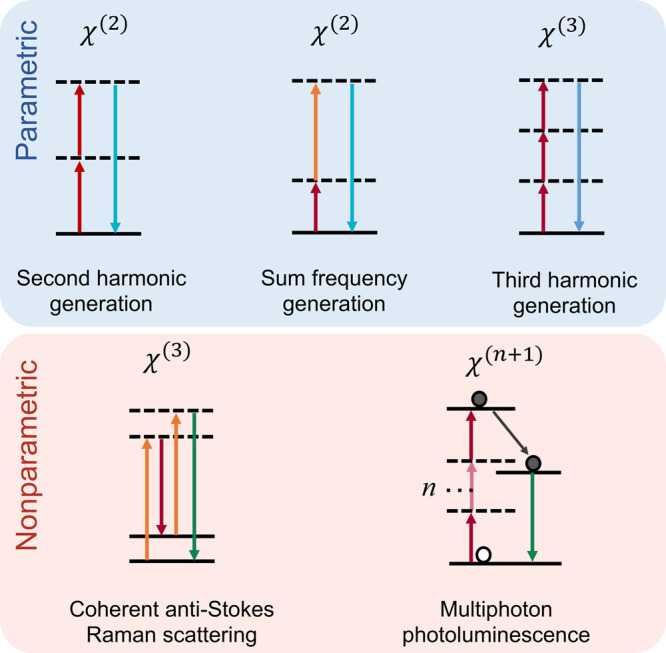
Examples of nonlinear signals commonly detected in FT-NLO, including parametric, wave-mixing processes such as second harmonic generation, sum frequency generation, and third harmonic generation and nonparametric processes including coherent anti-Stokes Raman scattering and multiphoton photoluminescence. See section 5 for a more detailed discussion of parametric and nonparametric signals in FT-NLO.
Fourier transform nonlinear optical spectroscopy first emerged as a method for obtaining nonlinear optical spectra where the spectral resolution was not limited by the bandwidth of the exciting laser pulse. Femtosecond laser pulses increase the practicality of nonlinear optical spectroscopy, since high peak powers can be obtained while keeping the average power relatively low, increasing the probability of a nonlinear response in proportion to an undesired linear response. However, a transform-limited sub-100 fs pulse will have a bandwidth exceeding ∼10 nm, limiting the resolution of a spectrum obtained by laser wavelength scanning. In FT-NLO spectroscopy, however, the spectral resolution is not affected by the laser bandwidth.7 This advantage was first demonstrated in FT-NLO based on CARS, where rotational modes separated by less than 1 cm–1 were resolved using 3 cm–1 bandwidth lasers.8
Researchers have demonstrated that variations on FT-NLO spectroscopy can be used beyond providing high resolution nonlinear optical spectra. In fact, in many instances, FT-NLO has been used to obtain molecular dynamics insights that would not have been gleaned from linear optical or steady-state NLO measurements. Fleming and co-workers first used fluorescence-detected measurements to resolve vibrational wavepackets in order to understand the role of nuclear dynamics in intramolecular energy relaxation.9 FT-Raman has improved our understanding of solvation phenomena by identifying intermolecular vibrational modes and microscopic potential energy surfaces of common solvents.10 These same measurements implicate intermediate “solvent transients”, that are likely undetectable by other methods, for mediating solvation. FT-NLO has had similar impacts in materials dynamics. For example, FT-NLO has been used to measure solid-state optical phase modulation as a probe of energy dissipation due to photoabsorption.11 FT-NLO has also been used to resolve plasmon dynamics,12−19 including the influences of surface overcoating and structure on material quality factors,20−23 and for elucidating the photophysical mechanisms behind nonlinear optical emission, including energy flow within multicomponent systems.20,21 Recently, FT-NLO-based hyperspectral and super-resolution imaging methods have emerged.17−20 In particular, the use of FT-NLO derived excitation spectra to resolve nanoparticles with subdiffraction spatial resolution is notable.22 This advance suggests it may be possible to spectroscopically resolve molecular and materials dynamics on chemically relevant (i.e., microscopic) length scales.
In this tutorial, we will introduce the experimental and theoretical basis of FT-NLO spectroscopy before discussing some of these recent variations on the technique. The principles of FT-NLO spectroscopy are conceptually similar to time-resolved coherent multidimensional spectroscopy,23,24 such as 2D electronic and vibrational spectroscopy. However, our discussion is limited to techniques that use interferometric detection of nonlinear optical signals, which can increase both spectral and spatial resolution, allowing subdiffraction imaging. The remainder of this tutorial is organized as follows: experimental implementations are described in section 2; theoretical descriptions for determining linear and nonlinear excitation spectra are given in sections 3 and 4; case studies demonstrating the use of FT-NLO to distinguish nonlinear excitation pathways and determine photon orders are summarized in section 5; examples of spectroscopically enabled subdiffraction “super”-resolution imaging are given in section 6, and conclusions and outlook for future research is provided in section 7. In particular, new strategies to leverage FT-NLO interferometry techniques to achieve polarization-dependent super-resolution imaging are presented.
2. Experimental Implementations
The basic components of an FT-NLO spectrometer are depicted in Figure 2a. Laser pulses from the excitation source are used to generate a pulse pair which excites the sample to generate nonlinear signal, which is detected as a function of the interpulse time delay, Δτ. For excitation, a broadband, femtosecond pulse is preferred to maximize the spectral range and temporal resolution of FT-NLO while limiting the average powers needed to generate nonlinear signals. FT-NLO can be used to study material resonances at the fundamental wavelength or at its harmonics, expanding the range of materials that can be studied with a single fundamental laser. Generally, Ti:sapphire oscillators have been used to generate NIR pulses for FT-NLO spectroscopy with pulse durations as low as 5 fs.25 However, a range of laser gain media have been employed, depending on the spectral range and coherence times of the transitions of interest.8,26
Figure 2.
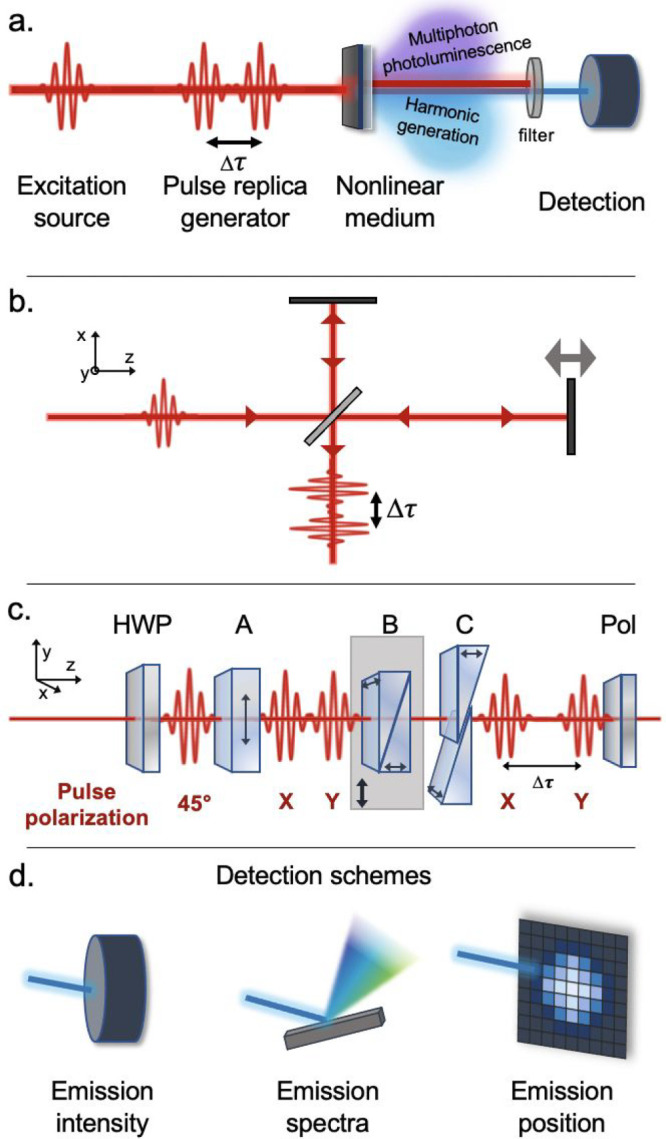
Experimental implementations of FT-NLO spectroscopy. (a) Basic components required for FT-NLO spectroscopy include an coherent excitation source, a pulse replica generator able to vary the time delay between pulses, a sample capable of generating nonlinear emission, a filter to spectrally or spatially separate the nonlinear signal from the excitation laser, and a detector. The pulse replica generator can be based on a Michelson interferometer (b), in which a beamsplitter separates the pulse into two components which travel different length paths before recombining collinearly, introducing a time delay. The pulse replica generator can also consist of a set of birefringent optics known as TWINS (c) which split a pulse into x- and y-polarized components and vary the time delay between them using a translating birefringent wedge, as described in the text. Various detection schemes are used in FT-NLO spectroscopy (d), including point source detectors measuring only the emission intensity, dispersive spectrometers which can resolve the spectrum of the nonlinear emission, and array detectors which provide spatial resolution of the nonlinear signal. Panel c adapted with permission from ref (22). Copyright 2022 AIP Publishing.
Performing FT-NLO spectroscopy relies on the ability to generate a pair of pulses with a controllable interpulse time delay. This can be accomplished in a Mach-Zender or Michelson interferometer, where a 50/50 beamsplitter is used to split the parent pulse into two pulses, and a variable delay line on one of the arms is used to delay one of the pulses with respect to the other before the pulses are recombined to the same beam path (Figure 2b). Active phase stabilization techniques can be used to ensure the stability of the time delay between the pulse pair.27−29 Another approach using only a single beam is the translating-wedge-based identical pulses encoding system (TWINS) method.17,30 The TWINS method is based on the Babinet-Soliel compensator and uses a series of birefringent optics to generate the phase-locked pulse pair (Figure 2c). To generate the pulse pair, the parent pulse is polarized at 45° with respect to the lab frame before entering the first block, made of α-BBO and labeled A in Figure 2c, which splits the parent pulse into its x- and y-polarized components with a fixed time delay between them. A second block, B, is made from a set of α-BBO wedges, one of which has its crystal axis aligned along the x-axis, delaying the x-polarized pulse. Block B is positioned on a motorized stage to translate the block perpendicularly to the beam propagation direction. As the block is moved, the thickness of the crystal aligned along the x-axis in the beam path changes, allowing for adjustment of the time delay between the two pulses. The resulting interpulse time delay is controlled by the transmission path length of blocks A and B (dA and dB) and is given by
where vge and vgo are the extraordinary and ordinary group velocity, respectively. The pulse pairs travel through a final block, C, which corrects for angular dispersion before a polarizer is used to project both pulses back to the same polarization plane. The single-beam TWINS method offers advantages in phase stability over interferometers since both pulse replicas travel along a common path and encounter the same optics.
The design and stability of the pulse replica generator is crucial for FT-NLO since the temporal parameters of the pulse pair, depicted in Figure 3a,b, determine the spectral resolution and range of the Fourier transform spectrum (Figure 3c,d). The total range of times delays, T, that are sampled in the interferogram (Figure 3a) will affect the spectral resolution of the resulting Fourier transform spectrum, which is given by 1/T (Figure 3d). The sampling rate (fs) of the interferogram (Figure 3b), which is limited by the precision of the delay stage and phase stability of the pulse pair, is another important parameter. The highest energy that can be resolved in the Fourier transform spectrum will be given by the Nyquist limit as half of the sampling rate (fs/2), as shown in Figure 3c.
Figure 3.
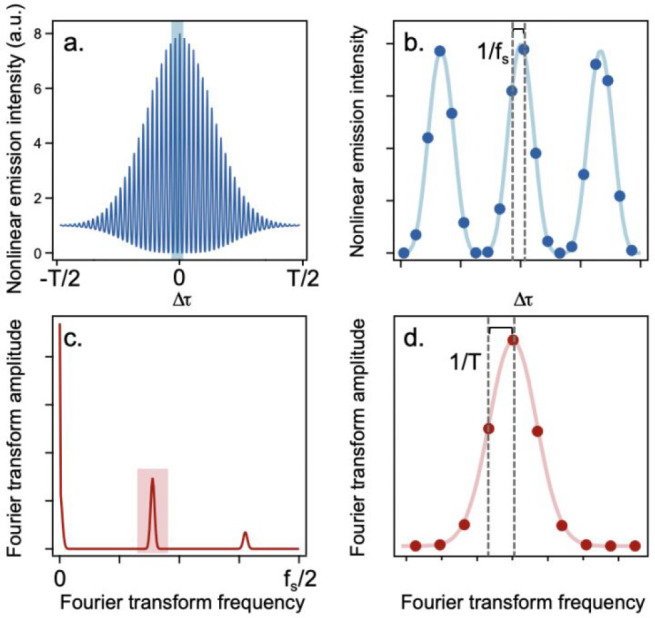
Relationship between temporal and frequency ranges and resolution in Fourier transform spectroscopy. (a) An example interferogram over the full range of time delays, T. (b) the portion of the interferogram highlighted in blue in panel a. Each dark blue marker represents an experimental data point at a given interpulse delay time, Δτ. The separation between each data point defines the sampling frequency, fs. The temporal parameters determine the frequency resolution and range of the Fourier transform spectrum (c,d). The highest energy resolved is given by fs/2 (c). Panel d, showing the region of panel c highlighted in pink, depicts the separation between data points in the Fourier transform spectrum which is given by 1/T.
After the pulse pair is generated, the excitation source is focused onto the sample to generate a nonlinear optical response, such as multiphoton photoluminescence or harmonic generation. This nonlinear signal is spectrally filtered to isolate it from the excitation pulse sequence and detected using either a point source detector, dispersive spectrometer, or camera (Figure 2d). A point source detector such as a photomultiplier tube or avalanche photodiode offers the highest sensitivity for measurements with low photon counts. Fourier transformation of the time-delay-dependent NLO signal intensity registered by a point source detector yields the sample excitation spectrum. With a dispersive spectrometer, the nonlinear emission spectrum can be collected as a function of interpulse time delay, which allows excitation/detection frequency correlation maps to be measured. Finally, imaging of the nonlinear emission offers a route to wide-field hyperspectral imaging of heterogeneous materials and spatial super-resolution microscopy. Each detection scheme has advantages for obtaining different types of information about the sample of interest, as we will discuss in more detail in later sections.
We next turn to discussing the information that can be obtained through FT-NLO. Primarily, FT-NLO spectroscopy is used to obtain nonlinear excitation spectra of the sample of interest. However, as we will discuss below, variations on FT-NLO can also be used to quantify temporal coherences, elucidate the pathways leading to nonlinear emission from a sample, and obtain hyperspectral nonlinear optical images.
3. Determining Nonlinear Spectra
FT-NLO can be used to determine the resonant response spectrum of a nonlinear sample through comparison with a reference sample. FT-NLO has been demonstrated for nonlinear signals including coherent anti-Stokes and stimulated Raman spectroscopy,8,31 four-wave mixing,25 second harmonic generation,32 sum frequency generation,33 and two-photon photoluminescence34 to resolve electronic, vibrational, and rotational resonances. The theoretical formalism for extracting the resonance response of the sample varies according to the type of nonlinear signal.
Generally, in FT-NLO spectroscopy, the electric field of the pulse pair, E(τ), induces a nth -order nonlinear polarization, P(n) (t, τ), in the sample, given by
 |
where R(n) (tn, tn-1,...t1) is the nth-order response function of the material. The electric field of the pulse pair is given by
where A(t) is the pulse envelope and ω0 is the laser center frequency. This nonlinear polarization leads to the detected nonlinear signal:
The goal of FT-NLO spectroscopy is to reconstruct the optical response function based on the measured nonlinear signal. In this section, we will give a brief overview of how nonlinear optical spectra are obtained for SHG- and TPPL-detected interferograms under different resonance conditions.
In the first case, we will consider the case where 2ω0 is resonant with a real state of the sample, but there is no such resonance at 1ω0. Because the transition to 2ω is instantaneous, owing to the virtual resonance at 1ω, the second-order response function can be simplified to
The nonlinear signal can now be written as
The second-order nonlinear interferogram S(2)(τ) will contain components oscillating at ω0 and 2ω0, along with a non-oscillatory (dc) component. Through further analysis, it can be shown that, after Fourier transformation, the 2ω0 component is related to the second-order response function as
|E(2)(ω)|2 is known as the second harmonic power spectrum and is given by
where φ is the spectral phase. Despite its complexity, |E(2)(ω)|2 can be obtained experimentally by the Fourier transform of the nonlinear interferogram of a nonresonant reference sample, such as a thin β-BBO crystal or two-photon photodiode. Figure 4a shows an example of the Fourier transform signal S(2)(ω) obtained from detecting SHG from two fluorescent proteins (SeBFP and Venus) along with the signal from a nonresonant BBO crystal.35 Once |E(2)(ω)|2 has been determined, the response function of the resonant sample can be obtained through the division of S(2)(ω) by the second harmonic power spectrum, as shown in Figure 4b. This method has also been applied to determine the two-photon excitation spectra of a number of nonlinear molecules.32,34,35
Figure 4.
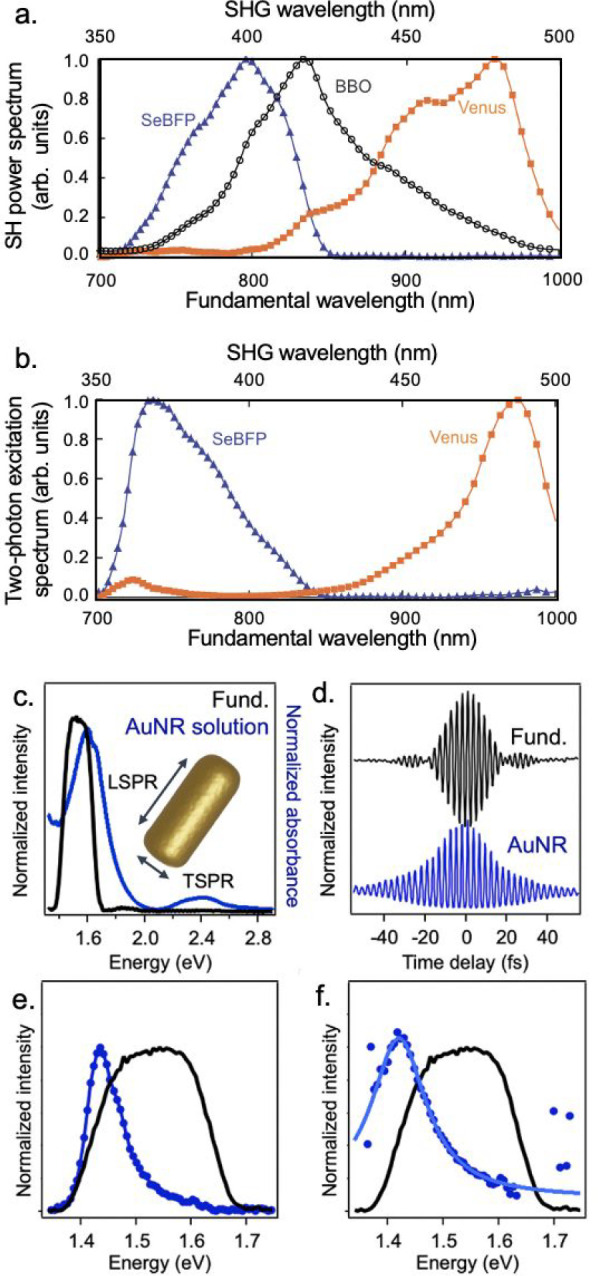
Obtaining resonance spectra using FT-NLO. (a) the second-harmonic detected FT-NLO spectra of two-photon resonant fluorescent proteins SeBFP and Venus and a reference nonresonant BBO crystal. (b) Two-photon excitation spectrum of SeBFP and Venus are obtained by division of the FT-NLO spectrum (a) by the BBO reference spectrum. Resonance spectra can also be obtained for one-photon resonant materials, such as plasmonic gold nanorods (c–f). The ensemble extinction spectrum of gold nanorods exhibits a transverse and longitudinal surface plasmon resonance (TSPR and LSPR). The LSPR is resonant with the laser fundamental. The MPPL-detected interferogram is collected for a single gold nanorod, along with the interferogram of the laser pulse (d). The interferograms are Fourier transformed (e), and the FT spectrum of the nanorod is deconvolved from the laser spectrum to give the resonant response of the particle (f), which is consistent with a single Lorentzian peak. Panels a and b adapted with permission from ref (25). Copyright 2008 American Physical Society. Panels c–f adapted with permission from ref (22). Copyright 2022 AIP Publishing.
FT-NLO spectroscopy can also be used to study materials with resonances at ω0. One common example is plasmonic metal nanoparticles with localized surface plasmon resonances near ω0. Although in the case of noble metal nanoparticles the 2ω0 frequency is also generally resonant with interband transitions in the metal, excitation of the plasmon can generate a plasmon field which drives nonlinear emission and dominates over contributions from the two-photon interband resonance. Thus, although a nonlinear signal is detected, the resonant response function obtained by FT-NLO is linear. The validity of this approach has been demonstrated through power-dependent measurements demonstrating that the signal intensity is linear with respect to either the pump or probe power.18
Under these conditions, the linear response function, R(1)(ω), is encoded in the Fourier transform spectrum near ω0. The ω0 component of the spectrum can be written as
where P(1)(ω) is the linear polarization induced by excitation of the plasmon mode:
Because the detected nonlinear optical signal is determined by the linear response function, the induced polarization is proportional to the spectrum of the excitation laser, E(ω), which can be obtained from the Fourier transform of the fundamental autocorrelation.
An example of the process for extracting the response function of a single gold nanorod (AuNR) is shown in Figure 4c–f.22 The AuNRs in this example have a longitudinal surface plasmon resonance (LSPR) which is resonant with the laser fundamental (Figure 4c). The interferometric autocorrelation based on the MPPL emission from a single AuNR and an autocorrelation of the laser pulse were collected (Figure 4d) and Fourier transformed to obtain S(ω) and E(ω), respectively (Figure 4e). Using the equations above, the linear response function reflecting the LSPR of a single AuNR can be deconvolved from the nonlinear FT spectrum (Figure 4f).
4. FT-NLO with Femtosecond Temporal Resolution
As discussed above, FT-NLO has been a useful method for extracting the response functions of plasmonic materials, which contain not only plasmon frequencies but also temporal information about the plasmon resonance. In the case where the plasmon mode is resonant with the fundamental, the linear response function can be determined in the frequency domain from deconvolution of the Fourier transform spectrum. In the limit of a single particle without inhomogeneous broadening, the response function can be described by
where N is the number of resonant plasmon modes, a is the amplitude, ωn is the plasmon frequency, and γ is the line width of the resonance. From the line width, the dephasing time T2 can be determined using
The response function for the AuNR in Figure 4d could be fit with a single Lorentzian, as expected, with a fwhm width of 124 ± 3 meV, corresponding to a dephasing time of 10.6 ± 0.3 fs.22 This approach has been used to describe the effects of interband scattering and interfacial scattering on plasmon dephasing times occurring on tens of femtosecond time scales.18,19 In this way, the FT-NLO method can be used to obtain important structure–property correlations for colloidal nanoparticles and other materials.
Dephasing times for one-photon resonant plasmonic particles can also be obtained directly in the time-domain through analysis of the interferograms prior to Fourier transformation. This approach, related to interferometric autocorrelation methods used for characterization of ultrafast laser pulses,36 uses the interferometric signal to determine the temporal properties of the field generated by the plasmon. In this time-domain view, the nth-order interferometric autocorrelation driven by the plasmon field, Epl, is
The plasmon field is in turn driven by the applied field, Elaser:
With the formalisms above and knowledge of the laser field, which can be obtained from interferometric autocorrelation with a nonresonant sample, the dephasing time of the plasmon can be determined from SHG, THG, or TPPL measurements in the time-domain.12−14,26,37,38 Through a manor analogous to the expansion of interferometric autocorrelations for pulse characterization into frequency-resolved optical gating (FROG) traces,39 spectral resolution of the nonlinear signal (as in Figure 2d) can transform the 1D interferogram into a 2D map which allows the phase of the plasmon response function to be determined.12
In addition to resolution of the femtosecond dephasing of one-photon resonant plasmon modes, analysis of the time-domain interferometric signal can also be used when the resonance is at the harmonic energy. In this case, the system is often modeled as a few-level system and treated with a density matrix or optical Bloch equation approach. The temporal evolution of the density matrix, ρ, is described by the Liouville von Neumann equation:
where H is the Hamiltonian
for the equilibrium system and the light–matter interaction.
The relaxation term  includes the
population (on-diagonal) and
polarization (off-diagonal) dynamics of the system. The time evolution
of a N-level system can then be written as a set
of N2 coupled differential equations which
can be solved numerically. The nonlinear optical signal can be modeled
from the relevant population or polarization term of the density matrix.
By using the density-matrix approach and comparing the modeled and
experimental interferograms, femtosecond dephasing dynamics of plasmonic
and semiconducting systems have been deduced.16,20,40
5. Nature of the Nonlinear Signal
Fourier transform spectroscopy can also give insights into the photon order and photophysical mechanism, or pathways, of the nonlinear signal. Specific examples of nonlinear mechanisms include parametric and nonparametric pathways (Figure 1). Parametric transitions correspond to nonlinear processes that conserve the energy of the excitation field in the detected nonlinear signal and proceed through a real-valued susceptibility. Examples of parametric processes include perturbative harmonic generation (e.g., SHG, SFG, THG). In contrast, nonparametric transitions are typically complex-valued and the excitation energy is not directly correlated with that of the nonlinear signal. Multiphoton absorption and subsequent photoluminescence are an example of a nonparametric pathway. The insights from FT-NLO can reveal coupling in multicomponent structures, elucidate the effects of molecular dopants, and unravel the contributions of multiple competing nonlinear optical pathways.20,21,41,42
Unlike parametric harmonic generation signals, the nonlinear photon order of multiphoton luminescence is not discernible based on the emission spectrum. Determining the photon order, n, of these signals can clarify band structures and field enhancement effects. Typically, the photon order is determined based on the power dependence of the nonlinear emission. The power dependence of the nonlinear signal can be described by a power law, INLO = Iexn, where INLO is the intensity of the nonlinear signal and Iex is the excitation intensity. These conventional steady-state power dependent measurements report on the average photon order of the signal, however, which can result in fractional photon orders for photoluminescence from complex systems where multiple excitations may contribute to the signal.
The nonlinear photon order can also be determined from FT-NLO spectroscopy in a single measurement that does not require accurate measurement of the excitation intensity, minimizing the potential for error. Instead of fitting the power law dependence on the excitation intensity, the photon order is characterized by the contrast ratio of the interferometric autocorrelation, given by the ratio between the signal intensity at τ0 to the intensity at long interpulse time delays. The interferometric autocorrelation is given by
As
τ approaches infinity, the pulses are well separated in
time and the electric fields do not interfere. Therefore,  can be
written as
  =
=  and the limit as τ
→ ∞
is
  . Meanwhile, for τ = 0, the amplitude
of the autocorrelation is
  . Therefore, the contrast
ratio,
  is
given by
While using the contrast ratio to determine n is more robust since it does not require measurement of the input power, fractional photon orders indicating the presence of multiple excitation pathways can still result.42 The fractional n is reflective of the average photon order; therefore higher-order, multiphoton absorption can be obscured when lower-order MPA also occurs. To circumvent this issue, the Fourier transform spectrum can be analyzed to obtain additional information about the excitation mechanisms that result in nonlinear emission. While the contrast ratio uses the amplitude at two points in the interferogram to characterize the nonlinear signal, the rest of the interferogram also contains information about the photon order of the signal. Figure 5a illustrates how the photon order affects the line shape of the interferogram, with lower n resulting in wider peaks compared to higher n interferometric autocorrelations. These changes in the interferogram with changing photon order can also be visualized in the Fourier transform spectrum. Figure 5b, which shows the spectra associated with the interferograms in Figure 5a, demonstrates that the Fourier transform spectrum of an n-photon process will contain peaks at each harmonic of ω0, up to n.
Figure 5.
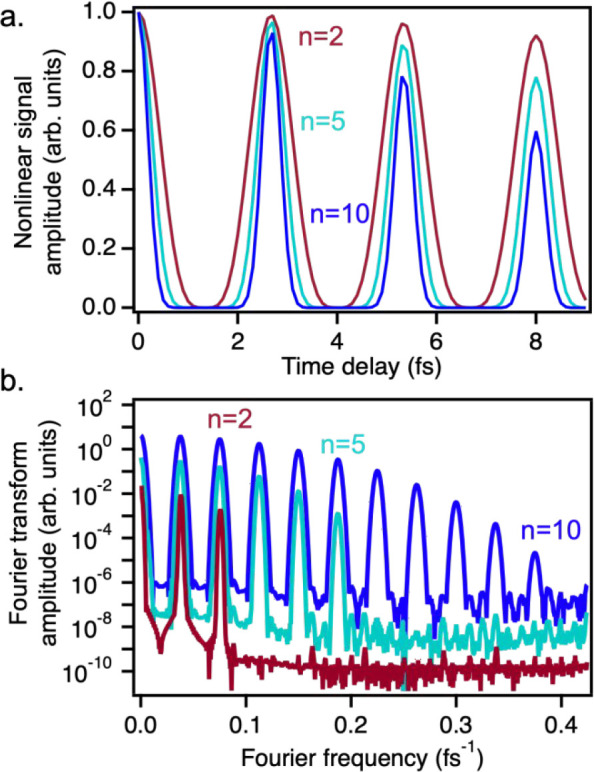
Simulated data demonstrating the effect of photon order on the time-domain interferogram (a) and Fourier transform spectrum (b) for photon orders of 2, 5, and 10. Adapted from ref (41). Copyright 2022 American Chemical Society.
The Fourier transform spectra can also be used to determine the highest photon order in the case of mixed photon orders. Figure 6 shows an example using the Fourier transform spectrum of redox-exfoliated MoS2.41 Because multiple photon orders contribute to the nonlinear signal, conventional power-dependent measurements indicated a photon order of only 2–6 for MPPL (Figure 6b). FT-NLO, however, revealed that 10th-order MPPL was present in this system (Figure 6d). The SHG-detected FT spectrum of redox-exfoliated MoS2 (Figure 6c) also revealed higher-order effects which were not observed in the power-dependent measurements (Figure 6a). Modeling of the interferometric signal with a density matrix formalism suggested that mixed-order multiphoton absorption and saturated SHG contributed to the higher-order features observed through FT-NLO spectroscopy. Further work implicated charged polyoxometalate (POM) clusters in the high-order MPPL and saturated SHG, and demonstrated that this effect can be generalized to other nanomaterials with POMs.41 Since the 10th-order MPPL was obscured in power-dependent measurements by the presence of lower photon order processes, the use of FT-NLO spectroscopy may reveal that very high-order multiphoton absorption is more common than previous work has suggested.
Figure 6.
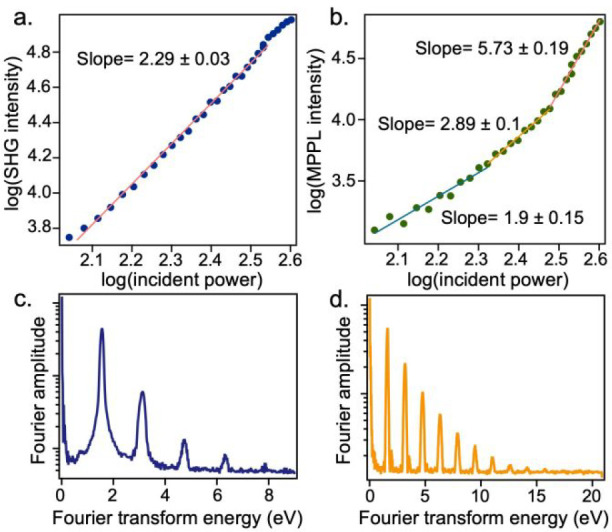
FT-NLO resolves nonlinear pathways obscured in conventional nonlinear spectroscopy. Power-dependent measurements of SHG (a) and MPPL (b) from redox-exfoliated MoS2 exhibit slopes of 2 and 2–6, respectively. FT-NLO of the SHG (c) and MPPL (d) exhibited signatures of higher-order nonlinearities obscured in the conventional measurements. Adapted from ref (41). Copyright 2022 American Chemical Society.
While FT-NLO spectra reveal the highest-order process contributing to nonlinear emission, to date, no method for determining which lower-order MPA processes are present has been reported. While the relative amplitudes of the nω0 peaks may offer insights into the relative contributions of each photon order, no methods to determine the lower photon orders without prior knowledge of the system have been developed.
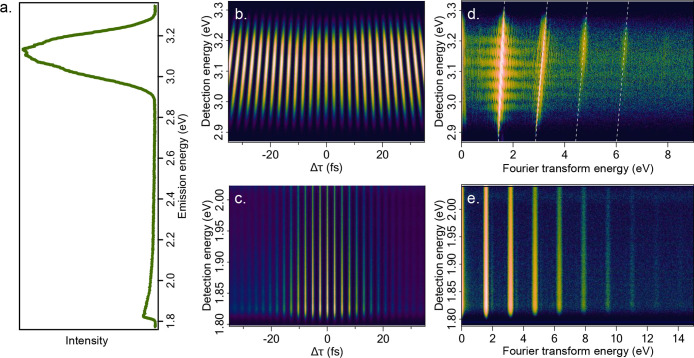
FT-NLO can also be used to distinguish different types of nonlinear emission. For a given photon order multiple processes may be present and may also have spectrally overlapping emission. Characterization of the nonlinear signal can be enhanced by spectrally resolving the nonlinear emission, as illustrated in Figure 7a–c. Based on the spectrally resolved interferogram and resulting Fourier transform spectra which contain excitation/detection frequency correlations, parametric and nonparametric nonlinear optical phenomena can be distinguished.20 For signals such as harmonic generation, where all transitions are instantaneous and the population of the system is unchanged by the interaction, the emission frequency should be correlated with the excitation frequency. As a result, oscillations in the signal change with detection energy as observed in the spectrally resolved interferogram in Figure 7b which shows SHG in redox-exfoliated MoS2.41 In the 2D excitation/detection correlation maps generated by Fourier transformation along τ (Figure 7d), the signal occurs along diagonal lines at 2ωdet = ωex and ωdet = ωex. In contrast, signals such as nonparametric multiphoton absorption must occur through real states and the final population is different from the initial state. In MPPL, the excitation energy reflecting the MPA process and the detection energy associated with the emissive state are not necessarily correlated. Therefore, as shown in Figure 7c,e, the spectrally resolved interferograms and Fourier transform maps exhibit no dependence on the detection energy. Therefore, different contributions to the nonlinear signal can be distinguished even when their signals spectrally overlap.20,41
Figure 7.
Spectrally resolved FT-NLO enables excitation/detection correlations in MoS2. (a) Steady-state emission spectrum of redox-exfoliated MoS2 exhibits a large peak at 3.1 eV, as well as a broad emission at lower energies, which are attributed to SHG and MPPL, respectively. The emission spectra of the SHG (b) and MPPL (c) are collected as a function of interpulse time delay to generate the spectrally resolved interferograms. The interferograms are Fourier transformed along the time axis to generate excitation/detection correlation maps (d,e). These maps confirm that the signal at 3.1 eV is parametric, due to the diagonal dependence of the signal (d), while the signal at 1.9 eV is nonparametric and has no dependence on the excitation energy (e). Adapted from ref (41). Copyright 2022 American Chemical Society.
The 2D excitation–detection correlation maps can also be used to distinguish different types of wave-mixing signals. When a broadband excitation laser is used for nonlinear optics, second-order parametric signals can include both SHG with mixing of degenerate frequencies and SFG from mixing of near-degenerate frequencies in the excitation spectrum. While SHG signals appear along the diagonal of the 2D excitation/detection maps, as discussed above, near-degenerate SFG signal manifests as a splitting of the diagonal signal, where multiple excitation frequencies contribute at a single detection frequency. Near-degenerate SFG has been observed in a hybrid gold/ZnO nanostructure, as shown in Figure 8.21 The 2D FT-NLO maps revealed that SFG was enhanced at detection frequencies near the ZnO exciton resonance. Based on this observation, the mechanism of coupling between the gold plasmon and ZnO exciton resonance was deduced. Linear excitation of the gold plasmon generates a field which drives the nonlinear emission from the ZnO exciton. The ability to distinguish different types of nonlinear emission through resolution of the emission frequency is a key advantage in FT-NLO spectroscopy.
Figure 8.
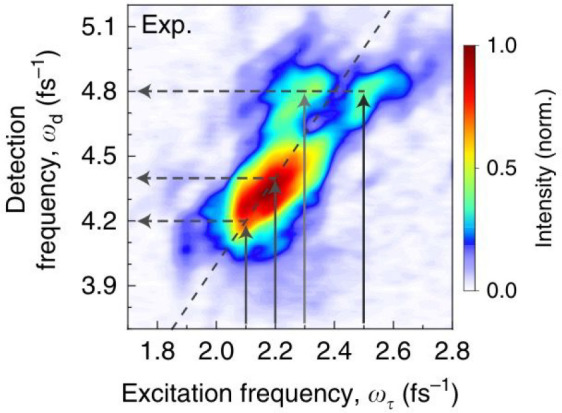
Distinguishing SFG and SHG using spectrally resolved FT-NLO. The excitation/detection map of the nonlinear signal from a hybrid gold/ZnO nanostructure demonstrates the existence of both SFG (evident by the off-diagonal signal at a detection axis of 4.8 fs–1) and SHG (observed in the on-diagonal signal at lower energies). Reprinted with permission under a Creative Commons Attribution 4.0 International License from ref (21). Copyright 2020 Springer Nature.
6. Diffraction- and Subdiffraction-Limited Spatial Resolution with FT-NLO
Spatial resolution in FT-NLO spectroscopy can be obtained through imaging the position of the nonlinear emission as a function of the interpulse time delay through wide-field detection with an array detector, as depicted in Figure 2d. The interferometric data set can then be Fourier transformed along the time delay axis to generate a 3D data set akin to a hyperspectral image cube. The Fourier transform data set contains a set of images at each Fourier transform energy, allowing structures with a particular resonance frequency to be observed. The Fourier transform data set can also be used to extract the resonance spectrum at a given pixel of the image.
An example of this approach to hyperspectral imaging is shown in Figure 9. Figure 9a is an MPPL-detected image of two gold nanorods with longitudinal plasmon modes which are resonant with the broadband laser fundamental centered at 1.55 eV.22 As shown in Figure 9a, the nonlinear optical images at a series of interpulse time delays were collected to generate an interferometric video. A Fourier transform along the time axis resulted in the 3D hyperspectral data set, with slices at several Fourier transform energies shown in Figure 9a. From these images, it is clear that nanorod 1 has a lower resonance frequency than nanorod 2. The resonance spectra of these two particles can also be extracted from the hyperspectral data set and are compared in Figure 9b.22
Figure 9.
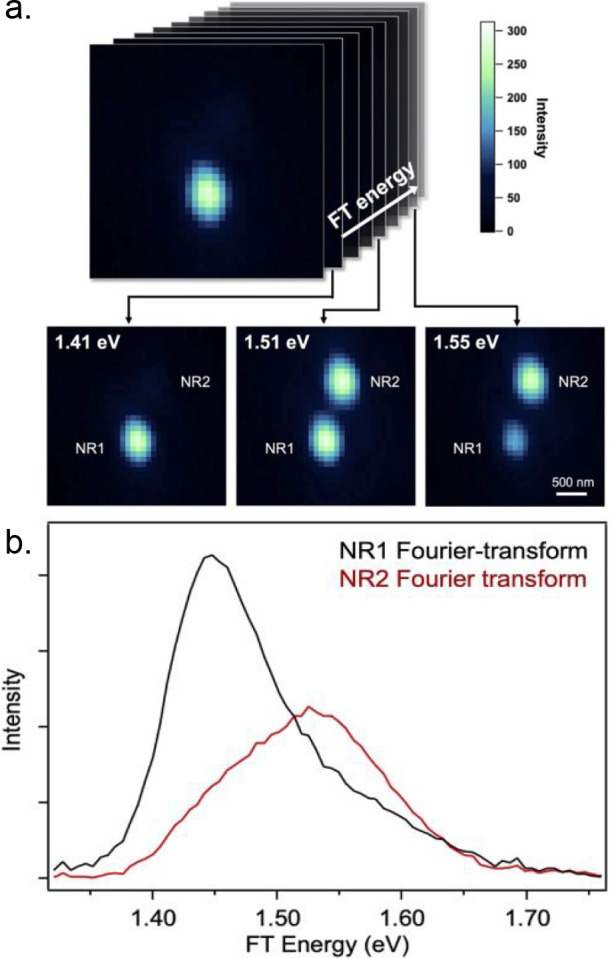
Performing hyperspectral imaging of gold nanorods with FT-NLO microscopy. (a) Spatial resolution of the nonlinear signal allows the generation of a 3D data set consisting of an image of the sample at each Fourier energy. In this example, selected slices of the 3D data set for two gold nanorods are shown. (b) Resonance spectrum of the two rods are obtained from the data set in panel a. Reprinted in part with permission from ref (22). Copyright 2022 AIP Publishing.
FT-NLO microscopy can also be used to image nanostructures with subdiffraction spatial resolution. While the diffraction of light limits the resolution of conventional optical microscopy to λ/2NA, where λ is the wavelength and NA is the numerical aperture of the imaging optics, super-resolution microscopy techniques based on the localization of individual emitters have been demonstrated with photoswitchable fluorophores. FT-NLO microscopy can achieve subdiffraction spatial resolution without labeling by capitalizing on differences, such as those arising from heterogeneity, in the resonance response of a set of nanostructures. Figure 10a shows the diffraction-limited MPPL-detected image of three nanorods colocated within the optical diffraction limit of the emission wavelengths. Emission photons from all three particles sum to generate the Figure 10a image. As a result, the nanostructures are not separable using this standard type of image acquisition.22 In the interferometric data set, however, the emission from individual particles is modulated according to their resonance frequency. For example, when the time delay between two exciting laser pulses most closely matches the resonance of one particle within the excitation area, the MPPL image center of mass will be shifted toward the location of that object. This allows the center of emission from each particle to be determined from localization, or centroid fitting, of each point spread function present in the Fourier transform data set through a global fitting algorithm (Figure 10b). The localization results for three different nanorods agree well with positions determined through electron microscopy (Figure 10c). The resonance response of each particle is also resolved, as shown in Figure 10d. Therefore, FT-NLO combined with statistical localization can take advantage of differences in the spectroscopic response of nanostructures to achieve spatial resolution that exceeds the diffraction limit. This approach is general and should be applicable to any NLO-active system.
Figure 10.
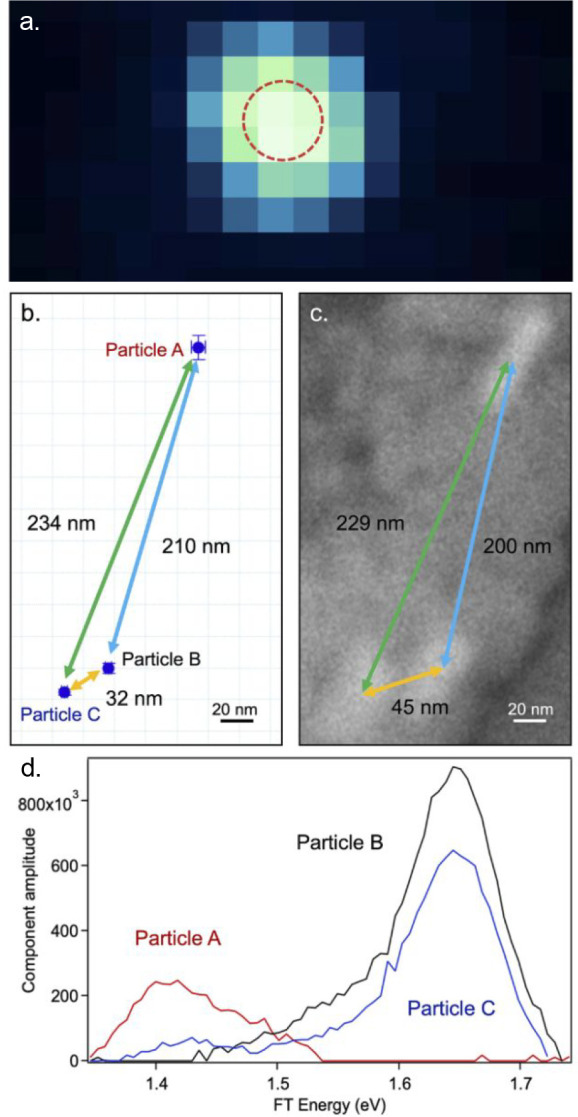
FT-NLO microscopy used to obtain subdiffraction spatial resolution. (a) Far-field MPPL-detected image of three gold nanorods. The red circle indicates the approximate diffraction limit. The positions of the particle are obtained through FT-NLO microscopy (b) which shows good agreement with positions determined through electron microscopy (c). FT-NLO microscopy also determines the resonance spectra of each particle (d). Adapted with permission from ref (22). Copyright 2022 AIP Publishing.
Subdiffraction spatial resolution can also be achieved through scanning near-field optical microscopy (SNOM), which allows the observation of plasmon mode structure within a single nanoparticle. The realization of FT-NLO in a near-field optical measurement is technically difficult because of the dispersion resulting from focusing short laser pulses on the tip of the SNOM probe. Pulse elongation can be overcome by using a combination of pulse compressors and shapers to correct for high-order dispersion effects.43−46 Interferometric SNOM has been used to demonstrate distinct dephasing times for multiple plasmon modes within a single nanoparticle,47 as well as interference of multiple modes resulting in wave packet dynamics.48
7. Conclusions and Outlook
In this review, we have described the implementation and use of multimodal FT-NLO spectroscopy and imaging. The FT approach has several advantages over conventional NLO methods. Fourier transformation of the excitation-energy axis allows clear assignment of the excitation photon order. Additionally, inspection of 2D excitation-detection energy correlation maps allows for parametric and nonparametric nonlinear pathways to be distinguished. These two distinctions are important because they aid understanding of photophysical and photochemical mechanisms that underlie the NLO signals.
As described in sections 3–5, the FT-NLO method is especially well-suited for resolving electron dynamics and charge transfer processes in nanoparticles and material heterostructures. One example where single-nanoparticle FT-NLO microscopy has been impactful is in understanding structural influences on localized surface plasmon dynamics. In the case of gold nanorods, FT-NLO accurately resolves the effects of interband scattering on plasmon coherence times.18 FT-NLO spectroscopy has also been used to quantify the effects of silica passivation on nanorod plasmon dynamics; the formation of the SiO2/gold nanorod heterostructure reduces interfacial scattering and increases plasmon coherence times.49 Therefore, single-nanoparticle FT-NLO imaging is a proven method for understanding plasmon dynamics. In future research, FT-NLO can be used to understand mode-selective plasmon dynamics and nonlinear signal amplification in multicomponent nanostructures and nanoparticle assemblies. Complex interparticle resonances are formed when plasmon-supporting nanoparticles are assembled into a network.50−53 Previous research has shown different modes can result in distinct nonlinear photon orders.54,55 The use of mode-specific excitation detection correlations provided by FT-NLO spectroscopy of selected nanostructures could provide key insights for understanding plasmon-mediated nonlinear excitation pathways.
As described in section 5, the FT-NLO method has also been used to resolve nonequilibrium semiconductor-to-molecule (MoS2 to polyoxometalates) charge transfer. Charge transfer at heterostructure interfaces is critically important for many applications such as solar energy conversion, catalysis, photonic circuits, and many others. In the case of the MoS2–polyoxometalate heterostructure, interfacial charge transfer resulted in saturable second harmonic generation. Although not readily apparent by conventional SHG microscopy, the saturable SHG effect was unambiguously detected in FT-NLO interferograms.41 Saturable nonlinear optical processes are important elements of photonics applications like laser pulse shaping and modulation, as well as optical limiting technologies. As materials synthesis and fabrication continues to advance to produce increasingly complex heterostructures, measurement techniques capable of providing more detailed photophysical and photochemical mechanisms, such as FT-NLO, will be needed to move materials physical chemistry forward.
In section 6, we demonstrated the use of FT-NLO for label-free super-resolution imaging.22 In this case, Fourier excitation spectra were used to distinguish three different nanorods colocated within the optical diffraction limit of the microscope. This method could be extended to any NLO medium in resonance with the laser excitation field. As described in section 2, excitation energies greater than 15 eV and with resolutions of 6 meV can be achieved based on laser pulse time sequencing. Therefore, FT-NLO should be an effective probe of environmental influences on molecular and nanoparticle resonance energies.
An exciting prospect for future FT-NLO development is super-resolution imaging based on excitation polarization differences. The pulse replica generator can function as a wave plate if the temporally delayed pulses are kept in orthogonal planes.56 For an 800 nm excitation carrier wave, a 670 as delay generates a circularly polarized excitation field. The excitation field can be switched between right and left circular polarization states by choosing either positive or negative delays for the pulse sequence. Elliptical and linear polarization states can also be selected by incrementing the interpulse time delay to appropriate values. This approach has been used to quantify circular dichroism difference ratios for many chiral nanostructures.57−59 Thus, additional information about the polarization-response of the sample may be available in addition to the frequency-dependent response function provided by FT-NLO. In combination with statistical localization analysis, chiroptical and variable-polarization based super-resolution imaging should be possible.
In addition to methodological advances, new prospects on the horizon include the application of FT-NLO to new areas of study. Nearly all examples of FT-NLO thus far have focused on material systems. This is despite the impact that NLO methods including MPPL, SHG, CARS, and SRS have had on the biological sciences in imaging and sensing platforms.1,2,4,60,61 The components of the FT-NLO experiment, which we described in section 2 (Figure 2), should be readily adaptable to conventional multiphoton microscopy platforms, requiring only the addition of a pulse replica generator. We anticipate that as in the materials sciences, the advantages of FT-NLO for characterizing the nonlinear pathways and photon order of the signal will prove useful to researchers in the life sciences. Particularly, the ability to perform wide-field hyperspectral nonlinear imaging through FT-NLO, as discussed in section 6, may offer opportunities to image multiple nonlinear signals simultaneously within a single field of view and to visualize spectral shifts corresponding to changes in local chemical environments.
In summary, FT-NLO spectroscopy provides an incisive experimental tool for studying photophysical and photochemical processes in complex molecules, nanoparticles, and multicomponent materials. In many instances, the FT component unambiguously resolves mechanistic details that would be obscured by conventional methods. Recent breakthroughs in statistical localization of interferometric NLO data sets open exciting new possibilities for multiparameter and label-free super-resolution imaging.
Acknowledgments
This work was supported the U.S. Air Force Office of Scientific Research, Grant Nos. FA9550-18-1-0347 and FA9550-22-1-0402, and the National Science Foundation (Award Nos. CHE-1807999 and DGE1255832).
Glossary
Vocabulary
- nonlinear optics
the field of study of the interaction of multiple electromagnetic fields with a material
- nonlinear susceptibility, χ(n)
a physical property of a material or molecule that relates the incident electromagnetic field strength to the induced polarizability; the nonlinear susceptibility for an nth-order process is expressed as a tensor of rank n + 1 and has units of (m/V)n−1
- parametric
a class of nonlinear optical processes that leave the material or molecule in the initial quantum state and for which energy and momentum are conserved; frequency mixing processes, such as harmonic generation and sum and difference frequency generation are common examples
- nonparametric
a class of nonlinear optical processes that change the quantum state of the material or molecule; examples include multiphoton absorption and photoluminescence
- second harmonic generation (SHG)
the parametric conversion of two incident photons of one (fundamental) wavelength to one harmonic photon at twice the fundamental energy; this process requires structural symmetry breaking
- multiphoton photoluminescence
nonparametric spontaneous radiation emission that follows multiphoton absorption of a sample
- Fourier transform
as used here, a mathematical operation that converts time-domain data to a frequency output
- diffraction limit
the minimum spot size to which an electromagnetic wave can be focused; for conventional far-field optical measurements, this determines the limit of spatial resolution between two radiation point sources
Author Present Address
† California Institute for Quantitative Biosciences, University of California, Berkeley, CA 94720, United States
Author Contributions
The manuscript was written through contributions of all authors. All authors have given approval to the final version of the manuscript. CRediT: Megan A. Steves conceptualization (supporting), data curation (lead), formal analysis (lead), investigation (equal), methodology (supporting), validation (equal), visualization (equal), writing-original draft (equal), writing-review & editing (equal); Kenneth L. Knappenberger conceptualization (lead), data curation (supporting), formal analysis (supporting), funding acquisition (lead), investigation (supporting), methodology (supporting), project administration (lead), resources (lead), supervision (lead), validation (supporting), visualization (supporting), writing-original draft (equal), writing-review & editing (equal).
The authors declare no competing financial interest.
References
- Zipfel W. R.; Williams R. M.; Webb W. W. Nonlinear Magic: Multiphoton Microscopy in the Biosciences. Nat. Biotechnol. 2003, 21 (11), 1369–1377. 10.1038/nbt899. [DOI] [PubMed] [Google Scholar]
- Min W.; Freudiger C. W.; Lu S.; Xie X. S. Coherent Nonlinear Optical Imaging: Beyond Fluorescence Microscopy. Annu. Rev. Phys. Chem. 2011, 62, 507–530. 10.1146/annurev.physchem.012809.103512. [DOI] [PMC free article] [PubMed] [Google Scholar]
- Hoover E. E.; Squier J. A. Advances in Multiphoton Microscopy Technology. Nature Photonics 2013 7:2 2013, 7 (2), 93–101. 10.1038/nphoton.2012.361. [DOI] [PMC free article] [PubMed] [Google Scholar]
- Brasselet S. Polarization-Resolved Nonlinear Microscopy: Application to Structural Molecular and Biological Imaging. Advances in Optics and Photonics, Vol. 3, Issue 3, pp. 205 2011, 3 (3), 205. 10.1364/AOP.3.000205. [DOI] [Google Scholar]
- van der Veen M. A.; Vermoortele F.; de Vos D. E.; Verbiest T. Point Group Symmetry Determination via Observables Revealed by Polarized Second-Harmonic Generation Microscopy: (1) Theory. Anal. Chem. 2012, 84 (15), 6378–6385. 10.1021/ac300936q. [DOI] [PubMed] [Google Scholar]
- Madden J. T.; Hall V. J.; Simpson G. J. Mining the Polarization-Dependence of Nonlinear Optical Measurements. Analyst 2011, 136, 652–662. 10.1039/C0AN00238K. [DOI] [PubMed] [Google Scholar]
- Bellini M.; Bartoli A.; Hänsch T. W. Two-Photon Fourier Spectroscopy with Femtosecond Light Pulses. Opt. Lett. 1997, 22 (8), 540. 10.1364/OL.22.000540. [DOI] [PubMed] [Google Scholar]
- Hartland G. v.; Felker P. M. High Spectral Resolution in Coherent Raman Scattering Using Broad-Band, Nanosecond-Pulsed Sources and Nonlinear Interferometry. J. Phys. Chem. 1987, 91 (22), 5527–5531. 10.1021/j100306a004. [DOI] [Google Scholar]
- Scherer N. F.; Carlson R. J.; Matro A.; Du M.; Ruggiero A. J.; Romero-Rochin V.; Cina J. A.; Fleming G. R.; Rice S. A. Fluorescence-Detected Wave Packet Interferometry: Time Resolved Molecular Spectroscopy with Sequences of Femtosecond Phase-Locked Pulses. J. Chem. Phys. 1991, 95 (3), 1487–1511. 10.1063/1.461064. [DOI] [Google Scholar]
- McMorrow D.; Lotshaw W. T. Intermolecular Dynamics in Acetonitrile Probed with Femtosecond Fourier Transform Raman Spectroscopy. J. Phys. Chem. 1991, 95 (25), 10395–10406. 10.1021/j100178a029. [DOI] [Google Scholar]
- Tokunaga E.; Kobayashi T.; Terasaki A. Frequency-Domain Interferometer for Femtosecond Time-Resolved Phase Spectroscopy. Opt. Lett. 1992, 17 (16), 1131–1133. 10.1364/OL.17.001131. [DOI] [PubMed] [Google Scholar]
- Anderson A.; Deryckx K. S.; Xu X. G.; Steinmeyer G.; Raschke M. B. Few-Femtosecond Plasmon Dephasing of a Single Metallic Nanostructure from Optical Response Function Reconstruction by Interferometric Frequency Resolved Optical Gating. Nano Lett. 2010, 10 (7), 2519–2524. 10.1021/nl101090s. [DOI] [PubMed] [Google Scholar]
- Lamprecht B.; Leitner A.; Aussenegg F. R.. Femtosecond Decay-Time Measurement of Electron-Plasma Oscillation in Nanolithographically Designed Silver Particles; Springer-Verlag, 1997; Vol. 64. [Google Scholar]
- Lamprecht B.; Krenn J. R.; Leitner A.; Aussenegg F. R. Resonant and Off-Resonant Light-Driven Plasmons in Metal Nanoparticles Studied by Femtosecond-Resolution Third-Harmonic Generation. Phys. Rev. Lett. 1999, 83 (21), 4421–4424. 10.1103/PhysRevLett.83.4421. [DOI] [Google Scholar]
- Simon M.; Träger F.; Assion A.; Lang B.; Voll S.; Gerber G. Femtosecond Time-Resolved Second-Harmonic Generation at the Surface of Alkali Metal Clusters. Chem. Phys. Lett. 1998, 296 (5–6), 579–584. 10.1016/S0009-2614(98)01073-2. [DOI] [Google Scholar]
- Liau Y.-H.; Unterreiner A. N.; Chang Q.; Scherer N. F. Ultrafast Dephasing of Single Nanoparticles Studied by Two-Pulse Second-Order Interferometry. J. Phys. Chem. B 2001, 105 (11), 2135–2142. 10.1021/jp002831x. [DOI] [Google Scholar]
- Jarrett J. W.; Zhao T.; Johnson J. S.; Knappenberger K. L. Investigating Plasmonic Structure-Dependent Light Amplification and Electronic Dynamics Using Advances in Nonlinear Optical Microscopy. J. Phys. Chem. C 2015, 119 (28), 15779–15800. 10.1021/acs.jpcc.5b02494. [DOI] [Google Scholar]
- Zhao T.; Jarrett J. W.; Johnson J. S.; Park K.; Vaia R. A.; Knappenberger K. L. Plasmon Dephasing in Gold Nanorods Studied Using Single-Nanoparticle Interferometric Nonlinear Optical Microscopy. J. Phys. Chem. C 2016, 120 (7), 4071–4079. 10.1021/acs.jpcc.5b11008. [DOI] [Google Scholar]
- Zhao T.; Steves M. A.; Chapman B. S.; Tracy J. B.; Knappenberger K. L. Quantification of Interface-Dependent Plasmon Quality Factors Using Single-Beam Nonlinear Optical Interferometry. Anal. Chem. 2018, 90, 13702–13707. 10.1021/acs.analchem.8b04101. [DOI] [PubMed] [Google Scholar]
- Schmidt S.; Mascheck M.; Silies M.; Yatsui T.; Kitamura K.; Ohtsu M.; Lienau C. Distinguishing between Ultrafast Optical Harmonic Generation and Multi-Photon-Induced Luminescence from ZnO Thin Films by Frequency-Resolved Interferometric Autocorrelation Microscopy. Opt Express 2010, 18 (24), 25016. 10.1364/OE.18.025016. [DOI] [PubMed] [Google Scholar]
- Zhong J.-H.; Vogelsang J.; Yi J.-M.; Wang D.; Wittenbecher L.; Mikaelsson S.; Korte A.; Chimeh A.; Arnold C. L.; Schaaf P.; Runge E.; Huillier A. L.; Mikkelsen A.; Lienau C. Nonlinear Plasmon-Exciton Coupling Enhances Sum-Frequency Generation from a Hybrid Metal/Semiconductor Nanostructure. Nat. Commun. 2020, 11 (1), 1464. 10.1038/s41467-020-15232-w. [DOI] [PMC free article] [PubMed] [Google Scholar]
- Steves M. A.; Knappenberger K. L. Achieving Sub-Diffraction Spatial Resolution Using Combined Fourier Transform Spectroscopy and Nonlinear Optical Microscopy. J. Chem. Phys. 2022, 156 (2), 021101. 10.1063/5.0069944. [DOI] [PubMed] [Google Scholar]
- Hamm P.; Zanni M. T.. Concepts and Methods of 2D Infrared Spectroscopy; Cambridge University Press: Cambridge, 2011. [Google Scholar]
- Coherent Multidimensional Spectroscopy; Cho M., Ed.; Springer Series in Optical Sciences; Springer Singapore: Singapore, 2019; Vol. 226; 10.1007/978-981-13-9753-0. [DOI] [Google Scholar]
- Isobe K.; Suda A.; Tanaka M.; Kannari F.; Kawano H.; Mizuno H.; Miyawaki A.; Midorikawa K. Fourier-Transform Spectroscopy Combined with a 5-Fs Broadband Pulse for Multispectral Nonlinear Microscopy. Phys. Rev. A 2008, 77 (6), 063832. 10.1103/PhysRevA.77.063832. [DOI] [Google Scholar]
- Hanke T.; Cesar J.; Knittel V.; Trügler A.; Hohenester U.; Leitenstorfer A.; Bratschitsch R. Tailoring Spatiotemporal Light Confinement in Single Plasmonic Nanoantennas. Nano Lett. 2012, 12 (2), 992–996. 10.1021/nl2041047. [DOI] [PubMed] [Google Scholar]
- Olsson A.; Tang C. L.; Green E. L. Active Stabilization of a Michelson Interferometer by an Electrooptically Tuned Laser. Appl. Opt. 1980, 19 (12), 1897–1899. 10.1364/AO.19.001897. [DOI] [PubMed] [Google Scholar]
- Doswell G.; Kunov H. Active Stabilization System for a Laser Interferometer. Rev. Sci. Instrum. 1990, 61 (7), 1986. 10.1063/1.1141406. [DOI] [Google Scholar]
- Takeno Y.; Yukawa M.; Yonezawa H.; Furusawa A. Observation of −9 DB Quadrature Squeezing with Improvement of Phase Stability in Homodyne Measurement. Opt. Express 2007, 15 (7), 4321–4327. 10.1364/OE.15.004321. [DOI] [PubMed] [Google Scholar]
- Brida D.; Manzoni C.; Cerullo G. Phase-Locked Pulse Pair for Two-Dimensional Spectroscopy by a Birefringent Delay Line. Opt. Lett. 2012, 37 (15), 3027–3029. 10.1364/OL.37.003027. [DOI] [PubMed] [Google Scholar]
- van Exter M.; Lagendijk A. Comment on “Fourier Transform Coherent Raman Spectroscopy. Chem. Phys. Lett. 1988, 146 (5), 482–484. 10.1016/0009-2614(88)87484-0. [DOI] [Google Scholar]
- Ogilvie J. P.; Kubarych K. J.; Alexandrou A.; Joffre M. Fourier Transform Measurement of Two-Photon Excitation Spectra: Applications to Microscopy and Optimal Control. Opt. Lett. 2005, 30 (8), 911–913. 10.1364/OL.30.000911. [DOI] [PubMed] [Google Scholar]
- McGuire J. A.; Beck W.; Wei X.; Shen Y. R. Fourier-Transform Sum-Frequency Surface Vibrational Spectroscopy with Femtosecond Pulses. Opt. Lett. 1999, 24 (24), 1877. 10.1364/OL.24.001877. [DOI] [PubMed] [Google Scholar]
- Hashimoto H.; Isobe K.; Suda A.; Kannari F.; Kawano H.; Mizuno H.; Miyawaki A.; Midorikawa K. Measurement of Two-Photon Excitation Spectra of Fluorescent Proteins with Nonlinear Fourier-Transform Spectroscopy. Appl. Opt. 2010, 49 (17), 3323–3329. 10.1364/AO.49.003323. [DOI] [PubMed] [Google Scholar]
- Isobe K.; Suda A.; Tanaka M.; Kannari F.; Kawano H.; Mizuno H.; Miyawaki A.; Midorikawa K. Fourier-Transform Spectroscopy Combined with a 5-Fs Broadband Pulse for Multispectral Nonlinear Microscopy. Phys. Rev. A 2008, 77 (6), 063832. 10.1103/PhysRevA.77.063832. [DOI] [Google Scholar]
- Diels J.-C. M.; Fontaine J. J.; McMichael I. C.; Simoni F. Control and Measurement of Ultrashort Pulse Shapes (in Amplitude and Phase) with Femtosecond Accuracy. Appl. Opt. 1985, 24 (9), 1270–1282. 10.1364/AO.24.001270. [DOI] [PubMed] [Google Scholar]
- Lamprecht B.; Leitner A.; Aussenegg F. R. SHG Studies of Plasmon Dephasing in Nanoparticles. Appl. Phys. B: Laser Opt. 1999, 68, 419–423. 10.1007/s003400050643. [DOI] [Google Scholar]
- Nishiyama Y.; Imaeda K.; Imura K.; Okamoto H. Plasmon Dephasing in Single Gold Nanorods Observed By Ultrafast Time-Resolved Near-Field Optical Microscopy. J. Phys. Chem. C 2015, 119 (28), 16215–16222. 10.1021/acs.jpcc.5b03341. [DOI] [Google Scholar]
- Stibenz G.; Steinmeyer G. Interferometric Frequency-Resolved Optical Gating. Opt. Express 2005, 13 (7), 2617–2626. 10.1364/OPEX.13.002617. [DOI] [PubMed] [Google Scholar]
- Mascheck M.; Schmidt S.; Silies M.; Yatsui T.; Kitamura K.; Ohtsu M.; Leipold D.; Runge E.; Lienau C. Observing the Localization of Light in Space and Time by Ultrafast Second-Harmonic Microscopy. Nature Photon. 2012, 6, 293. 10.1038/nphoton.2012.69. [DOI] [Google Scholar]
- Steves M. A.; Jawaid A.; Struzyk A.; Torsi R.; Robinson J. A.; Vaia R. A.; Knappenberger K. L. Tenth-Order Multiphoton Excitation and Saturable Second Harmonic Generation in Polyoxometalate-Exfoliated Molybdenum Disulfide. J. Phys. Chem. C 2022, 126 (42), 18036–18046. 10.1021/acs.jpcc.2c05739. [DOI] [Google Scholar]
- Hyyti J.; Perestjuk M.; Mahler F.; Grunwald R.; Güell F.; Gray C.; McGlynn E.; Steinmeyer G. Field Enhancement of Multiphoton Induced Luminescence Processes in ZnO Nanorods. J. Phys. D Appl. Phys. 2018, 51 (10), 105306. 10.1088/1361-6463/aaaabe. [DOI] [Google Scholar]
- Wu H. J.; Nishiyama Y.; Narushima T.; Imura K.; Okamoto H. Sub-20-Fs Time-Resolved Measurements in an Apertured near-Field Optical Microscope Combined with a Pulse-Shaping Technique. Applied Physics Express 2012, 5 (6), 062002. 10.1143/APEX.5.062002. [DOI] [Google Scholar]
- Müller M.; Kravtsov V.; Paarmann A.; Raschke M. B.; Ernstorfer R. Nanofocused Plasmon-Driven Sub-10 Fs Electron Point Source. ACS Photonics 2016, 3 (4), 611–619. 10.1021/acsphotonics.5b00710. [DOI] [Google Scholar]
- Berweger S.; Atkin J. M.; Xu X. G.; Olmon R. L.; Raschke M. B. Femtosecond Nanofocusing with Full Optical Waveform Control. Nano Lett. 2011, 11 (10), 4309–4313. 10.1021/nl2023299. [DOI] [PubMed] [Google Scholar]
- Furusawa K.; Hayazawa N.; Kawata S.; Okamoto T.; Tanaka T. Generation of Broadband Longitudinal Fields for Applications to Ultrafast Tip-Enhanced near-Field Microscopy. Opt. Express 2011, 19 (25), 25328–25336. 10.1364/OE.19.025328. [DOI] [PubMed] [Google Scholar]
- Imaeda K.; Hasegawa S.; Imura K. Static and Dynamic Near-Field Measurements of High-Order Plasmon Modes Induced in a Gold Triangular Nanoplate. J. Phys. Chem. Lett. 2018, 9 (14), 4075–4081. 10.1021/acs.jpclett.8b01671. [DOI] [PubMed] [Google Scholar]
- Nishiyama Y.; Imura K.; Okamoto H. Observation of Plasmon Wave Packet Motions via Femtosecond Time-Resolved Near-Field Imaging Techniques. Nano Lett. 2015, 15 (11), 7657–7665. 10.1021/acs.nanolett.5b03610. [DOI] [PubMed] [Google Scholar]
- Zhao T.; Steves M. A.; Chapman B. S.; Tracy J. B.; Knappenberger K. L. Quantification of Interface-Dependent Plasmon Quality Factors Using Single-Beam Nonlinear Optical Interferometry. Anal. Chem. 2018, 90 (22), 13702. 10.1021/acs.analchem.8b04101. [DOI] [PubMed] [Google Scholar]
- Prodan E.; Radloff C.; Halas N. J.; Nordlander P. A Hybridization Model for the Plasmon Response of Complex Nanostructures. Science 2003, 302 (5644), 419–422. 10.1126/science.1089171. [DOI] [PubMed] [Google Scholar]
- Lassiter J. B.; Aizpurua J.; Hernandez L. I.; Brandl D. W.; Romero I.; Lal S.; Hafner J. H.; Nordlander P.; Halas N. J. Close Encounters between Two Nanoshells. Nano Lett. 2008, 8 (4), 1212–1218. 10.1021/nl080271o. [DOI] [PubMed] [Google Scholar]
- Knappenberger K. L.; Schwartzberg A. M.; Dowgiallo A. M.; Lowman C. A. Electronic Relaxation Dynamics in Isolated and Aggregated Hollow Gold Nanospheres. J. Am. Chem. Soc. 2009, 131 (39), 13892–13893. 10.1021/ja903086g. [DOI] [PubMed] [Google Scholar]
- Chandra M.; Dowgiallo A. M.; Knappenberger K. L. Two-Photon Rayleigh Scattering from Isolated and Aggregated Hollow Gold Nanospheres. J. Phys. Chem. C 2010, 114 (47), 19971–19978. 10.1021/jp1094905. [DOI] [Google Scholar]
- Zhang Y.; Wen F.; Zhen Y. R.; Nordlander P.; Halas N. J. Coherent Fano Resonances in a Plasmonic Nanocluster Enhance Optical Four-Wave Mixing. Proc. Natl. Acad. Sci. U. S. A. 2013, 110 (23), 9215–9219. 10.1073/pnas.1220304110. [DOI] [PMC free article] [PubMed] [Google Scholar]
- Zhao T.; Li Z.; Park K.; Vaia R. A.; Knappenberger K. L. Photoluminescence of Single Gold Nano Rods Following Nonlinear Excitation. J. Chem. Phys. 2020, 153, 061101. 10.1063/5.0021388. [DOI] [PubMed] [Google Scholar]
- Jarrett J. W.; Liu X.; Nealey P. F.; Vaia R. A.; Cerullo G.; Knappenberger K. L. Communication: SHG-Detected Circular Dichroism Imaging Using Orthogonal Phase-Locked Laser Pulses. J. Chem. Phys. 2015, 142 (15), 151101. 10.1063/1.4918972. [DOI] [PubMed] [Google Scholar]
- Jarrett J. W.; Zhao T.; Johnson J. S.; Liu X.; Nealey P. F.; Vaia R. A.; Knappenberger K. L. Plasmon-Mediated Two-Photon Photoluminescence-Detected Circular Dichroism in Gold Nanosphere Assemblies. J. Phys. Chem. Lett. 2016, 7 (5), 765–770. 10.1021/acs.jpclett.5b02621. [DOI] [PubMed] [Google Scholar]
- Liu X.; Biswas S.; Jarrett J. W.; Poutrina E.; Urbas A.; Knappenberger K. L.; Vaia R. A.; Nealey P. F. Deterministic Construction of Plasmonic Heterostructures in Well-Organized Arrays for Nanophotonic Materials. Adv. Mater. 2015, 27 (45), 7314–7319. 10.1002/adma.201503336. [DOI] [PubMed] [Google Scholar]
- Zhao T.; Knappenberger K. L. Advances in Multi-Dimensional Super-Resolution Nonlinear Optical Microscopy. Advances in Physics: X 2021, 6 (1), 1964378. 10.1080/23746149.2021.1964378. [DOI] [Google Scholar]
- Barad Y.; Eisenberg H.; Horowitz M.; Silberberg Y. Nonlinear Scanning Laser Microscopy by Third Harmonic Generation. Appl. Phys. Lett. 1997, 70 (8), 922–924. 10.1063/1.118442. [DOI] [Google Scholar]
- Campagnola P. J.; Clark H. A.; Mohler W. A.; Lewis A.; Loew L. M. Second-Harmonic Imaging Microscopy of Living Cells. J. Biomed Opt 2001, 6 (3), 277. 10.1117/1.1383294. [DOI] [PubMed] [Google Scholar]


