Abstract
Endometriosis is a common condition associated with debilitating pelvic pain and infertility. A genome-wide association study meta-analysis, including 60,674 cases and 701,926 controls of European and East Asian descent, identified 42 genome-wide significant loci comprising 49 distinct association signals. Effect sizes were largest for stage III/IV disease, driven by ovarian endometriosis. Identified signals explained up to 5.01% of disease variance and regulated expression or methylation of genes in endometrium and blood, many of which were associated with pain perception/maintenance (SRP14/BMF, GDAP1, MLLT10, BSN, NGF). We observed significant genetic correlations between endometriosis and 11 pain-conditions including migraine, back, and multisite chronic pain (MCP), as well as inflammatory conditions including asthma and osteoarthritis. Multi-trait genetic analyses identified substantial sharing of variants associated with endometriosis and MCP/migraine. Targeted investigations of genetically regulated mechanisms shared between endometriosis and other pain-conditions are needed to aid the development of new treatments and facilitate early symptomatic intervention.
Endometriosis is an inflammatory condition occurring in 5–10% of women of reproductive age associated with debilitating pelvic pain and infertility1. It is characterized by the presence of endometrial-like tissue outside the uterus, mainly on pelvic organs. Definitive diagnosis requires visualization of lesions during surgery, resulting in a delay in diagnosis that globally averages 7 years from symptom onset2. Treatments are limited to surgical removal of disease and adhesions, or hormonal treatments which can have problematic side-effects. Endometriosis is a heterogeneous condition, typically classified according to revised American Society of Reproductive Medicine (rASRM) criteria based on surgical visualisation of disease. Stage I/II disease features superficial peritoneal lesions and minimal adhesions, and stage III/IV more extensive disease including cystic ovarian endometriosis (endometrioma), and extensive scarring, fibrosis and adhesions3. Presence of deep endometriosis (lesions with >5mm depth that can infiltrate bowel, ureter, bladder, including rectovaginal lesions) is not accounted for in the rASRM staging algorithm.
Causes of endometriosis remain largely unknown, but the condition has an estimated heritability of ~ 50%4,5 with ~26% estimated due to common genetic variation6. Nine genome-wide association studies (GWAS) of endometriosis in women of European and East Asian ancestry have been reported to date7. The largest comprised 17,045 cases and 191,596 controls and identified 19 distinct associations at genome-wide significance (p<5×10⁻⁸) mapping to 13 loci separated by >1Mb8, together explaining 1.75% of phenotypic variance for endometriosis. Although positional evidence has suggested potential involvement of sex-steroid hormone signalling, WNT signaling, cell adhesion/migration, cell growth/carcinogenesis and inflammation-related pathways, the regulatory effects of most of these loci in tissues relevant to endometriosis have yet to be determined. Moreover, the causal variants driving the identified association signals and their functional involvement in mediating the underlying pathogenic mechanisms are unknown.
Previous GWAS analyses have highlighted that effect sizes of most known risk-variants are larger for rASRM stage III/IV disease3,8, but associations with specific phenotypic characteristics in this broad classification (e.g. cystic ovarian endometriosis (endometrioma), advanced scarring, fibrosis and adhesions) are unclear. Sub-phenotype analyses focused on infertility, pain symptomatology, and surgical phenotypes beyond rASRM stage could help decipher causal mechanisms contributing to various components of the complex underlying pathophysiology and ultimately better targeted treatments.
Here, we report results elucidating the pathogenesis of endometriosis and its association with sub-phenotypes derived from the largest GWAS meta-analysis of endometriosis to date, including 60,674 cases and 701,926 controls of European and East Asian ancestry, followed by fine-mapping of causal variants and comprehensive investigation of their functional effects in endometrium, blood and other relevant tissues, as well as sub-phenotype and comorbidity analyses.
Results
We conducted a meta-analysis of 24 GWAS with a total effective sample size of 206,106 (60,674 cases and 701,926 controls) of European (98%: Europe, USA, Australia), and East Asian (2%: Japan) ancestry. In 12 GWAS, women had surgically confirmed endometriosis including 3,916 with rASRM stage I/II and 4,045 with rASRM stage III/IV disease; in 9 studies, 3,060 cases had known infertility in addition to endometriosis (Supplementary Table 1).
Each GWAS dataset was imputed up to 1000 Genomes (1000G P3v5), Haplotype Reference Consortium (HRC r1.1 2016) or population-specific whole genome sequence data, and standardised quality control was performed (Methods; Supplementary Table 2). Meta-analysis was conducted for 10,401,531 SNPs under a fixed-effects model with inverse-variance weighting for overall, rASRM stage I/II, rASRM stage III/IV and endometriosis associated infertility (Extended Data Fig. 1–2).
GWAS meta-analysis reveals 42 loci for endometriosis
We identified 42 genome-wide significant loci (p<5×10⁻⁸) for overall endometriosis, 31 of which have not been previously reported (Fig. 1, Supplementary Table 3, Extended Data Figs. 1–2); 12 of the 42 loci were significant at a more stringent p<5×10⁻⁹ threshold, suggested as more appropriate for whole genome sequence data. Following earlier observations of a greater genetic contribution to rASRM stage III/IV endometriosis9, we conducted sub-phenotype analyses including rASRM stage III/IV (4,045 cases/379,890 controls), rASRM stage I/II (3,916 cases/184,006 controls) and endometriosis-associated infertility (3,060 cases/242,555 controls). No additional genome-wide association signals were detected in sub-phenotype analyses; of the 42 loci, eight reached genome-wide significance for stage III/IV, one for endometriosis-associated infertility but none for stage I/II. However, lead SNPs at 38/42 genome-wide significant loci showed larger effect sizes in stage III/IV vs. stage I/II analysis, and of these, 6 with non-overlapping 95% confidence intervals between the sub-phenotypes (KDR/4q12, SYNE1/6q25.1, 7p15.2/7p15.2, CDKN2-BAS1/9p21.3, SLC19A2/1q24.2, IGF1/12q23.2) (Fig. 1; Supplementary Table 3; Supplementary Figs. 1–2).
Fig. 1. Circular Manhattan plots for genome-wide association analysis for overall endometriosis, rASRM stage III/IV disease, rASRM stage I/II disease and infertility.
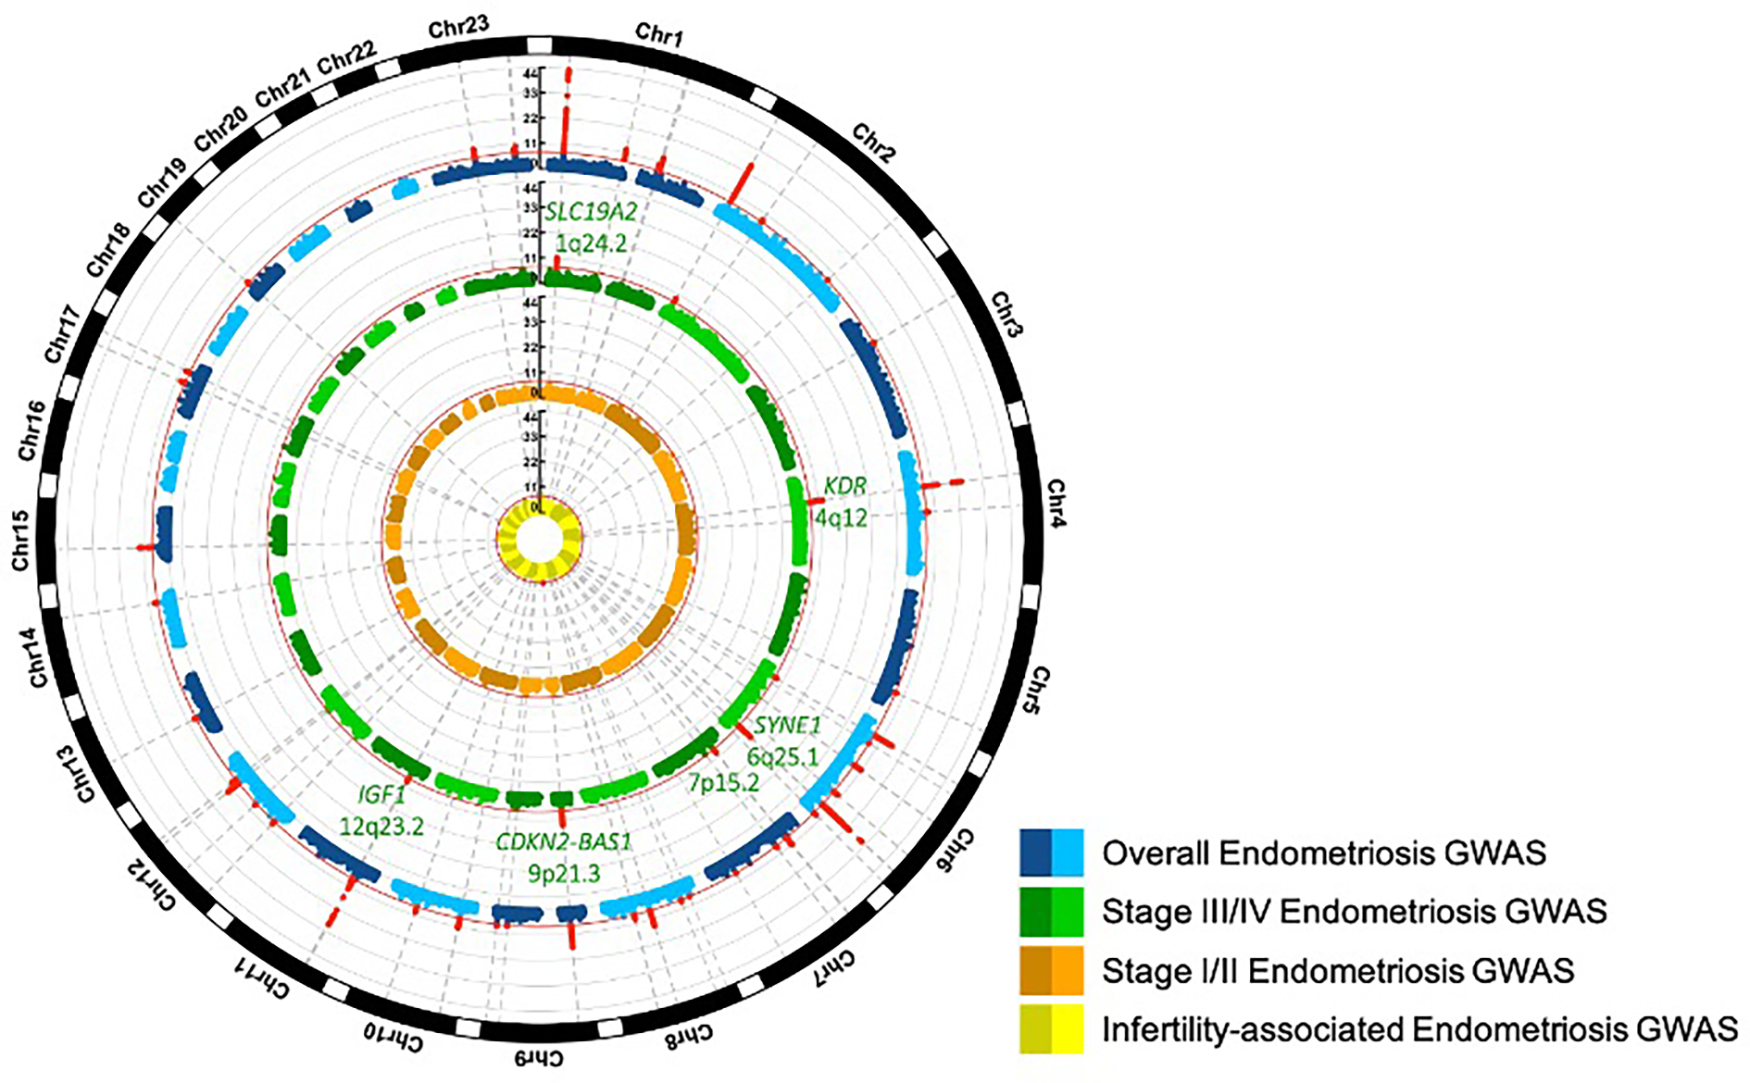
Circular Manhattan plots for genome-wide association analysis for overall endometriosis (blue), revised American Society of Reproductive Medicine (rASRM) stage III/IV disease (green), rASRM stage I/II disease (orange), and endometriosis associated infertility (yellow). Genome-wide significant signals are marked in red and their chromosomal location is denoted with dotted grey lines. The 6 loci with significantly larger effect sizes in rASRM stage III/IV vs. rASRM stage I/II analysis are annotated in green.
Of the 42 genome-wide significant loci, we observed nominally significant between-study heterogeneity for 11 loci (p-overall heterogeneity <0.05, 2.1 loci expected) in the overall endometriosis meta-analysis; for six loci this was explained by case ascertainment and two by ancestry (Supplementary text; Supplementary Tables 4–6; Supplementary Figs 3–5). Sensitivity analyses to test the impact of small datasets and the inclusion of male controls in sex-combined analyses did not alter the results (Supplementary text; Supplementary Table 7, Extended data Figs 1e and 3).
Multiple association signals at endometriosis risk loci
To identify the presence of multiple distinct associations at the 42 genome-wide significant loci, we conducted approximate conditional analysis based on summary meta-analysis results restricted to European ancestry GWAS. Four loci had multiple distinct associations after conditioning (p<5×10⁻⁸; see Methods) including three with two signals (GREB1/2p25.1, CDKN2-BAS1/ 9p21.3, IGF1/12q23.2); and SYNE1/6q25.1 with five signals (Supplementary Table 3). In total, 49 index SNPs representing distinct associations were identified across the 42 endometriosis loci (Supplementary Table 8; Supplementary Fig. 6).
The phenotypic variance for overall endometriosis explained by the 42 lead SNPs was 1.62% vs. 1.98% by the 49 index SNPs. Meta-analysis limited to datasets with surgically/medically ascertained cases, less prone to misclassification bias and potentially including women with more severe symptoms, showed that the 42 lead SNPs explained 3.99% of endometriosis variance, and the 49 index SNPs 4.79%. For stage III/IV disease, the 42 lead SNPs explained 4.10% and 49 index SNPs 5.01% of disease variance (Supplementary Table 9).
Fine-mapping of endometriosis association signals
To identify potential causal variants, we performed fine-mapping based on the European ancestry-specific meta-analysis results; 99% credible sets were constructed assuming a single causal SNP driving each of the 49 distinct association signals (Supplementary Table 10–12; see Methods). For seven association signals, credible SNP sets containing ≤10 SNPs were observed. Fine-mapping uncovered 6 “high-confidence” variants (posterior probability (π) >50% to be causal): rs71575922 in SYNE1 and rs73625113 in ESR1; rs6456259 in LNC-LBCS; rs6970537 in HOXA10 and rs3803042 1kb downstream of HOXC10; and rs73241342 in LINC00629 (Supplementary Table 13). All were in non-coding regions.
Genetic regulation of expression and methylation at endometriosis risk loci
Genes located within ±200kb of each of the 49 index SNPs were enriched for expression in endometrium, smooth muscle (Human Protein Atlas) and uterus (GTex) (see Supplementary text; Extended Data Figs. 4a–d). To identify specific genes regulated by the 49 distinct endometriosis association signals, we analysed four expression quantitative trait loci (eQTL) datasets: 1) a gene expression microarray study of 229 endometrial samples10; 2) a meta-analysis of RNAseq-based eQTL datasets including 368 endometrial samples (11 and Supplementary Tables 34–35; see Methods); 3) RNAseq expression data from 129 uterus tissue samples from GTEx; and 4) data from 31,684 blood samples from the eQTLGen Consortium12. We also associated SNPs in the endometriosis risk regions with DNA methylation of nearby CpG sites in endometrium and blood using previously published mQTL datasets (Supplementary Table 17).13,14
Summary data-based Mendelian Randomisation (SMR)15 was used to identify genes whose expression (eQTL) or methylation (mQTL) levels are associated with endometriosis due to the effects of a common genetic variant (either by direct causal or pleiotropic effects) rather than due to linkage disequilibrium (LD). Table 1 summarises the significant eQTL/mQTL SMR results across endometriosis GWAS loci, together with evidence from chromatin interactions (see Supplementary Text, Supplementary Tables 14–19, and Extended Data Figs 5–6 for detailed results).
Table 1.
Significant SMR results based on eQTL and mQTL analyses in endometrium and blood in identified GWAS loci regions and the respective genes identified through chromatin interactions.
| GWAS locus | SMR identified gene (QTL type, tissue and SMR SNP)* | Genes with chromatin interaction |
|---|---|---|
| WNT4/1p36.12 | WNT4 (mQTL blood, rs55938609) | C1QC, C1QB, C1QA |
| GREB1/2p25.1 | GREB1 (mQTL endometrium, rs59129126) | LPIN1, PDIA6, C2orf50, KCNF1, NTSR2, E2F6, GREB1%, AC092687.4, AC099344.1 |
| GREB1 (mQTL blood, rs59129126) | ||
| BMPR2/2q33.1 | CALCRL (eQTL blood, rs8176580) | SLC40A1, ZSWIM2 |
| CD109/6q13 | CD109 (mQTL blood, rs2917883) | COL12A1 |
| ID4/6p22.3 | LNC-LBCS (eQTL endometrium, rs17483277) | RNF144B |
| HLA-H (eQTL blood, rs147947139) | - | |
| HCG4P6 (eQTL blood, rs147947139) | - | |
| SYNE1/6q25.1 | ESR1 (eQTL blood, rs2941739) | MYCT1 |
| ESR1 (mQTL blood, rs862346) | ||
| SYNE1 (mQTL blood, rs2881823) | IYD, ESR1, CCDC170, MYCT1, VIP, ARMT1, RMND1, ZBTB2 | |
| FAM120B/6q27 | LINC00574 (mQTL blood, rs1532389) | FAM120B, DLL1 |
| 7p15.2/7p15.2 | TRA2A (eQTL endometrium, rs10238290) | OSBPL3, GSDME, KLHL7, IGF2BP3, GPNMB, NUP42, MALSU1, TRA2A, CYCS |
| GDAP1/8q21.11 | GDAP1 (eQTL blood, rs10283076) | PI15 |
| GDAP1 (mQTL blood, rs4567029) | ||
| ABO/9q34.2 | ABO (eQTL blood, rs550057) | GTF3C4, DDX31, CACFD1, SLC2A6, OBP2B, MYMK, FAM163B, ADAMTSL2 |
| MLLT10/10p12.13 | MLLT10 (mQTL blood, rs12251016) | SPAG6, COMMD3, MSRB2, ARL5B, BMI1, MIR1915HG, NSUN6, COMMD3-BMI1 |
| FSHB/11p14.1 | FSHB (mQTL blood, rs11031040) | ARL14EP , BDNF |
| ARL14EP (mQTL blood, rs12271187) | ARL14EP , BDNF | |
| VEZT/12q22 | VEZT (eQTL endometrium, rs7296348) | VEZT , NTN4, EEA1, METAP2, NR2C1, SOCS2, USP44, PLXNC1, SNRPF, CRADD, CEP83, UBE2N, FGD6, NDUFA12, PLEKHG7, LINC02410, AC073655.2 |
| HOXC10/12p13.13 | HOXC-AS2 (mQTL blood, rs3803042) | HOXC8, GPR84, HOXC5, HOXC4 |
| SRP14-AS1/15q15.1 | SRP14 (eQTL endometrium, rs4770) | BMF , EIF2AK4, IVD, KNSTRN, PLCB2, PAK6, BAHD1, DISP2, FSIP1, BUB1B, GPR176, LINC02694, C15orf56, ANKRD63, PHGR1, BUB1B-PAK6 |
| SRP14-AS1 (mQTL blood, rs12441483) | ||
| BMF (mQTL blood, rs7162269) | EIF2AK4, IVD, KNSTRN, PLCB2, PAK6, SRP14, BAHD1, DISP2, FSIP1, BUB1B, GPR176, C15orf56, ANKRD63, PHGR1, BUB1B-PAK6 | |
| SKAP1/17q21.32 | HOXB9 (eQTL endometrium, rs2938475) | COPZ2, NFE2L1, CDK5RAP3, HOXB6, HOXB8, HOXB5, HOXB3, HOXB1, CALCOCO2, SKAP1, PRAC1, HOXB13, ATP5MC1, UBE2Z, HOXB9, TTLL6, HOXB2, HOXB4, SP6, HOXB7 |
| LGALS9B (eQTL blood, rs9912844) | - |
Full SMR results are presented in supplementary tables 15–18.
In bold are genes for which there is also QTL evidence.
Observations that endometriosis risk variants on chromosomes 2p25.1 and 12q22 may function through changes in expression/methylation of GREB1, and VEZT and/or FGD6, respectively, have been reported previously10,11,16. Many of the other potentially causal genes have strong biological support. Notable was the signal for GDAP1 (GDAP1/8q21.11), previously associated with dysmenorrhea severity and neuronal development (Fig. 2)17,18. Rs4567029 regulates methylation of probes near GDAP1 and is in perfect LD with rs10283076 that was identified as the variant regulating GDAP1 expression in blood tissue (Supplementary Table 16). The SRP14-AS1/15q15.1 locus harbored multiple distinct association signals in endometrium and blood and chromatin interaction with BMF (Bcl2 modifying factor) (Fig. 3; Supplementary Tables 15,16,18). BMF encodes for a glycoprotein associated with sex hormone binding globulin and regulating bioavailability of oestrogen and testosterone19. Variants in SRP14 may also affect endometriosis-associated pain genesis and maintenance through regulation of DHEA-sulfate (DHEA-S) levels20. DHEA-S is a neurosteroid functioning as a neurotropin, that can bind and activate nerve growth factor (NGF) and brain-derived neurotrophic factor (BDNF)21,22. BDNF has been shown to regulate the maintenance of chronic pain in various chronic disorders23, and its expression appears increased in the eutopic endometrium of women with endometriosis compared to controls24,25. The expression of NGF, one of our other GWAS loci, has been suggested to partly mediate local nerve density around endometriosis lesions, associated with dyspareunia26.
Fig. 2. GDAP1/8q21.11 regional association results and summary data-based mendelian randomisation (SMR) evidence based on expression (eQTL) and methylation (mQTL) quantitative trait loci data in blood.
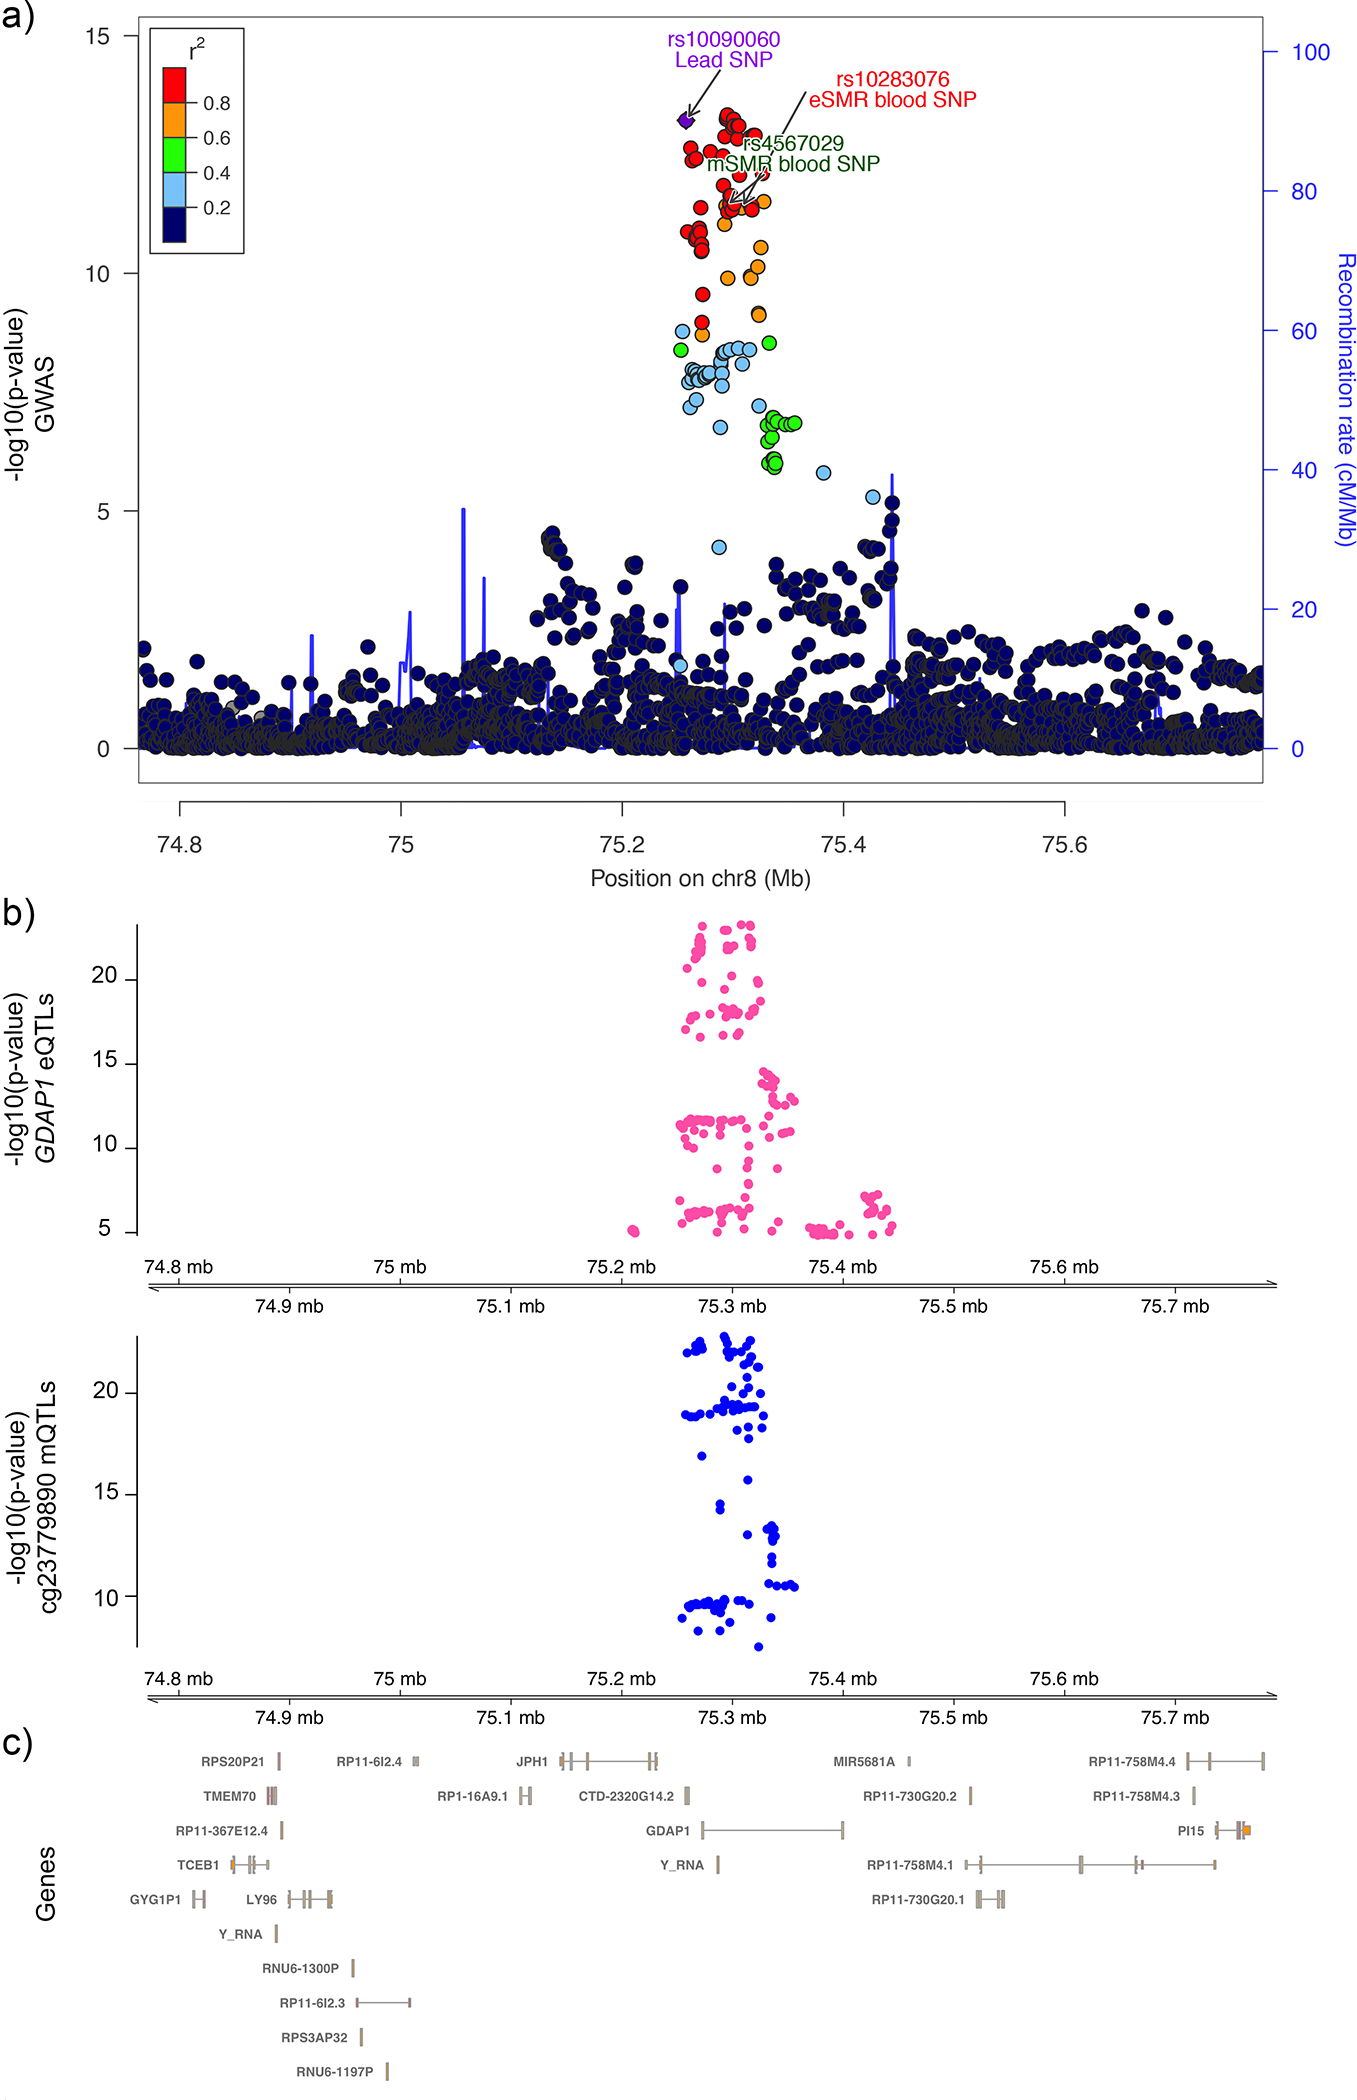
a) Illustration of the regional association plot for the GDAP1/8q21.11 locus. eSMR blood single nucleotide polymorphism (SNP): SMR SNP identified as causal for endometriosis utilizing the eQTL data from blood tissue. mSMR blood SNP: SMR SNP identified as causal for endometriosis utilizing the mQTL data from blood tissue. b) SMR significant blood based eQTL for GDAP1 and mQTL of probe cg23779890 located in GDAP1 gene are shown. c) The genic content and locations for the region are illustrated.
Fig. 3. SRP14-AS1/15q15.1 regional association results and SMR evidence based on eQTL and mQTL data in endometrium and blood.
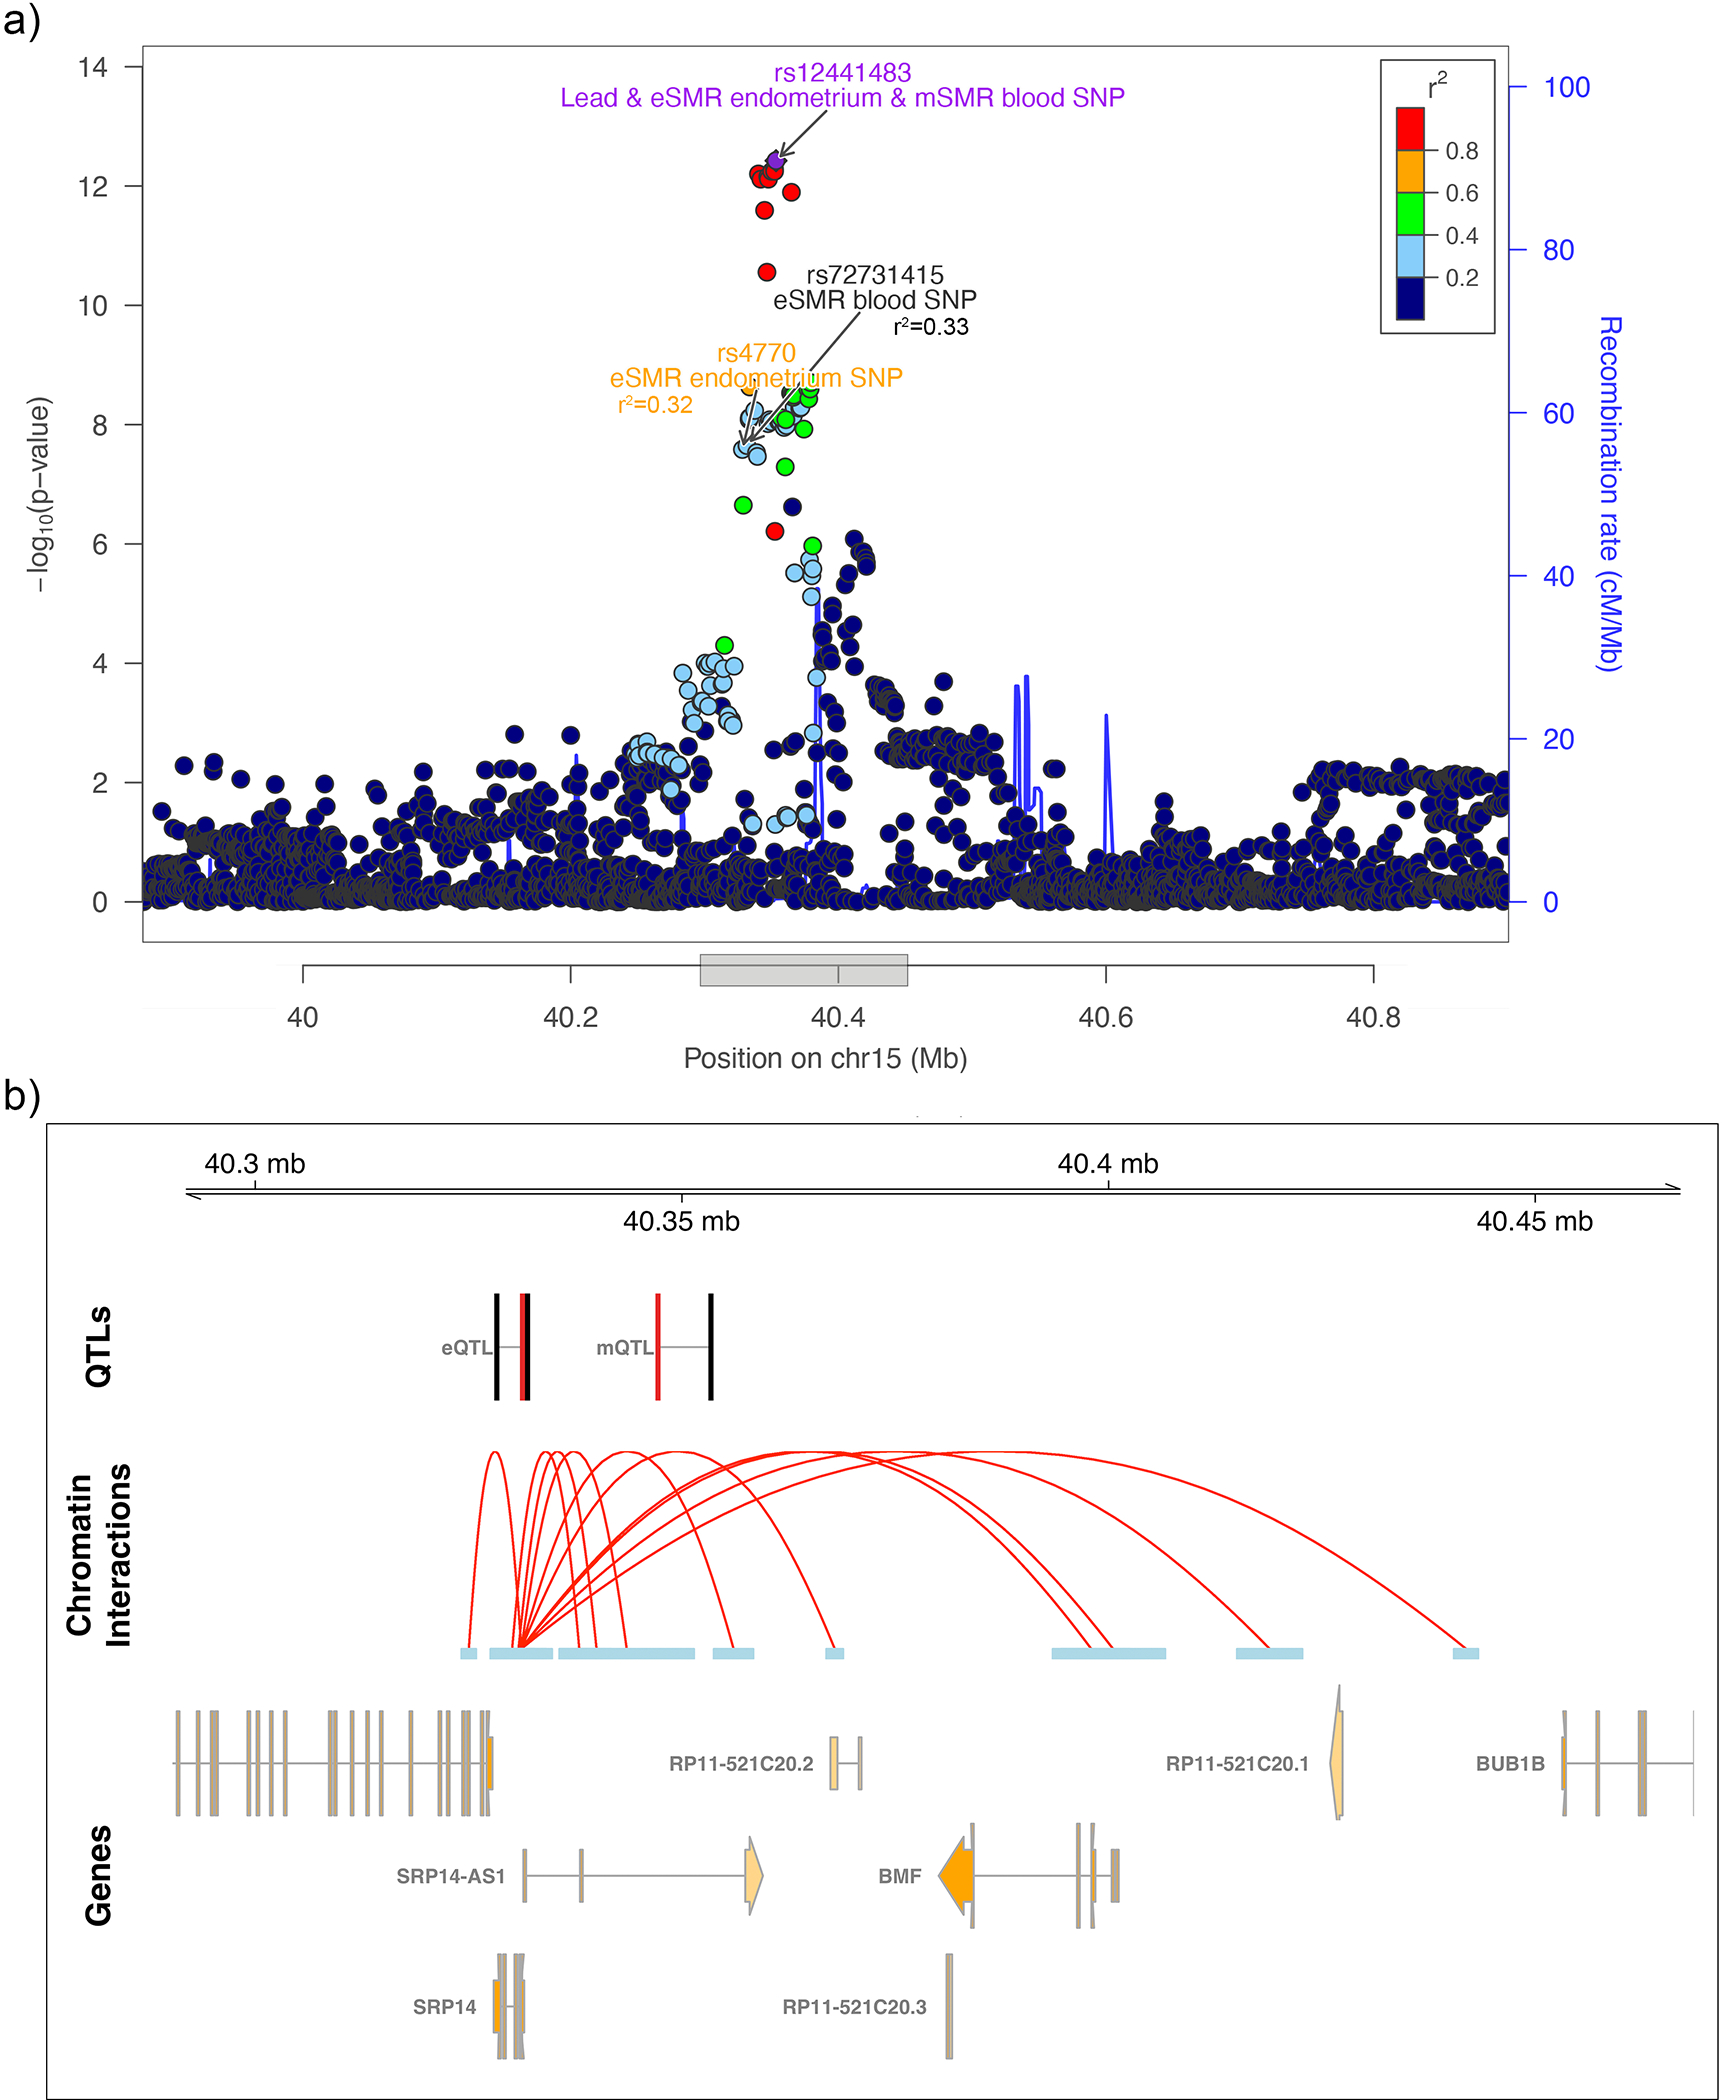
a) Illustration of the regional association plot for the SRP14-AS1/15q15.1 locus. eSMR endometrium SNP: SMR SNP identified as causal for endometriosis utilizing the eQTL data from endometrium; mSMR blood SNP: SMR SNP identified as causal for endometriosis utilising the mQTL data from blood tissue. eSMR blood SNP: SMR SNP identified as causal for endometriosis utilizing the eQTL data from blood tissue. SMR SNPs not passing the HEIDI-heterogeneity test are annotated in black. b) SMR significant eQTLs and mQTLs in the SRP14-AS1/15q15.1 locus along with SRP14 promoter associated chromatin loops with anchor points containing the lead SNP and the SMR SNPs. SMR significant SNPs associated with expression of SRP14 in endometrium and blood (eQTL), methylation at cg27155939 in blood (mQTL), and endometriosis are shown in black and the associated SRP14/CpG target is shown in red. Valid promoter associated chromatin loops were generated from H3K27Ac HiChIP libraries from a normal immortalized endometrial cell line (E6E7hTERT) and three endometrial cancer cell lines (ARK1, Ishikawa and JHUEM-14)68.
We next investigated whether the endometriosis-associated genes identified through SMR analyses (Table 1) are expressed in specific cell types. We used the large GTEx single cell expression database, although this was limited to cellular components from 8 tissues not including endometrium, ovary or blood (see Methods). Of the 23 genes, 18 were expressed in cells included in the GTEx single cell database, (Extended Data Fig. 7). BMF, GDAP1, MLLT10, TRA2A, SRP14, SYNE1, and VEZT and were expressed in neuronal and neuroendocrine cells. CALCRL, MLLT10, SYNE1, TRA2A, and VEZT were expressed in adipocytes, endothelial cells and fibroblasts and a cluster of genes including ARL14EP, ESR1, SYNE1, MLLT10, TRA2A and VEZT were expressed in immune cells, most commonly B cells and T cells. Epithelial cells expressed ABO, ESR1, MLLT10, TRA2A, SRP14, SYNE1, and VEZT.
The SMR results from endometrium and blood implicated several causal genes associated with mechanisms of pain perception and maintenance (SRP14/BMF, GDAP1, MLLT10, BSN, NGF). We next investigated the association of the GWAS loci with sub-phenotypes of endometriosis, including pelvic pain, in more detail.
Sub-phenotype associations at risk loci
Given the generally stronger GWAS associations with rASRM stage III/IV endometriosis (Supplementary Tables 3 and 9), we first explored whether certain surgical or clinical features of endometriosis were driving these associations. We compared effect sizes of the 42 lead SNPs for stage III/IV disease with endometrioma, deep lesions and superficial peritoneal lesions using eight studies (6,502 cases/57,407 controls; Supplementary Table 20) with surgical sub-phenotype information (see Methods). We observed the largest correlation between effect sizes for rASRM stage III/IV disease vs. endometrioma (r=0.73), compared to deep lesions (r=0.42) and superficial peritoneal lesions (r=0.15; Fig. 5). None of the lead SNPs were significantly associated with a surgical sub-phenotype after Bonferroni correction (0.05/42=1.19×10−3); nominal associations (p<0.05) included 7 SNPs for endometrioma, 6 for superficial peritoneal lesions, and 3 for deep lesions (Fig. 5, Supplementary Table 21, Supplementary Fig. 7).
Fig. 5. Correlation of the effect sizes of lead SNPs between rASRM disease stage and surgical subtypes and extended of pelvic pain.
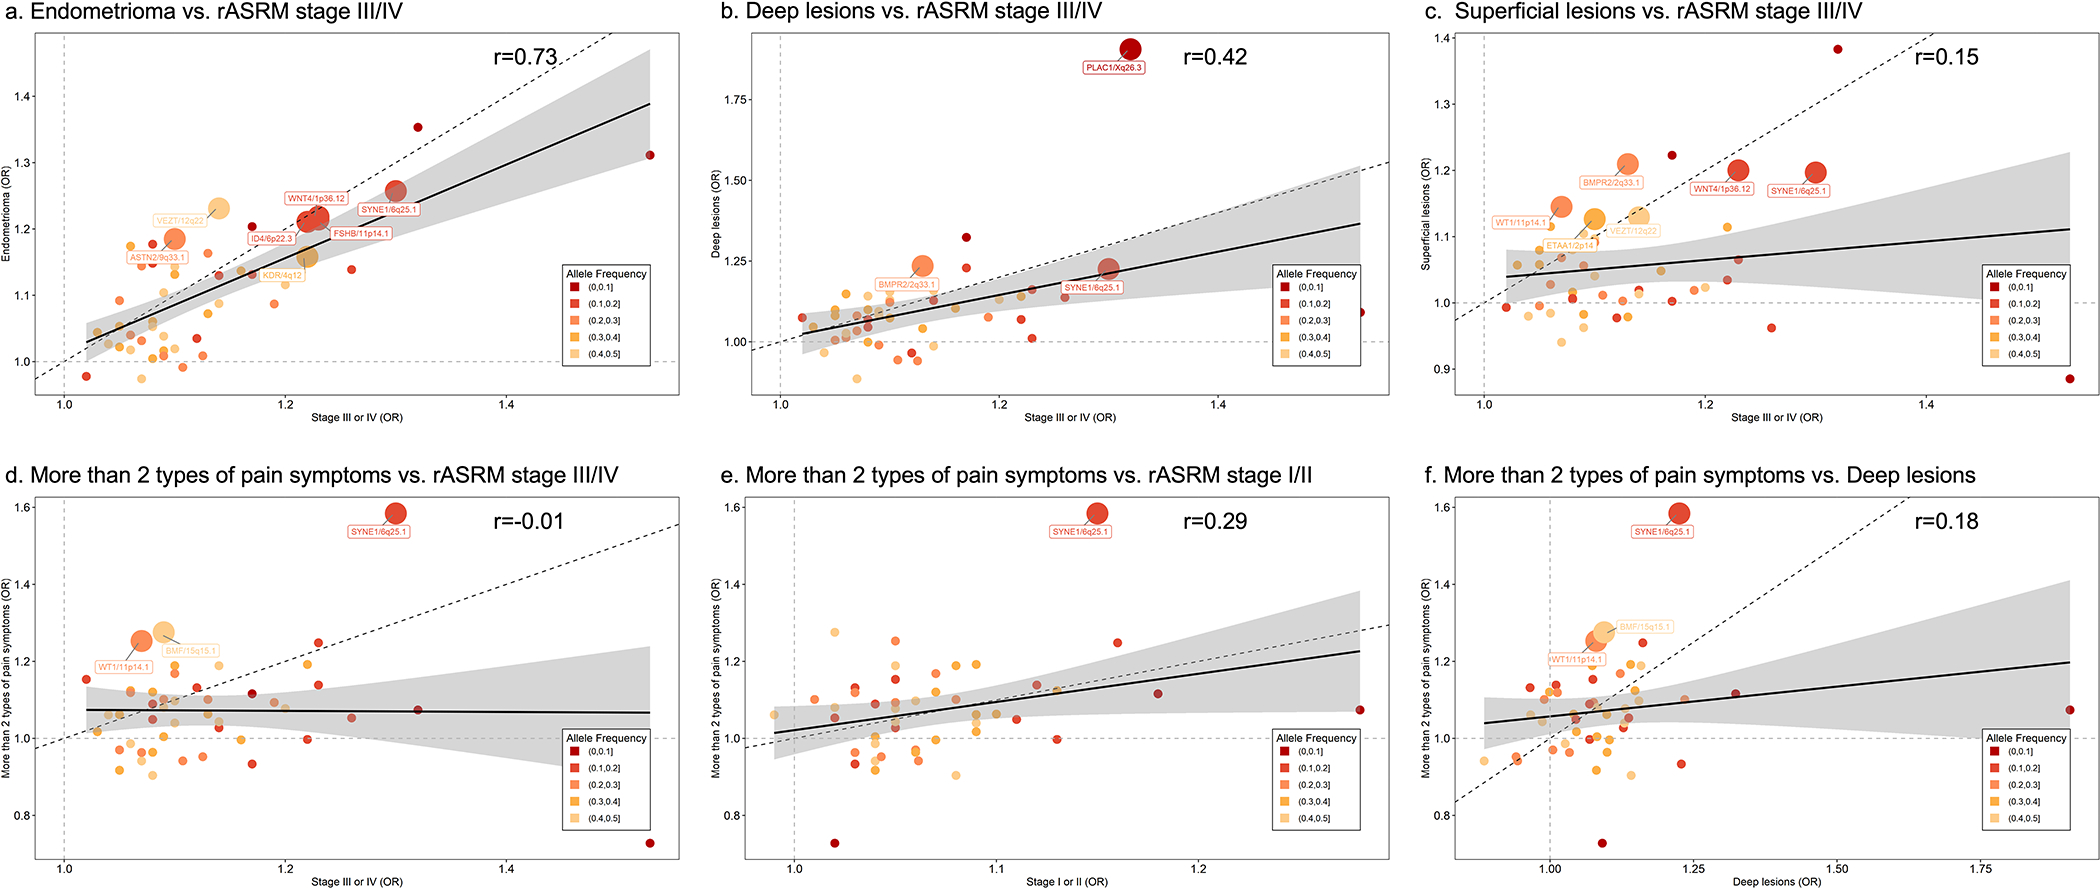
Correlation between the effect sizes of 42 endometriosis associated lead SNPs comparing rASRM stage III/IV disease vs. surgical subtypes (endometrioma; deep lesions; superficial lesions; panels a-c) and rASRM stage I/II, rASRM stage III/IV, deep lesions vs. risk of reporting more than 2 types of pelvic pain (panels d-f). Loci nominally associated (p<0.05) with individual sub-phenotypes are annotated with locus name and larger circles. Circle size represent significance level of correlation: Larger circles have smaller p-values and smaller circles have larger p-values. Solid black line represents the linear regression line, dotted black line is the x=y reference slope, dotted grey lines x=1 and y=1 are reference to odds ratio (OR). The grey error band represents 95% confidence interval. Test statistics including p-values for all the associations are provided in Supplementary Table 21.
When we tested for differences in effect sizes between endometriosis and adenomyosis (the growth of endometrium into the myometrium) for each of the 42 endometriosis lead SNPs (Supplementary Text: Methods/Results), no significant differences were observed (p<1.19×10⁻³, Supplementary Table 22). Moderate correlations in effect sizes were observed between adenomyosis and rASRM stage I/II (r=0.52), superficial lesions (r=0.40) and deep lesions (r=0.31), but low correlations with rASRM stage III/IV (r=0.02) and endometrioma (r2=0.18; Extended Data Fig. 8).
Epidemiological evidence has consistently shown a lack of correlation between rASRM stage III/IV and pelvic pain severity7. Using six studies with pelvic pain sub-phenotype information (Supplementary Table 20; four with World Endometriosis Research Foundation (WERF)-Endometriosis Phenome Harmonisation (EPHect) standardised phenotyping27), the correlation of effect sizes of the 42 lead SNPs between rASRM stages and the number of pelvic pain symptoms as a measure of multi-site pain (see Methods) was weak (Fig. 5; r=0.29 for rASRM I/II vs. r= −0.01 for rASRM III/IV). All five pain types consistently showed stronger correlations in effect sizes with rASRM stage I/II compared to rASRM stage III/IV, particularly dysmenorrhea (rASRM I/II r=0.48 vs. rASRM III/IV r=0.19) (Supplementary Fig. 8). For deep endometriosis (not well captured by rASRM staging), the strongest correlation was also observed with dysmenorrhea (r=0.36; Supplementary Fig. 8) while there was low correlation with acyclic pelvic pain (r=0.21), bladder pain (r=0.18), GI/IBS pain (r=0.18) and none with dyspareunia (r=−0.01).
Of the 42 lead SNPs, two were significantly associated (p<1.19×10⁻³) with pain sub-phenotypes: SYNE1/6q25.1 and WT1/11p14.1 (Supplementary Fig. 8; Supplementary Table 21). The WT1/11p14.1 lead SNP was associated with earlier onset (age <18 years) dysmenorrhea (p=7.86×10⁻⁴, OR=1.57 (1.21–2.04)). WT1 encodes a transcription factor involved in the development of the urogenital system and female fertility28. The lead SNP at SYNE1/6q25.1 was associated with dysmenorrhea (p=5.00×10⁻⁵, OR=1.49 (1.23–1.80)), dyspareunia (p=3.5×10⁻⁴, OR=1.48 (95% CI: 1.19–1.83); severe dyspareunia p=3.17×10⁻⁴, OR=2.07 (95% CI: 1.40–3.08)) and acyclical pelvic pain (p=1.14×10⁻³, OR=1.44 (1.16–1.80)). This locus includes multiple genes involved in sex-steroid hormone signalling, SYNE1, ESR1 and CCDC170, harboring multiple variants previously associated with female hormone-dependent diseases29. We identified two high-confidence variants, rs71575922 (π=0.997) intronic to SYNE1 and rs73625113 (π=0.506) intronic to ESR1, driving two of the five association signals at the SYNE1/6p25.1 locus (Supplementary Table 13). These risk-variants are in strong LD (r2>0.8) with variants driving expression of ESR1 and DNA methylation near ESR1 and SYNE1, and also with rs2941739 identified as a variant regulating ESR1 expression in blood (Table 1; Fig. 4). ESR1 expression has been correlated with expression of seven other genes across this region in endometrium30. Oestrogen is essential for the growth of endometriotic lesions, and affects inflammation, which likely influences endometriosis-associated pain7. In addition to the role of ESR1 in the sex hormone pathway, it also regulates expression of COMT which encodes for a key enzyme (catechol-O-methyltransferase) in catabolic pathways of pain-relevant neurotransmitters such as dopamine, epinephrine, shown to play a role in pain vulnerability and modulation in animal and human studies31–33.
Fig. 4. SYNE1/6q25.1 regional association results with 5 distinct signals and SMR evidence based eQTL and mQTL data in endometrium and blood.
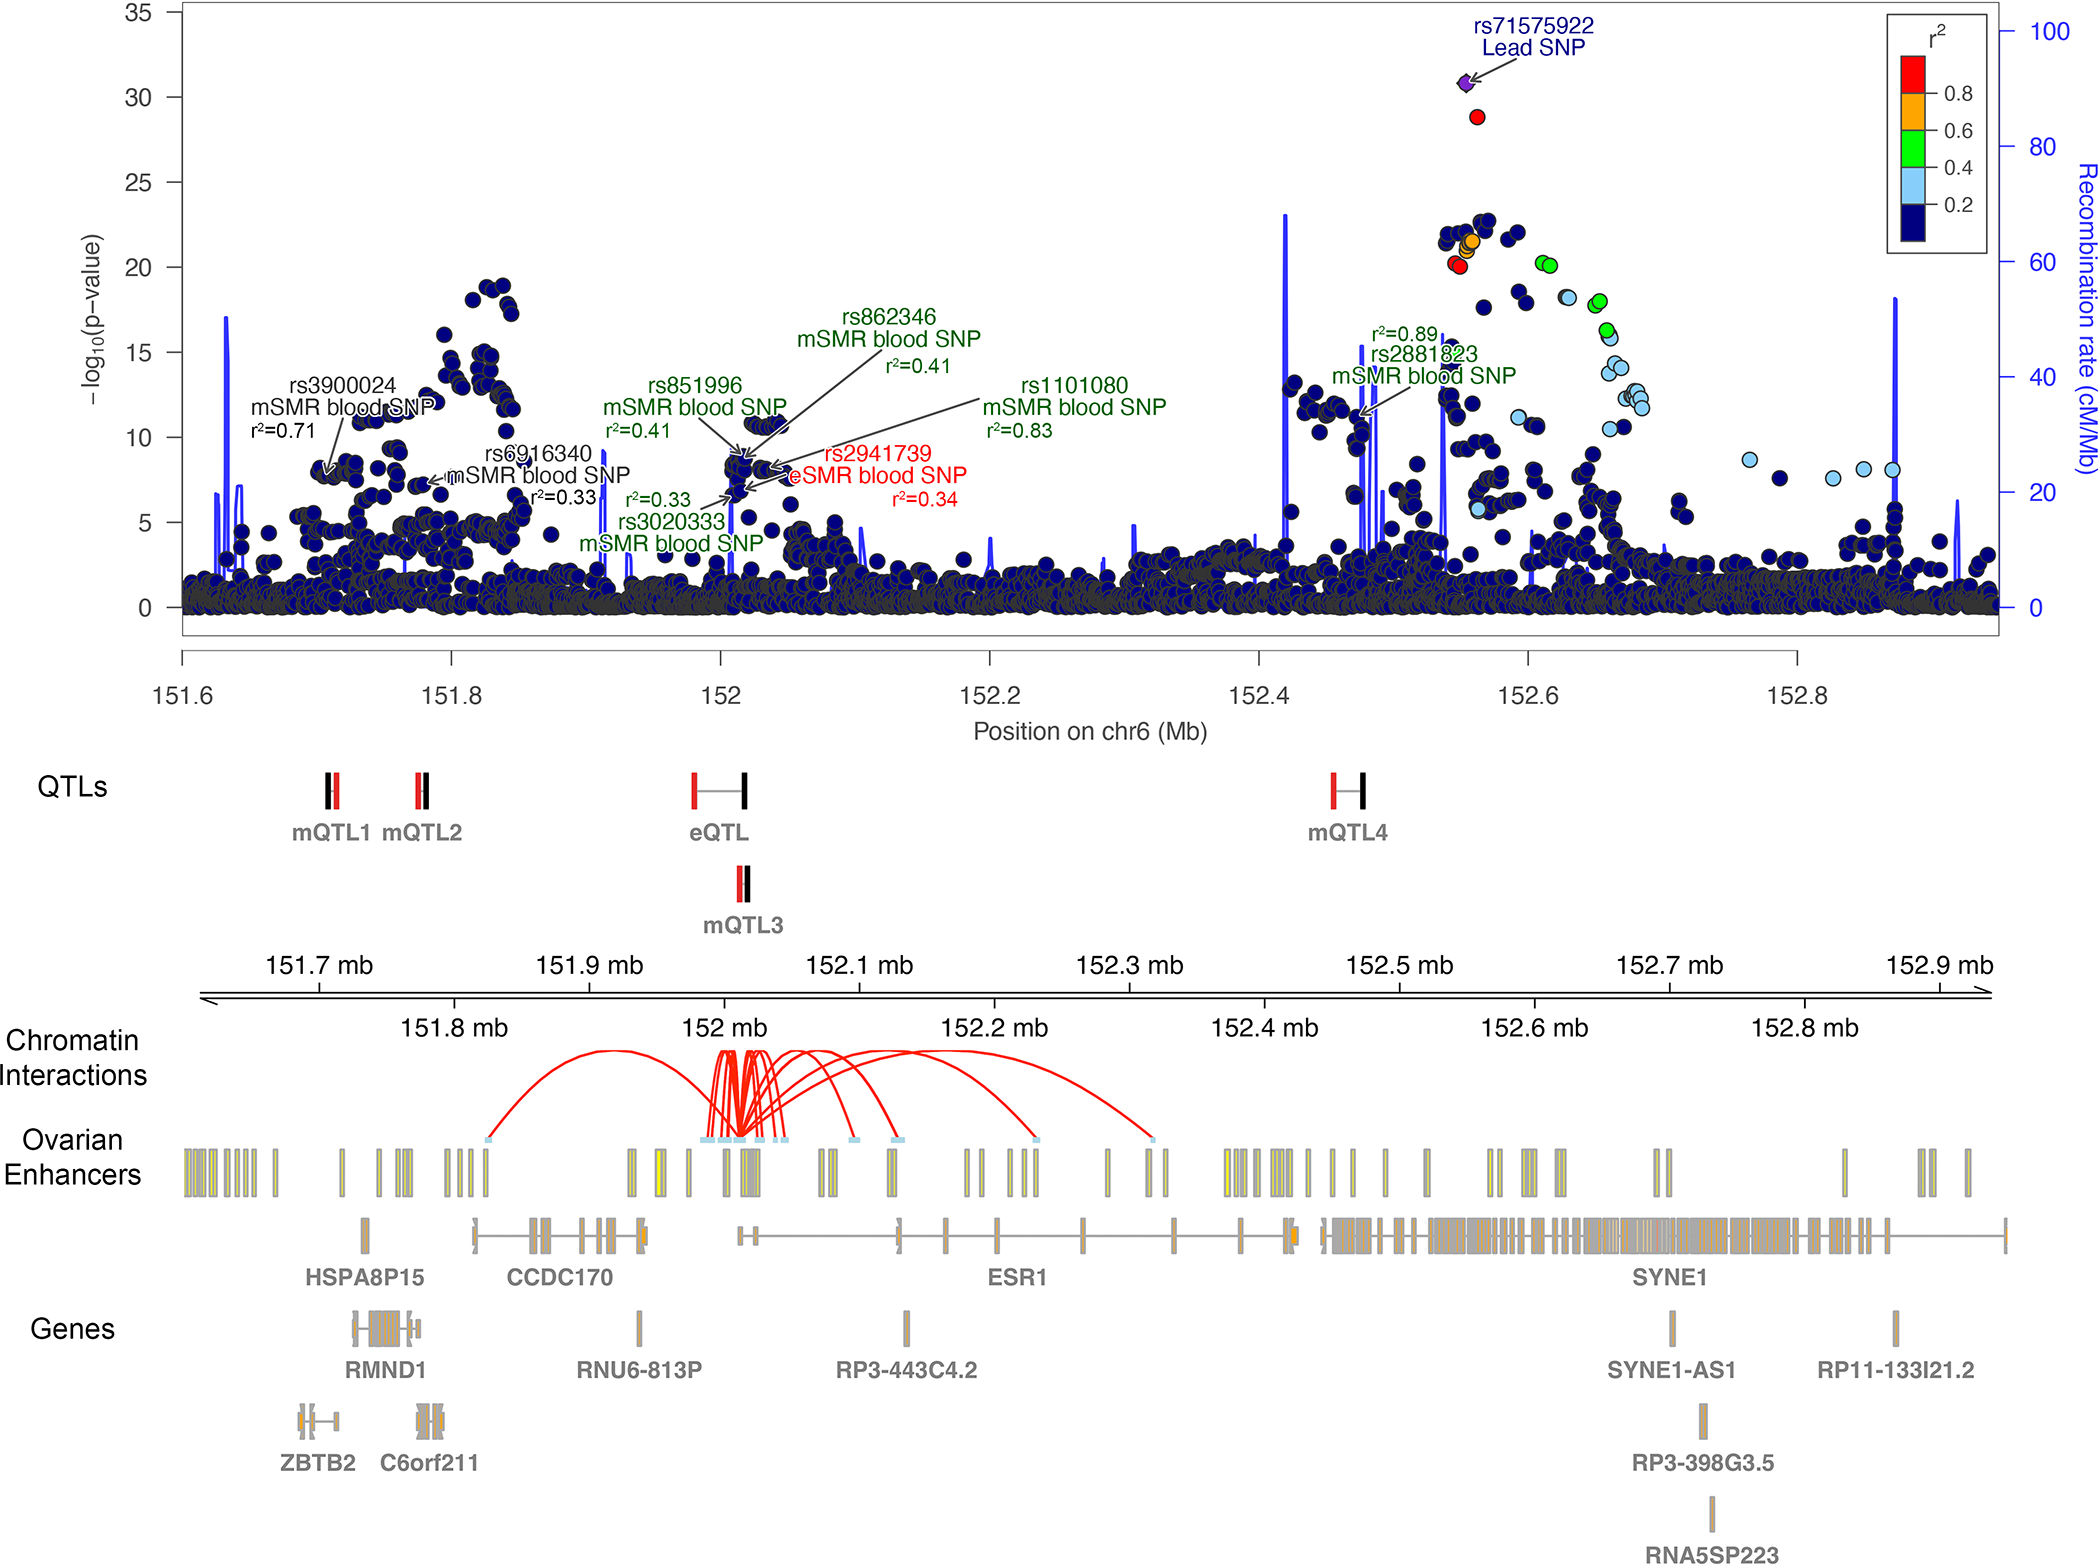
Illustration of the regional association plot for the SYNE1/6q25.1 locus that includes 5 distinct signals from approximate conditional analysis. On the plot are also the SMR significant eQTL and mQTLs from endometrium and blood tissue along with promoter associated chromatin loops with anchor points containing the lead SNP and the SMR SNPs. Multiple distinct signals significantly associated with endometriosis were identified in this region and r2 values displayed are relative to the closest lead SNP. eSMR endometrium SNP: SMR SNP identified as causal for endometriosis utilizing the eQTL data from endometrium; mSMR endometrium SNP: SMR SNP identified as causal for endometriosis utilizing the mQTL data from endometrium; mSMR blood SNP: SMR SNP identified as causal for endometriosis utilising the mQTL data from blood tissue. eSMR blood SNP: SMR SNP identified as causal for endometriosis utilizing the eQTL data from blood tissue. SMR SNPs not passing the HEIDI-heterogeneity test are annotated in black. SMR significant SNPs associated with expression of ESR1 in blood (eQTL), methylation at cg24075332 (mQTL1), cg14416726 (mQTL2), cg18745416 (mQTL3) and cg01066157 (mQTL4) in blood, and endometriosis are shown in black and the associated ESR1/CpG targets are shown in red. Ovarian enhancers were available from the Roadmap Epigenomics Project. Valid promoter associated chromatin loops were generated from H3K27Ac HiChIP libraries from a normal immortalized endometrial cell line (E6E7hTERT) and three endometrial cancer cell lines (ARK1, Ishikawa and JHUEM-14)68.
Lead SNPs at a further 12 loci showed nominal evidence of association (p<0.05) with pain sub-phenotypes including 8 with dysmenorrhea, 6 with dyspareunia, 6 with bladder pain, 4 with acyclical pelvic pain and 3 with GI/IBS pain (Supplementary Table 21). The rs12441483 variant in SRP14-AS1/15q15.1 which functions through regulation of expression of SRP14 gene in blood (Table 1; Supplementary Table 16) was nominally associated (p<0.05) with dysmenorrhea, dyspareunia, acyclic pain, and GI/IBS pain, and with experiencing >2 types of pain (Supplementary Table 21). These analyses revealed many biologically interesting candidate regions for pain development and maintenance in endometriosis that require further exploration in larger datasets and other ancestry groups.
Genetic correlation: Endometriosis and other conditions
Endometriosis has been associated with a wide range of reproductive, metabolic, immune/inflammatory, and other chronic pain comorbidities1. To investigate the potential for a shared biological basis underlying these phenotypes, we estimated genetic correlations (rg) between endometriosis and 32 traits/diseases with European ancestry-based GWAS results available using LD score regression (LDSC)34,35. Sample sizes for the GWAS varied from 4,533 cases for coeliac disease to 98,389 cases for back pain (Supplementary Table 23).
Of nine immune/inflammatory conditions tested, asthma (rg=0.17, p=6.41×10⁻⁴), and osteoarthritis (rg=0.24, p=2.50×10⁻⁸) showed significant (Bonferroni correction, p<1.67×10⁻³) positive genetic correlations with endometriosis, suggesting a likely shared genetic component. Using the data available, none of the autoimmune conditions showed significant genetic correlation with endometriosis (Fig. 6, Supplementary Table 24).
Fig. 6. Genetic correlation between endometriosis and 32 immune/inflammatory, pain, reproductive, and metabolic traits/conditions.
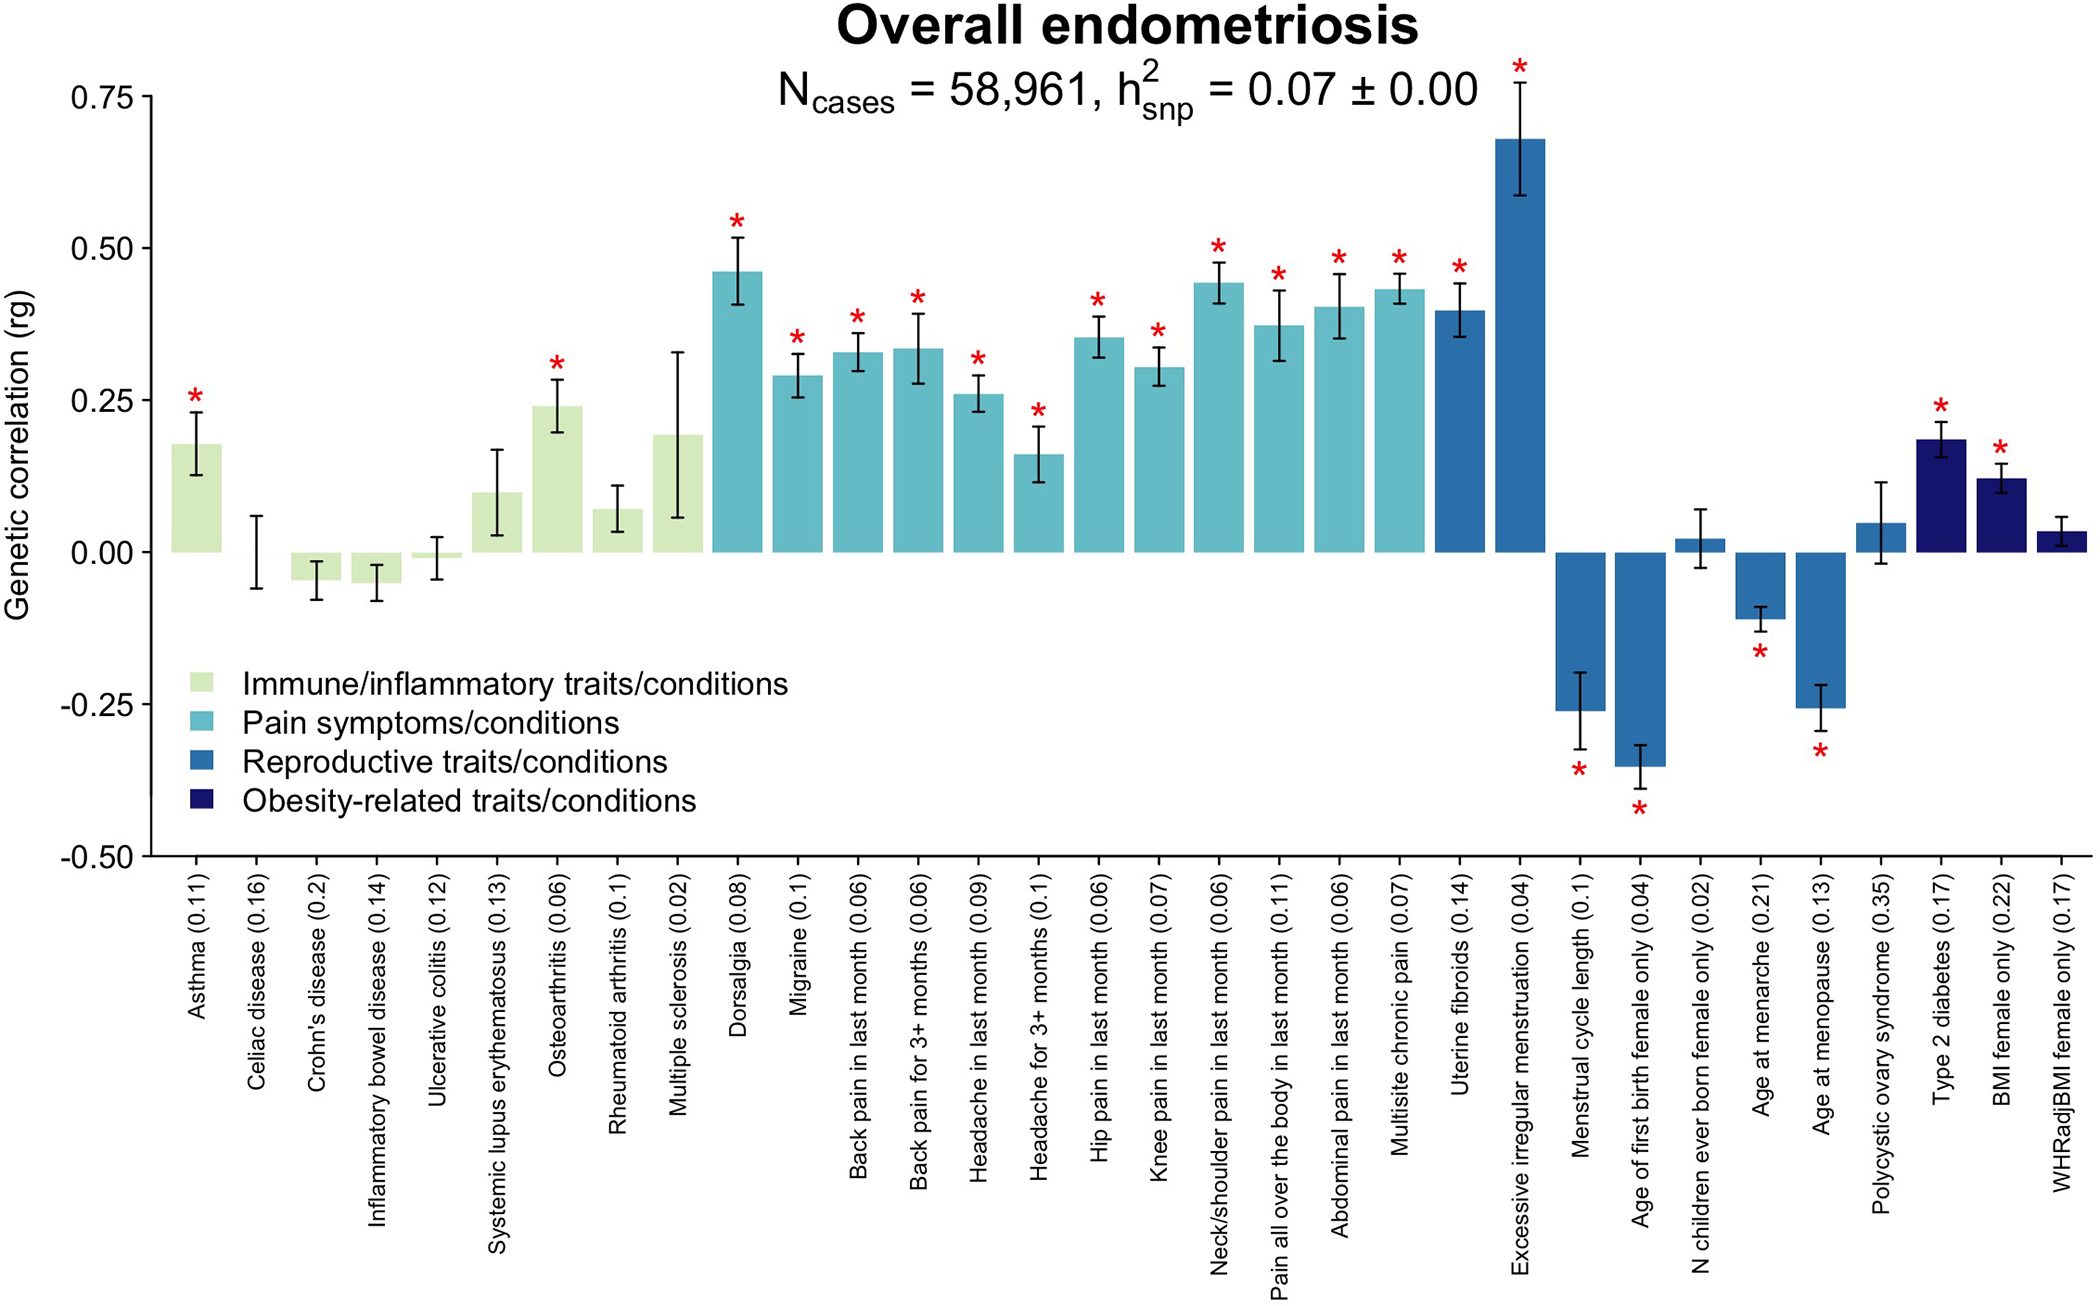
Genetic correlation between endometriosis and 32 immune/inflammatory, pain, reproductive, and metabolic traits/conditions using linkage disequilibrium score regression analysis (LDSC). Heritability of each trait is noted in parenthesis on the x-axis. The significance threshold is adjusted for multiple testing using Bonferroni correction. Significant (p<1.56×10⁻³) correlations are denoted with a red asterisk (*). Bars present the genetic correlation (rg) for each trait in relation to endometriosis and the error bars are standard errors. The exact p-values are provided in Supplementary Table 24.
Significant genetic correlation between endometriosis and excessive/irregular menstruation (rg=0.69, p=8.14×10⁻¹⁴), shorter cycle length (rg=−0.26, p=6.65×10⁻⁵), earlier age at menarche (rg=−0.11, p=8.96×10⁻⁸) and risk of uterine fibroids (rg=0.40, p=3.54×10⁻¹⁹) was observed, confirming previous epidemiological findings and consistent with increased exposure to menstruation and hormones36,37,38. Earlier age at natural menopause (rg=−0.25, p=6.09×10⁻¹¹) and younger age at first birth (rg=−0.35, p=1.11×10⁻²²) were also genetically correlated with risk of endometriosis (Fig. 6). Age at first birth is a complex trait influenced by both sociological and biological factors, including oestrogen regulation and age at menarche, which could explain the association observed39.
The increased prevalence of other pain conditions among women with endometriosis-associated pelvic pain has been well recognised40,41. The experience of dysmenorrhea and acyclic pelvic pain symptoms associated with endometriosis is associated with sensitization of the nervous system40,42–44, increasing the risk of other pain conditions, and this sensitization - or a susceptibility to developing it - could be genetically mediated. We investigated the genetic correlation between endometriosis and 12 different pain conditions available from the UK Biobank (Fig. 6, Supplementary Table 24). All showed significant (p<1.56×10⁻³) positive correlations with endometriosis, including migraine (rg=0.29, p=1.05×10⁻¹⁶), headache (rg=0.26, p=4.88×10⁻¹⁷), dorsalgia (rg=0.45, p=9.52×10⁻¹⁶), multi-site chronic pain (rg=0.43, p=5.19×10−71) and chronic back pain (rg=0.33, p=2.89×10⁻²⁴) Restricting the analysis to women with surgical and/or medically confirmed endometriosis (N=8,390) did not alter the results (Extended Data Fig. 9, Supplementary Table 25). Analysis of the genetic correlation of endometriosis and 19 brain imaging phenotypes from 7,916 up to 8,427 women in the UK Biobank45 provided no evidence that the shared susceptibility between endometriosis and other pain conditions is regulated through genetically underpinned alterations in brain structure or resting state activity (rg −0.12 to 0.23, with 17/19 < |0.1|), although we recognise that power is low (Extended Data Fig. 10, Supplementary Table 26–28).
We investigated if endometriosis-associated variants in the 99% credible sets for each distinct endometriosis signal were associated with any of the genetically correlated traits/conditions at genome-wide significance, using Phenoscanner and GWAS Catalog46. This revealed 10 genome-wide significant variants shared with 11 different traits and conditions (Supplementary Table 29). Three variants were shared with pain traits: rs1352889 at BSN/3p21.31 and rs10828249 at MLLT10/10p12.31 with multi-site chronic pain; and rs12030576 at NGF/1p13.2 with migraine and dysmenorrhea. Loci shared with uterine fibroids (3), menstrual cycle length (2), age at menarche (1), age at menopause (1), BMI (2), type 2 diabetes (1), and asthma (1) are discussed in Supplementary Text. Detailed genomic enrichment analyses for endometriosis with each of these traits and conditions is required to fully elucidate the biological basis for their genetic correlations.
Multi-trait analysis: Endometriosis and pain conditions
We conducted multi-trait analysis of GWAS (MTAG) between endometriosis and two of the most strongly genetically correlated pain traits with large-scale GWAS data available: multi-site chronic pain (MCP) (rg=0.43) and migraine (rg=0.29). The MTAG methodology leverages genetic correlation between traits to improve power to detect association in genome-wide analyses47. The MTAG analysis identified 52 genome-wide significant lead SNPs for endometriosis, 18 of which were not reported in our single trait meta-analysis (Supplementary Table 30); 12 MCP and/or migraine-associated lead SNPs mapped within 500Kb of endometriosis lead SNPs, 9 of which were tagging the same signal (r2>0.5) (Table 2). Four of the 12 were shared across all three conditions (RAB9BP1/5q21.2, MLLT10/10p12.31, OLFM4/13q14.3, NOL4L/20q11.21), 6 between endometriosis and MCP (FAF1/1p32.3, PAPPA2/1q25.2, AFF3/2q11.2, BSN/3p21.31, JADE2/5q31.1, PTPRO/12p12.3) and 2 between endometriosis and migraine (NGF/1p13.2, FSHB/11p14.1) (Table 2).
Table 2.
Lead SNPs mapping within 500Kb for endometriosis and pain traits (multi-site chronic pain and migraine) from MTAG analysis.
| Locus | Traits% | SNP | Chr | Position (bp) | A1 | A2 | Frq | Mtag beta | Mtag se | Mtag p-value |
Pairwise LD (r2)& | Endometrium eQTL^ | Other eQTLs in GTEx V8 and eQTLGEN# |
|---|---|---|---|---|---|---|---|---|---|---|---|---|---|
|
| |||||||||||||
| FAF1/1p32.3* | ENDO | rs17387761 | 1 | 51078089 | A | G | 0.28 | 0.016 | 0.003 | 3.19×10⁻⁸ | 1 | N/A | DMRTA2 in esophagus-mucosa; EPS15 in skin, subcutaneous adipose, skeletal muscle, tibial nerve, tibial artery; FAF1 in blood and skeletal muscle |
| MCP | rs17387761 | 1 | 51078089 | A | G | 0.28 | 0.015 | 0.002 | 2.24×10⁻¹⁰ | ||||
|
| |||||||||||||
| NGF/1p13.2 | ENDO | rs12030576 | 1 | 115817221 | T | G | 0.35 | −0.023 | 0.003 | 1.41×10⁻¹⁶ | 0.06 | N/A | N/A |
| Migraine | rs2078371 | 1 | 115677183 | T | C | 0.88 | −0.024 | 0.003 | 2.58×10⁻¹² | ||||
|
| |||||||||||||
| PAPPA2/1q25.2 * | ENDO | rs34390425 | 1 | 175003074 | T | C | 0.77 | 0.018 | 0.003 | 1.93×10⁻⁸ | 0.52 | N/A | MRPS14 in skeletal muscle, thyroid, cultured fibroblasts,visceral and subcutaneous adipose; RABGAP1L in muscularis and gastroesophageal junction esophagus, thyroid, skin, pancreas, RP11-160H22.5 in thyroid, testis, whole blood, heart, colon, small intestine, brain cortex. |
| MCP | rs5015737 | 1 | 174421995 | A | G | 0.72 | 0.013 | 0.002 | 1.50×10⁻⁸ | ||||
|
| |||||||||||||
| AFF3/2q11.2 * | ENDO | rs10165991 | 2 | 100508385 | T | C | 0.46 | 0.015 | 0.003 | 7.43×10⁻⁹ | 0.04 | N/A | N/A |
| MCP | rs13031851 | 2 | 100492261 | T | C | 0.62 | 0.013 | 0.002 | 2.86×10⁻⁹ | ||||
|
| |||||||||||||
| BSN/3p21.31 | ENDO | rs1352889 | 3 | 49652148 | T | C | 0.17 | 0.026 | 0.003 | 9.20×10⁻¹⁴ | 1 | UBA7, KLHDC8B, GMPPB, NCKIPSD, CCDC36, HYAL3, RBM6 | AMT, APEH, ARIH2, C3orf62, CACNA2D2, CCDC36, CCDC71, CDHR4, CTD-2330K9, DAG1, DALRD3, FAM212A, GMPPB, GPX1, HEMK1, HYAL3, IMPDH2, IP6K1, KLHDC8B, LAMB2, MON1A, MST1R, NAT6, NCKIPSD, NDUFAF3, NICN1, P4HTM, PRKAR2A, QRICH1, RBM6, RHOA, RNF123, RP11-3B7.1, TCTA, TRAIP, UBA7, WDR6 in diverse tissues. |
| MCP | rs11709734 | 3 | 49745235 | A | G | 0.82 | −0.02 | 0.003 | 1.53×10⁻¹² | ||||
|
| |||||||||||||
| RAB9BP1/5q21.2 * | ENDO | rs12055234 | 5 | 104037760 | A | G | 0.33 | 0.017 | 0.003 | 4.30×10⁻⁹ | N/A | N/A | |
| MCP | rs77960 | 5 | 103964585 | A | G | 0.33 | 0.016 | 0.002 | 4.45×10⁻¹² | 0.95 | |||
| Migraine | rs77960 | 5 | 103964585 | A | G | 0.31 | 0.015 | 0.002 | 4.12×10⁻¹⁰ | 0.95 | |||
|
| |||||||||||||
| JADE2/5q31.1 * | ENDO | rs329124 | 5 | 133865452 | A | G | 0.57 | 0.016 | 0.003 | 4.19×10⁻⁹ | 1 | N/A | JADE2 in tibial nerve, LINC01843 in cultured fibroblasts. |
| MCP | rs329124 | 5 | 133865452 | A | G | 0.58 | 0.012 | 0.002 | 9.63×10⁻⁹ | ||||
|
| |||||||||||||
| MLLT10/10p12.31 | ENDO | rs7098100 | 10 | 21834536 | A | G | 0.35 | 0.024 | 0.003 | 1.47×10⁻¹⁸ | CASC10, SKIDA1 | CASC10 in skin, artery, testis, cerebellum; MLLT10 in skin; NEBL in blood | |
| MCP | rs12253527 | 10 | 21819824 | A | G | 0.32 | 0.017 | 0.002 | 3.78×10⁻¹³ | 0.86 | |||
| Migraine | rs10828249 | 10 | 21824727 | A | G | 0.33 | 0.014 | 0.002 | 1.16×10⁻⁹ | 0.95 | |||
|
| |||||||||||||
| FSHB/11p14.1 | ENDO | rs4071559 | 11 | 30344725 | T | C | 0.16 | −0.043 | 0.004 | 6.57×10⁻³² | 0.004 | ARL14EP | ARL14EP in tibial nerve, esophagus muscularis and mucosa, thyroid, testis, hear |
| Migraine | rs75411314 | 11 | 30828136 | A | G | 0.57 | −0.012 | 0.002 | 2.98×10⁻⁸ | ||||
|
| |||||||||||||
| PTPRO/12p12.3 | ENDO | rs12580862 | 12 | 15395548 | A | G | 0.67 | −0.022 | 0.003 | 1.58×10⁻¹⁴ | 1 | N/A | RERG in lung, esophagus muscularis |
| MCP | rs12580862 | 12 | 15395548 | A | G | 0.68 | −0.014 | 0.002 | 7.16×10⁻¹⁰ | ||||
|
| |||||||||||||
| OLFM4/13q14.3 * | ENDO | rs9536408 | 13 | 53964346 | T | C | 0.45 | −0.015 | 0.003 | 3.53×10⁻⁸ | N/A | RP11-24H2.3 in brain - amygdala, brain -anterior cingulate cortex; PCDH8 in brain -anterior cingulate cortex, salivary gland. | |
| MCP | rs2587363 | 13 | 53915933 | A | G | 0.57 | −0.015 | 0.002 | 9.33×10⁻¹³ | 0.52 | |||
| Migraine | rs9536415 | 13 | 53993661 | T | C | 0.55 | 0.014 | 0.002 | 8.61×10⁻¹¹ | 0.8 | |||
|
| |||||||||||||
| NOL4L/20q11.21 * | ENDO | rs6119880 | 20 | 31105594 | A | G | 0.24 | 0.019 | 0.003 | 8.45×10⁻¹⁰ | N/A | COMMD7 in skeletal muscle; NOL4L in pancreas, thyroid, tibial nerve; RP11-410N8.4 in testis; TM9SF4 in cultured fibroblasts; TSPY26P in skin, thyroid. | |
| MCP | rs6119880 | 20 | 31105594 | A | G | 0.23 | 0.016 | 0.003 | 3.42×10⁻¹⁰ | 1 | |||
| Migraine | rs293570 | 20 | 31105023 | A | G | 0.65 | −0.014 | 0.002 | 4.07×10⁻¹⁰ | 0.7 | |||
Risk variants identified for endometriosis that were not identified at genome-wide significance in univariate GWAS analysis.
ENDO: endometriosis, MCP: multi-site chronic pain.
LD with lead endometriosis SNP is reported.
Supplementary Table 31 for details of the eQTL results for the respective SNPs.
Supplementary Table 32 for extended eQTL results for each respective SNP.
The 9 shared lead SNPs between endometriosis and MCP or migraine are eQTLs in diverse tissues (Supplementary Tables 31–32). Rs1352889 regulates the expression of multiple genes (UBA7, AMT, RNF123, ARIH2) involved in the ubiquitin system, an important cellular mechanism that may be associated with the immune-mediated survival of endometrium implants in ectopic locations48. Recent studies have suggested that ubiquitin system failures are implicated in chronic, mainly neuropathic pain (pain caused by a lesion or disease of the somatosensory system) and inflammatory pain49. Other eQTLs include rs12580862 regulating expression of RERG (RAS-like Estrogen Regulated Growth Inhibitor), which is induced by estrogen receptors to promote proliferation and survival of endometriotic cells50; and rs4071559 in the 5-prime-UTR of ARL14EP, regulating expression of ARL14EP which controls export of major histocompatibility class (MHC) II molecules involved in initiation of immune response (Table 1). MHCII-restricted T-helper cells appear to play an important role in the development of clinical symptoms associated with neuropathic pain51 and there is increasing interest in the role of MHCII gene polymorphisms in the susceptibility to chronic neuropathic pain after nerve injury. ARL14EP is located adjacent to FSHB, which encodes follicle-stimulating hormone (FSH) β polypeptide; both genes harbour variants associated with sex hormone regulation and numerous reproductive traits52–55, suggesting the potential co-regulation of hormone and immune responses at this locus. Neuroimmune mechanisms underlie many chronic pain conditions and this co-regulation could contribute to the increased prevalence of these conditions in women and the frequent observation that symptoms (including non-pelvic chronic pain) vary with hormonal state56,57.
Discussion
In this study we identified 42 loci with 49 distinct signals associated with endometriosis, a 3-fold increase from previous studies8. Most had larger effect sizes for stage III/IV disease, and combined they explained 5.01% of stage III/IV disease variance. Our sub-phenotype analysis provided evidence that the presence of ovarian endometriosis drives the larger effect sizes for stage III/IV disease at least in part, with a genetic basis that is distinct from other disease manifestations. While we did not observe significant differences in effect sizes between endometriosis and adenomyosis (sometimes referred to as “endometriosis of the uterus”)58, the correlation of effects was highest with stage I/II endometriosis and superficial peritoneal lesions suggesting a shared pathogenesis of these subtypes, or their associated symptoms, with adenomyosis. Important caveats are the potential for misclassification of ICD-defined adenomyosis as controls59 (although this will have applied similarly to endometriosis diagnoses) and the modest sample size of adenomyosis-only cases.
The SMR analyses linking variants at the identified risk loci to expression and DNA methylation differences in endometrium and blood identified numerous functional insights into the mechanisms through which endometriosis association signals are mediated. Potentially causal relationships were observed with genes expressed in endometrium (SRP14, HOXB9, TRA2A, with previous evidence confirmed for VEZT/FGD9 and GREB1) 11,14,60 and in blood (including ABO, ESR1/SYNE1, GDAP1, FSHB, MLLT10, SRP14-AS1, WNT4). Many of these genes are expressed in different cell types relevant to endometriosis pathogenesis, including neuronal cells, immune cells, and epithelial cells; eQTL studies associating genetic variants to cell-specific expression patterns in endometrium and peritoneal fluid are needed to dissect differential regulation at a cellular level.
The genes causally related to endometriosis risk variants have functions in sex-hormone driven signalling, uterine development, oncogenesis, inflammatory adhesion molecules and angiogenic factors. Particularly notable, however, was the link of many of the genes identified, such as SRP14/BMF, GDAP1, MLLT10, BSN, NGF, as well as ‘hormone regulators’ SYNE1/ESR1 and FSHB, to mechanisms of pain perception and maintenance. Our genetic correlation analysis highlighted significant correlations between endometriosis and 11 pain conditions - including migraine, headache, dorsalgia, chronic back pain and MCP. Multi-trait analysis of GWAS summary statistics between endometriosis, MCP and migraine, highlighted many additional genome-wide significant variants, 12 mapping within 500Kb across diseases and 9 tagging the same association signals. These results provide support to the hypothesis that the presence of endometriosis can result in pain through interlinked activation of hormonal, immune, and neuronal pathways as is seen in other chronic pain conditions61. It also provides strong support for further investigation of the mechanisms underlying the genetically regulated comorbidity between endometriosis and other types of pain, both to aid the development of new treatments that facilitate early intervention and rationalise the repurposing of currently available therapies.
We also observed significant genetic correlations between endometriosis and two inflammatory conditions: asthma and osteoarthritis. Asthma has previously been associated with endometriosis in epidemiological studies62,63, and a shared genetic target with was recently highlighted64. Endometriosis has also previously been linked epidemiologically to increased risk of joint inflammation, but mainly in relation to rheumatoid arthritis, an auto-immune condition65, and not osteoarthritis characterised by auto-inflammation66. This link has not been fully explored as the onset of osteoarthritis would typically post-date an endometriosis diagnosis by several decades, and many musculoskeletal cohorts do not capture detailed women’s health data. Given that osteoarthritis also appears to be associated with fluctuations in sex hormones67 a more detailed exploration into the genetically driven shared pathogenesis of these conditions is warranted.
Our results demonstrate genetic underpinning of shared pathogenesis of endometriosis with other chronic pain conditions, as well as other inflammatory conditions. Our identification of a range of genes with strong evidence for causal association with endometriosis, should inform new avenues of targeted research into gene-specific mechanisms of pain and pathogenesis, with the potential to identify new - or repurposing of existing - treatment targets for this debilitating, enigmatic disease.
Methods
Ethics statement
All human research was approved by the relevant Institutional Review Boards and conducted according to the Declaration of Helsinki. All participants provided written informed consent. Study level ethical statements are provided in the Supplementary Information.
Study-level analyses
The meta-analysis included 24 datasets, which in total contribute 58,961 cases, and 700,345 controls of mainly European ancestry and one dataset from Japanese ancestry (1,713 cases: 1,581 controls). Case and control ascertainment and study descriptions are summarised in Supplementary table 1. The datasets were genotyped with various genotyping arrays and each dataset was subject to sample and variant quality controls, genomic control adjustments where genomic inflation factor is reported per study (Supplementary Table 2). For each GWAS, samples were pre-phased and imputed up to reference panels from the 1000 Genomes Project (phase 1, March 2012 release; phase 3, October 2014 release)69,70, Haplotype Reference Consortium71, or population-specific whole-genome sequencing72,73 (Supplementary Table 2). SNVs with poor imputation quality were excluded from downstream association analyses (Supplementary Table 2). Association with endometriosis was evaluated in a regression framework, under an additive model in the dosage of the minor allele, with adjustment for study-specific covariates (Supplementary Table 2). Allelic effects and corresponding standard errors that were estimated from a linear (mixed) model were converted to the log-odds scale74. Study-level association summary statistics (P-values and standard error of allelic log-ORs) were corrected for residual structure, not accounted for in the regression analysis, by means of genomic control75 if the inflation factor was >1 (Supplementary Table 2). Genome-wide association analyses were conducted for overall endometriosis and sub-phenotype GWAS analyses were conducted for stage I/II, stage III/IV, infertile endometriosis case groups in studies with the respective case categorisation (Supplementary Table 1).
Meta-analyses
To increase power, accuracy of effect estimates and generalisability between studies, GWAS summary statistics were combined in a meta-analysis. Variants were first filtered at the study level for: MAF>0.5%, SE<10, info>0.4 or r2>0.3. The summary statistics for each study were genomic control corrected to adjust for any residual population structure. Per-variant estimates collected from each individual study from 60,674 cases and 701,926 controls, for 10,401,531 SNPs were meta-analysed using the inverse variance weighting fixed-effects method implemented in METAL76. We conducted additional sub-phenotype meta-analyses including (1) Stage III/IV endometriosis (4,045 cases), (2) Stage I/II endometriosis (3,916 cases), (3) Infertile endometriosis (3,060 cases). Post meta-analysis, we excluded variants that were not present in more than 50% of the total effective sample size (N=8,163,508 SNPs). We maintained the conventional genome-wide significance threshold 5×10⁻⁸. Moreover we conducted two meta-analysis for sensitivity testing: (1) a meta-analysis of datasets including >300 cases (15 studies of the 24) for overall endometriosis to ensure smaller studies are not contributing noise, (2) a meta-analysis of GWAS with only female controls (N cases=44,176: N controls=657,747) and a meta-analysis of GWAS with mixed female and male controls (N cases=5,222: N controls=44,176) with the ‘sex-differentiated’ function in GWAMA77 to estimate heterogeneity in allelic effect sizes due to sex differences in the controls sets. Significant heterogeneity was defined as 0.05/42=1.19×10−3.
Evaluating the source of heterogeneity in allelic effects on endometriosis across GWAS via meta-regression
For each lead SNV, we modelled allelic log-ORs across GWAS in a linear regression framework, weighted by the inverse of the variance of the effect estimates, incorporating the following covariates: (i) an indicator variable representing the ancestry of the study (European or East Asian); and (ii) two indicator variables representing case ascertainment in the study (Self-reported, medical records, mixed (Medical records and self-reported). In this modelling framework, we tested for heterogeneity in allelic effects on endometriosis between GWAS that is: (i) due to ancestry (after adjustment for case ascertainment); (ii) due to ascertainment (after adjustment for ancestry); and (iii) due to other unmeasured confounders (residual after accounting for ancestry and case ascertainment).
Multiple association signals at endometriosis risk loci (GCTA)
We defined a locus as the chromosomal regions 500 kb up- and down-stream of the lead SNP. If we had more than one lead SNP within 500Kb up- and down-stream we combined these into one locus. To identify the presence of distinct associations at genome-wide significant loci, we conducted approximate conditional analysis based on summary meta-analysis results restricted to European ancestry GWAS (because the approximation requires a reference for LD, which is not consistent across ancestry groups) in GCTA software78. We used 1000G P3v5 European population as the reference panel. We utilised genome-wide significance p<5×10⁻⁸. For loci with a single signal of association, we defined the index SNP as the lead SNP from the multi-ancestry unconditional analysis. For loci with multiple signals of association, we defined index SNPs as having the minimum p-value in the European conditional approximate analysis.
Liability-scale variance explained by the endometriosis risk variants
Based on the liability threshold model79, we estimated the proportion of variance explained by SNPs using the effective allele frequency and odds ratio from GWAS analysis of European ancestry meta-analysis80. We assumed population prevalence of 8%, 2.5%, 5.5% and 2.5% for overall endometriosis, stage III/IV endometriosis, stage I/II endometriosis and infertile endometriosis, respectively9,81,82.
Fine-mapping association signals as endometriosis risk loci.
Within each locus, for each distinct signal, we first approximated the Bayes’ factor in favour of endometriosis association of each SNV using summary statistics from the European ancestry-specific meta-analysis. Specifically, the Bayes’ factor for the th SNV at the th distinct association signal is approximated by
where and denote the estimated allelic effect (log-OR) and corresponding variance from the meta-analysis83. In loci with multiple distinct signals of association, summary statistics were obtained from the approximate conditional analysis after adjusting for all other index variants in the fine-mapping region. In loci with a single association signal, summary statistics were obtained from the unconditional meta-analysis. The parameter denotes the prior variance in allelic effects, taken here to be 0.0483.
Within each locus, for each distinct signal, we then calculated the posterior probability of driving the endometriosis association for each SNV under a uniform prior model for causal variants. Specifically, for the th SNV at the th distinct signal, the posterior probability is given by , where is the Bayes’ factor in favour of association. We then derived a 99% credible set84 for the th distinct association signal by: (i) ranking all SNVs according to their posterior probability ; and (ii) including ranked SNVs until their cumulative posterior probability attains or exceeds 0.99.
Functional annotation of variants within 99% credible sets.
Variants within the credible sets for each of the 49 distinct signal associated with endometriosis were annotated using Ensembl Variant Effect Predictor (VEP) (https://github.com/Ensembl/ensembl-vep%20401). PhastCon, Grantham, GERP and PolyPhen predictions for all coding variants were accessed via the Exome Variant server (https://evs.gs.washington.edu/EVS/) and from SIFT (https://sift.bii.a-star.edu.sg/). Moreover, the web-based software platform, FUMA85, was used to annotate 99% credible sets. Variants were annotated with Combined Annotation Dependent Depletion (CADD) scores, RegulomeDB scores, chromatin states and chromatin interactions using reference datasets available in the software. SNPs were also annotated to valid promoter associated chromatin loops generated from H3K27Ac HiChIP libraries from a normal immortalized endometrial cell line (E6E7hTERT) and three endometrial cancer cell lines (ARK1, Ishikawa and JHUEM-14)86. We determined if SNPs fell within chromatin interaction anchor points that interacted with the promoter of a gene.
Enrichment of gene expression across tissues and pathways
Tissue Enrichment
To determine if genes located in loci associated with endometriosis risk were enriched in particular tissues we conducted a tissue enrichment analysis. Genes with a transcription start site (TSS) within ±200kb of each of the 49 index SNPs were tested for enrichment in specific tissues using the TissueEnrich R package87. TissueEnrich uses a hypergeometric test approach to calculate tissue-specific gene enrichment using the available Human Protein Atlas (HPA) dataset containing RNA-Seq data across 35 human tissues88 and GTEx dataset containing RNA-Seq data across 29 human tissues89.
Quantitative Trait Loci (QTL) and Summary-based-data Mendelian Randomization (SMR)
To test for causality or pleiotropy between a variant, expression of a gene and risk of endometriosis we performed SMR analysis15. The SMR was applied using cis-QTL summary statistics for tissues enriched for genes in risk loci, as shown in our previous analysis. This included cis-eQTLs summary statistics from endometrium11,90, uterus91 and cis-mQTL summary statistics from endometrium14. A proportion of QTLs are shared and correlated between tissues92,93, as such, we repeated the analysis in a large blood eQTL dataset94 and mQTL dataset13 as a proxy.
We conducted a meta-analysis for eQTLs in endometrium using a previously published eQTL dataset11 generated on an Australian cohort (N=206) and an eQTL dataset from a UK cohort (N=163) (Supplementary Table 34–35) consisting of endometrial samples from a total of 369 women for 1MB around the 42 lead SNPs. The Australian dataset contained 6,230,993 genotyped and imputed SNPs and 17,255 genes with CPM>0.22 (~10 counts) in 90% samples. The UK dataset contained 7,179,995 genotyped and imputed SNPs and 18,152 genes with CPM>0.22 in 90% samples. Both RNA-sequencing datasets were aligned to GRCh38 and underwent TMM normalisation and log2 transformation using the edgeR R package95. eQTL analysis was performed using the nominal pass method in QTLTools96, the cis distance was set of 1Mb and data was adjusted to match a normal distribution (--normal). Flow cell, lane, menstrual cycle stage and endometriosis status were included as covariates in the analysis of the Australian dataset. Principal components 1–3 generated from RNAseq data were included as covariates in the analysis of the UK dataset. Effect alleles were harmonised between the datasets. The two eQTL datasets were meta-analysed for the 1MB region around the 42 lead SNPs using the software tool OSCA (OmicS-data-based Complex trait Analysis)97 and secondary signals were identified using conditional analyses utilising QIMIRHCS as the LD reference cohort in GCTA-COJO78.
SMR was performed using these QTL datasets alongside results from the endometriosis meta-analysis of European cohorts in this study. For analyses containing endometrial QTLs, Oxford and Melbourne cohorts were removed from the meta-analysis to ensure GWAS and endometrial eQTL datasets were independent. A total of 531 probes and 571 genes were included from the array and RNA-Seq endometrial eQTLs respectively and SMR p-value thresholds of 9.42×10⁻⁵ (0.05/531) and 8.76×10⁻⁵ (0.05/571) were applied to determine significance. Heterogeneity of effect sizes in cis-eQTL regions can result from colocalization and LD between multiple casual SNPs. Heterogeneity was tested using the HEIDI (heterogeneity in dependent instruments) test. A HEIDI p-value of <0.05/m_SMR_sig, where m_SMR_sig is the number of genes that passed the SMR P-value threshold, suggests heterogeneity in the SNP effects in the region. The SMR and HEIDI test was repeated using eQTLs for 15,513 genes (PeQTL<5×10⁻⁸) from the eQTLGen blood dataset94 and an SMR P-value threshold of 3.22×10⁻⁶ and using eQTLs for 939 (PeQTL<5×10⁻⁸) genes with from GTEx uterus91 and an SMR P-value threshold of 5.33×10⁻⁵.
Any association between endometriosis risk variants and regulation of methylation was also tested using SMR and HEIDI. Two mQTL datasets were used including an endometrial mQTL dataset14 (7,803 probes with PmQTL<5×10⁻⁸) and large blood mQTL dataset13 (93,154 probes with PmQTL<5×10⁻⁸). SMR p-value thresholds of 6.41×10⁻⁶ and 5.37×10⁻⁷ were applied to the endometrial and blood SMR results respectively.
As described previously for the 99% credible set, significant variants from the SMR analysis were annotated with CADD scores, RegulomeDB scores, chromatin states and chromatin interactions using reference datasets available in the FUMA85 software. Similarly, SNPs were also annotated to promoter associated chromatin loops from endometrial (E6E7hTERT) and three endometrial cancer cell lines (ARK1, Ishikawa and JHUEM-14)86.
The genes identified from the SMR analysis (N=23) were annotated for cell-type specific expression utilising GTEx multi-gene single cell viewer. This is a visualization tool which helps explore single cell expression data for a list of genes from various cell types. The GTEx single cell data is generated from 8 tissues including, breast, esophagus mucosa, esophagus muscularis, heart, lung, skeletal muscle, prostate and skin from 25 archived, frozen tissue sample from 16 donors of GTEx project98. We determined an arbitrary cut-off of detection in at least 10% of the respective cells and looked at patterns of expression in these cells.
Sub-phenotype analysis
To determine if any of the endometriosis GWAS meta-analysis associations were driven by particular surgical or clinical features we tested for association of the lead 42 SNPs with 17 sub-phenotypes summarised in three groups: Surgical sub-phenotypes, symptom sub-phenotypes and common morbidity sub-phenotypes. Definitions of the sub-phenotypes, their data sources and study-level statistical analyses are described in detail in the supplementary information: methods. The meta-analysis was performed using an inverse variance weighted approach conducted with METAL software76. I2 measures were reported to estimate heterogeneity between studies included for each sub-phenotype analysis (Supplementary Table 21). Descriptive statistics were generated as forest plots for SNP-sub-phenotype associations using the forestplot package in R99. Correlation and scatter plots of sub-phenotype association effect sizes were generated using R. Due to the lack of independence between women contributing to the different phenotypic analyses, no formal statistical tests could be conducted.
Genetic correlation using Linkage Disequilibrium (LD) score regression
To determine the genetic correlation between endometriosis and related traits, we performed linkage disequilibrium (LD) score regression using LDSC v1.0.1 (https://github.com/bulik/ldsc)34,35. The software was installed on local secure cluster GenomeDK. The LDSC program was run using precomputed European LD scores available from Broad Institute (https://data.broadinstitute.org/alkesgroup/LDSCORE/eur_w_ld_chr.tar.bz2), with calculations limited to SNPs from HapMap3 (https://data.broadinstitute.org/alkesgroup/LDSCORE/w_hm3.snplist.bz2). Summary statistics for 49 traits were downloaded and grouped in five categories, relating to the immune system/inflammation, pain, reproduction, obesity and brain volume. All summary statistics were prepared for analysis by determining the effect allele and using the munge_sumstats.py function of LDSC (Supplementary Tables 23 and 26). Bonferroni correction was applied to determine significant correlations, resulting in an adjusted p-value threshold of p<1.56×10⁻³ (0.05/32) for disease/traits; p<2.63×10⁻³(0.05/19) for brain volume and function traits. A list of all summary statistics can be found in supplementary table 24 and 27. Both analyses were repeated with only medically confirmed endometriosis GWAS (N=8,390 cases) as sensitivity analyses (Supplementary Table 25 and 28).
Liability scale SNP heritability was calculated using LDSC by using the --sample-prev (disease prevalence in the sample) and --pop-prev (disease prevalence in the population) flags in the ldsc.py function. This enables the function to convert binary trait heritability estimates from the observed scale. Population prevalence was primarily obtained from the paper presenting the sumstat. In cases where this was not possible, prevalence was taken from suitable scientific literature as seen in supplementary table 23.
Phenoscanner analysis
For all coding variants within the credible sets for each of the 49 distinct signals associated with endometriosis we searched for reported associations (P<5×10⁻⁸) with other traits and conditions using Phenoscanner46 (http://www.phenoscanner.medschl.cam.ac.uk/) (February 2020) and GWAS catalog (https://www.ebi.ac.u/gwas/home) (December 2019).
Multi-trait analysis (MTAG) between endometriosis and pain conditions
Samples.
The summary GWAS results from the latest European ancestry GWAS meta-analysis was requested and obtained (1) for migraine excluding 23andMe and UKBB datasets including 38,094 migraine cases and 210,211 controls100, (2) for multi-site chronic pain from UKBB including 240,651 individuals101. For endometriosis, the European ancestry GWAS meta-analysis results are utilised for this analysis.
Preprocessing of GWAS data.
The following SNPs were filtered out: (1) SNPS with MAF=<0.01 from all datasets, (2) Multiple SNPs mapping to identical chromosome positions among datasets, (3) SNPs with conflicting alleles among datasets, (4) SNPs with MAF differences of >0.2 among datasets, (5) SNPs not on the autosomes. Only SNPs that are shared between the GWAS analyses were utilised in the analysis. Z-scores (log(OR/SE)) were computed for all SNPs. After variant filtering, a total of 5,945,867 common SNPs between endometriosis, migraine and MCP were included in the MTAG analysis.
Multi-trait analysis of GWASs.
MTAG is a generalisation of standard inverse-variance weighted meta-analysis framework. It takes pre-processed GWAS summary statistics from multiple traits. Here, MTAG was utilised to run a meta-analysis including endometriosis, MCP and migraine. Birvarite LD score regression was used as part of MTAG analysis to account for possibly unknown sample ovarlap between GWAS results of different traits. In the results, MTAG outputs trait-specific effect estimated for each SNP and resulting p-value can be interpreted and used like those in single-trait GWAS47.
Identification of significant shared genetic risk variants.
For each trait, significant lead SNPs were identified based on (1) achiving a genome-wide significant p-value (p<5×10⁻⁸), (2) being 500Kb away from each other and, (3) being independent (r2<0.1). Then, the lead SNPs associated with respective traits (i.e. from endometriosis and MCP) that sit within 500Kb were identified and LD between them was checked. If the LD between lead SNPs of respective traits were r2>=0.8, they were deemed shared loci between those traits.
Data availability
Summary results for the top 10,000 SNPs included in the entire Genome-wide Association Study (GWAS) meta-analysis are provided in Supplementary Table 33. Summary statistics from the endometriosis meta-analysis excluding 23andMe is available from: EBI GWAS Catalog Study Accession GCST90205183. GWAS summary statistics from 23andMe, Inc were made available under a data use agreement that protects participant privacy. Please contact dataset-request@23andme.com or visit research.23andMe.com/collaborate for more information and to apply to access the data. The UK endometrium eQTL dataset (N=163) 1MB around each 42 lead SNPs is provided in Supplementary Table 34–35.
Code availability
We utilised publicly available software in all the analyses. These are listed with appropriate citations in the methods.
Statistics and Reproducibility
No statistical method was used to predetermine sample size. We used the largest sample size of endometriosis cases and controls with GWAS data available to us. Within each contributing study, data were excluded on the basis of well-established individual and variant quality control (QC) procedures to remove poor quality genotypes, samples and variants. These QC procedures are described in Supplementary Table 2 for each study. We did not conduct replication since we had already brought together all study data available to us via meta-analysis. All reported association signals were checked to confirm that effects were not driven by false positives in single studies. Randomisation was not performed. Within each study, covariates were adjusted for to account for potential confounding. Covariate adjustments are reported in Supplementary Table 2. Group allocation was not relevant to this study, so blinding was not necessary.
Extended Data
Extended Data Figure 1. Q-Q plots for genome-wide association results.
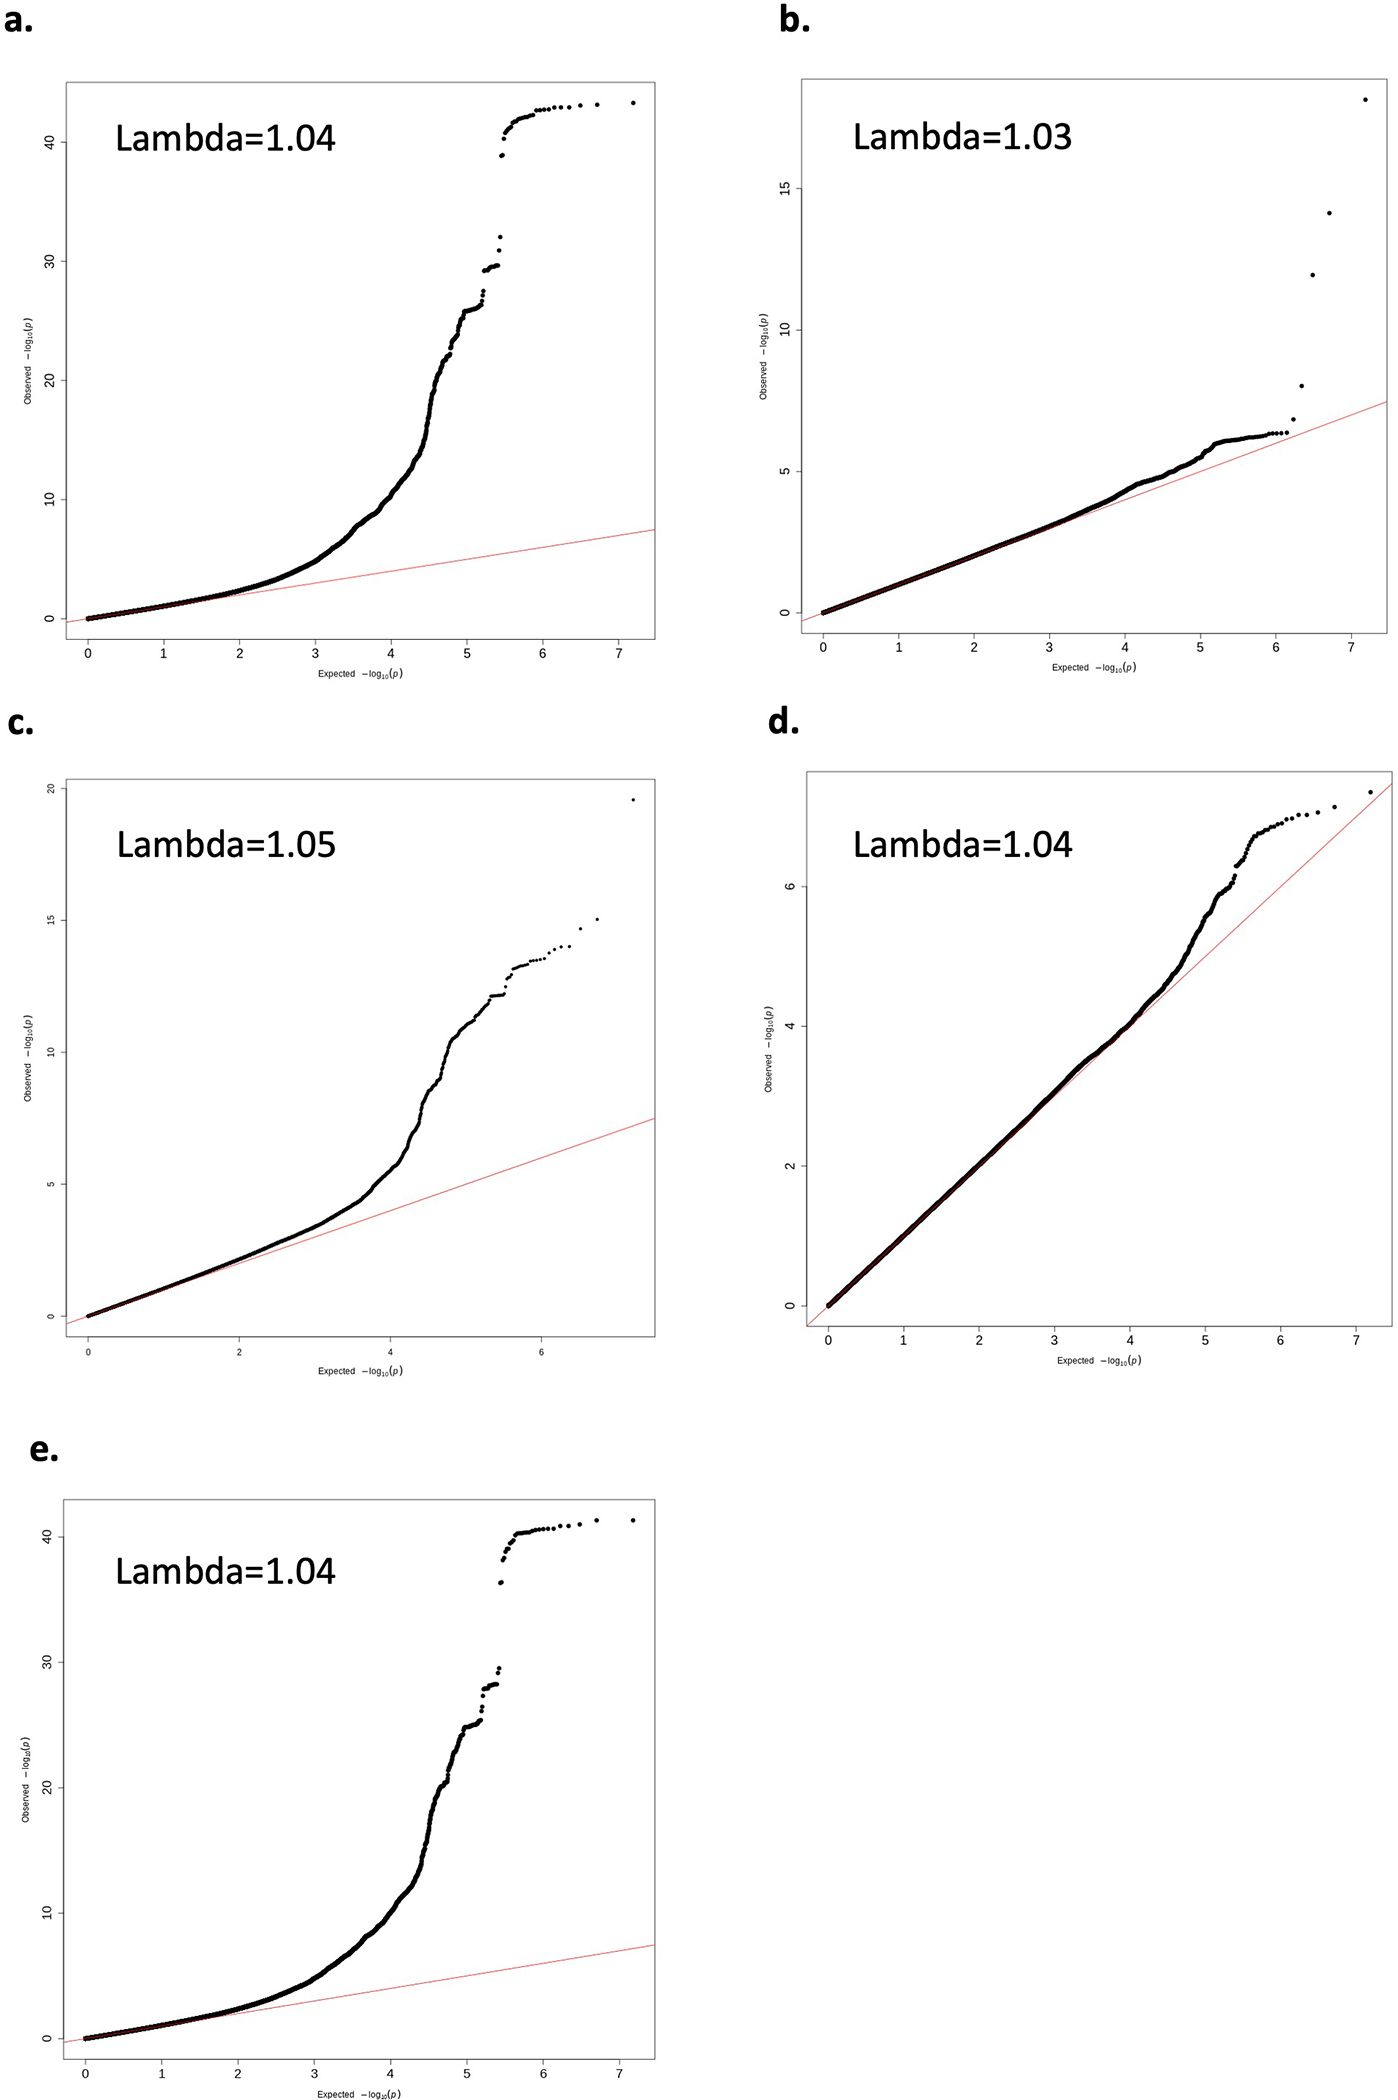
Q-Q plot for genome-wide association results for a. overall endometriosis, b. rASRM stage I/II endometriosis, c. rASRM stage III/IV endometriosis, d. endometriosis-associated infertility, e. only studies with >300 cases.
Extended Data Figure 2. Manhattan plots for genome-wide association results.
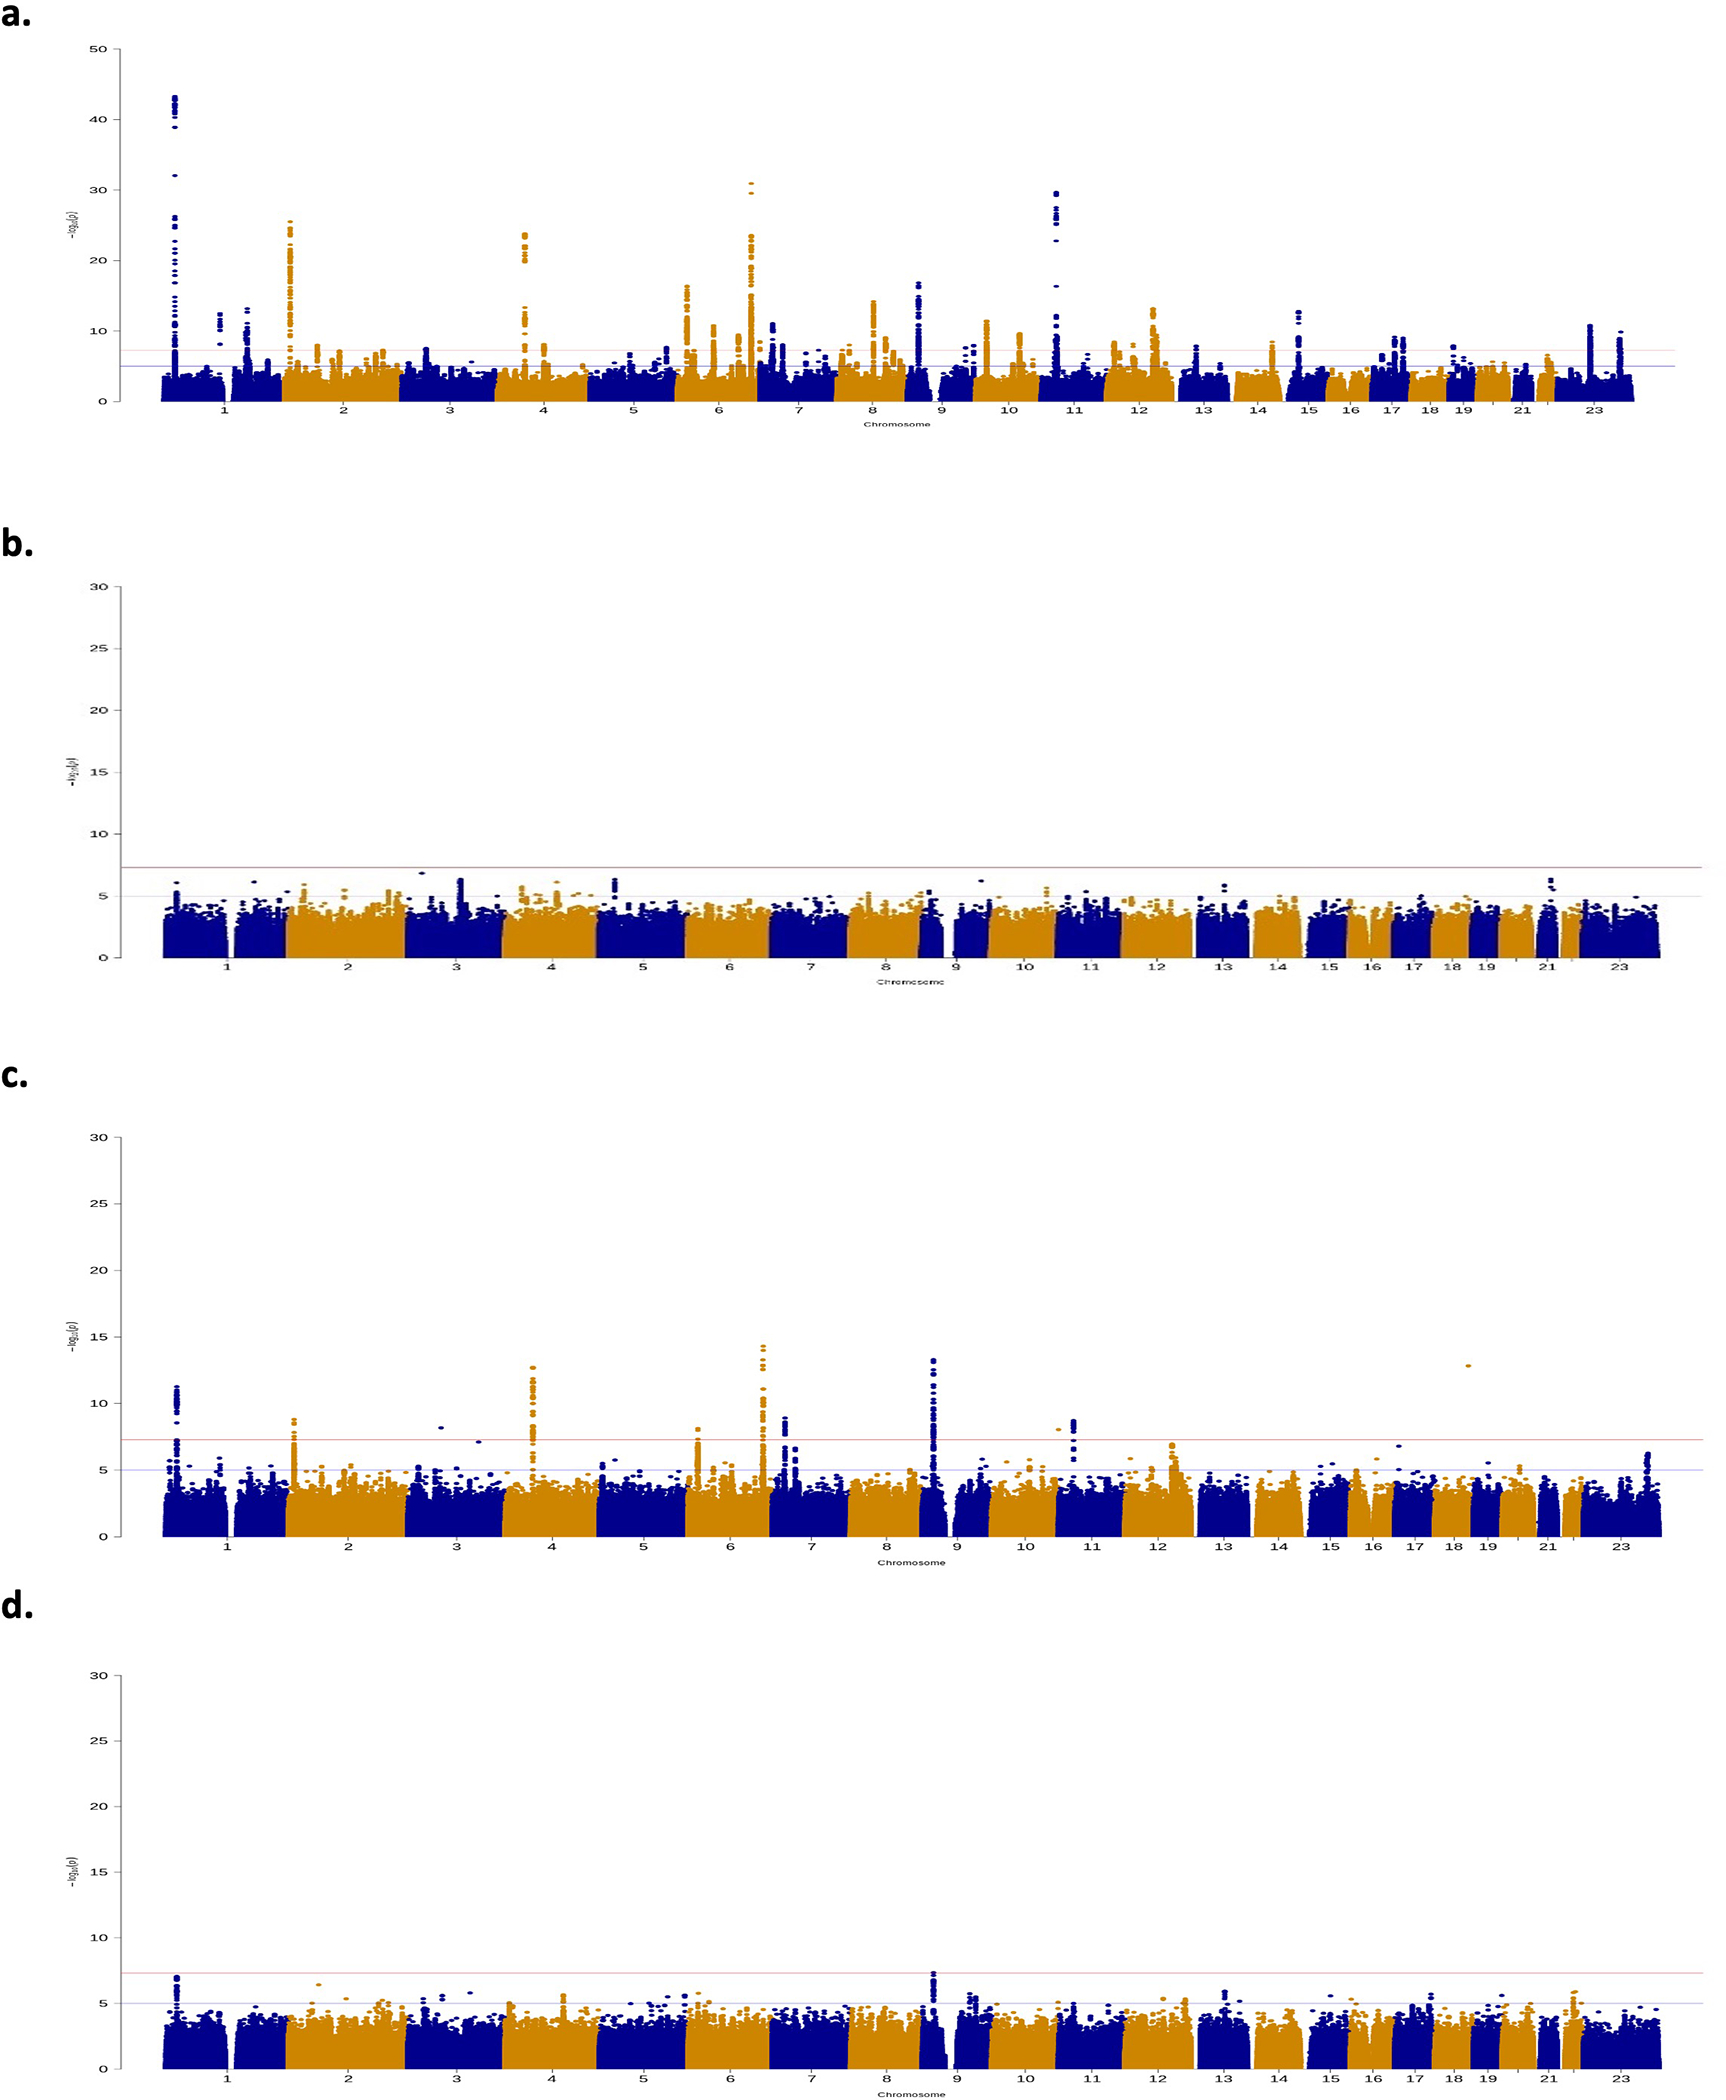
Manhattan plot for genome-wide association results for a. overall endometriosis, b. rASRM stage I/II endometriosis, c. rASRM stage III/IV endometriosis, d. endometriosis associated infertility. The GWAS meta-analysis results are shown on the y-axis as −log10(P-value) and on the x-axis is the chromosomal location. The red vertical line illustrates the genome-wide significance (p<5×10⁻⁸) and the blue vertical line shows the nominal genome-wide results (p<1×10⁻⁵).
Extended Data Figure 3. Comparison of mixed female and male controls GWAS meta-analysis vs. female only controls GWAS meta-analysis results.
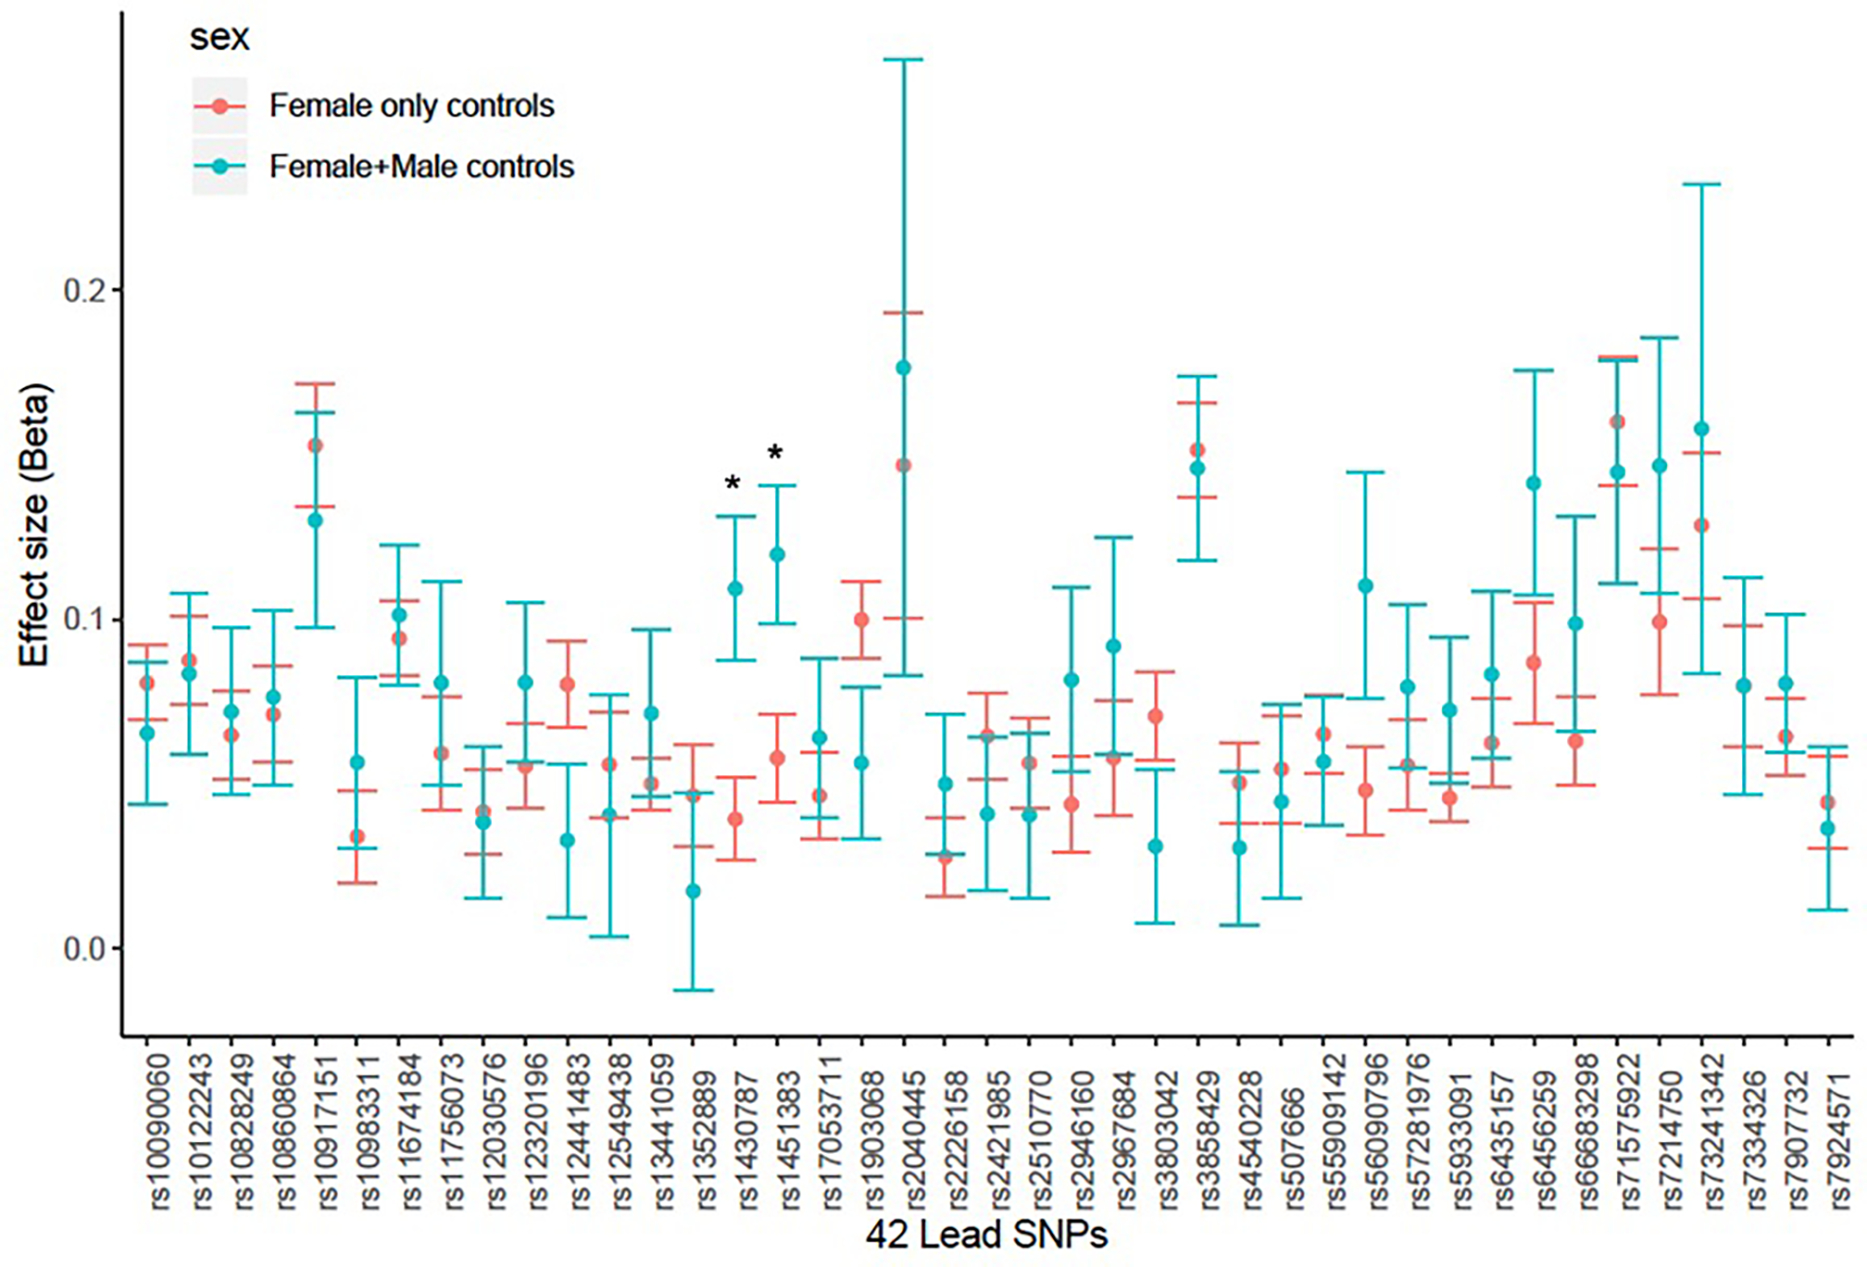
Results from meta-analysis contrasting GWAS studies with mixed female and male controls (N cases=5,222, N controls=44,176) vs. GWAS studies with only female controls (N cases=44,176, N controls=657,747). Significant heterogeneity: p-value<1.19×10⁻³ (0.05/42). The error bars represent standard error estimates for the beta co-efficient estimates. * SNPs with nominal heterogeneity p-values: rs1430787, p=0.03, rs1451383, p=0.01.
Extended Data Figure 4. Tissue-specific gene enrichment results.
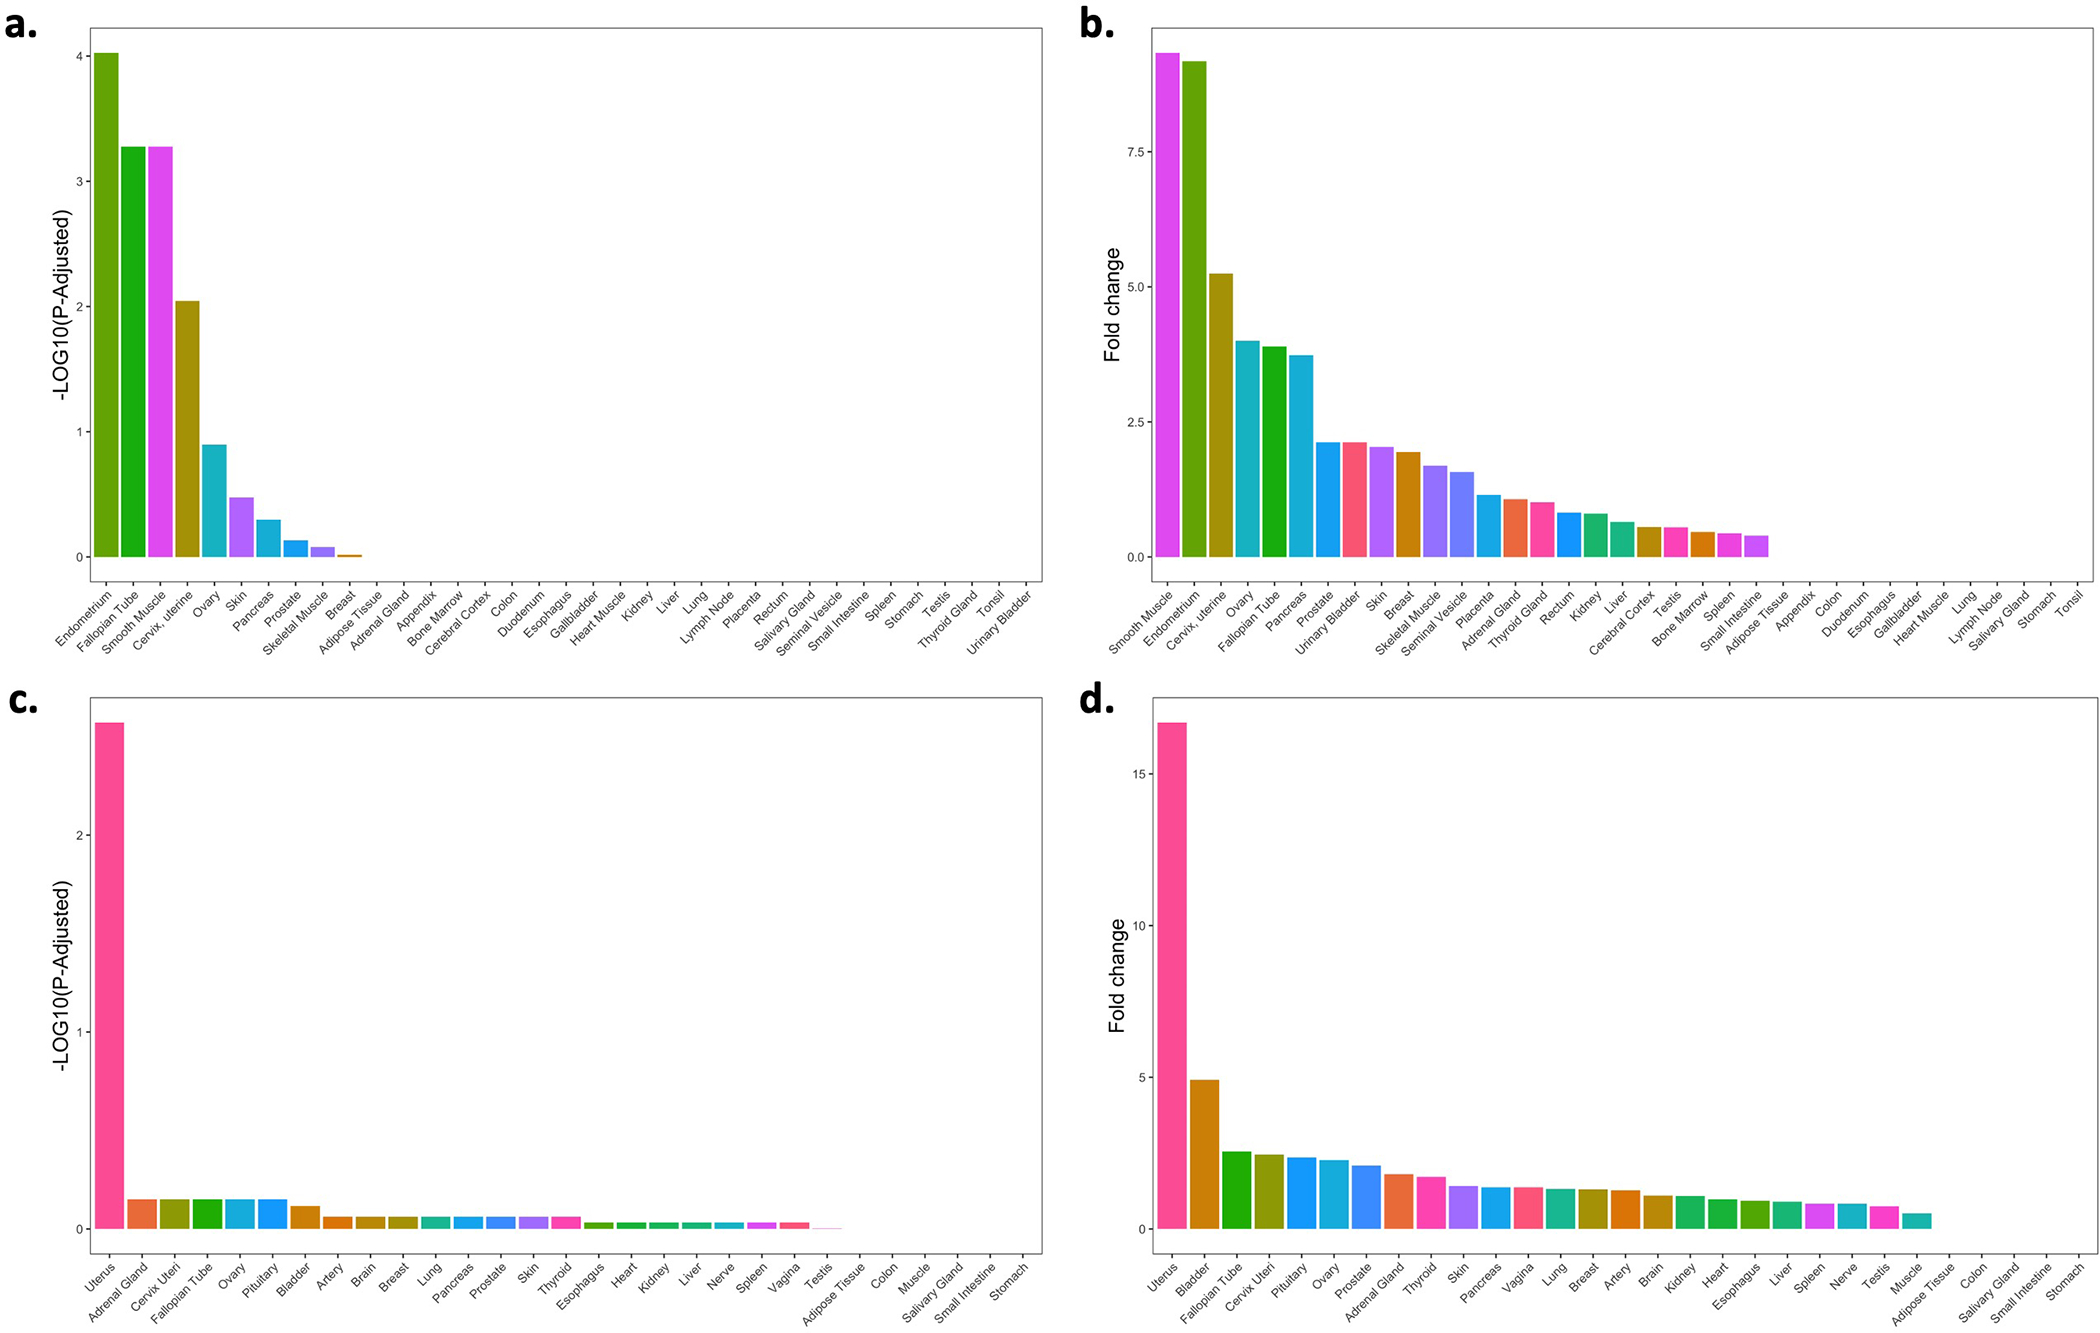
Tissue-specific gene enrichment using RNA-Seq data across 35 human tissues from the Human Protein Atlas (a and b) and 29 human tissues from GTEx (c and d). The x-axis shows each of the tissues, and the y-axis represents the tissue-specific gene enrichment −Log10(P−Value) (left) and the fold-change values of the tissue-specific gene enrichment (right).
Extended Data Figure 5. SKAP1/17q21.32 locus.
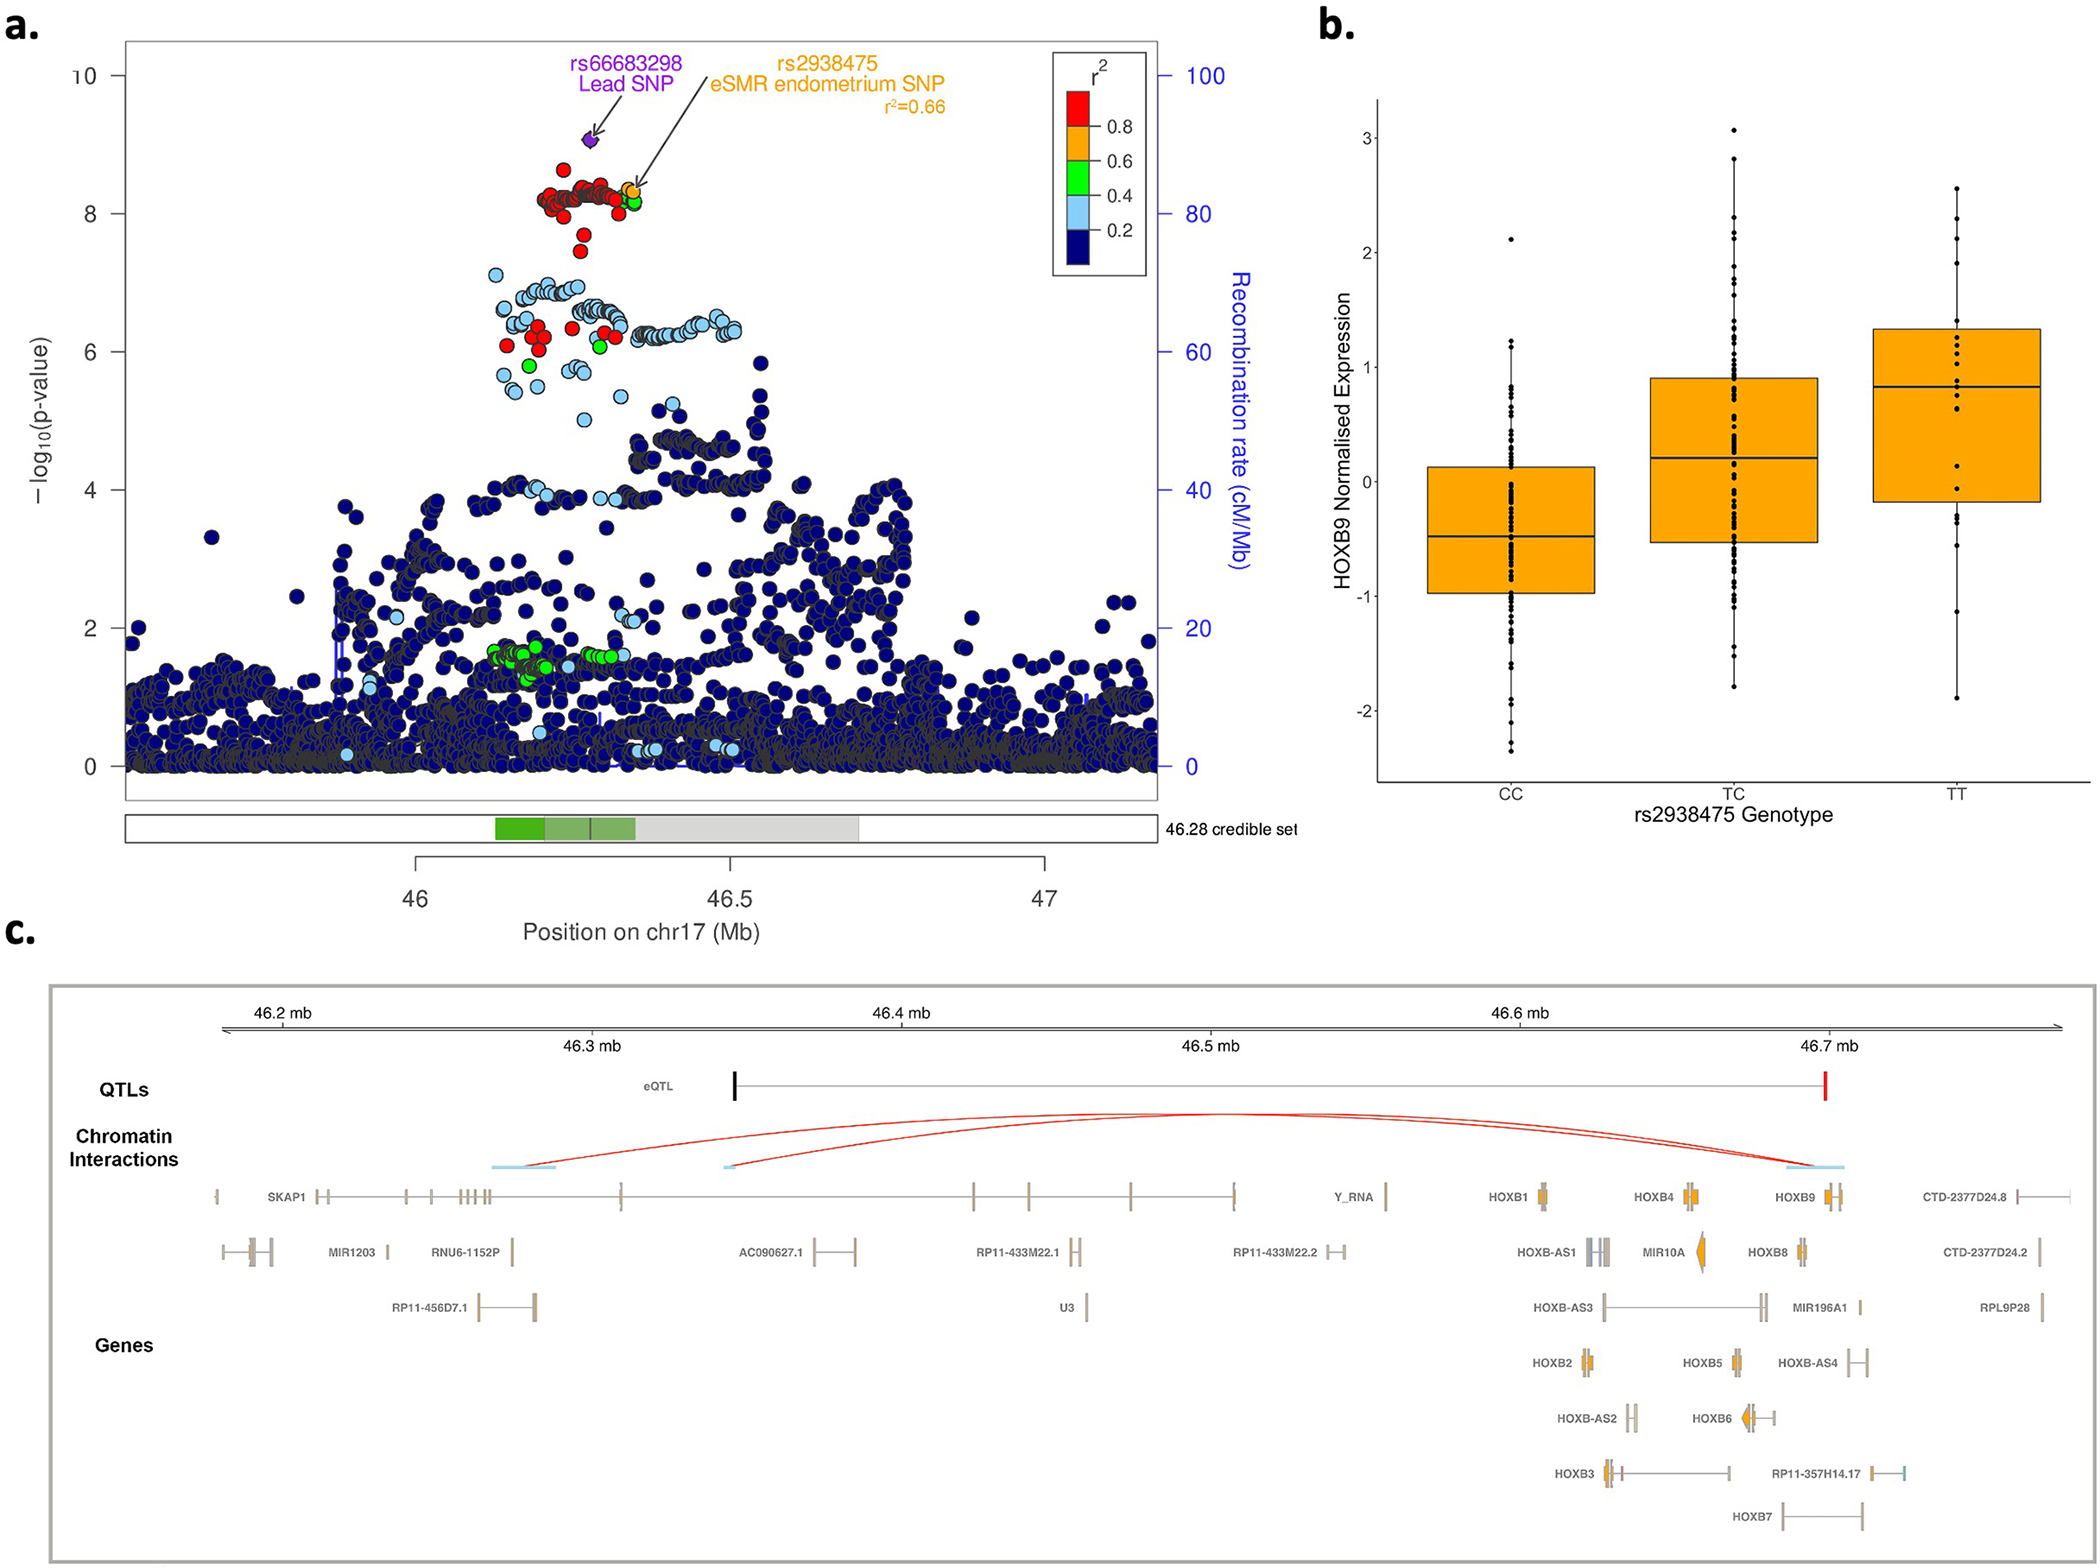
a. Illustration of the regional association plot for the SKAP1/17q21.32 locus including the 99% credible sets. eSMR endometrium SNP: SMR SNP identified as causal for endometriosis utilizing the eQTL data from endometrium; The shaded region in the credible sets panel is further annotated in panel c. b. SMR significant endometrial eQTL for HOXB9 (SMR p-value=2×10⁻⁶). The lower and upper bounds of the boxes represent the first and third quantiles, the whiskers extend 1.5 times the interquartile range from the bounds of the box and the line represents the median. c. position of the SMR-significant eQTL in the SKAP1/17q21.32 locus along with HOXB9 promoter-associated chromatin loops with anchor points containing the lead SNP and the SMR SNP. The SMR-significant SNP associated with expression of HOXB9 in endometrium (eQTL) and endometriosis is shown in black and the associated HOXB9¬ target is shown in red. Valid promoter-associated chromatin loops were generated from H3K27Ac HiChIP libraries from a normal immortalized endometrial cell line (E6E7hTERT) and three endometrial cancer cell lines (ARK1, Ishikawa and JHUEM-14)68.
Extended Data Figure 6. sICAM-1 level results.
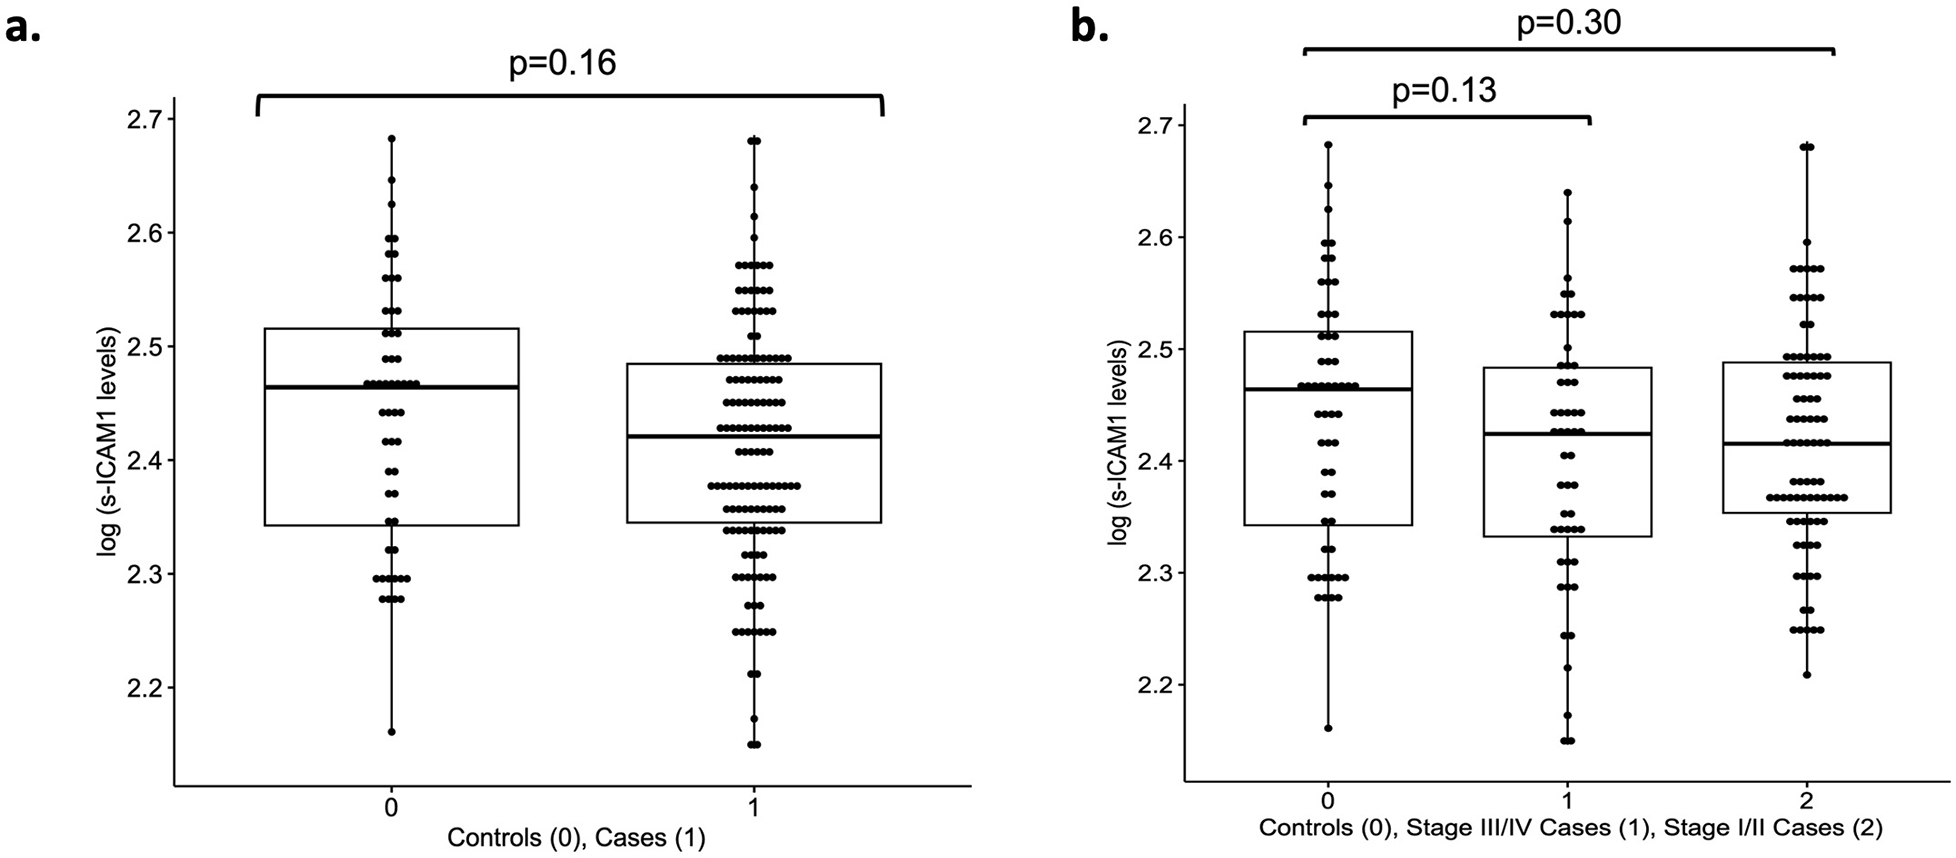
Box plots of log scale sICAM-1 levels in a. overall endometriosis cases (N=136) vs. controls (N=54), b. rASRM stage I/II cases (N=85) vs. controls and rASRM stage III/IV (N=51) vs. controls. Reported p-values are from the adjusted logistic regression model (see Supplementary Information: Methods) (Supplementary Table 19). The lower and upper bounds of the boxes represent the first and third quantiles, the whiskers extend 1.5 times the interquartile range from the bounds of the box and the line represents the median.
Extended Data Figure 7. Single cell expression profiles.
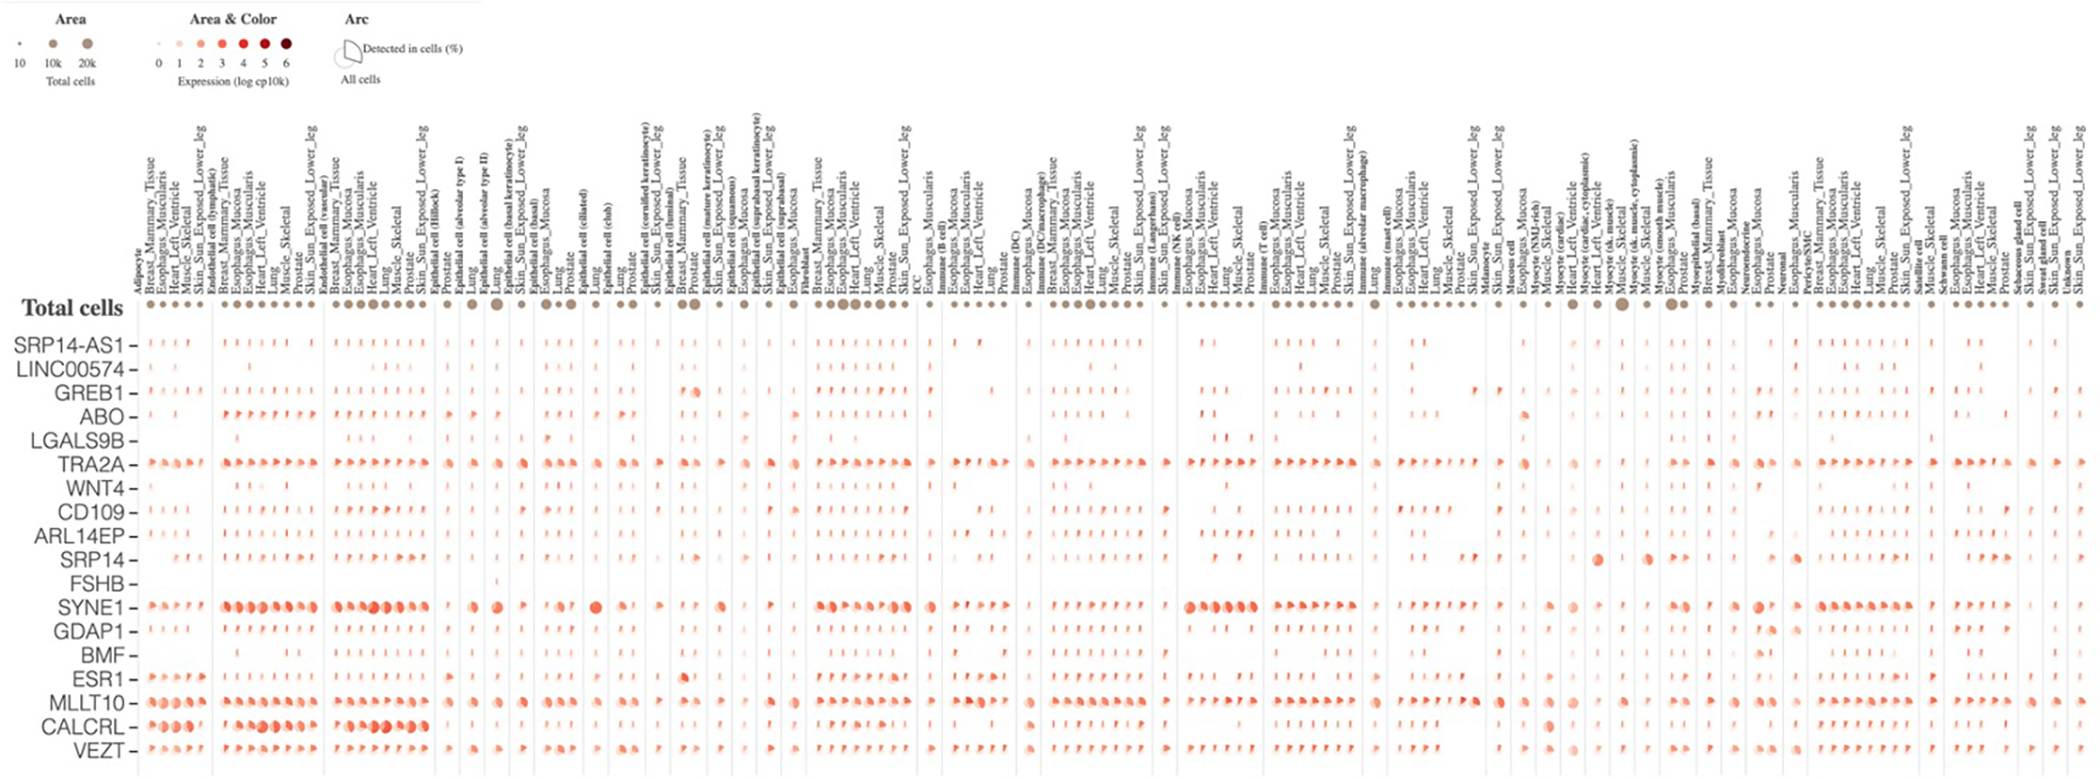
Single cell expression profiles for 18/23 genes regulated by endometriosis risk variants in GTEx Multi-Gene Single Cell Viewer (5 were not included in the database). This is an aster plot where the fraction of cells in which a gene is detected is shown. The cells are categorised by cell-type.
Extended Data Figure 8. Correlation of 42 GWAS loci between endometriosis surgical sub-types and adenomyosis.
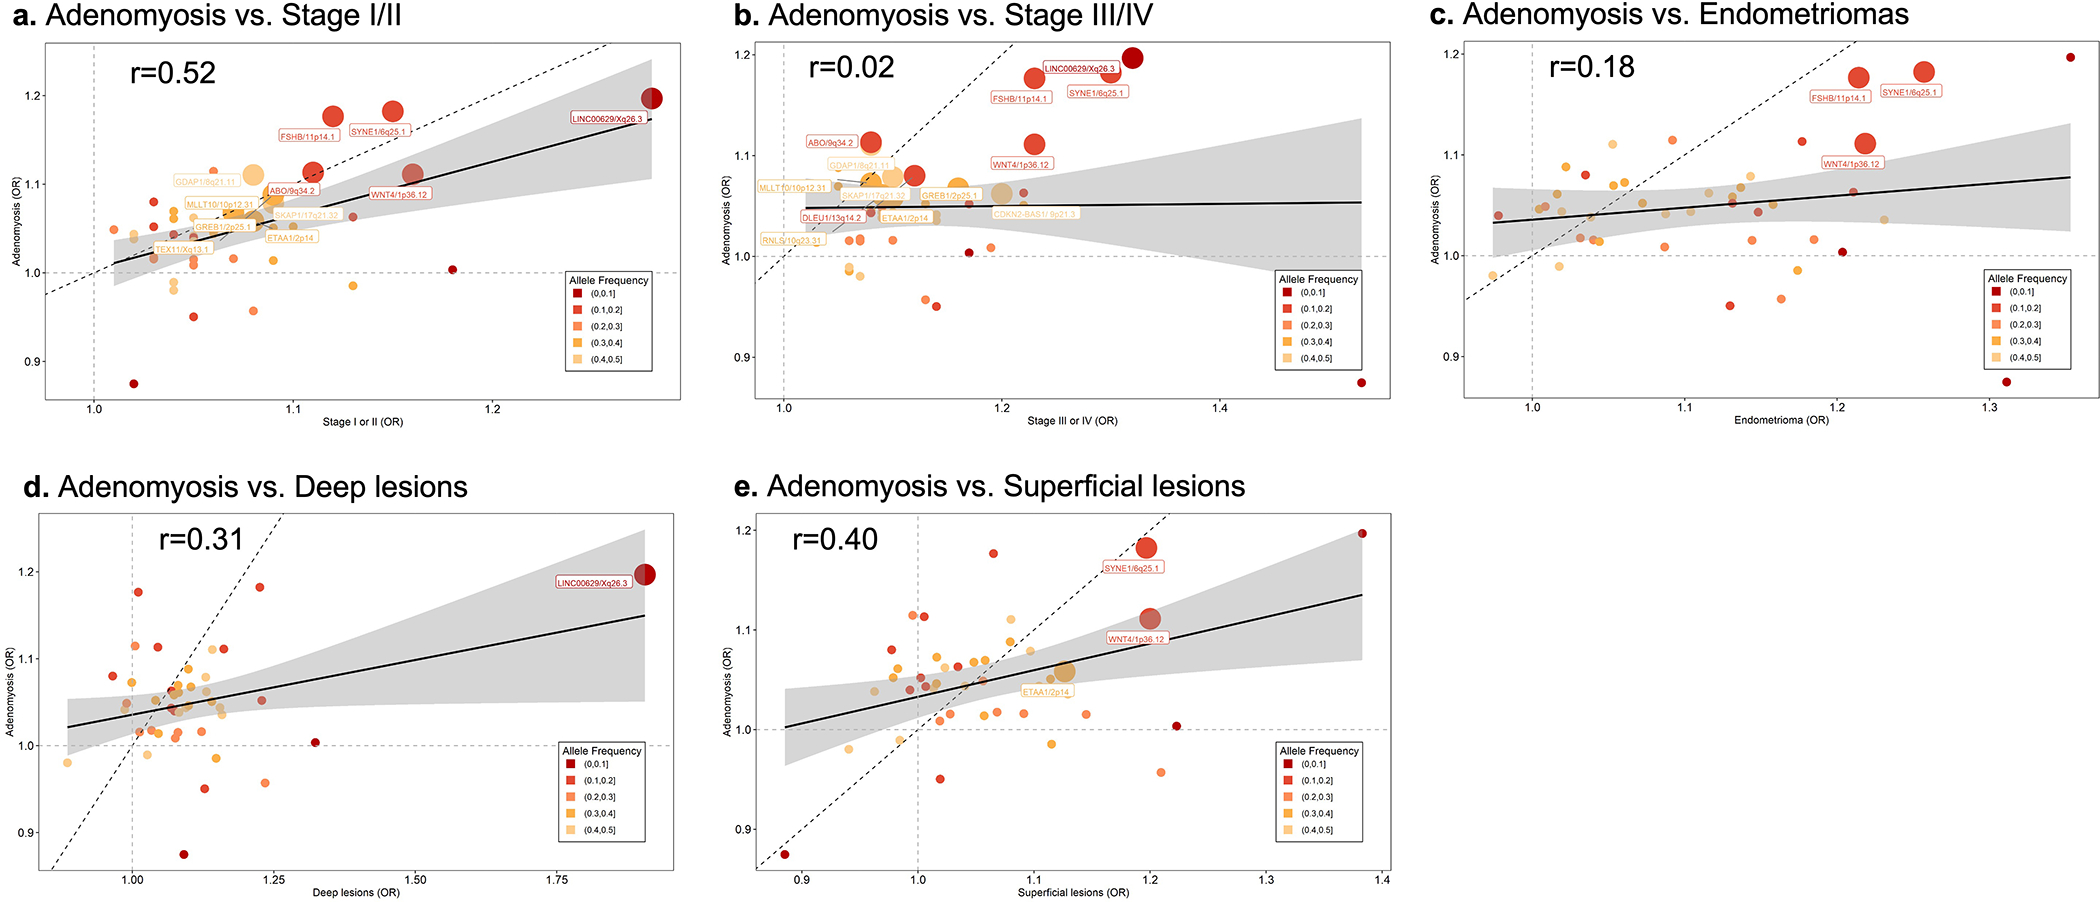
Correlation between the effect sizes of 42 endometriosis-associated GWAS loci contrasting endometriosis surgical sub-types and adenomyosis: a. Adenomyosis vs. rASRM stage I/II, b. Adenomyosis vs. rASRM stage III/IV, c. Adenomyosis vs. endometrioma, d. Adenomyosis vs. deep lesions, e. Adenomyosis vs. superficial lesions. Minor allele frequency for each of the 42 variants is given by shade of grey: Lighter shade of grey designates a smaller MAF, darker shade of grey a larger MAF. Nominal associations (p<0.05) are annotated with locus name and larger circles. The solid black line represents the linear regression line and the dotted black line is the x=y with a slope of 1 for reference of change in ORs. Test statistics including p-values for all the associations are provided in Supplementary Table 21.
Extended Data Figure 9. Genetic correlation results between only surgically or medically confirmed endometriosis and 32 traits/conditions.
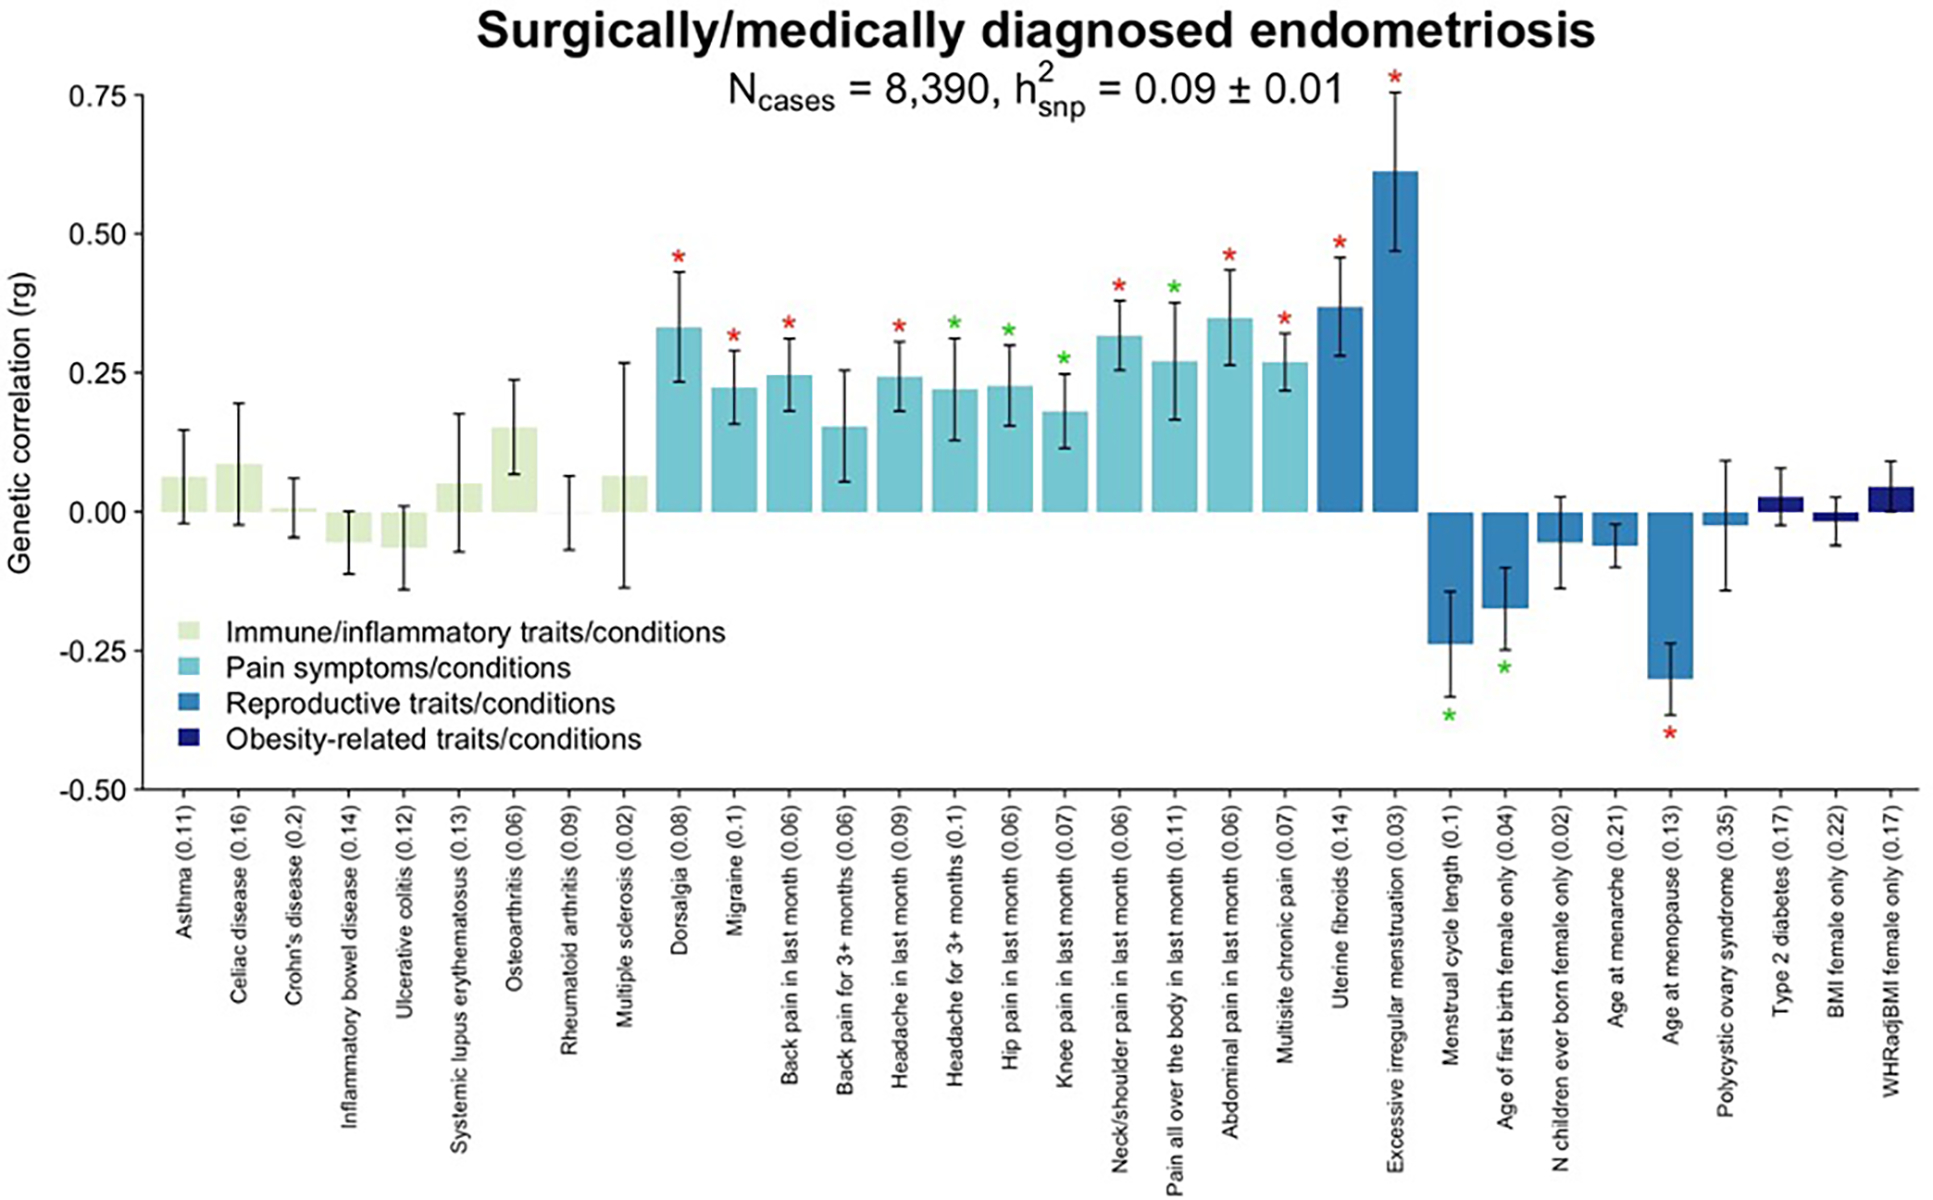
Genetic correlation between only surgically or medically confirmed endometriosis (N=8,390 cases) and 32 immune/inflammatory, pain, reproductive, and metabolic traits/conditions using LD score regression analysis (LDSC). Heritability of each trait is noted in parenthesis on the x-axis. The significance threshold is adjusted for multiple testing using Bonferroni correction. Significant (p<1.56×10⁻³) correlations are denoted with a red star (*), nominal correlation (p<0.05) with a green star (*). Bars present the genetic correlation (rg) for each trait in relation to endometriosis and the error bars are standard errors. The exact p-values are provided in Supplementary Table 25.
Extended Data Figure 10. Genetic correlation results between endometriosis and 19 brain imaging traits in UKBB.
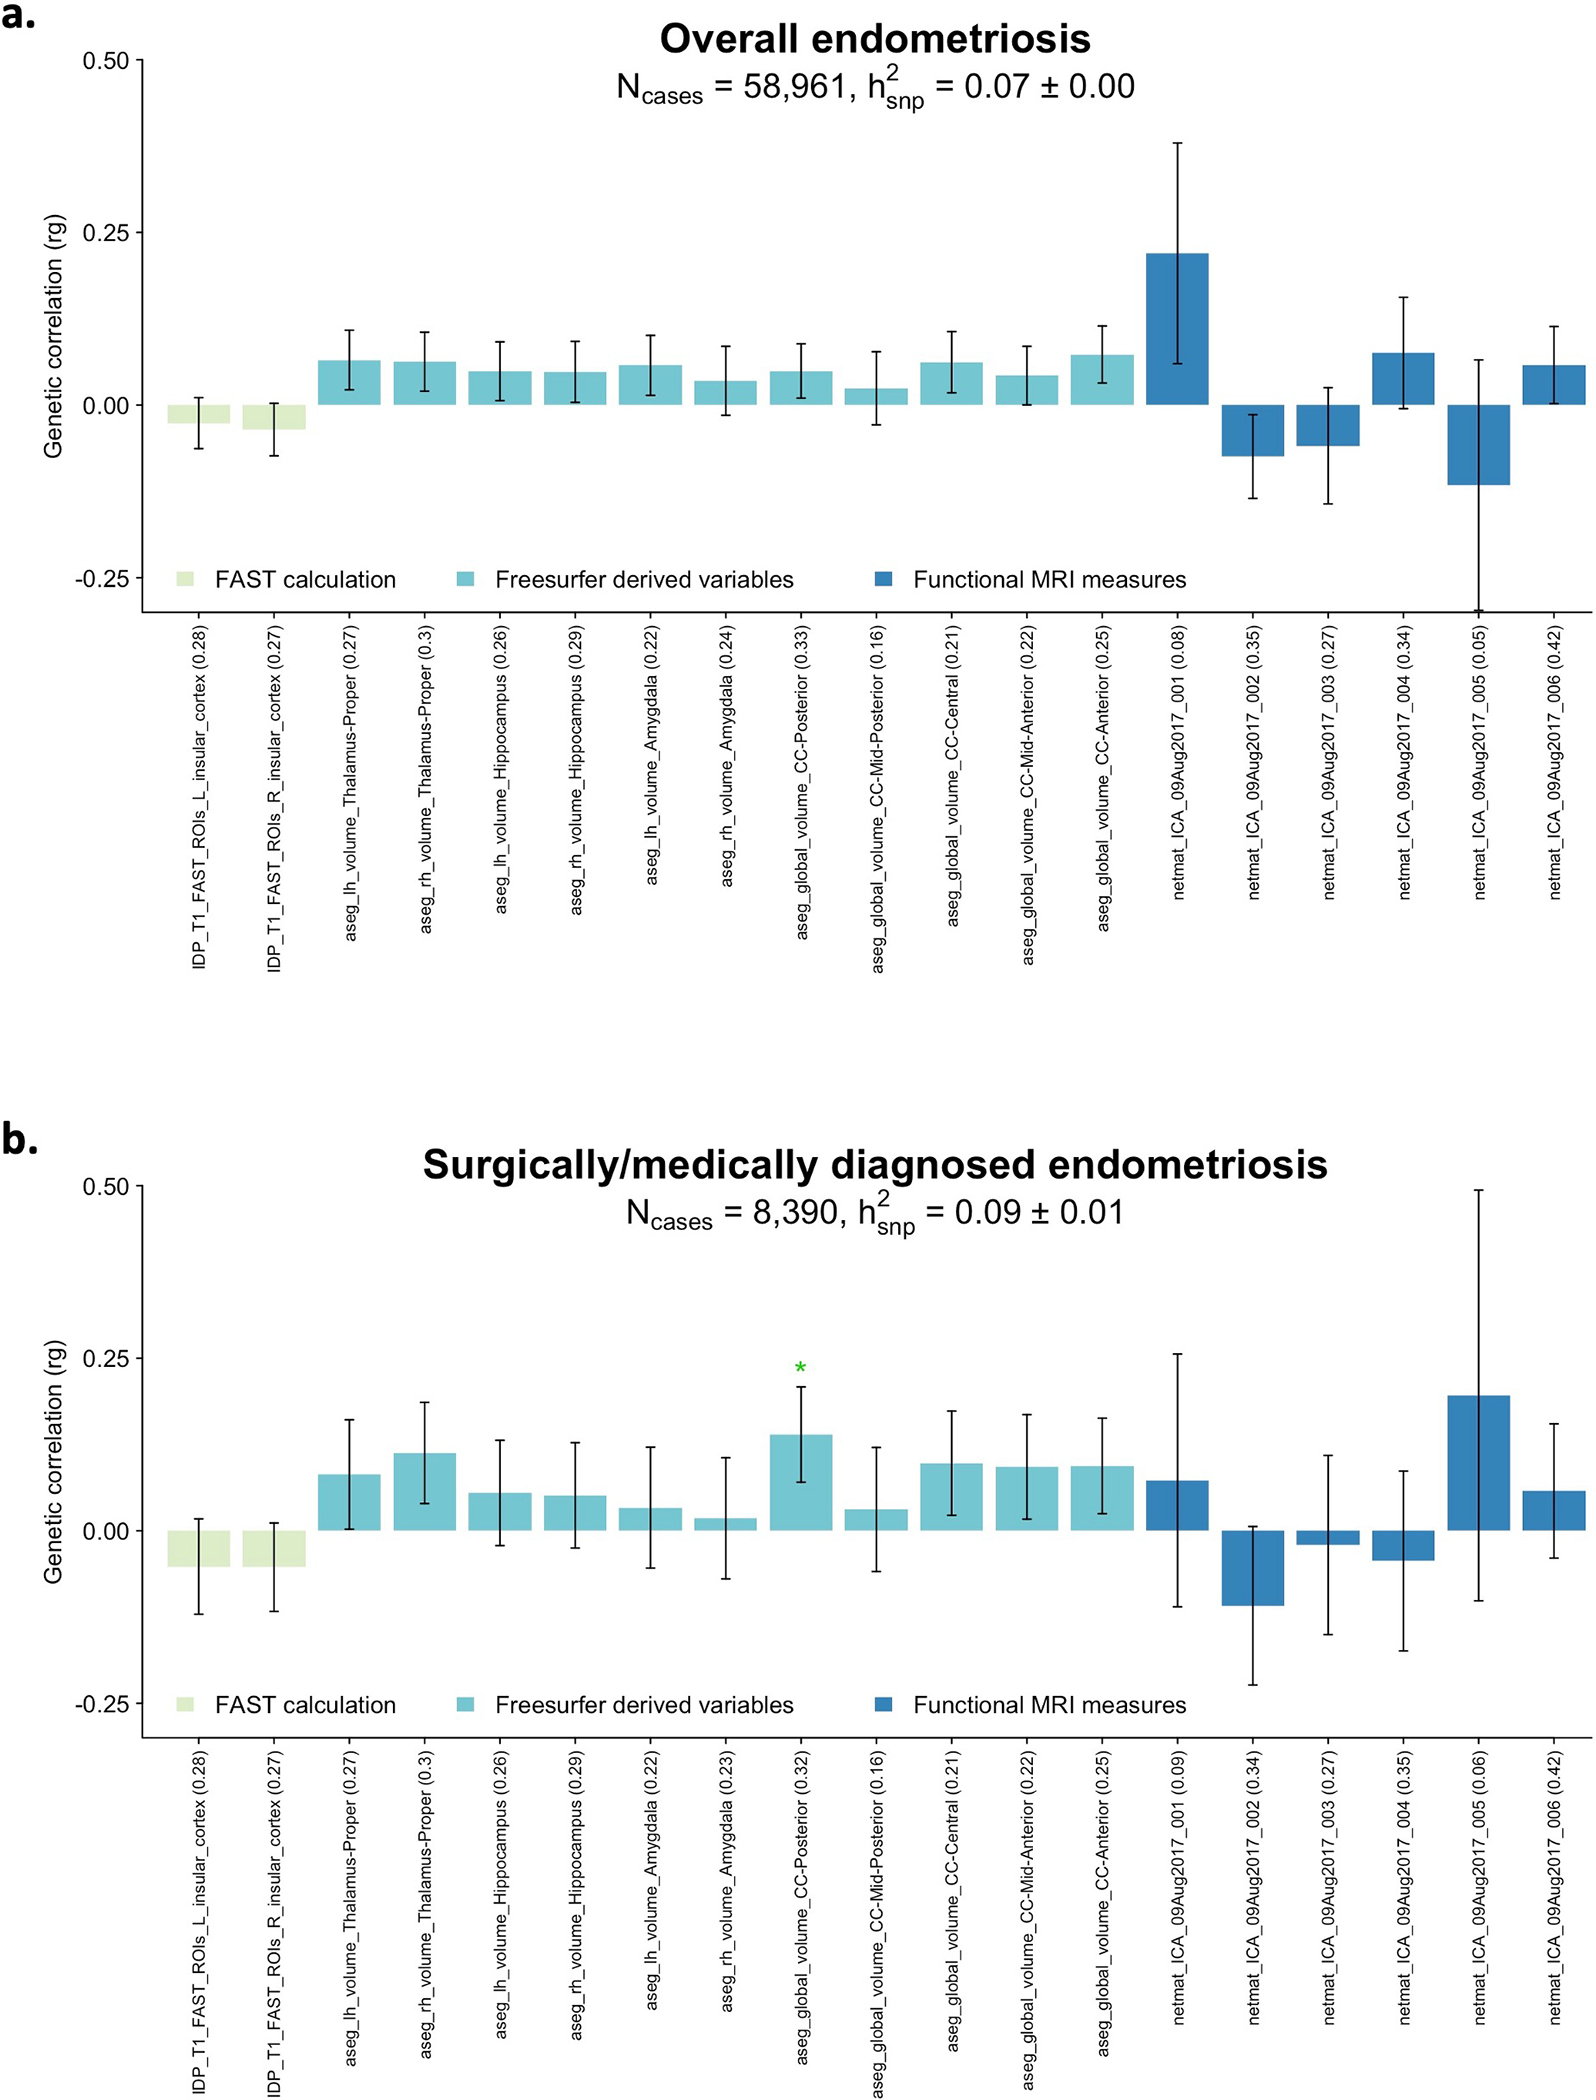
Genetic correlation between 19 brain imaging traits in UKBB and a. endometriosis (N=58,961) and b. surgically or medically confirmed endometriosis (N=8,390 cases) using LD score regression analysis (LDSC). A total of 6 functional MRI measures (netmat_ICA_09Aug2017_001–006), structural MRI measures including 11 freesurfer derived variables (aseg_lh_volume_Left-Thalamus-Proper, aseg_lh_volume_Left-Hippocampus, aseg_lh_ volume_Left-Amygdala, aseg_lh_volume_Right-Thalamus-Proper, aseg_lh_volume_Right-Hippocampus, aseg_lh_volume_Right-Amygdala, aseg_lh_volume_CC_Posterior, aseg_lh_volume_CC_Mid_Posterior, aseg_lh_volume_CC_Central, aseg_lh_volume_CC_Mid_Anterior, aseg_lh_volume_CC_Anterior) and 2 FAST calculations for insula region (IDP_T1_FAST_ROIs_L_insular_cortex, IDP_T1_FAST_ROIs_R_insular_cortex) were analysed. Heritability of each trait is noted in parenthesis on the x-axis. Nominal correlations are denoted with a green star (*). Bars present the genetic correlation (rg) for each trait in relation to endometriosis and the error bars are standard errors. The exact p-values are provided in Supplementary Table 27 and 28.
Supplementary Material
Acknowledgements
We thank all the study participants in the individual studies. We also thank many hospital directors and staff, gynaecologists, general practitioners and pathology services who provided assistance with confirmation of diagnoses. We would like to thank the research participants and employees of 23andMe, Inc. for making this work possible. We thank the women of the Icelandic deCODE study for their participation. We would like to express our gratitude to the staff and members of the Biobank Japan and Laboratory for Statistical Analysis, RIKEN Center for Integrative Medical Sciences for their outstanding assistance. We thank all the UK Biobank participants. Part of this research has been conducted using the UK Biobank Resource under Application Number 9637. Generation Scotland received core support from the Chief Scientist Office of the Scottish Government Health Directorates [CZD/16/6] and the Scottish Funding Council [HR03006] and is currently supported by the Wellcome Trust [216767/Z/19/Z]. Genotyping of the GS:SFHS samples was carried out by the Genetics Core Laboratory at the Edinburgh Clinical Research Facility, University of Edinburgh, Scotland and was funded by the Medical Research Council UK and the Wellcome Trust (Wellcome Trust Strategic Award “STratifying Resilience and Depression Longitudinally” (STRADL) Reference 104036/Z/14/Z. The QIMR study was supported by grants from the National Health and Medical Research Council (NHMRC) of Australia (GNT241944, GNT339462, GNT389927, GNT389875, GNT389891, GNT389892, GNT389938, GNT443036, GNT442915, GNT442981, GNT496610, GNT496739, GNT552485, GNT552498, GNT1026033, GNT1050208 and GNT1147846), the Cooperative Research Centre for Discovery of Genes for Common Human Diseases (CRC), Cerylid Biosciences (Melbourne) and donations from N. Hawkins and S. Hawkins. Analyses of the QIMRHCS and OX GWAS were supported by the Wellcome Trust (WT084766/Z/08/Z) and makes use of WTCCC2 control data generated by the Wellcome Trust Case-Control Consortium (awards 076113 and 085475). The ENDOX gene expression analyses were funded by the Medical Research Council UK (MR/K011480/1). We thank the participants of the Women’s Health Study: From Adolescence to Adulthood (A2A) for their valuable contributions and all staff of the Boston Center for Endometriosis. Financial support for establishment of and data collection within the A2A cohort was provided by the J. Willard and Alice S. Marriott Foundation. A.L.S., K.L.T., S.A.M were supported by NICHD R01 HD094842 and NICHD R21 HD096358 from the Eunice Kennedy Shriver National Institute of Child Health and Human Development. We would like to thank the participants and staff of the Nurses’ Health Study (NHS) and Nurses’ Health Study 2 (NHS2) cohorts for their contributions. NHS/NHS2 are supported by grants UM1 CA186107 and UM1 CA176726 from the National Institutes of Health. C.T., P.K., S.A.M. were supported by NICHD R01 HD096033. S.A.M. and K.T.Z. gratefully acknowledge funding provided by the Nezhat Family Foundation on behalf of Worldwide EndoMarch to their research programmes. N.R. was supported by a grant from Wellbeing of Women UK (RG2031) and the EU Horizon 2020 funded project FEMaLe (ID 101017562). G.W.M. was supported by NHMRC Fellowships (GNT0613667, GNT1078399, and GNT1177194), D.R.N. was supported by NHMRC Fellowship (GNT0613674); and ARC Future Fellowship (FT0991022), S.Mortlock by Australian Government Medical Research Future Fund Research Grant (MRF1199785) and S.MacGregor by Australian National Health and Medical Research Council Fellowship. A.P.M. was supported in part by Versus Arthritis (grant 21754). The Melbourne study was supported by grants from the National Health and Medical Research Council (NHMRC) of Australia (GNT1026033, GNT1046880, GNT1049472, GNT1105321, and GNT1147846). R.M. and M.L. were supported by Estonian Research Council grant PRG1911, M.S. and M.P. by Estonian Research Council grant PRG1076 and A.S. by Estonian Research Council grant PRG1076, Horizon 2020 innovation (ERIN) (EU952516) of the European Commission and Enter-prise Estonia (EU48695), MSCA-RISE-2020 project TRENDO (101008193). B.M., M.S.K., E.K., M.S., A.S.G., and D.S. were supported by Polish POIG grant 01.01.02-10-005/08 TESTOPLEK from the European Regional Development Fund. B.N. and D.W. were supported by NNF14CC0001, NNF17OC0027594 and NNF18SA0034956. J.F.D., J.E.G., M.H., S.H.C. and P.A.W.R. were supported by NHMRC GNT1105321. S.H., J.C.I., S.S., M.P., K.C.V., M.S. and L.C.G. were supported by NIH NICHD R01HD089511. J.K. was supported by The Sigrid Juselius Foundation, the Academy of Finland (297338 and 307247) and Novo Nordisk Foundation (NNF17OC0026062). C.M.L. was supported by the Li Ka Shing Foundation, NIHR Oxford Biomedical Research Centre, Oxford, NIH (1P50HD104224-01), Gates Foundation (INV-024200), and Wellcome Trust Investigator Award (221782/Z/20/Z). A.S. was supported by J. Willard and Alice S. Marriott Foundation, NIH NICHD R21 HD096358, NIH NICHD R01 HD094842. D.K.H. was supported by Wellbeing of Women (RG2137 and RG1073). C.H. was supported by MRC University Unit Programme Grant (MC_UU_00007/10 - QTL in Health and Disease). D.C.W. was supported by NHMRC APP1155413, APP1185416, APP1073898, APP1063061. M.N. acknowledge the Novo Nordisk Foundation (NNF21OC0071050). K.B. acknowledge the Novo Nordisk Foundation (NNF17OC0027594 and NNF14CC0001). TwinsUK receives funding from the Wellcome Trust (212904/Z/18/Z),Chronic Disease Research Foundation (CDRF), and European Union (H2020 contract no. 733100). TwinsUK and M. M. are supported by the National Institute for Health Research (NIHR)-funded BioResource, Clinical Research Facility and Biomedical Research Centre based at Guy’s and St Thomas’ NHS Foundation Trust in partnership with King’s College London.
This research was funded in part by The Wellcome Trust (216767; 104036; 084766; 212904; 076113 and 085475). For the purpose of Open Access, the author has applied a CC BY public copyright licence to any Author Accepted Manuscript (AAM) version arising from this submission.
Footnotes
Competing Interests
L.S., G.T., K.S. and V.S. are employees of deCODE Genetics/Amgen. G.G., C.C. and P.Y.B. are employees of Celmatix Inc., and hold stock or stock options in Celmatix Inc. P.F. and J.Y.T. are employees of 23andMe Inc. O.H. serves occasionally on advisory boards for Bayer AG, Gedeon Richter, HRA Pharma, and Vifor Pharma, and has lectured at educational events for Bayer AG, Gedeon Richter, and Sandoz AG. C.M.L. receives grant support from Bayer AG, Novo Nordisk and her husband works for Vertex. J.R. spouse receives salary and stock options from Merck & Co. K.V. receives research funding from Bayer Healthcare and Honorarium for Consultancy and Lectures from Bayer Healthcare, Grunenthal GmBH, AbbVie and Eli Lilly. T.D. is employee of Merck Healthcare KGaA, Darmstadt, Germany. T. S. is the co-founder and shareholder of Zoe Global Ltd. P.A.W.R. is an advisory board member for Bayer AG. O.U. lectured at educational events for Exeltis and Merck. K.L.T. report an endometriosis grant from Aspira which is not relevant to the submitted work. K.T.Z. and C.M.B. reported grants from Bayer AG, AbbVie Inc, Volition Rx, MDNA Life Sciences, Roche Diagnostics Inc. outside the submitted work. The remaining authors declare no competing interests.
Consortium
DBDS Genomic Consortium
Karina Banasik16, Kristoffer S Burgdorf24, Kari Stefansson6,90, Mette Nyegaard5,91. A full list of members and their affiliations appears in the Supplementary Information.
FinnGen
Paivi Harkki33, Oskari Heikinheimo33, Johannes Kettunen19,20,42, Venla Kurra44,45, Hannele Laivuori44,45,46,47, Outi Uimari81,82,83. A full list of members and their affiliations appears in the Supplementary Information.
FinnGen Endometriosis Taskforce Paivi Harkki33, Oskari Heikinheimo33, Johannes Kettunen19,20,42, Venla Kurra44,45, Hannele Laivuori44,45,46,47, Outi Uimari81,82,83. A full list of members and their affiliations appears in the Supplementary Information.
The Celmatix Research Team
Geneviève Galarneau7, Caterina Clementi7, Piraye Yurttas-Beim7.
The 23andMe Research Team
References
- 1.Zondervan KT, Becker CM & Missmer SA Endometriosis. N Engl J Med 382, 1244–1256 (2020). [DOI] [PubMed] [Google Scholar]
- 2.Nnoaham KE et al. Impact of endometriosis on quality of life and work productivity: a multicenter study across ten countries. Fertil Steril 96, 366–373 e8 (2011). [DOI] [PMC free article] [PubMed] [Google Scholar]
- 3.ASRM. Revised American Society for Reproductive Medicine classification of endometriosis: 1996. Fertil Steril 67, 817–21 (1997). [DOI] [PubMed] [Google Scholar]
- 4.Saha R et al. Heritability of endometriosis. Fertil Steril 104, 947–952 (2015). [DOI] [PubMed] [Google Scholar]
- 5.Treloar SA, O’Connor DT, O’Connor VM & Martin NG Genetic influences on endometriosis in an Australian twin sample. sueT@qimr.edu.au. Fertil Steril 71, 701–10 (1999). [DOI] [PubMed] [Google Scholar]
- 6.Lee SH et al. Estimation and partitioning of polygenic variation captured by common SNPs for Alzheimer’s disease, multiple sclerosis and endometriosis. Hum Mol Genet 22, 832–41 (2013). [DOI] [PMC free article] [PubMed] [Google Scholar]
- 7.Zondervan KT et al. Endometriosis. Nat Rev Dis Primers 4, 9 (2018). [DOI] [PubMed] [Google Scholar]
- 8.Sapkota Y et al. Meta-analysis identifies five novel loci associated with endometriosis highlighting key genes involved in hormone metabolism. Nat Commun 8, 15539 (2017). [DOI] [PMC free article] [PubMed] [Google Scholar]
- 9.Painter JN et al. Genome-wide association study identifies a locus at 7p15.2 associated with endometriosis. Nat Genet 43, 51–4 (2011). [DOI] [PMC free article] [PubMed] [Google Scholar]
- 10.Fung JN et al. Genetic regulation of disease risk and endometrial gene expression highlights potential target genes for endometriosis and polycystic ovarian syndrome. Sci Rep 8, 11424 (2018). [DOI] [PMC free article] [PubMed] [Google Scholar]
- 11.Mortlock S et al. Tissue specific regulation of transcription in endometrium and association with disease. Hum Reprod 35, 377–393 (2020). [DOI] [PMC free article] [PubMed] [Google Scholar]
- 12.Võsa U Unraveling the polygenic architecture of complex traits using blood eQTL meta-analysis. BioRxiv (2018). [Google Scholar]
- 13.McRae AF et al. Identification of 55,000 Replicated DNA Methylation QTL. Sci Rep 8, 17605 (2018). [DOI] [PMC free article] [PubMed] [Google Scholar]
- 14.Mortlock S et al. Genetic regulation of methylation in human endometrium and blood and gene targets for reproductive diseases. Clin Epigenetics 11, 49 (2019). [DOI] [PMC free article] [PubMed] [Google Scholar]
- 15.Zhu Z et al. Integration of summary data from GWAS and eQTL studies predicts complex trait gene targets. Nat Genet 48, 481–7 (2016). [DOI] [PubMed] [Google Scholar]
- 16.Fung JN et al. Functional evaluation of genetic variants associated with endometriosis near GREB1. Hum Reprod 30, 1263–75 (2015). [DOI] [PubMed] [Google Scholar]
- 17.Jones AV et al. Genome-wide association analysis of pain severity in dysmenorrhea identifies association at chromosome 1p13.2, near the nerve growth factor locus. Pain 157, 2571–2581 (2016). [DOI] [PMC free article] [PubMed] [Google Scholar]
- 18.Barneo-Munoz M et al. Lack of GDAP1 induces neuronal calcium and mitochondrial defects in a knockout mouse model of charcot-marie-tooth neuropathy. PLoS Genet 11, e1005115 (2015). [DOI] [PMC free article] [PubMed] [Google Scholar]
- 19.Ruth KS et al. Using human genetics to understand the disease impacts of testosterone in men and women. Nat Med 26, 252–258 (2020). [DOI] [PMC free article] [PubMed] [Google Scholar]
- 20.Zhai G et al. Eight common genetic variants associated with serum DHEAS levels suggest a key role in ageing mechanisms. PLoS Genet 7, e1002025 (2011). [DOI] [PMC free article] [PubMed] [Google Scholar]
- 21.Rahmani A, Shoae-Hassani A, Keyhanvar P, Kheradmand D & Darbandi-Azar A Dehydroepiandrosterone stimulates nerve growth factor and brain derived neurotrophic factor in cortical neurons. Adv Pharmacol Sci 2013, 506191 (2013). [DOI] [PMC free article] [PubMed] [Google Scholar]
- 22.Maninger N, Wolkowitz OM, Reus VI, Epel ES & Mellon SH Neurobiological and neuropsychiatric effects of dehydroepiandrosterone (DHEA) and DHEA sulfate (DHEAS). Front Neuroendocrinol 30, 65–91 (2009). [DOI] [PMC free article] [PubMed] [Google Scholar]
- 23.Obata K & Noguchi K BDNF in sensory neurons and chronic pain. Neurosci Res 55, 1–10 (2006). [DOI] [PubMed] [Google Scholar]
- 24.Browne AS et al. Proteomic identification of neurotrophins in the eutopic endometrium of women with endometriosis. Fertil Steril 98, 713–9 (2012). [DOI] [PMC free article] [PubMed] [Google Scholar]
- 25.Wang S et al. BDNF and TrKB expression levels in patients with endometriosis and their associations with dysmenorrhoea. J Ovarian Res 15, 35 (2022). [DOI] [PMC free article] [PubMed] [Google Scholar]
- 26.Peng B, Alotaibi FT, Sediqi S, Bedaiwy MA & Yong PJ Role of interleukin-1beta in nerve growth factor expression, neurogenesis and deep dyspareunia in endometriosis. Hum Reprod 35, 901–912 (2020). [DOI] [PMC free article] [PubMed] [Google Scholar]
- 27.Vitonis AF et al. World Endometriosis Research Foundation Endometriosis Phenome and Biobanking Harmonization Project: II. Clinical and covariate phenotype data collection in endometriosis research. Fertil Steril 102, 1223–32 (2014). [DOI] [PMC free article] [PubMed] [Google Scholar]
- 28.Nathan A et al. The Wilms tumor protein Wt1 contributes to female fertility by regulating oviductal proteostasis. Hum Mol Genet 26, 1694–1705 (2017). [DOI] [PMC free article] [PubMed] [Google Scholar]
- 29.O’Mara TA et al. Comprehensive genetic assessment of the ESR1 locus identifies a risk region for endometrial cancer. Endocr Relat Cancer 22, 851–61 (2015). [DOI] [PMC free article] [PubMed] [Google Scholar]
- 30.Marla S et al. Genetic risk factors for endometriosis near estrogen receptor 1 and coexpression of genes in this region in endometrium. Mol Hum Reprod 27(2021). [DOI] [PMC free article] [PubMed] [Google Scholar]
- 31.Smith SB et al. Epistasis between polymorphisms in COMT, ESR1, and GCH1 influences COMT enzyme activity and pain. Pain 155, 2390–9 (2014). [DOI] [PMC free article] [PubMed] [Google Scholar]
- 32.Martin VT Ovarian hormones and pain response: a review of clinical and basic science studies. Gend Med 6 Suppl 2, 168–92 (2009). [DOI] [PubMed] [Google Scholar]
- 33.Smith YR et al. Pronociceptive and antinociceptive effects of estradiol through endogenous opioid neurotransmission in women. J Neurosci 26, 5777–85 (2006). [DOI] [PMC free article] [PubMed] [Google Scholar]
- 34.Bulik-Sullivan B et al. An atlas of genetic correlations across human diseases and traits. Nat Genet 47, 1236–41 (2015). [DOI] [PMC free article] [PubMed] [Google Scholar]
- 35.Bulik-Sullivan BK et al. LD Score regression distinguishes confounding from polygenicity in genome-wide association studies. Nat Genet 47, 291–5 (2015). [DOI] [PMC free article] [PubMed] [Google Scholar]
- 36.Shafrir AL et al. Risk for and consequences of endometriosis: A critical epidemiologic review. Best Pract Res Clin Obstet Gynaecol 51, 1–15 (2018). [DOI] [PubMed] [Google Scholar]
- 37.Missmer SA et al. Reproductive history and endometriosis among premenopausal women. Obstet Gynecol 104, 965–74 (2004). [DOI] [PubMed] [Google Scholar]
- 38.Sampson JA Metastatic or Embolic Endometriosis, due to the Menstrual Dissemination of Endometrial Tissue into the Venous Circulation. Am J Pathol 3, 93–110 43 (1927). [PMC free article] [PubMed] [Google Scholar]
- 39.Barban N et al. Genome-wide analysis identifies 12 loci influencing human reproductive behavior. Nat Genet 48, 1462–1472 (2016). [DOI] [PMC free article] [PubMed] [Google Scholar]
- 40.As-Sanie S et al. Changes in regional gray matter volume in women with chronic pelvic pain: a voxel-based morphometry study. Pain 153, 1006–14 (2012). [DOI] [PMC free article] [PubMed] [Google Scholar]
- 41.Coxon L, Horne AW & Vincent K Pathophysiology of endometriosis-associated pain: A review of pelvic and central nervous system mechanisms. Best Pract Res Clin Obstet Gynaecol (2018). [DOI] [PubMed] [Google Scholar]
- 42.Bajaj P, Bajaj P, Madsen H & Arendt-Nielsen L Endometriosis is associated with central sensitization: a psychophysical controlled study. J Pain 4, 372–80 (2003). [DOI] [PubMed] [Google Scholar]
- 43.Berkley KJ, Rapkin AJ & Papka RE The pains of endometriosis. Science 308, 1587–9 (2005). [DOI] [PubMed] [Google Scholar]
- 44.Vincent K et al. Dysmenorrhoea is associated with central changes in otherwise healthy women. Pain 152, 1966–75 (2011). [DOI] [PubMed] [Google Scholar]
- 45.Elliott LT et al. Genome-wide association studies of brain imaging phenotypes in UK Biobank. Nature 562, 210–216 (2018). [DOI] [PMC free article] [PubMed] [Google Scholar]
- 46.Kamat MA et al. PhenoScanner V2: an expanded tool for searching human genotype-phenotype associations. Bioinformatics 35, 4851–4853 (2019). [DOI] [PMC free article] [PubMed] [Google Scholar]
- 47.Turley P et al. Multi-trait analysis of genome-wide association summary statistics using MTAG. Nat Genet 50, 229–237 (2018). [DOI] [PMC free article] [PubMed] [Google Scholar]
- 48.Ilad RS, Fleming SD, Bebington CR & Murphy CR Ubiquitin is associated with the survival of ectopic stromal cells in endometriosis. Reprod Biol Endocrinol 2, 69 (2004). [DOI] [PMC free article] [PubMed] [Google Scholar]
- 49.Cheng J, Deng Y & Zhou J Role of the Ubiquitin System in Chronic Pain. Front Mol Neurosci 14, 674914 (2021). [DOI] [PMC free article] [PubMed] [Google Scholar]
- 50.Garcia-Gomez E et al. Regulation of Inflammation Pathways and Inflammasome by Sex Steroid Hormones in Endometriosis. Front Endocrinol (Lausanne) 10, 935 (2019). [DOI] [PMC free article] [PubMed] [Google Scholar]
- 51.Ding YQ, Luo H & Qi JG MHCII-restricted T helper cells: an emerging trigger for chronic tactile allodynia after nerve injuries. J Neuroinflammation 17, 3 (2020). [DOI] [PMC free article] [PubMed] [Google Scholar]
- 52.Gougeon A Human ovarian follicular development: from activation of resting follicles to preovulatory maturation. Ann Endocrinol (Paris) 71, 132–43 (2010). [DOI] [PubMed] [Google Scholar]
- 53.Jones MR & Goodarzi MO Genetic determinants of polycystic ovary syndrome: progress and future directions. Fertil Steril 106, 25–32 (2016). [DOI] [PubMed] [Google Scholar]
- 54.Ruth KS et al. Genetic evidence that lower circulating FSH levels lengthen menstrual cycle, increase age at menopause and impact female reproductive health. Hum Reprod 31, 473–81 (2016). [DOI] [PMC free article] [PubMed] [Google Scholar]
- 55.Ruth KS et al. Genome-wide association study with 1000 genomes imputation identifies signals for nine sex hormone-related phenotypes. Eur J Hum Genet 24, 284–90 (2016). [DOI] [PMC free article] [PubMed] [Google Scholar]
- 56.Gregus AM, Levine IS, Eddinger KA, Yaksh TL & Buczynski MW Sex differences in neuroimmune and glial mechanisms of pain. Pain 162, 2186–2200 (2021). [DOI] [PMC free article] [PubMed] [Google Scholar]
- 57.Lenert ME, Avona A, Garner KM, Barron LR & Burton MD Sensory Neurons, Neuroimmunity, and Pain Modulation by Sex Hormones. Endocrinology 162(2021). [DOI] [PMC free article] [PubMed] [Google Scholar]
- 58.Choi EJ et al. Comorbidity of gynecological and non-gynecological diseases with adenomyosis and endometriosis. Obstet Gynecol Sci 60, 579–586 (2017). [DOI] [PMC free article] [PubMed] [Google Scholar]
- 59.Loughlin AM et al. Method used to identify adenomyosis and potentially undiagnosed adenomyosis in a large, U.S. electronic health record database. Pharmacoepidemiol Drug Saf 30, 1675–1686 (2021). [DOI] [PubMed] [Google Scholar]
- 60.Powell JE et al. Endometriosis risk alleles at 1p36.12 act through inverse regulation of CDC42 and LINC00339. Hum Mol Genet 25, 5046–5058 (2016). [DOI] [PubMed] [Google Scholar]
- 61.Cohen SP, Vase L & Hooten WM Chronic pain: an update on burden, best practices, and new advances. Lancet 397, 2082–2097 (2021). [DOI] [PubMed] [Google Scholar]
- 62.Kvaskoff M et al. Endometriosis: a high-risk population for major chronic diseases? Hum Reprod Update 21, 500–16 (2015). [DOI] [PMC free article] [PubMed] [Google Scholar]
- 63.Shafrir AL et al. Co-occurrence of immune-mediated conditions and endometriosis among adolescents and adult women. Am J Reprod Immunol 86, e13404 (2021). [DOI] [PMC free article] [PubMed] [Google Scholar]
- 64.Tapmeier TT et al. Neuropeptide S receptor 1 is a nonhormonal treatment target in endometriosis. Sci Transl Med 13(2021). [DOI] [PubMed] [Google Scholar]
- 65.Shigesi N et al. The association between endometriosis and autoimmune diseases: a systematic review and meta-analysis. Hum Reprod Update 25, 486–503 (2019). [DOI] [PMC free article] [PubMed] [Google Scholar]
- 66.McGonagle D & McDermott MF A proposed classification of the immunological diseases. PLoS Med 3, e297 (2006). [DOI] [PMC free article] [PubMed] [Google Scholar]
- 67.Parazzini F & Progretto Menopausa Italia Study, G. Menopausal status, hormone replacement therapy use and risk of self-reported physician-diagnosed osteoarthritis in women attending menopause clinics in Italy. Maturitas 46, 207–12 (2003). [DOI] [PubMed] [Google Scholar]
- 68.O’Mara TA, Spurdle AB, Glubb DM & Endometrial Cancer Association C Analysis of Promoter-Associated Chromatin Interactions Reveals Biologically Relevant Candidate Target Genes at Endometrial Cancer Risk Loci. Cancers (Basel) 11(2019). [DOI] [PMC free article] [PubMed] [Google Scholar]
- 69.Genomes Project C et al. An integrated map of genetic variation from 1,092 human genomes. Nature 491, 56–65 (2012). [DOI] [PMC free article] [PubMed] [Google Scholar]
- 70.Genomes Project C et al. A global reference for human genetic variation. Nature 526, 68–74 (2015). [DOI] [PMC free article] [PubMed] [Google Scholar]
- 71.McCarthy S et al. A reference panel of 64,976 haplotypes for genotype imputation. Nat Genet 48, 1279–83 (2016). [DOI] [PMC free article] [PubMed] [Google Scholar]
- 72.Jonsson H et al. Whole genome characterization of sequence diversity of 15,220 Icelanders. Sci Data 4, 170115 (2017). [DOI] [PMC free article] [PubMed] [Google Scholar]
- 73.Mitt M et al. Improved imputation accuracy of rare and low-frequency variants using population-specific high-coverage WGS-based imputation reference panel. Eur J Hum Genet 25, 869–876 (2017). [DOI] [PMC free article] [PubMed] [Google Scholar]
- 74.Cook JP, Mahajan A & Morris AP Guidance for the utility of linear models in meta-analysis of genetic association studies of binary phenotypes. Eur J Hum Genet 25, 240–245 (2017). [DOI] [PMC free article] [PubMed] [Google Scholar]
- 75.Devlin B & Roeder K Genomic control for association studies. Biometrics 55, 997–1004 (1999). [DOI] [PubMed] [Google Scholar]
- 76.Willer CJ, Li Y & Abecasis GR METAL: fast and efficient meta-analysis of genomewide association scans. Bioinformatics 26, 2190–1 (2010). [DOI] [PMC free article] [PubMed] [Google Scholar]
- 77.Magi R, Lindgren CM & Morris AP Meta-analysis of sex-specific genome-wide association studies. Genet Epidemiol 34, 846–53 (2010). [DOI] [PMC free article] [PubMed] [Google Scholar]
- 78.Yang J, Lee SH, Goddard ME & Visscher PM GCTA: a tool for genome-wide complex trait analysis. Am J Hum Genet 88, 76–82 (2011). [DOI] [PMC free article] [PubMed] [Google Scholar]
- 79.Wang H et al. SKAP-55 regulates integrin adhesion and formation of T cell-APC conjugates. Nat Immunol 4, 366–74 (2003). [DOI] [PubMed] [Google Scholar]
- 80.Morris AP et al. Large-scale association analysis provides insights into the genetic architecture and pathophysiology of type 2 diabetes. Nat Genet 44, 981–90 (2012). [DOI] [PMC free article] [PubMed] [Google Scholar]
- 81.Janssen EB, Rijkers AC, Hoppenbrouwers K, Meuleman C & D’Hooghe TM Prevalence of endometriosis diagnosed by laparoscopy in adolescents with dysmenorrhea or chronic pelvic pain: a systematic review. Hum Reprod Update 19, 570–82 (2013). [DOI] [PubMed] [Google Scholar]
- 82.Zondervan KT, Cardon LR & Kennedy SH The genetic basis of endometriosis. Curr Opin Obstet Gynecol 13, 309–14 (2001). [DOI] [PubMed] [Google Scholar]
- 83.Wakefield J A Bayesian measure of the probability of false discovery in genetic epidemiology studies. Am J Hum Genet 81, 208–27 (2007). [DOI] [PMC free article] [PubMed] [Google Scholar]
- 84.Wellcome Trust Case Control, C. et al. Bayesian refinement of association signals for 14 loci in 3 common diseases. Nat Genet 44, 1294–301 (2012). [DOI] [PMC free article] [PubMed] [Google Scholar]
- 85.Watanabe K, Taskesen E, van Bochoven A & Posthuma D Functional mapping and annotation of genetic associations with FUMA. Nat Commun 8, 1826 (2017). [DOI] [PMC free article] [PubMed] [Google Scholar]
- 86.O’Mara TA, Spurdle AB & Glubb DM Analysis of Promoter-Associated Chromatin Interactions Reveals Biologically Relevant Candidate Target Genes at Endometrial Cancer Risk Loci. Cancers (Basel) 11(2019). [DOI] [PMC free article] [PubMed] [Google Scholar]
- 87.Jain A & Tuteja G TissueEnrich: Tissue-specific gene enrichment analysis. Bioinformatics 35, 1966–1967 (2019). [DOI] [PMC free article] [PubMed] [Google Scholar]
- 88.Uhlen M et al. Proteomics. Tissue-based map of the human proteome. Science 347, 1260419 (2015). [DOI] [PubMed] [Google Scholar]
- 89.Consortium GT Human genomics. The Genotype-Tissue Expression (GTEx) pilot analysis: multitissue gene regulation in humans. Science 348, 648–60 (2015). [DOI] [PMC free article] [PubMed] [Google Scholar]
- 90.Fung JN et al. The genetic regulation of transcription in human endometrial tissue. Hum Reprod 32, 893–904 (2017). [DOI] [PubMed] [Google Scholar]
- 91.Gamazon ER et al. Using an atlas of gene regulation across 44 human tissues to inform complex disease- and trait-associated variation. Nat Genet 50, 956–967 (2018). [DOI] [PMC free article] [PubMed] [Google Scholar]
- 92.Consortium GT et al. Genetic effects on gene expression across human tissues. Nature 550, 204–213 (2017). [DOI] [PMC free article] [PubMed] [Google Scholar]
- 93.Qi T et al. Identifying gene targets for brain-related traits using transcriptomic and methylomic data from blood. Nat Commun 9, 2282 (2018). [DOI] [PMC free article] [PubMed] [Google Scholar]
- 94.Vosa U, C.A., Westra HJ, Bonder MJ, Deelen P, Zeng B, Kirsten H, Saha A, Kreuzhuber R, Kasela S, Pervjakova N, et al. Unraveling the polygenic arhitecture of complex traits using blood eQTL metaanalysis. BioRxiv (2018). [Google Scholar]
- 95.Robinson MD, McCarthy DJ & Smyth GK edgeR: a Bioconductor package for differential expression analysis of digital gene expression data. Bioinformatics 26, 139–40 (2010). [DOI] [PMC free article] [PubMed] [Google Scholar]
- 96.Delaneau O et al. A complete tool set for molecular QTL discovery and analysis. Nat Commun 8, 15452 (2017). [DOI] [PMC free article] [PubMed] [Google Scholar]
- 97.Zhang F et al. OSCA: a tool for omic-data-based complex trait analysis. Genome Biol 20, 107 (2019). [DOI] [PMC free article] [PubMed] [Google Scholar]
- 98.Gokcen Eraslan ED, Anand Shankara, Subramanian Ayshwarya, Fiskin Evgenij, Slyper Michal, Wang Jiali, Van Wittenberghe Nicholas, Rouhana John M., Waldman Julia, Ashenberg Orr, Dionne Danielle, Win Thet Su, Cuoco Michael S., Kuksenko Olena, Branton Philip A., Marshall Jamie L., Greka Anna, Getz Gad, Segrè Ayellet V., Aguet François, Rozenblatt-Rosen Orit, Ardlie Kristin G., Regev Aviv. Single-nucleus cross-tissue molecular reference maps to decipher disease gene function. (bioRxiv, 2021). [DOI] [PMC free article] [PubMed] [Google Scholar]
- 99.Gordon M, L.T. Advanced Forest Plot Using “Grid” Graphics. (2017).
- 100.Hautakangas H et al. Genome-wide analysis of 102,084 migraine cases identifies 123 risk loci and subtype-specific risk alleles. Nat Genet 54, 152–160 (2022). [DOI] [PMC free article] [PubMed] [Google Scholar]
- 101.Johnston KJA et al. Genome-wide association study of multisite chronic pain in UK Biobank. PLoS Genet 15, e1008164 (2019). [DOI] [PMC free article] [PubMed] [Google Scholar]
Associated Data
This section collects any data citations, data availability statements, or supplementary materials included in this article.
Supplementary Materials
Data Availability Statement
Summary results for the top 10,000 SNPs included in the entire Genome-wide Association Study (GWAS) meta-analysis are provided in Supplementary Table 33. Summary statistics from the endometriosis meta-analysis excluding 23andMe is available from: EBI GWAS Catalog Study Accession GCST90205183. GWAS summary statistics from 23andMe, Inc were made available under a data use agreement that protects participant privacy. Please contact dataset-request@23andme.com or visit research.23andMe.com/collaborate for more information and to apply to access the data. The UK endometrium eQTL dataset (N=163) 1MB around each 42 lead SNPs is provided in Supplementary Table 34–35.


