Abstract
Resolving-type macrophages prevent chronic inflammation by clearing apoptotic cells through efferocytosis. These macrophages are thought to rely mainly on oxidative phosphorylation, but emerging evidence suggests a possible link between efferocytosis and glycolysis. To gain further insight into this issue, we investigated molecular–cellular mechanisms involved in efferocytosis-induced macrophage glycolysis and its consequences. We found that efferocytosis promotes a transient increase in macrophage glycolysis that is dependent on rapid activation of the enzyme 6-phosphofructo-2-kinase/fructose-2,6-bisphosphatase 2 (PFKFB2), which distinguishes this process from glycolysis in pro-inflammatory macrophages. Mice transplanted with activation-defective PFKFB2 bone marrow and then subjected to dexamethasone-induced thymocyte apoptosis exhibit impaired thymic efferocytosis, increased thymic necrosis, and lower expression of the efferocytosis receptors MerTK and LRP1 on thymic macrophages compared with wild-type control mice. In vitro mechanistic studies revealed that glycolysis stimulated by the uptake of a first apoptotic cell promotes continual efferocytosis through lactate-mediated upregulation of MerTK and LRP1. Thus, efferocytosis-induced macrophage glycolysis represents a unique metabolic process that sustains continual efferocytosis in a lactate-dependent manner. The differentiation of this process from inflammatory macrophage glycolysis raises the possibility that it could be therapeutically enhanced to promote efferocytosis and resolution in chronic inflammatory diseases.
A defining characteristic of pro-resolving macrophages is their ability to clear apoptotic cells (ACs) through a process termed efferocytosis. During embryonic development, efferocytosis is required to eliminate excessive cells, and thereby shapes organs and tissues1. Following development, macrophage-mediated efferocytosis is essential to maintain tissue homeostasis, prevent auto-immune disease, and resolve inflammation2,3. Failed or ineffective efferocytosis results in post-apoptotic necrosis of dying cells, which exposes surrounding tissue to damage-associated molecular patterns (DAMPs) that trigger inflammatory reactions. Accordingly, impaired efferocytosis has been implicated in various chronic inflammatory diseases, including chronic lung diseases, inflammatory bowel disease, neurodegenerative diseases, and atherosclerosis2–5.
Efferocytosing macrophages recognize ACs by the expression of ‘eat-me’ molecules on the AC surface, such as phosphatidylserine (PtdSer) and calreticulin, through various receptors, including MER proto-oncogene tyrosine kinase (MerTK) and low-density lipoprotein receptor-related protein 1 (LRP1)5. In addition to facilitating AC binding, these receptors can activate signaling pathways that mediate engulfment of the bound ACs, for example, through stimulation of the small actin-remodeling GTPase Rac1 (refs. 6–8). Rac1 facilitates reorganization of the actin cytoskeleton, which is required for AC engulfment. The process of efferocytosis results in distinct transcriptional signatures and metabolic alterations in pro-resolving macrophages, some of which enhance their ability to subsequently internalize additional ACs9,10. This process, which is referred to as continual efferocytosis, is particularly important in chronic inflammatory diseases, in which ACs far outnumber macrophages11,12. In this regard, Morioka et al.13 have shown that efferocytosis induces a metabolic switch from oxidative phosphorylation to glycolysis by inducing a transcriptional solute carrier (SLC) program, and that this switch is associated with improved efferocytosis and a dampened inflammatory response to lipopolysaccharide (LPS). However, a full understanding of the molecular–cellular mechanisms that account for efferocytosis-induced glycolysis, and particularly how this process differs from inflammation-induced glycolysis, is lacking, and the mechanism underlying glycolysis-enhanced efferocytosis remains to be explored.
Here, we show that efferocytosis promotes a transient increase in macrophage glycolysis that is dependent on acute activation of PFKFB2, which distinguishes this process from glycolysis in inflammatory macrophages. Moreover, a key step in efferocytosis-induced glycolysis is the activation of thioredoxin-interacting protein (TXNIP), which promotes the cell surface expression of GLUT1 and GLUT1-mediated glucose uptake. Subsequently, lactate resulting from this process promotes the expression of efferocytosis receptors MerTK and LRP1 in a calcium-dependent manner to boost continual efferocytosis. In a mouse model of apoptosis and efferocytosis-dependent resolution, defective hematopoietic PFKFB2 causes impairments in macrophage MerTK and LRP1 expression, efferocytosis, and tissue repair. The unique role of PFKFB2 in efferocytosis-induced glycolysis may open up new avenues to safely boost efferocytosis in settings of non-resolving inflammation.
Results
Efferocytosis promotes a transient increase in glycolysis
In line with previous findings14,15, we confirmed that polarization of mouse bone-marrow-derived macrophages (BMDMs) and human monocyte-derived macrophages (HMDMs) towards a pro-inflammatory phenotype by 24-hour treatment with interferon-γ (IFN-γ) and LPS promoted glycolysis, whereas treatment with pro-resolving interleukin-4 (IL-4) stimulated oxidative phosphorylation, as measured by Seahorse analysis (Extended Data Fig. 1a,b). However, a recent report has shown that glycolysis is increased in macrophages undergoing the pro-resolving process of efferocytosis13. To determine how inflammatory-induced and efferocytosis-induced macrophage glycolysis might be distinguished, we began with a Seahorse metabolic flux assay in which macrophages were first incubated with ACs for 45 minutes (pulse), which was followed by rinsing to remove unengulfed ACs and then incubation without ACs for 1, 6, or 24 hours (chase). We found that glycolysis and glycolytic capacity were markedly increased in both BMDMs and HMDMs after the 1-hour chase, as reflected by the extracellular acidification rate (ECAR) (Fig. 1a,b). These endpoints were still increased after 6 hours, but returned to baseline after 24 hours. There was also a transient increase in basal respiration in BMDMs, but this increase was not as robust as the increase in glycolysis, and it was not observed in HMDMs (Extended Data Fig. 2a,b). Of note, most analyses were performed in granulocyte–macrophage colony-stimulating factor (GM-CSF)-differentiated HMDMs, but we observed a similar effect of efferocytosis on glycolysis in macrophage CSF (M-CSF)-differentiated HMDMs (Extended Data Fig. 2c). Moreover, ACs alone showed very little glycolytic and oxidative activity (Extended Data Fig. 2d,e), indicating that any residual ACs that remained after rinsing had a negligible contribution to the metabolic readouts.
Fig. 1 |. Efferocytosis promotes a transient increase in glycolysis in both mouse and human macrophages.
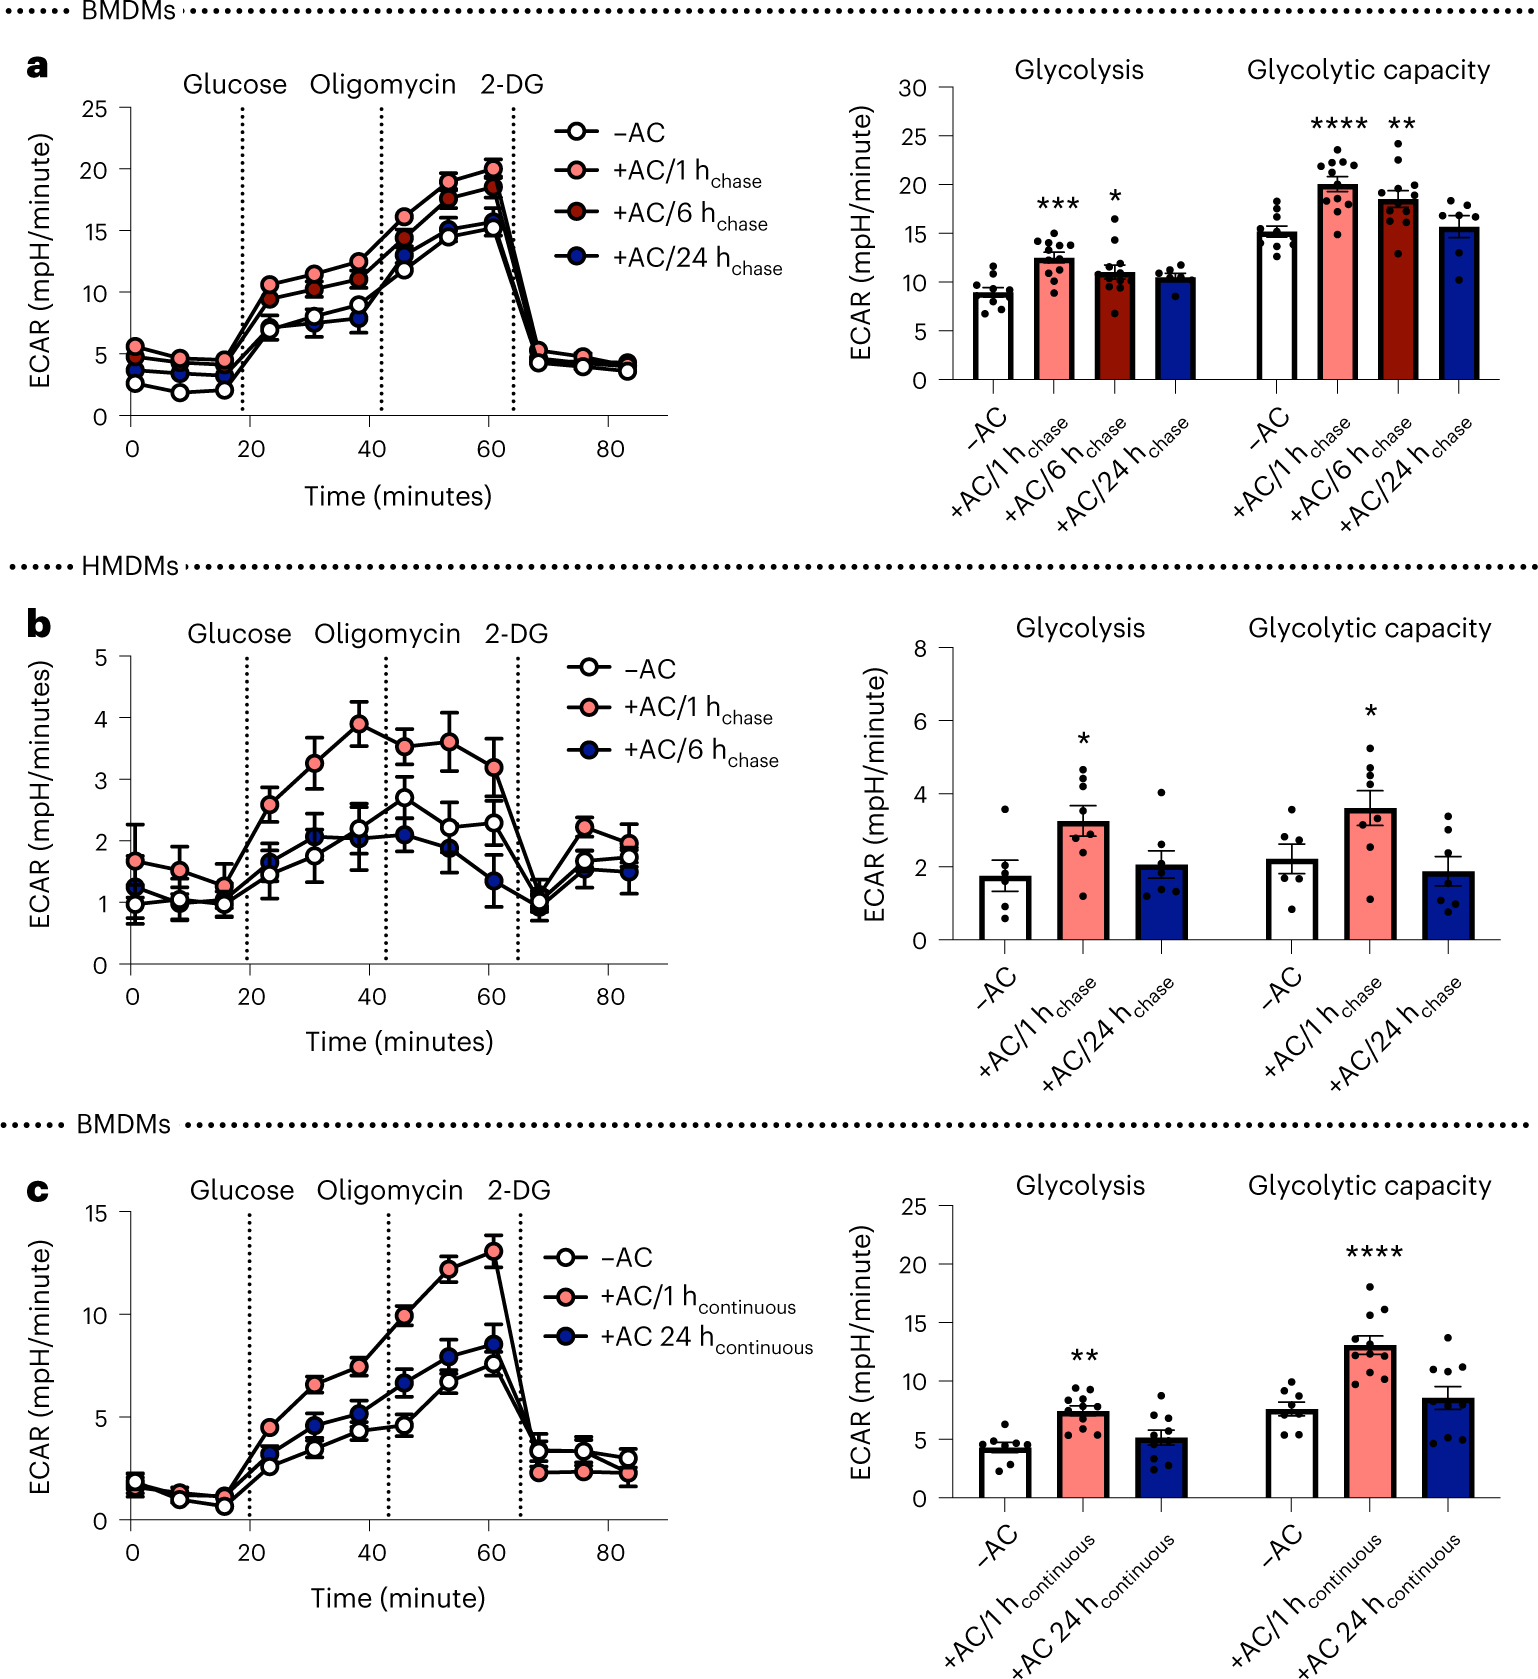
a, BMDMs were incubated with apoptotic Jurkat cells (ACs) for 45 minutes (pulse), followed by rinsing to remove unengulfed ACs, and then subjected to Seahorse analysis 1, 6, or 24 hours later (1 hchase, 6 hchase, 24 hchase, respectively). The ECAR was measured in real time at baseline and after the addition of glucose (‘glycolysis’), oligomycin (‘glycolytic capacity’), and 2-DG (n = 11–12 wells/group). *P = 0.038, **P = 0.0011, ***P = 0.0006, ****P < 0.0001, compared with the control group of macrophages not exposed to ACs (–AC). b, The same experiment as described in a was performed in HMDMs (n = 7–8 wells/group). *P = 0.018 for glycolysis, *P = 0.028 for glycolytic capacity as compared with the –AC control group. c, Seahorse analysis was performed on BMDMs incubated with ACs continuously for 1 or 24 hours (1 hcontinuous and 24 hcontinuous, respectively) (n = 8–11 wells/group). **P = 0.0028, ****P < 0.0001, compared with the –AC control group. All values are means ± s.e.m., and significance was determined by two-way analysis of variance (ANOVA) with Fisher’s least significant difference (LSD) post hoc analysis.
To more precisely compare the glycolytic response to efferocytosis versus inflammation (24 hours of stimulation with IFN-γ and LPS), we examined BMDMs incubated with ACs continuously for 1 or 24 hours. Similar to the pulse–chase data, but in contrast to data from IFN-γ and LPS treatment, the efferocytosis-induced increase in glycolysis that occurs after 1 hour was diminished after 24 hours (Fig. 1c). Thus, efferocytosis causes a relatively transient increase in glycolysis as compared with the increased glycolysis in macrophages that have been incubated with inflammatory mediators, suggesting that efferocytosis-induced glycolysis and inflammation-induced glycolysis may be regulated through distinct mechanisms.
Efferocytosis stimulates TXNIP–GLUT1-mediated glucose uptake
Previous studies have reported that glycolysis in both inflammatory and efferocytosing macrophages is associated with an increase in glucose uptake and Slc2a1 mRNA13,16,17, which encodes glucose transporter 1 (GLUT1). Using the fluorescent glucose analog 2-NBDG and fluorescently labeled ACs, we verified that glucose uptake and levels of cell surface GLUT1 were increased in efferocytic macrophages (Fig. 2a,b and Extended Data Fig. 3). Moreover, as expected, partial silencing of Slc2a1 attenuated efferocytosis-induced 2-NBDG uptake and efferocytosis-induced glycolysis and glycolytic capacity (Fig. 2c–e and Extended Data Fig. 4a). However, Slc2a1 mRNA was not increased by efferocytosis (Fig. 2f), suggesting that GLUT1 levels may be subjected to post-transcriptional regulation. In contrast, and consistent with previous reports16,17, Slc2a1 mRNA was markedly increased in inflammatory macrophages (Fig. 2g), further distinguishing efferocytosis- from inflammation-induced glycolysis.
Fig. 2 |. Efferocytosis induces glucose uptake, dependent on TXNIP-mediated GLUT1 regulation.
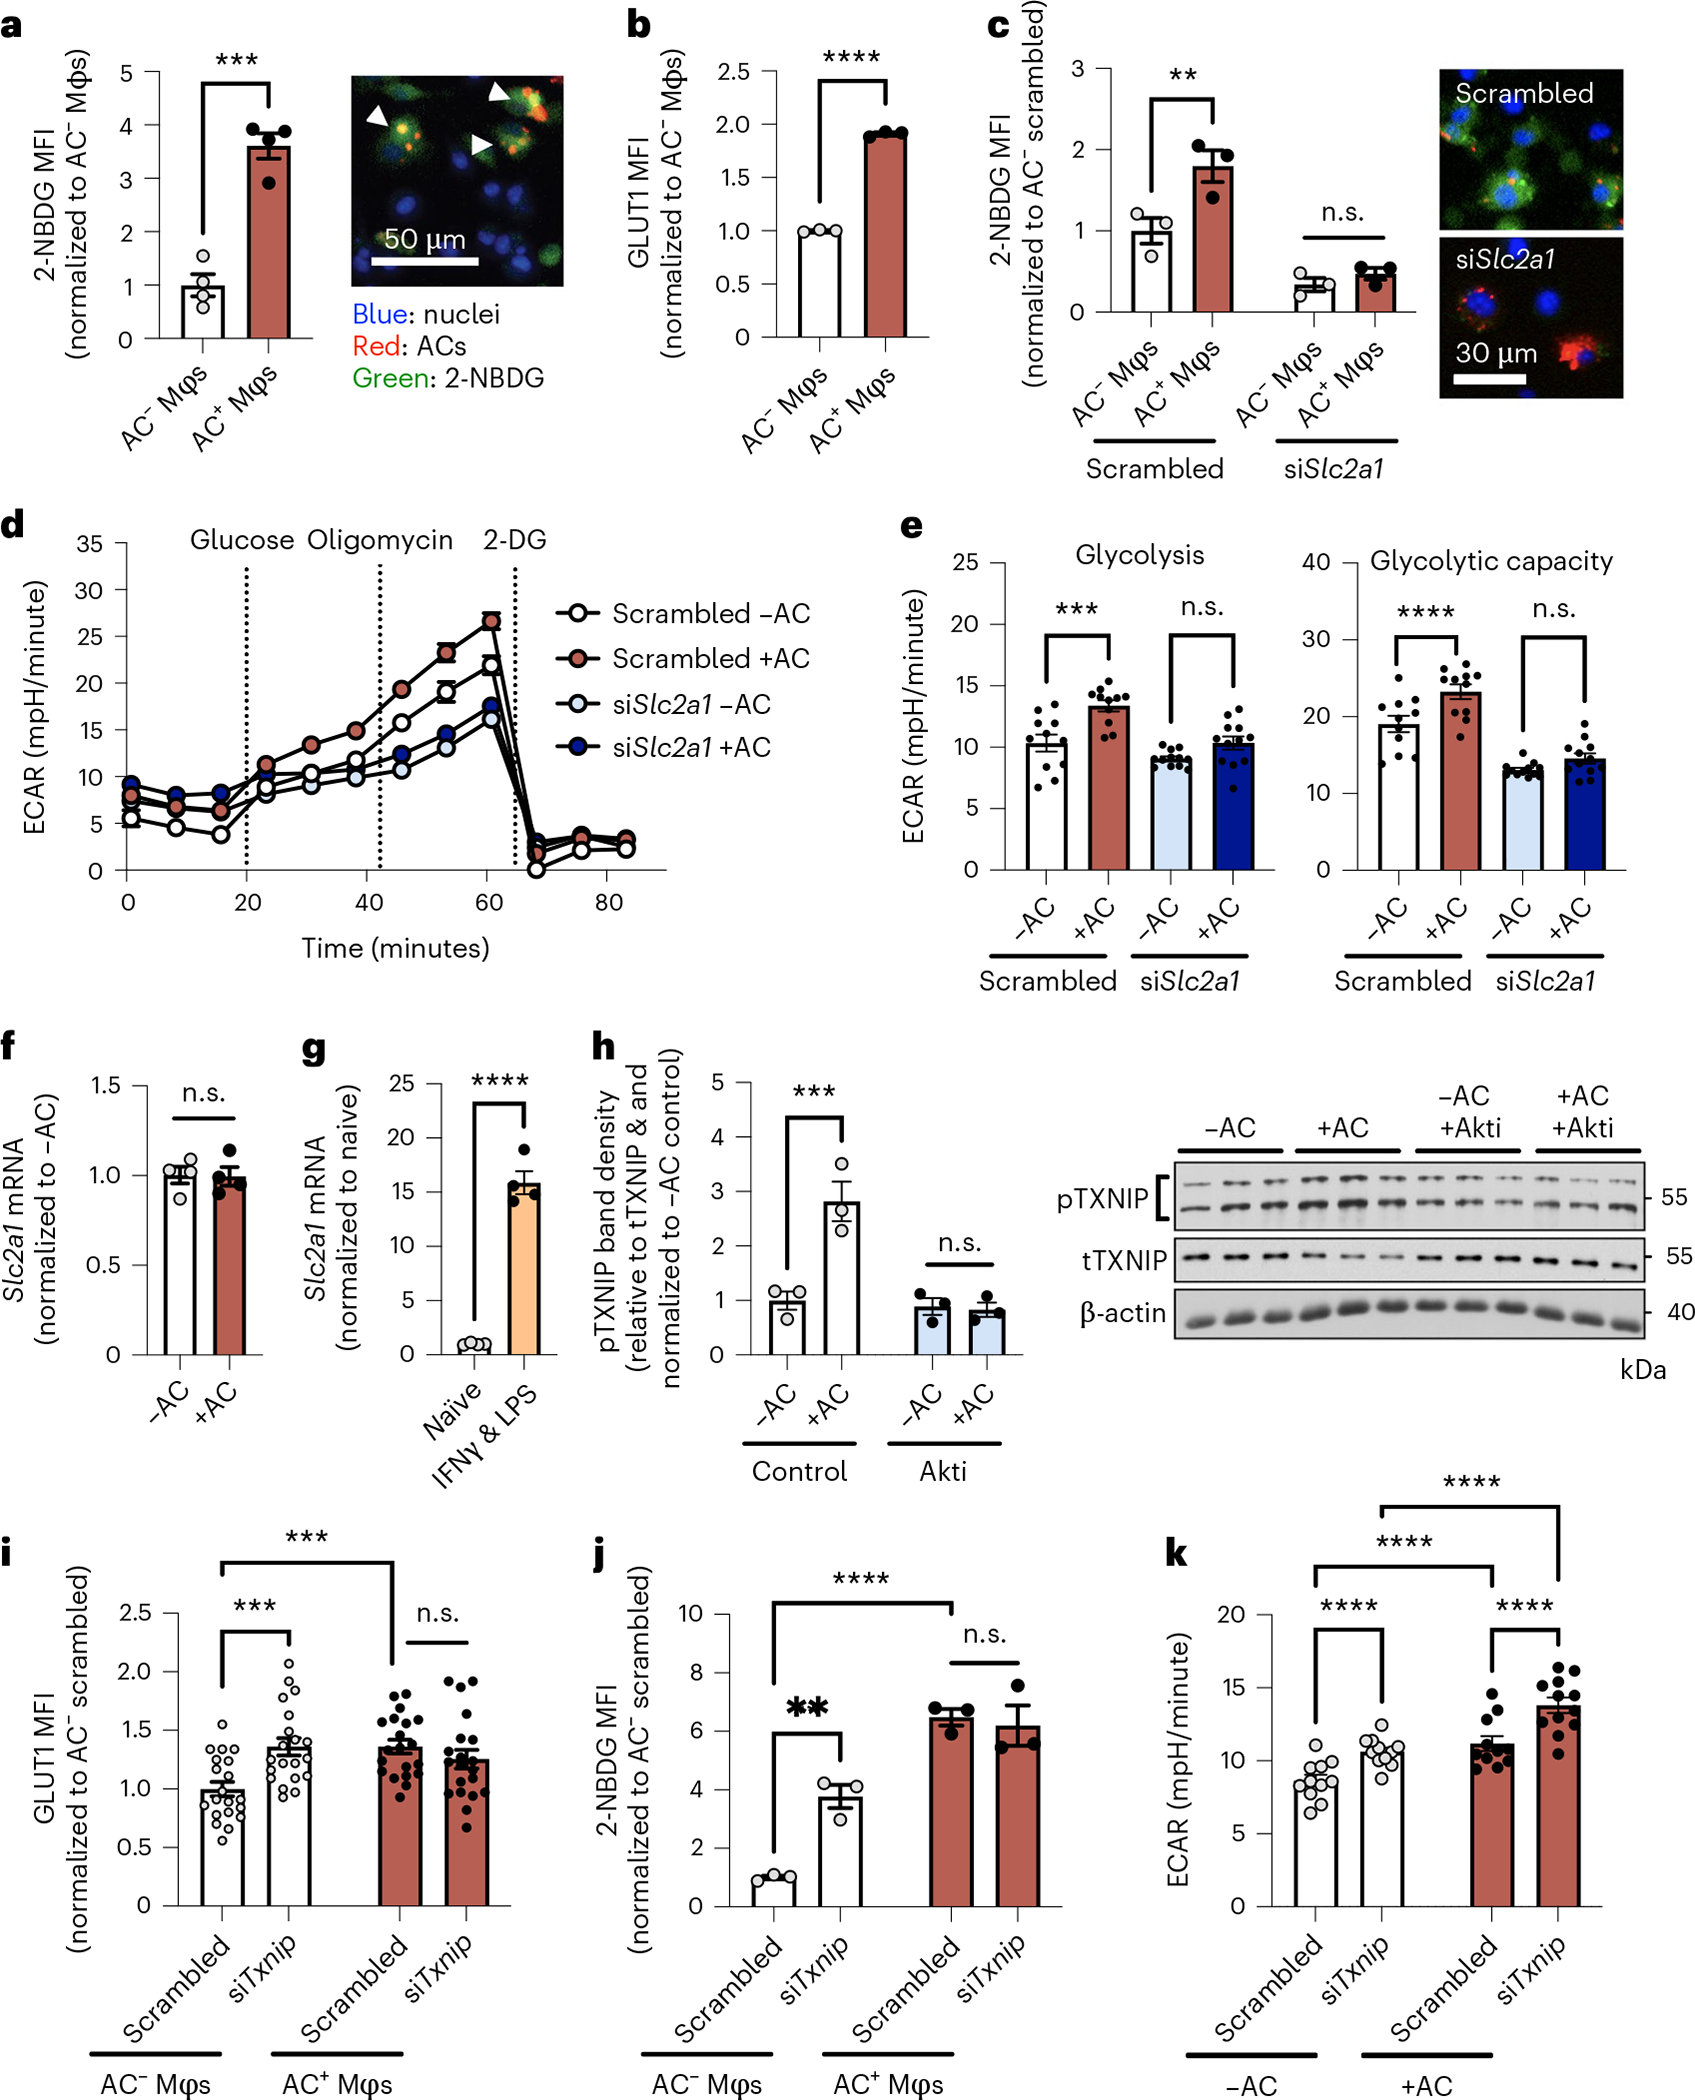
a, BMDMs (Mφs) were incubated with pHrodo-labeled (red) apoptotic cells (ACs) for 45 minutes, followed by rinsing and addition of medium containing 2-NBDG. After 1 hour, the mean fluorescent intensity (MFI) of 2-NBDG (green) was quantified in AC− and AC+ macrophages by fluorescent microscopy (n = 4 images/group). ***P = 0.0002. b, BMDMs were incubated with ACs labeled with PKH67 (a green fluorescent cell dye) for 45 minutes, rinsed, and collected 1 hour later for GLUT1 protein analysis by flow cytometry in AC− and AC+ Mφs (n = 3 wells/group). ****P < 0.0001. c, A 2-NBDG uptake assay was performed in BMDMs transfected with siSlc2a1 or scrambled RNA (AC− and AC+ Mφs in n = 3 fields of view were quantified for the scrambled vs. siSlc2a1 group; representative images are shown). **P = 0.0034. d,e, BMDMs that had been transfected with siSlc2a1 or scrambled RNA were subjected to Seahorse analysis to measure glycolysis and glycolytic capacity after incubation with or without ACs (n = 11–12 wells/group). ***P = 0.0006, ****P < 0.0001. f, BMDMs were incubated in the absence or presence of ACs for 45 minutes and rinsed, and Slc2a1 expression was measured 1 hour later (n = 4 wells/group). g, Slc2a1 expression was measured in naive versus IFN-γ + LPS-differentiated macrophages (n = 4 wells/group). ****P < 0.0001. h, BMDMs pretreated with the Akt inhibitor (Akti) MK-2206 (5 μM) were incubated in the absence or presence of ACs for 45 minutes, rinsed, and collected 1 hour later for immunoblotting of phosphorylated TXNIP (pTXNIP), total TXNIP (tTXNIP), and β-actin (n = 3 samples/group). ***P = 0.0004. i, BMDMs transfected with siTxnip or scrambled RNA were incubated with PKH26-labeled ACs for 45 minutes, rinsed, and collected 1 hour later for GLUT1 protein analysis in PKH26-AC− and PKH26-AC+ Mφs by immunofluorescence microscopy (n = 20 cells/group). ***P = 0.0004. j, 2-NBDG uptake was assayed in BMDMs transfected with siTxnip or scrambled RNA (n = 3 images/group). **P = 0.0017, ****P < 0.0001. k, BMDMs transfected with siTxnip or scrambled RNA were subjected to Seahorse analysis (n = 11–12 wells/group). ****P < 0.0001. All values are means ± s.e.m., and significance was determined by two-tailed Student’s t-test (a,b,f,g) or two-way ANOVA with Fisher’s LSD post hoc analysis (c,e,h–k). n.s., not significant (P > 0.05).
The increase in cell surface GLUT1 without an increase in Slc2a1 mRNA suggested that efferocytosis might somehow increase GLUT1 translocation to the cell surface. We therefore considered previous work showing that thioredoxin-interacting protein (TXNIP) negatively regulates glucose uptake by serving as an endocytosis adapter for GLUT1 that promotes removal of GLUT1 from the cell surface18. Phosphorylation of TXNIP by Akt causes TXNIP degradation, which maintains expression of GLUT1 on the cell surface and enhances glucose uptake18,19. In this context, and given that efferocytosis activates Akt by phosphorylating it20–22, we hypothesized that efferocytosis promotes cell surface GLUT1 expression, glucose uptake, and glycolysis by Akt-mediated phosphorylation and inactivation of TXNIP. In support of this hypothesis, we observed that efferocytosis promoted the phosphorylation of TXNIP in an Akt-dependent manner (Fig. 2h) and that Akt inhibition blunted efferocytosis-induced 2-NBDG uptake (Extended Data Fig. 4b). Partial silencing of Txnip promoted cell surface GLUT1 expression and 2-NBDG uptake in the absence of ACs, indicating that TXNIP limits GLUT1-mediated glucose uptake in macrophages (white bars in Fig. 2i,j and Extended Data Fig. 4c,d). However, short interfering RNA targeting Txnip (siTxnip) did not further increase GLUT1 expression or 2-NBDG uptake in macrophages incubated with ACs (red bars in Fig. 2i,j). This result is consistent with the idea that efferocytosis promotes cell surface GLUT1 expression and glucose uptake by deactivating (phosphorylating) TXNIP; that is, efferocytosis mimics the action of siTxnip and does not have an additive effect when combined with siTxnip. As predicted, partial Txnip silencing also promoted glycolysis in the absence of ACs (Fig. 2k; white bars). With this endpoint, however, siTxnip was able to further increase glycolysis in efferocytosing macrophages (Fig. 2k; red bars). These data suggest that efferocytosis promotes glycolysis by at least two mechanisms: disabling TXNIP to promote glucose uptake, and another glycolysis-enhancing mechanism that is downstream of glucose uptake.
PFKFB2 is essential for efferocytosis-induced glycolysis
Considering our findings above, we questioned whether a step that is downstream of glucose uptake might also be activated in efferocytosis-induced glycolysis. We turned our attention to the first rate-limiting reaction in glycolysis, which involves the enzyme phosphofructokinase-1 (PFK-1)23. The kinase activity of PFK-1 is activated by fructose-2,6-bisphosphate, which is synthesized by the enzyme PFKFB. In this context, we found that a member of this enzyme family, PFKFB2, was upregulated by efferocytosis, including the activated, Ser485-phosphorylated form of PFKFB2 (Fig. 3a). In accordance with a PFKFB2 activity and subsequent activation of PFK-1, efferocytosis induced a robust increase in the levels of fructose-1,6-bisphosphate, the direct product of PFK-1 (Fig. 3b). Interestingly, Pfkfb2 mRNA expression was not affected by efferocytosis (Extended Data Fig. 4e), indicating PFKFB2 may be subject to post-transcriptional regulation. The time course of increased phosphorylated and total PFKFB2 was transient; that is, PFKB2 levels were elevated at 1 hour after efferocytosis, but not at 6 or 24 hours (Fig. 3c), similar to the time course of glycolysis after efferocytosis (above). The mild elevation in glycolysis (as shown in Fig. 1a), but not PFKFB2, at the 6-hour time point may be explained by our finding that glucose uptake remained elevated at 6 hours (Extended Data Fig. 4f). Further, in keeping with the distinction of efferocytosis-induced glycolysis from inflammatory macrophage glycolysis, neither phosphorylated nor total PFKFB2 was increased in macrophages that had been treated with IFN-γ and LPS (Fig. 3d). Because PFKFB2 can be phosphorylated by Akt24,25, we reasoned that efferocytosis-induced Akt activation might be involved in this reaction, as it was in the TXNIP–GLUT1 step described in the previous section. Indeed, inhibition of Akt by MK-2206 blunted efferocytosis-induced PFKFB2 phosphorylation (Fig. 3e). Most importantly, partial silencing of Pfkfb2 attenuated efferocytosis-induced glycolysis without affecting 2-NBDG uptake, mitochondrial respiration, or inflammation-induced glycolysis (Fig. 3f–h and Extended Data Fig. 4g,h). Thus, efferocytosis-induced Akt activation promotes two sequential steps in efferocytosis-induced glycolysis—phosphorylation of TXNIP, leading to increased GLUT1-mediated glucose uptake, and phosphorylation of PFKFB2, which promotes a key step in glycolysis itself. These mechanisms are distinct from those that occur in inflammation-induced glycolysis in macrophages.
Fig. 3 |. Akt-stimulated PFKFB2 is essential for efferocytosis-induced glycolysis, but is not important for glycolysis in inflammatory macrophages.
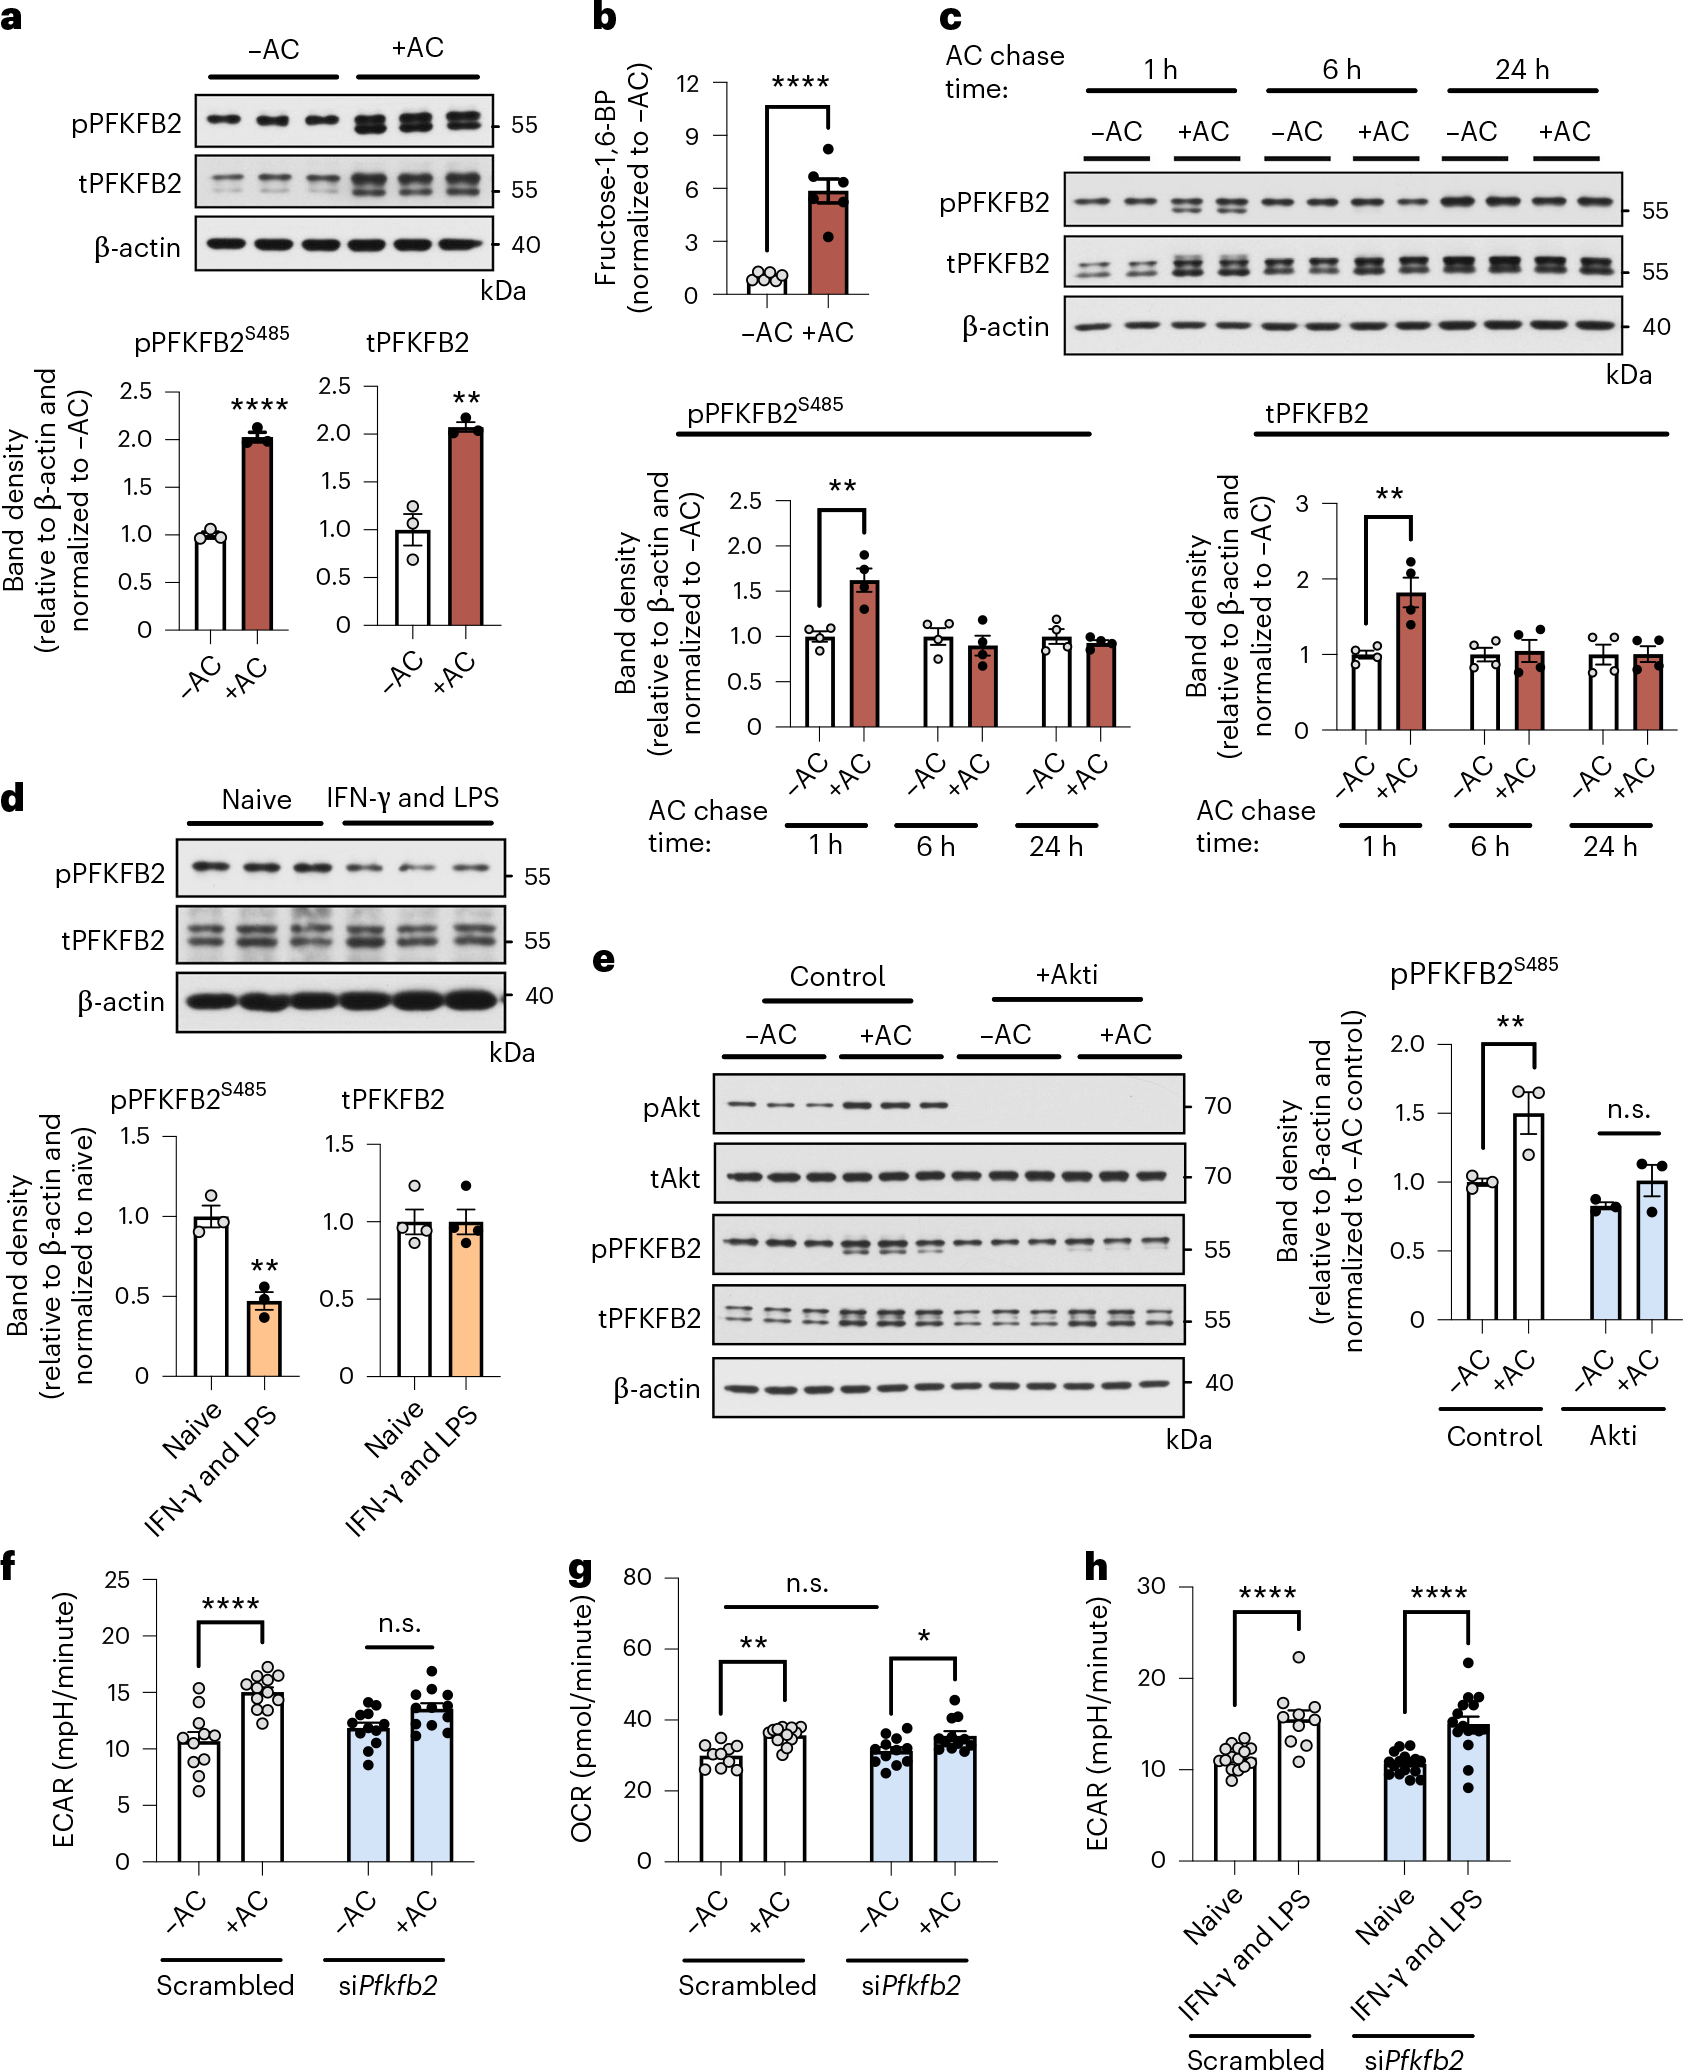
a, BMDMs were incubated in the absence or presence of ACs for 45 minutes, rinsed, and collected 1 hour later for immunoblotting of phosphorylated PFKFB2 and total PFKFB2. The relative amounts of phospho- and total PFKFB2 versus β-actin were quantified by band densitometry (n = 3 samples/group). **P = 0.0033, ****P < 0.0001. b, BMDMs were incubated in the absence or presence of ACs for 45 minutes, rinsed, and collected 3 hours later for analysis of fructose-1,6-bisphosphate (fructose-1,6-BP) levels by LC–MS/MS (n = 6 wells/group) ****P < 0.0001. c, The same analysis as described in a was performed in BMDMs after a pulse–chase time course experiment with ACs (see Fig. 1a) (n = 4 samples/ group). **P = 0.0070 for total PFKFB2, **P = 0.0045 for phospho-PFKFB2. d, Naive BMDMs and BMDMs polarized towards a pro-inflammatory phenotype with IFN-γ and LPS for 24 hours were collected and immunoblotted for phospho-PFKFB2, total PFKFB2, and β-actin (n = 3–4 samples/group). **P = 0.0039. e, BMDMs were pretreated with or without the Akt inhibitor MK-2206 (5 μM) before incubation with or without ACs for 45 minutes. Macrophages were collected 1 hour later for immunoblotting of phospho-Akt (Ser473), total Akt, phospho-PFKFB2, total PFKFB2, and β-actin. The relative level of phospho-PFKFB2 versus β-actin was quantified by band densitometry (n = 3 samples/group). **P = 0.0063. f,g, BMDMs transfected with siPfkfb2 or scrambled RNA were subjected to Seahorse analysis to measure glycolysis (ECAR) and oxidative phosphorylation (oxygen-consumption rate, OCR) 1 hour after incubation with or without ACs (n = 11–12 wells/group). *P = 0.035, **P = 0.0032, ****P < 0.0001. h, Naive BMDMs and BMDMs polarized towards a pro-inflammatory phenotype by treatment with IFN-γ and LPS for 24 hours were subjected to Seahorse analysis to measure glycolysis (ECAR) (n = 15–16 wells/group). ****P < 0.0001. All values are means ± s.e.m., and significance was determined by two-tailed Student’s t-test (a–d) or two-way ANOVA with Fisher’s LSD post hoc analysis (e–h). n.s., not significant (P > 0.05).
Glycolysis-derived lactate mediates continual efferocytosis
To evaluate the functional significance of efferocytosis-induced glycolysis, we focused on the idea that it could enable the subsequent uptake of additional apoptotic cells, a critical process in tissue resolution called continual efferocytosis9,11,12. We began by inhibiting glycolysis with 2-deoxyglucose (2-DG), which caused only a small, non-statistically-significant effect on initial AC uptake (Extended Data Fig. 5a), in line with glycolysis being enhanced after the first round of efferocytosis. We then assessed continual efferocytosis by evaluating the ability of macrophages to ingest two sequential ACs9. To this end, macrophages were first incubated with green fluorescent ACs for 45 minutes; then, after AC removal and a 2-hour interval, they were incubated with a second round of red fluorescent ACs. This assay revealed an approximately 30% decrease in macrophages that ingested green plus red ACs in the 2-DG-treated group (Fig. 4a; white versus yellow bar), indicative of a reduced capacity for continual efferocytosis.
Fig. 4 |. Glycolysis-derived lactate mediates continual efferocytosis by promoting apoptotic cell binding.
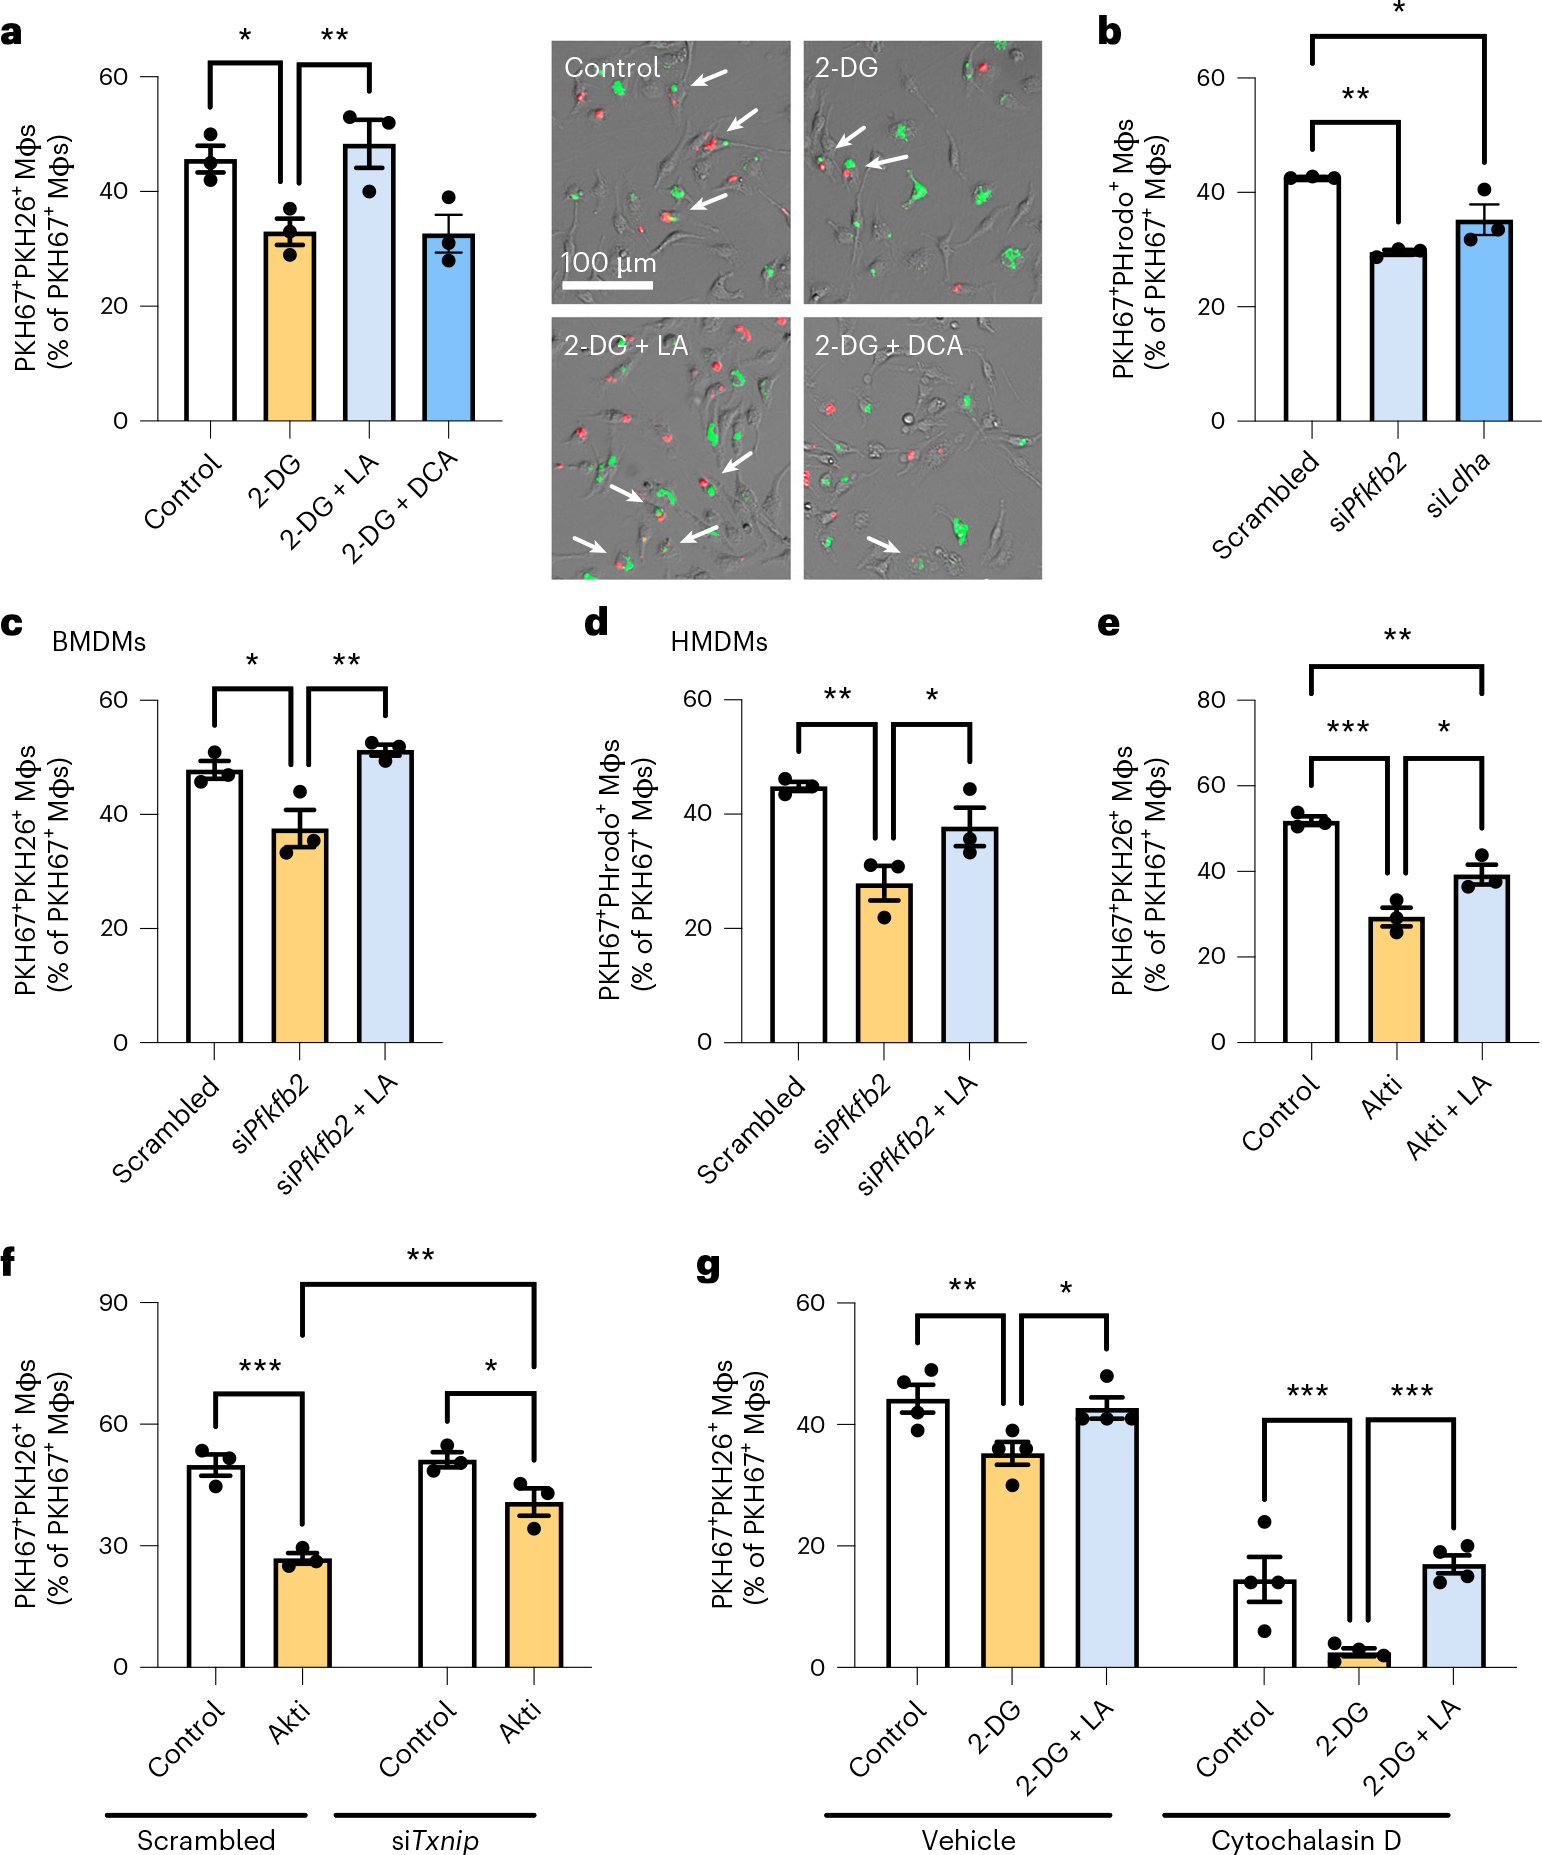
a, BMDMs were incubated with PKH67-labeled ACs (green) for 45 minutes, rinsed, and treated with 2-DG (10 mM) with or without lactate (LA; 25 mM) or dichloroacetate (DCA; 10 mM). After 2 hours, macrophages were incubated with PKH26-labeled ACs (red) for 45 minutes, and the number of PKH67+PKH26+ Mφs (green and red; white arrows) was quantified relative to PKH67+ Mφs (green only), which reflects continual efferocytosis (n = 3 wells/group). *P = 0.021, **P = 0.0084. b, A continual efferocytosis assay was conducted as described in a, but with pHrodo-labeled ACs and BMDMs transfected with siPfkfb2, siLdha, or scrambled RNA (n = 3 wells/group). *P = 0.016, **P = 0.0010. c, A continual efferocytosis assay was conducted in BMDMs transfected with siPfkfb2 or scrambled RNA and that were incubated with or without lactate (10 mM) between the first and second round of ACs (n = 3 wells/ group). *P = 0.016, **P = 0.0042. d, A continual efferocytosis assay was conducted with HMDMs transfected with siPfkfb2 or scrambled RNA and incubated with or without lactate (10 mM) between the first and second round of ACs (n = 3 wells/ group). *P = 0.039, **P = 0.0040. e, A continual efferocytosis assay was conducted in BMDMs incubated with or without the Akt inhibitor MK-2206 (5 μM) and lactate (10 mM) between the first and second rounds of ACs (n = 3 wells/group). *P = 0.011, **P = 0.0035, ***P = 0.0002. f, A continual efferocytosis assay was conducted in BMDMs transfected with siTxnip or scrambled RNA and then incubated with or without MK-2206 (5 μM) between the first and second rounds of ACs (n = 3 wells/group). *P = 0.017, **P = 0.0038, ***P = 0.0002. g, A continual efferocytosis assay was conducted in BMDMs with or without pretreatment with cytochalasin D (5 μM) 15 minutes before addition of the second round of ACs (n = 4 wells/group). *P = 0.025, **P = 0.0087, ***P = 0.0010 (control versus 2-DG), ***P = 0.0002 (2-DG versus 2-DG + LA). All values are means, and significance was determined by one-way ANOVA (a–e) or two-way ANOVA (f,g) with Fisher’s LSD post hoc analysis.
A by-product of efferocytosis-induced glycolysis is lactate13. Interestingly, we found that the defect in continual efferocytosis in 2-DG-treated cells was completely rescued by lactate but not by dichloroacetate (Fig. 4a; blue bars), which channels pyruvate into the citric acid cycle and restores ATP levels26, suggesting that glycolysis-derived lactate, rather than ATP, seems to be involved. As further evidence, partial knockdown of Pfkfb2 and Ldha, which encodes the lactate-producing enzyme lactate dehydrogenase A (LDHA), did not affect the uptake of single ACs (Extended Data Fig. 5b–d) but lowered the capacity of macrophages for continual efferocytosis (Fig. 4b), and the reduction in continual efferocytosis in Pfkfb2-silenced macrophages was restored by lactate treatment (Fig. 4c). Partial silencing of Pfkfb2 in HMDMs also markedly lowered continual efferocytosis, which was restored by lactate (Fig. 4d and Extended Data Fig. 5e). Of note, the genes encoding two other PFKFB isoforms that have been implicated in macrophage glycolysis, PFKFB3 and PFKFB4 (refs. 27–29), were upregulated upon stimulation with IFN-γ and LPS (Extended Data Fig. 6a, b), and silencing Pfkfb3 has been shown to lower glycolysis in inflammatory macrophages29. We found that silencing of Pfkfb3 or Pfkfb4 did not affect single or continual efferocytosis in BMDMs (Extended Data Fig. 6c–f). These data provide further evidence for the specificity of PFKFB2 in efferocytosis-induced glycolysis. Consistent with the Akt-dependent phosphorylation of both PFKFB2 and TXNIP, treatment with the Akt inhibitor MK-2206 reduced continual efferocytosis, which was partly restored by lactate treatment (Fig. 4e). As predicted, this reduction in continual efferocytosis by the Akt inhibitor was partially abrogated in TXNIP-silenced macrophages (Fig. 4f), which was predicted given the increases in glucose uptake and glycolysis in these cells (see Fig. 2).
We next tested whether glycolysis-derived lactate promotes continual efferocytosis by increasing the binding and/or internalization of subsequent ACs. For this purpose, we treated macrophages with the actin polymerization inhibitor cytochalasin D after the first round of ACs, which blocks the internalization but not the binding of ACs. The association of macrophages with a second AC was inhibited by 2-DG in both vehicle and cytochalasin D conditions, indicating a defect in AC binding, and this defect was completely rescued by lactate (Fig. 4g).
Lactate promotes the expression of efferocytosis receptors
MerTK and LRP1 are efferocytosis receptors that are highly functional in AC clearance in vivo22,30. To evaluate whether efferocytosis-induced glycolysis could impact AC binding by modulating expression of these receptors, we conducted immunoblotting and immunofluorescence analysis of MerTK and LRP1 in efferocytic macrophages with impaired PFKFB2 activity. For this purpose, we used BMDMs from mice with inactivating mutations of two critical serine residues in PFKFB2, Ser468 and Ser485, referred to as PFKFB2-mutant mice31. As predicted, BMDMs from these mice showed blunted efferocytosis-induced glycolysis, without changes in baseline glycolysis (Extended Data Fig. 7a) or oxidative phosphorylation (Extended Data Fig. 7b). Total protein expression of MerTK and LRP1 was similar in PFKFB2-mutant and wild-type macrophages, both at baseline and after incubation with ACs (Extended Data Fig. 8a). However, immunofluorescence staining revealed a reduction in cell surface expression of both MerTK (Fig. 5a) and LRP1 (Fig. 5b) in the mutant cells, and this reduction was completely restored by lactate. Importantly, these findings were relevant to continual efferocytosis, as lactate-induced restoration of continual efferocytosis in Pfkfb2-silenced macrophages was blunted by neutralizing antibodies against MerTK and LRP1 (Fig. 5c).
Fig. 5 |. Glycolysis-derived lactate promotes cell surface expression of the efferocytosis receptors MerTK and LRP1 through calcium signaling.
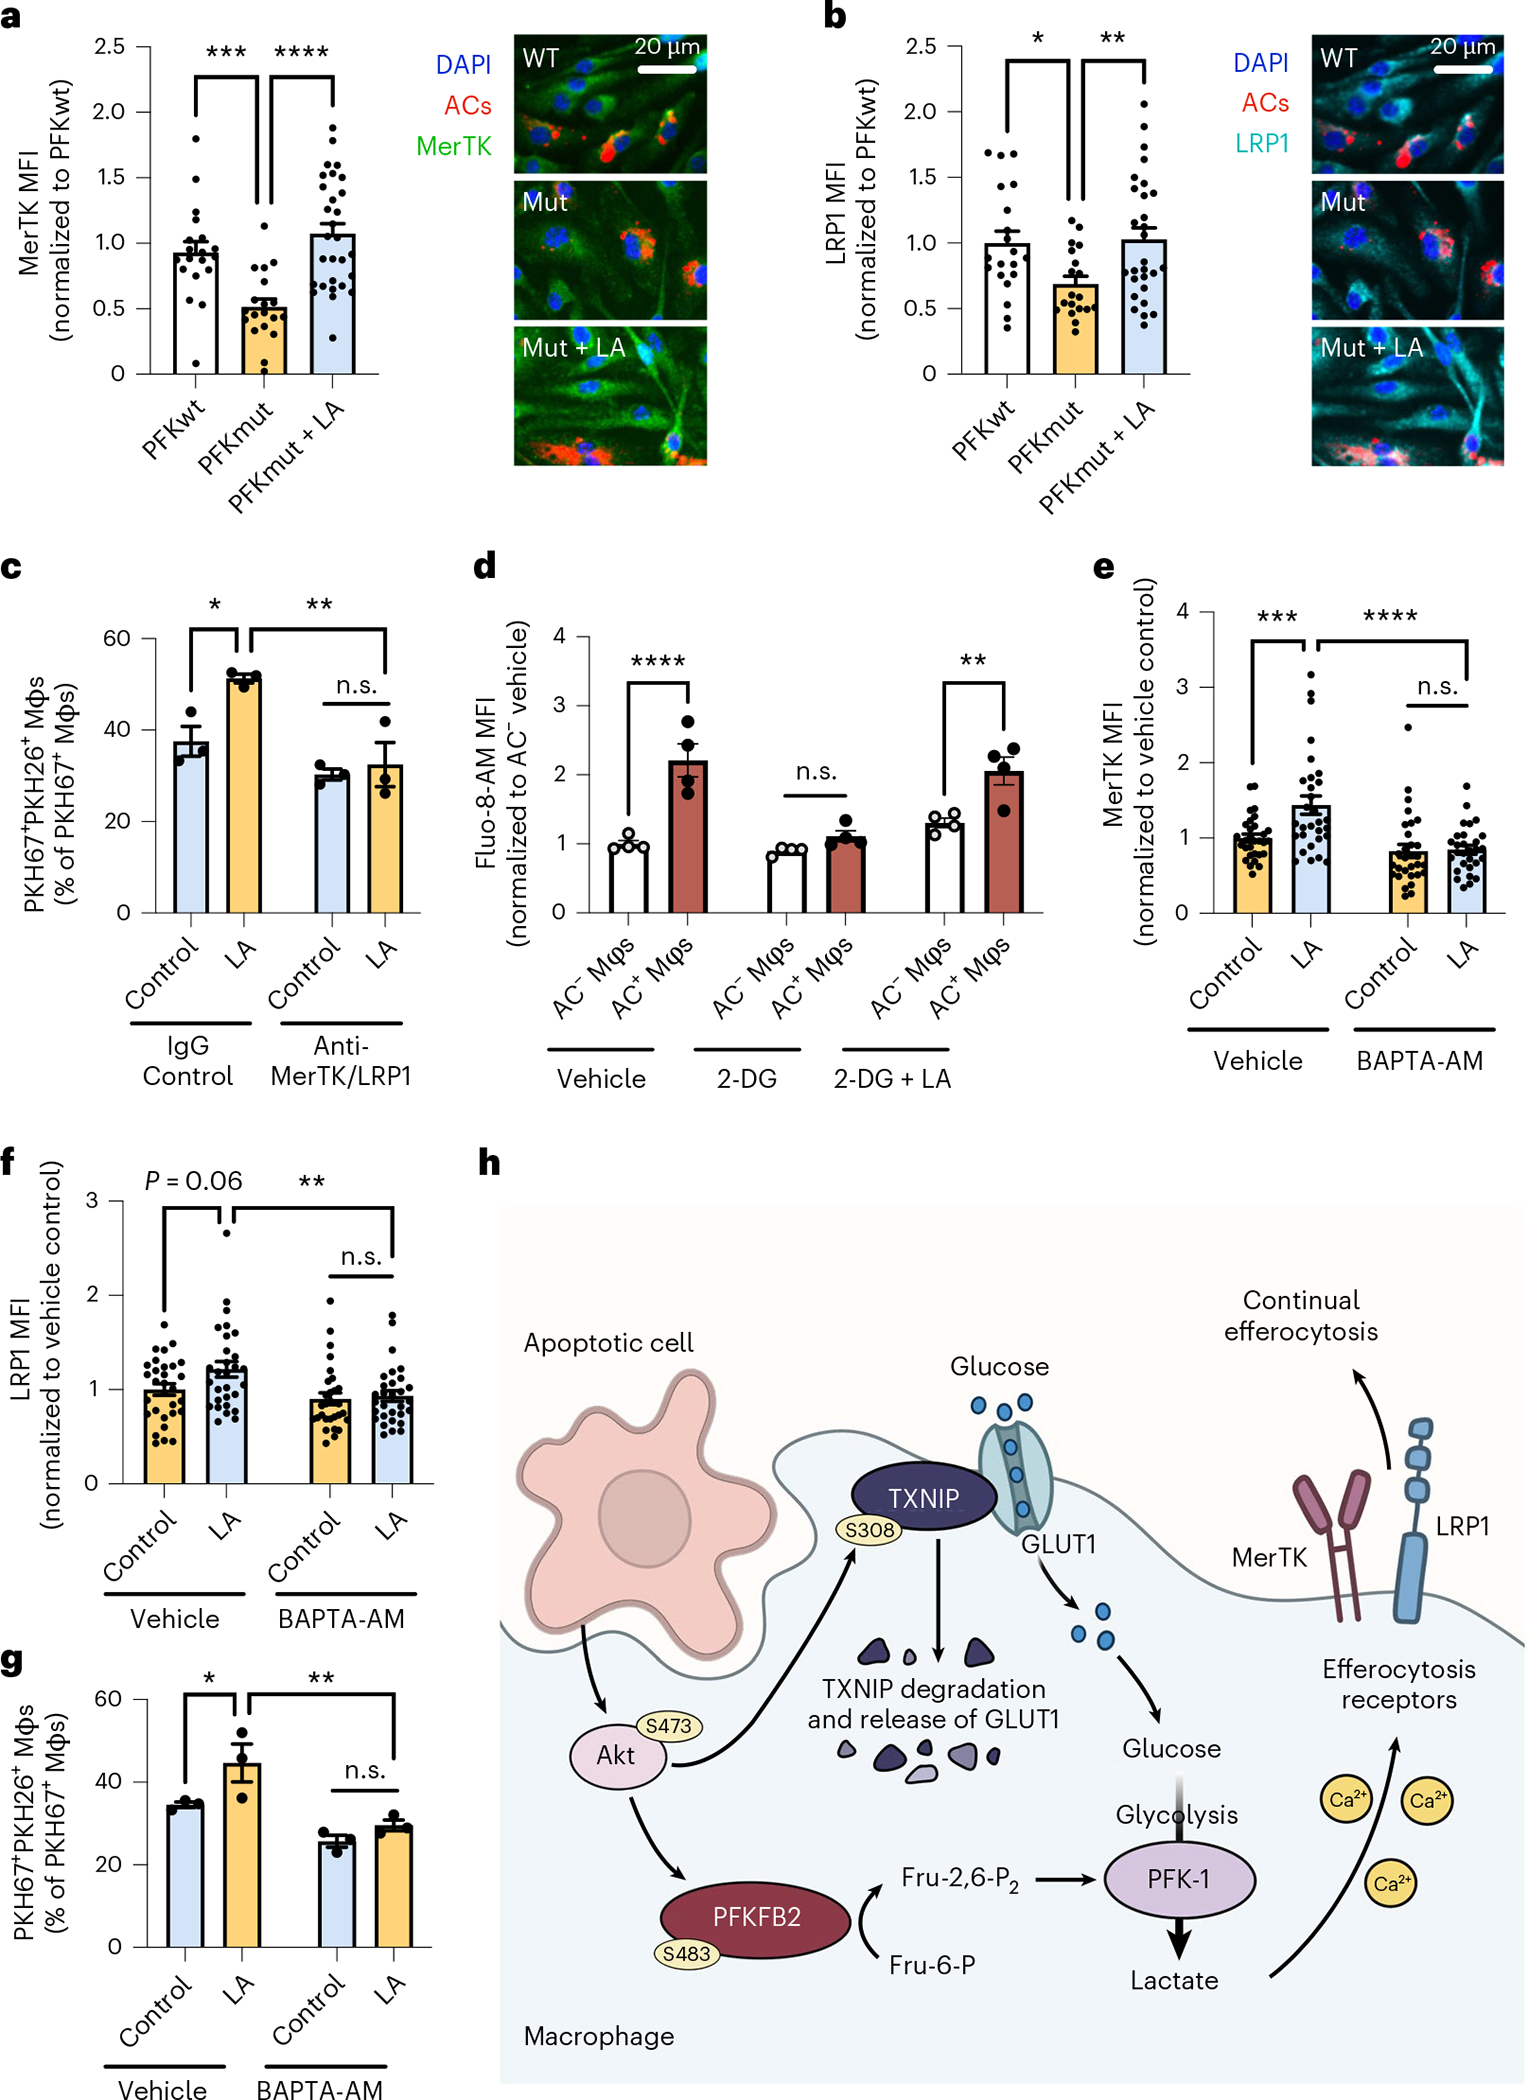
a,b, BMDMs (Mφs) from wild-type (PFKwt) and PFKFB2-mutant (PFK,ut) mice were incubated with PKH26-labeled ACs for 45 minutes, rinsed, and fixed 1 hour later for immunostaining of MerTK (a) and LRP1 (b) and quantification of mean fluorescent intensity (MFI) in AC+ macrophages (n = 20–30 cells/group). *P = 0.018, **P = 0.0057, ***P = 0.0008, ****P < 0.0001. c, A continual efferocytosis assay was conducted with siPfkfb2-treated BMDMs incubated with or without lactate (10 mM) and control IgG (15 μg/ml) or anti-MerTK and anti-LRP1 antibodies (10 and 5 μg/mL, respectively) between the first and second rounds of ACs (n = 3 wells/group). *P = 0.012, **P = 0.0022. d, BMDMs were pretreated with 2-DG (10 mM) with or without lactate (10 mM), and were incubated with PKH26-labeled ACs. After 30 minutes, macrophages were rinsed, incubated with fluo-8-AM (5 μM), and subjected to live-cell imaging to analyze fluo-8-AM MFI in AC− versus AC+ Mφs (n = 4 images/group). **P = 0.0011, ****P < 0.0001. e,f, siPfkfb2-treated BMDMs were incubated with PKH26-labeled ACs for 45 minutes, rinsed, and then incubated with or without BAPTA-AM (10 μM) and lactate (10 mM), followed by immunostaining of MerTK and LRP1 (n = 30 cells/group). **P = 0.0049, ***P = 0.0004, ****P < 0.0001. g, A continual efferocytosis assay was performed in siPfkfb2-treated BMDMs incubated with or without BAPTA-AM (10 μM) 30 minutes before adding the second round of ACs (n = 3 wells/group). *P = 0.024, **P = 0.0014. All values are means ± s.e.m., and significance was determined by one-way ANOVA (a,b) or two-way ANOVA (c–g) with Fisher’s LSD post hoc analysis. n.s., not significant (P > 0.05). h, Proposed mechanism of efferocytosis-induced glycolysis through TXNIP-dependent GLUT1 regulation and PFKFB2. Efferocytosis stimulates Akt-dependent phosphorylation of TXNIP, resulting in stabilization of GLUT1 at the cell membrane and increased glucose uptake to fuel glycolysis. Additionally, Akt phosphorylates PFKFB2, which activates the glycolytic enzyme phosphofructokinase-1 (PFK-1) via fructose-2,6-bisphosphate (Fru-2,6-P2), thereby increasing glycolysis. As a result, lactate availability increases, which facilitates the continued uptake of apoptotic cells by increasing the cell surface expression of the efferocytosis receptors MerTK and LRP1 in a calcium-dependent manner.
The reduction in cell surface expression of MerTK and LRP1, but not total MerTK and LRP1, suggested that glycolysis-induced lactate might promote the recycling of these efferocytosis receptors to the plasma membrane after macrophages engulf the first AC. AC engulfment increases levels of intracellular calcium, which is an important regulator of vesicular recycling in efferocytosis12,32. We therefore evaluated whether lactate promotes cell surface expression of LRP1 and MerTK, and thereby continual efferocytosis, in a calcium-dependent manner. We found that efferocytosis increased the fluorescent intensity of the calcium-binding dye Fluo-8-AM, which is a marker of increased cytoplasmic calcium, and this effect was blunted by 2-DG and rescued by lactate (Fig. 5d). When intracellular calcium was chelated by incubation of the cells with BAPTA-AM, the induction of cell surface MerTK/LRP1 (Fig. 5e,f) and continual efferocytosis (Fig. 5g) by lactate in Pfkfb2-silenced macrophages (Extended Data Fig. 8b) was prevented.
Another question related to the effect of lactate on continual efferocytosis is whether it functions intracellularly after release from the efferocytosing macrophages. To this end, we silenced Slc16a1, the gene encoding the lactate transporter MCT1. In accordance with previous findings showing that MCT1 deficiency prevents efferocytosis-induced lactate export13, we found that Slc16a1 silencing increased the intracellular lactate concentration (Extended Data Fig. 8c,d). Accordingly, siSlc16a1 enhanced continual efferocytosis, but not single efferocytosis, similar to lactate supplementation (Extended Data Fig. 8e,f). We also found that siSlc16a1 did not affect exogenous-lactate-induced continual efferocytosis in Pfkfb2-silenced macrophages, which was predicted given that exogenous lactate entering the cells, rather than lactate generated from glycolysis within the cells, drives continual efferocytosis in this setting. These combined data are in line with an effect of intracellular, rather than extracellular, lactate on continual efferocytosis. In summary, efferocytosis stimulates a TXNIP-PFKFB2-mediated glycolysis pathway in macrophages that increases intracellular lactate levels and subsequently promotes calcium-dependent expression of efferocytosis receptors on the cell surface to drive continual removal of ACs (Fig. 5h).
Macrophage PFKFB2 regulates efferocytosis in vivo
To evaluate the importance of PFKFB2 for efferocytosis and its consequences in vivo, we transplanted irradiated wild-type mice with bone marrow from PFKFB2-mutant mice (described above) or wild-type littermates. The resulting mice, with either the wild-type or mutated PFKFB2 gene expressed selectively in cells of hematopoietic origin, were subjected to a dexamethasone–thymus assay (Fig. 6a). In this assay, dexamethasone is used to induce thymocyte apoptosis, which is then followed by continual efferocytosis of the apoptotic thymocytes by thymic macrophages to prevent thymic necrosis. As expected on the basis of our previous studies9,20,33,34, mice that had been injected with dexamethasone had a lower thymus weight and cellularity (Fig. 6b,c) than the control mice that had received PBS injections (Extended Data Fig. 9a,b), owing to thymocyte apoptosis followed by efferocytic removal of these dead thymocytes by recruited macrophages35. The thymi of PBS-injected mice displayed only a few apoptotic cells and macrophages, and did not show signs of thymic necrosis (Extended Data Fig. 9c,d). The thymic macrophages in dexamethasone-injected wild-type mice showed higher phospho-PFKFB2 expression when they were associated with ACs (Extended Data Fig. 9e), that is as a marker of efferocytic thymic macrophages, in line with the increase in phospho-PFKFB2 expression in efferocytic BMDMs and HMDMs (as described above).
Fig. 6 |. Mice with defective hematopoietic PFKFB2 show impaired macrophage efferocytosis of apoptotic thymocytes.
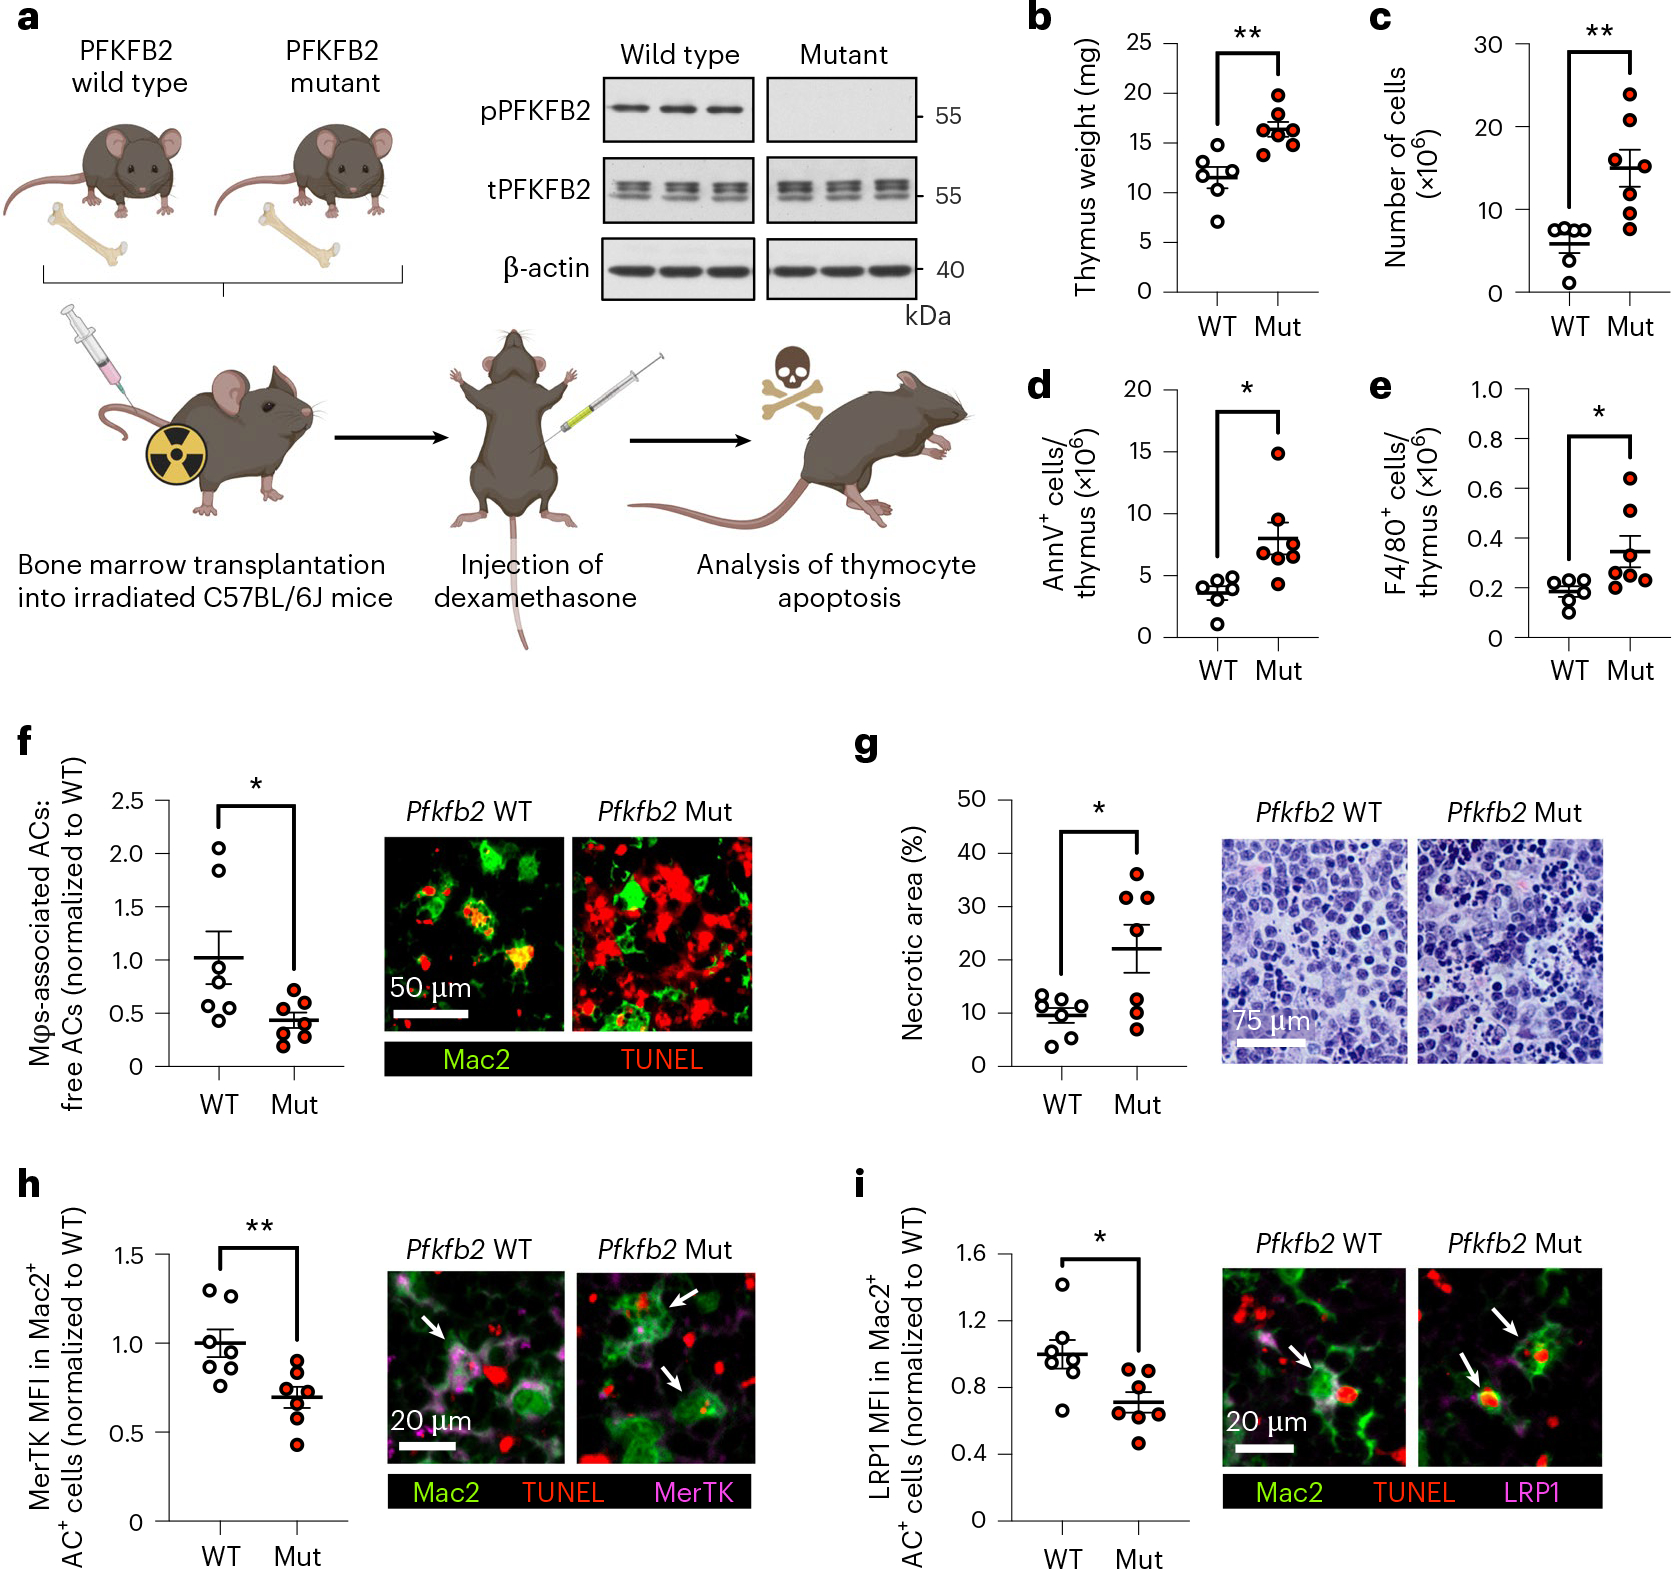
a, Irradiated C57BL/6J mice were implanted with bone marrow from wild-type or PFKFB2-mutant mice and subjected to a dexamethasone–thymus assay 4 weeks later. The immunoblot shows the absence of phospho-PFKFB2 in BMDMs from PFKFB2-mutant mice (n = 3 mice/group). Eighteen hours after dexamethasone injection, tissues were collected for analyses. b, Thymi from wild-type (WT) and PFKFB2-mutant (Mut) mice were weighed (n = 6–7 mice/group). **P = 0.0030. c, Cells were counted to determine thymus cellularity (n = 6–7 mice/group). **P = 0.0023. d,e, Flow cytometry was used to quantify the number of Annexin V+ (apoptotic) cells (d) and F4/80+ macrophages (e) in the thymus (n = 6–7 mice/group). *P = 0.013 for Annexin V+ cells and *P = 0.045 for F4/80+ macrophages. f, As a measure of efferocytosis, the ratio of Mac2+ macrophage-associated ACs:free ACs (TUNEL+) was determined by immunofluorescence microscopy (IFM) (n = 7 mice/group). *P = 0.041. g, The relative area of necrosis (areas devoid of intact nuclei and/ or areas with pronounced nuclear debris) in the thymic cortex was measured in H&E-stained sections (n = 7 mice/group). *P = 0.021. h,i, Mean fluorescent intensities (MFI) of MerTK (h) and LRP1 (i) were measured in Mac2+ AC+ (that is, TUNEL+) macrophages by IFM (n = 7 mice/group). *P = 0.019, **P = 0.0092. Horizontal lines indicate the means ± s.e.m., and significance was determined by two-tailed Student’s t-test (a,c–i) or two-tailed Mann–Whitney U test (b).
When comparing wild-type- and PFKFB2-mutant hematopoietic mice after dexamethasone injection, the mutant mice had heavier thymi (Fig. 6b) and higher thymus cellularity (Fig. 6c) than wild-type control mice, suggesting a higher abundance of uncleared dead cells. Indeed, annexin V staining revealed a higher number of ACs in the thymi of the PFKFB2-mutant mice (Fig. 6d and Extended Data Fig. 10), despite an increase in thymic F4/80+ macrophages (Fig. 6e). Co-staining of Mac2+ macrophages with the TUNEL reagent, which labels dead thymocytes, showed a lower relative number of macrophage-associated ACs in the PFKFB2-mutant mice (Fig. 6f), indicative of reduced in vivo efferocytosis. Importantly, tissue necrosis was increased in hematopoietic PFKFB2-mutant mice (Fig. 6g), consistent with a functional consequence of the impaired efferocytosis. Finally, on the basis of the in vitro data described in the previous section, we evaluated the expression of MerTK and LRP1 in thymic macrophages by immunofluorescence analysis. Both MerTK (Fig. 6h) and LRP1 (Fig. 6i) were lower in Mac2+AC+ (efferocytic) macrophages of PFKFB2-mutant mice than in wild-type controls. These data provide in vivo support for the importance of PFKFB2-mediated glycolysis in efferocytosis and tissue resolution.
Discussion
Important work over the last several decades has revealed that intracellular metabolism in immune cells is highly interconnected, with signaling pathways that regulate the fate and function of these cells. For example, a rewiring of the tricarboxylic acid cycle in inflammatory macrophages leads to the accumulation of succinate, which can drive the expression of the pro-inflammatory cytokine IL-1β by stabilizing hypoxia-inducible factor 1-α (HIF1-α)36–38. In this study, we elucidate the mechanism of a metabolic pathway that regulates pro-resolving macrophage function in vitro and in vivo. We found that efferocytosing macrophages use Akt-mediated phosphorylation of both the GLUT1 adapter TXNIP and the glycolytic enzyme PFKFB2 to transiently activate glycolysis. These mechanisms are compatible with the rapid increase in glucose uptake and glycolysis that occurs after efferocytosis, as (1) phosphorylation of TXNIP inhibits the continuous process of GLUT1 internalization and (2) Akt-mediated phosphorylation is a rapid way to activate PFKFB2. Interestingly, glycolytic cardiomyocytes, like efferocytosing macrophages, also use PFKFB2 (refs. 24,25), and they couple this mechanism with adapter-mediated GLUT1 upregulation, in this case involving the GLUT1 adapter ARRDC4 (ref. 39). In contrast, inflammatory macrophages use transcriptional upregulation of Slc2a1 (GLUT1) and Pfkfb3 to increase a prolonged glycolytic response29,40. Finally, we show that PFKFB2-mediated glycolysis results in lactate-mediated upregulation of efferocytosis receptors to increase the uptake of subsequent ACs (continual efferocytosis), which is a critical pro-resolving process in vivo9,11,12.
These findings build upon an elegant study by Morioka et al. showing that glycolysis is increased following efferocytosis13. That study emphasized the role of transcriptional upregulation of Slc2a1 (GLUT1). By contrast, our data reveal that GLUT1-mediated glucose uptake is increased at the post-transcriptional level, that is, through retention of GLUT1 on the cell surface as a result of TXNIP phosphorylation. Further work will be needed to determine how different conditions may cause macrophages to use alternative mechanisms to increase glucose uptake during efferocytosis. The previous study by Morioka et al.13 showed that blocking glucose uptake suppressed actin polymerization and surmised that glycolysis might help meet the cellular energy demands of efferocytosis. However, we found that efferocytosis-induced aerobic glycolysis, through lactate, enhances continual efferocytosis by increasing AC binding, not internalization. Mechanistically, we found that intracellular lactate promotes calcium-dependent cell surface expression of two key efferocytosis receptors, MerTK and LRP1, which may be related to our previous work showing that cytoplasmic calcium promotes vesicular trafficking to the plasma membrane in efferocytic macrophages12. Moreover, a previous report has shown that lactate raises cytoplasmic calcium in regulatory T cells through phosphoenolpyruvate-mediated inhibition of the endoplasmic reticulum calcium pump, sarco/endoplasmic reticulum Ca2+-ATPase (SERCA)41. Whether this mechanism is operating in efferocytic macrophages remains to be seen, with an alternative possibility being that lactate somehow promotes an efferocytosis-induced calcium-raising mechanism that involves mitochondrial fission12. Finally, Morioka et al. have shown a role for lactate as an anti-inflammatory mediator13, which, together with the role of lactate in continual efferocytosis shown here, is consistent with previous cancer-related studies showing that lactate can suppress inflammation and promote macrophage polarization towards a pro-resolving phenotype42,43.
The post-transcriptional mechanism of GLUT1 upregulation, the role of PFKFB2, and the transient nature of the increase in glycolysis following AC engulfment led to an important conclusion, namely that efferocytosis-induced glycolysis and inflammation-induced glycolysis are mechanistically distinct. With regard to inflammation-induced glycolysis, inflammatory signals such as IFN-γ or LPS cause macrophages to undergo HIF1-α-dependent genetic reprogramming, resulting in increased transcription of genes related to glycolytic metabolism, including Slc2a1 and pyruvate kinase M2 (Pkm2)44. In turn, PKM2 directly regulates HIF1-α activity and LPS-induced metabolic reprogramming45, thereby promoting a pro-inflammatory macrophage phenotype46. A positive feedback loop between HIF1-α and its targets such as PKM2 results in a sustained glycolytic phenotype in inflammatory macrophages, in contrast to transient glycolysis in the setting of efferocytosis. In addition to enhanced glycolysis, inflammatory macrophages have a disrupted tricarboxylic acid cycle that leads to the accumulation of citrate and succinate, which further sustain the pro-inflammatory macrophage phenotype by promoting nitric oxide production and HIF1-α stabilization47,48. Nitric oxide also causes irreversible suppression of oxidative phosphorylation in inflammatory macrophages49. Thus, inflammation reprograms macrophages in a way that renders them dependent on prolonged glycolysis for energy production, while efferocytosis induces glycolysis in a more rapid and reversible manner. One possible interpretation of these findings is that efferocytosis-induced glycolysis evolved to produce a burst of lactate for pro-resolving processes, rather than to meet energy needs. Finally, in the case of inflammatory macrophages, one would not expect glycolysis to promote lactate-induced continual efferocytosis, which is associated with settings of inflammation resolution. In this context, we note with interest that citrate, which accumulates in inflammatory macrophages (above), is an endogenous inhibitor of PFKFB2 (ref. 50). Moreover, a recent study has demonstrated that glycolysis in inflammatory macrophages may actually suppress efferocytosis, and the mechanism appears to involve downregulation of a molecule that is upregulated by efferocytosis-induced glycolysis. In particular, the study reported that macrophage LRP1 expression and efferocytosis were enhanced in myeloid-specific Pkm2−/− mice51,52, suggesting that PKM2-mediated glycolysis in inflammatory macrophages limits LRP1 expression, perhaps through inflammation-induced LRP1 proteolysis53.
Defective clearance of ACs promotes chronic inflammatory disease by causing post-apoptotic necrosis and cellular-debris-mediated inflammation2–5. Efficient efferocytosis and tissue resolution depend on the ability of macrophages to ingest multiple ACs (continual efferocytosis), particularly in settings of chronic inflammation, where there is a high AC burden9,11,12. We and others have previously identified various mechanisms through which engulfment of a single AC enhances continual efferocytosis, including upregulation of uncoupling protein 2 (UCP2) to lower the mitochondrial membrane potential11, stimulation of mitochondrial fission-dependent recycling of membrane vesicles12, and utilization of AC-derived arginine and ornithine to drive actin-mediated internalization of subsequent ACs9. Our current findings show that efferocytosis-induced glycolysis promotes a complementary mechanism of continual efferocytosis, namely by enhancing the cell surface binding of subsequent ACs. These processes are amplified by another process through which primary efferocytosis leads to the proliferation of macrophages that are capable of carrying out continual efferocytosis and tissue resolution in vivo20. Interestingly, this pathway is mediated by Akt signaling, suggesting a possible coordination with efferocytosis-induced glycolysis.
Efferocytosis not only prevents the accumulation of inflammatory cell debris and promotes continual efferocytosis, but also triggers signaling pathways that induce the production of pro-resolving mediators, such as TGF-β, PGE2, and annexin A1 (refs. 34,54,55). These mediators, in turn, help promote continual efferocytosis. Therefore, in normal physiology, there is a highly beneficial efferocytosis–resolution positive feedback cycle that serves to repair post-inflammation injury and maintains tissue homeostasis. Conversely, when efferocytosis becomes defective in disease settings, this positive cycle is converted into a highly pathogenic negative cycle; that is, defective efferocytosis compromises resolution, which then further impairs efferocytosis. This scenario suggests that an intervention that is capable of boosting impaired efferocytosis might jump-start the positive cycle, and thereby reverse disease progression. Improving continual efferocytosis by enhancing GLUT1 (ref. 13) would likely not be a viable option, as it might promote macrophage-mediated inflammation. However, the findings herein, by identifying clear mechanistic differences between efferocytosis-induced glycolysis and glycolysis in inflammatory macrophages, provide potentially new therapeutic strategies for improving AC clearance and resolution in diseases driven by impaired efferocytosis. This concept will require future studies directed at understanding how efferocytosis-induced glycolysis might be compromised in certain disease settings, such as diabetes56, and whether it can be specifically enhanced, for example, by targeting an endogenous inhibitor of PFKFB2 (ref. 57).
Methods
Generation of BMDMs
To generate BMDMs, bone marrow was isolated from 8- to 12-week-old male mice and cultured for 7–10 days in DMEM with 4.5 g/L glucose, 584 mg/L l-glutamine, and 110 mg/L sodium pyruvate (10-013-CV; Corning), supplemented with 10% (vol/vol) heat-inactivated FBS (Gibco), 10 U/mL penicillin, and 100 mg/mL streptomycin (Corning), and 20% (vol/vol) L-929 mouse fibroblast (CCL-1)-conditioned medium (L-cell-conditioned medium). L-cell-conditioned medium was obtained by growing L-cells (American Type Culture Collection (ATCC)) in the DMEM described above. Experiments were conducted in untreated macrophages, unless stated otherwise, as follows: macrophages were incubated for 24 hours with 50 ng/mL LPS and 20 ng/mL recombinant murine IFN-γ (PeproTech) to polarize them towards a more pro-inflammatory phenotype, or with 20 ng/mL recombinant murine IL-4 (PeproTech) to polarize them towards a more pro-resolving phenotype. Cells were cultured in a humidified CO2 incubator at 37 °C.
Generation of HMDMs
To obtain HMDMs, peripheral blood mononuclear cells were isolated from the buffy coats of anonymous, de-identified healthy adult volunteers, with informed consent (New York Blood Center), by using Histopaque-1077 cell separation medium (Sigma-Aldrich), as described previously33. Isolated cells were rinsed and cultured for 7–14 days in RPMI-1640 medium with l-glutamine (10–040; Corning) supplemented with 10% (vol/vol) heat-inactivated FBS (Gibco), 10 U/mL penicillin, and 100 mg/mL streptomycin (Corning), and 10 ng/mL human GM-CSF or M-CSF (PreproTech). Experiments were conducted in naive GM-CSF macrophages, unless stated otherwise. For the indicated experiments, GM-CSF macrophages were incubated for 24 hours with 50 ng/mL LPS and 20 ng/mL recombinant human IFN-γ (PeproTech) to polarize them towards a more pro-inflammatory phenotype, and M-CSF macrophages were incubated with 20 ng/mL recombinant human IL-4 (PeproTech) to polarize them towards a more pro-resolving phenotype. Cells were cultured in a humidified CO2 incubator at 37 °C.
Generation of apoptotic Jurkat cells
Jurkat human T lymphocytes (TIB-152) were obtained from the ATCC and cultured in DMEM with 4.5 g/L glucose, l-glutamine, and sodium pyruvate (10-013-CV; Corning), supplemented with 10% (vol/vol) heat-inactivated FBS (Gibco), 10 U/mL penicillin, and 100 mg/mL streptomycin (Corning). To induce apoptosis, Jurkat cells were irradiated under a 254-nm UV lamp for 15 minutes, followed by incubation in PBS for 2–3 hours. The cells were then rinsed and resuspended in complete DMEM before adding them to macrophages at a 5:1 AC:macrophage ratio.
siRNA-mediated gene silencing
Scrambled RNA control and oligonucleotide-targeted siRNAs (ON-TARGETplus SMARTPool; Dharmacon) were transfected into macrophages at –50% confluency using Lipofectamine RNAi-MAX (Life Technologies), at 20 nM of siRNA per well. After 18 hours, the medium was changed, and the macrophages were subjected to a second incubation with 20 nM siRNA. The medium was changed the following day, and experiments were performed 72 hours after the initial siRNA treatment. Gene expression analysis was performed to validate silencing efficiency.
Seahorse analysis
The Seahorse XF96 Analyzer (Seahorse Bioscience) was used to conduct glycolysis and mitochondrial stress tests in BMDMs and HMDMs. Macrophages were seeded at 20,000 cells/well in XF96 cell culture microplates. Seahorse tests were performed in Seahorse XF DMEM assay medium, pH 7.4 (103575–100; Seahorse Bioscience), according to the manufacturer’s protocol. For the glycolysis stress tests, 20 mM glucose, 2 μM oligomycin, and 80 mM 2-DG were used. For the mitochondrial stress tests, 2 μM oligomycin, 1 μM FCCP, and 2 μM of rotenone and antimycin A were used. These compounds were preloaded in the reagent delivery chambers and pneumatically injected into the wells after three baseline measurements. The ECAR and oxygen-consumption rate were measured in real time every 7–8 minutes, and data were collected using Agilent Seahorse Wave 2.6 software.
Flow cytometry
Cells from in vitro experiments were collected on ice in 10 mM EDTA in PBS and fixed with 4% paraformaldehyde prior to flow cytometric analysis, while thymus cells from the in vivo dexamethasone–thymus study were used fresh without fixation. Cells were incubated with 1:100 TruStain FcX (anti-mouse CD16/32) antibody (Biolegend) in Pharmingen Stain Buffer (BSA) (BD Biosciences) for 30 minutes on ice to block non-specific binding of immunoglobulin to the Fc receptors, followed by incubation for 1 hour on ice with 1:50 Alexa Fluor 647 anti-GLUT1 (Abcam, ab195020) or FITC anti-F4/80 (Biolegend, no. 123108). Cells were rinsed twice and then resuspended in fresh buffer for analysis on a BD FACSCanto II flow cytometer using BD FACSDiva software (BD Biosciences). For detection of apoptosis, cells were rinsed twice and resuspended in annexin V Binding Buffer containing 1:20 FITC Annexin V solution (Biolegend, no. 640906). After 15 minutes, the cells were analyzed using the above-mentioned flow cytometer. Data analysis was carried out using FlowJo 10.8.1 software (BD Biosciences).
2-NBDG uptake assay
Macrophages were incubated with ACs labeled with pHrodo (Thermo Fisher), according to the manufacturer’s protocol. The macrophages were then rinsed twice with PBS and incubated for 1 hour in glucose-free medium containing 50 μM 2-NBDG (Thermo Fisher) in a humidified CO2 incubator at 37 °C. The macrophages were then rinsed with PBS twice and fixed with 4% paraformaldehyde. Nuclei were stained with Hoechst (Sigma), and images were captured using an epifluorescence microscope (Leica DMI6000B) with Leica LAS AF software to quantify the mean fluorescent intensity (MFI) of the 2-NBDG signal in AC− and AC+ macrophages.
Calcium imaging
Macrophages were incubated with ACs labeled with PKH26 (Thermo Fisher), according to the manufacturer’s protocol. The macrophages were then rinsed twice with PBS and incubated for 30 minutes with 5 μM Fluo-8-AM (Abcam) in a humidified CO2 incubator at 37 °C. The macrophages were then rinsed with PBS twice, followed by live cell imaging on a Nikon spinning disk confocal microscope (Eclipse Ti) using Nikon NIS-Elements software to quantify the MFI of the Fluo-8-AM signal in AC− and AC+ macrophages.
Western blot analysis
Macrophages were rinsed with PBS and lysed in 2× Laemmli Sample buffer (Bio-Rad) with 5% β-mercaptoethanol. Lysates were heated at 95 °C for 5 minutes, separated on Novex 4–20% Tris-Glycine gradient gels (Invitrogen) at 120 V for 1–2 hours, and electro-transferred to nitrocellulose membranes at 250 mA for 100 minutes at 4 °C. To detect phosphorylated TXNIP, SuperSep Phos-tag gels (FUJIFILM Wako) were used according to the manufacturer’s protocol. Membranes were blocked with 5% milk in TBST at room temperature for 1 hour, followed by incubation overnight at 4 °C with primary antibody against PFKFB2 (CST, no. 13045 for human; Novus, no. NBP2–32194 for mouse), phospho-PFKFB2 (CST, no. 13064), Akt (CST, no. 4691), phospho-Akt (CST, no. 4060), TXNIP (CST, no. 14715), MerTK (R&D systems, AF591), LRP1 (Abcam, Ab92544), or β-actin (CST, no. 5125; HRP-conjugated), diluted in blocking solution (1:1,000 for target proteins, 1:5,000 for housekeeping proteins). Target proteins were detected by using 1:5,000 HRP-conjugated secondary antibodies. Densitometry was conducted using ImageJ software.
LC−MS/MS analysis of fructose-1,6-bisphoshate
Macrophages were incubated with ACs for 45 minutes, followed by removal of unbound ACs and incubation in complete culture medium for 3 hours. After removal of the medium, the cells were rinsed with 150 mM ice-cold ammonium acetate and collected in ice-cold methanol. The methanol extracts were subjected to multiple rounds of freeze–thaw cycles, collected by centrifugation, and dried under a gentle nitrogen flow. Metabolites were reconstituted in 80% methanol and analyzed with the QTRAP 6500 LC−MS/MS System (SCIEX) to enable the identification and quantification of fructose-1,6-bisphosphate.
Mouse husbandry
Animal protocols used for experiments were approved by Columbia University’s Institutional Animal Care and Use Committee, and animals were cared for according to National Institutes of Health (NIH) guidelines for the care and use of laboratory animals under protocol number AABL0571. All mice were group-housed in standard cages at 22 °C with 40–60% humidity and under a 12-hour/12-hour light/dark cycle with ad libitum access to water and food. Eight-week-old male C57BL/6J wild-type mice (Jackson Laboratory, strain 000664) were used as recipients of bone marrow for the dexamethasone–thymus study (n = 6–7 mice/group). Mice were acclimatized for 1 week in our animal facility before the experiments began. Donor bone marrow cells were obtained from 8- to 12-week-old female PFKFB2-mutant mice and wild-type littermates (both on the C57BL/6 background); the mutant mice were generated by Ozgene, as has been described previously31.
Bone marrow transplantation
Eight-week-old male C57BL/6J recipient mice were irradiated with 1,000 rads from a Cesium-137 Gammacell source. After a 4- to 6-hour rest period, the mice were injected i.v. with 2.5 × 10⁶ bone marrow cells from PFKFB2-mutant mice or wild-type littermates. The recipient mice were given water containing 10 mg/mL neomycin for 3 weeks following the bone marrow transplant. After 4 weeks, the mice were subjected to the dexamethasone–thymus assay.
Dexamethasone–thymus assay
Mice that had been implanted with bone marrow from PFKFB2-mutant mice or wild-type littermates were injected i.p. with 250 μL PBS alone or PBS containing 250 μg dexamethasone (Sigma-Aldrich) dissolved in DMSO. Eighteen hours after injection, the mice were euthanized, and thymi were collected and weighed. One lobe of the thymus was mechanically dissociated, and cells were counted to determine the total cell number and then stained for F4/80 and Annexin V as described above (see ‘Flow cytometry’) to determine the number of thymic macrophages and ACs. The other lobe of the thymus was fixed in 4% paraformaldehyde, paraffin-embedded, and sectioned into 5-μm sections for staining, as described below.
Immunofluorescent staining
Thymus sections were deparaffinized with xylene, rehydrated using an ethanol gradient, and rinsed with PBS. Antigen retrieval was carried out by incubation in a Citrate-Based Antigen Unmasking Solution (Vector) diluted in dH2O, followed by pressure cooking for 10 minutes. To stain apoptotic TUNEL-positive cells in thymic sections, the In Situ Cell Death Detection Kit (Sigma-Aldrich) was used according to the manufacturer’s protocol. To stain proteins of interest, thymic sections or cells grown in glass-bottom dishes were rinsed, incubated with a 5% BSA blocking solution for 1 hour at room temperature, and then incubated overnight at 4 °C with primary antibodies against GLUT1 (Abcam, Ab15309; 1:100), Mac2 (Cedarlane, CL8942LE; 1:500), MerTK (R&D systems, AF591; 4 μg/mL), LRP1 (Abcam, Ab92544; 1:100), and/or phospho-PFKFB2 (CST, 13064; 1:100). The next day, thymic sections or cells were rinsed with PBS and incubated with fluorescently labeled secondary antibodies for 2 hours, rinsed, dried, and mounted using ProLong Gold Antifade Mountant with DAPI (Invitrogen). Images were taken using a Leica epifluorescence microscope (DMI6000B) with Leica LAS AF software or a Nikon spinning disk confocal microscope (Eclipse Ti) with Nikon NIS-Elements software. Image analysis was performed using ImageJ software.
Single and continual efferocytosis assays
After induction of apoptosis, Jurkat cells were stained with PKH26, PKH67 (Sigma-Aldrich), or pHrodo (Thermo Fisher) according to the manufacturer’s protocol. For single efferocytosis assays, macrophages were incubated with PKH26- or pHrodo- ACs for 45 minutes at a 5:1 AC:macrophage ratio. After 45 minutes, unbound ACs were removed by vigorous rinsing of the monolayer, and fluorescence and bright-field images were captured using an epifluorescence microscope (Leica DMI6000B) to identify the uptake of red-labeled ACs. For continual efferocytosis assays, macrophages were first incubated with PKH67-stained ACs (green) for 45 minutes at a 5:1 AC:macrophage ratio, followed by removal of unbound ACs and incubation in complete culture medium for 2 hours. The macrophages were then incubated with a second round of PKH26- or pHrodo-stained ACs (both red) for 45 minutes at a 5:1 AC:macrophage ratio. After 45 minutes, unbound ACs were removed, and fluorescence and bright-field images were captured using an epifluorescence microscope (Leica DMI6000B) with Leica LAS AF to quantify the number of macrophages with green plus red ACs as a percentage of macrophages with only green ACs, which is a measure of continual efferocytosis9.
Gene expression analysis
RNA was extracted from macrophages using the PureLink RNA Mini kit (Life Technologies), following the manufacturer’s protocol. The purity and concentration of the RNA were determined using a NanoDrop spectrophotometer (Thermo Fisher Scientific). RNA was reverse transcribed using oligo(dT) and Superscript II (Applied Biosystems). Quantitative RT–PCR was performed with SYBR Green Master Mix reagents (Applied Biosystems) on a 7500 Real-Time PCR system (Applied Biosystems). Primer sequences are listed in Supplementary Table 1. Expression of genes of interest was normalized to expression of the housekeeping gene Rplp0 (mouse) or HPRT (human).
Lactate measurement
BMDMs were cultured in DMEM (10–013-CV; Corning) with 1% (vol/ vol) heat-inactivated FBS (Gibco). The lactate concentrations in the cells and medium were measured using the Lactate Assay Kit from Sigma-Aldrich, according to the manufacturer’s instructions.
Statistical analysis
GraphPad Prism software (v.9.4.0) was used for all statistical analyses. Significant outliers (P < 0.05), as determined by the Grubbs’ test, were excluded from datasets prior to further analyses. Data were tested for normality using the Shapiro–Wilk test. Data that passed the normality test were analyzed using the two-tailed Student’s t-test for comparison of two groups or one- or two-way analysis of variance (ANOVA) with Fisher’s least significant difference (LSD) post hoc analysis for comparison of more than two groups. Data that were not normally distributed were analyzed using the nonparametric Mann–Whitney U test or Kruskal–Wallis test. Data are shown as mean values ± s.e.m., and differences were considered statistically significant at P < 0.05. For normalization of data, all values were divided by the mean of the respective control group. The number of mice used for the dexamethasone–thymus assay was determined based on power calculations, with an expected 15–25% coefficient of variation and an 80% chance of detecting a 33% difference in the key parameters, including in situ efferocytosis and necrotic area.
Extended Data
Extended Data Fig. 1 |. Seahorse analysis of macrophages treated with either IFNγ and LPS or IL-4.
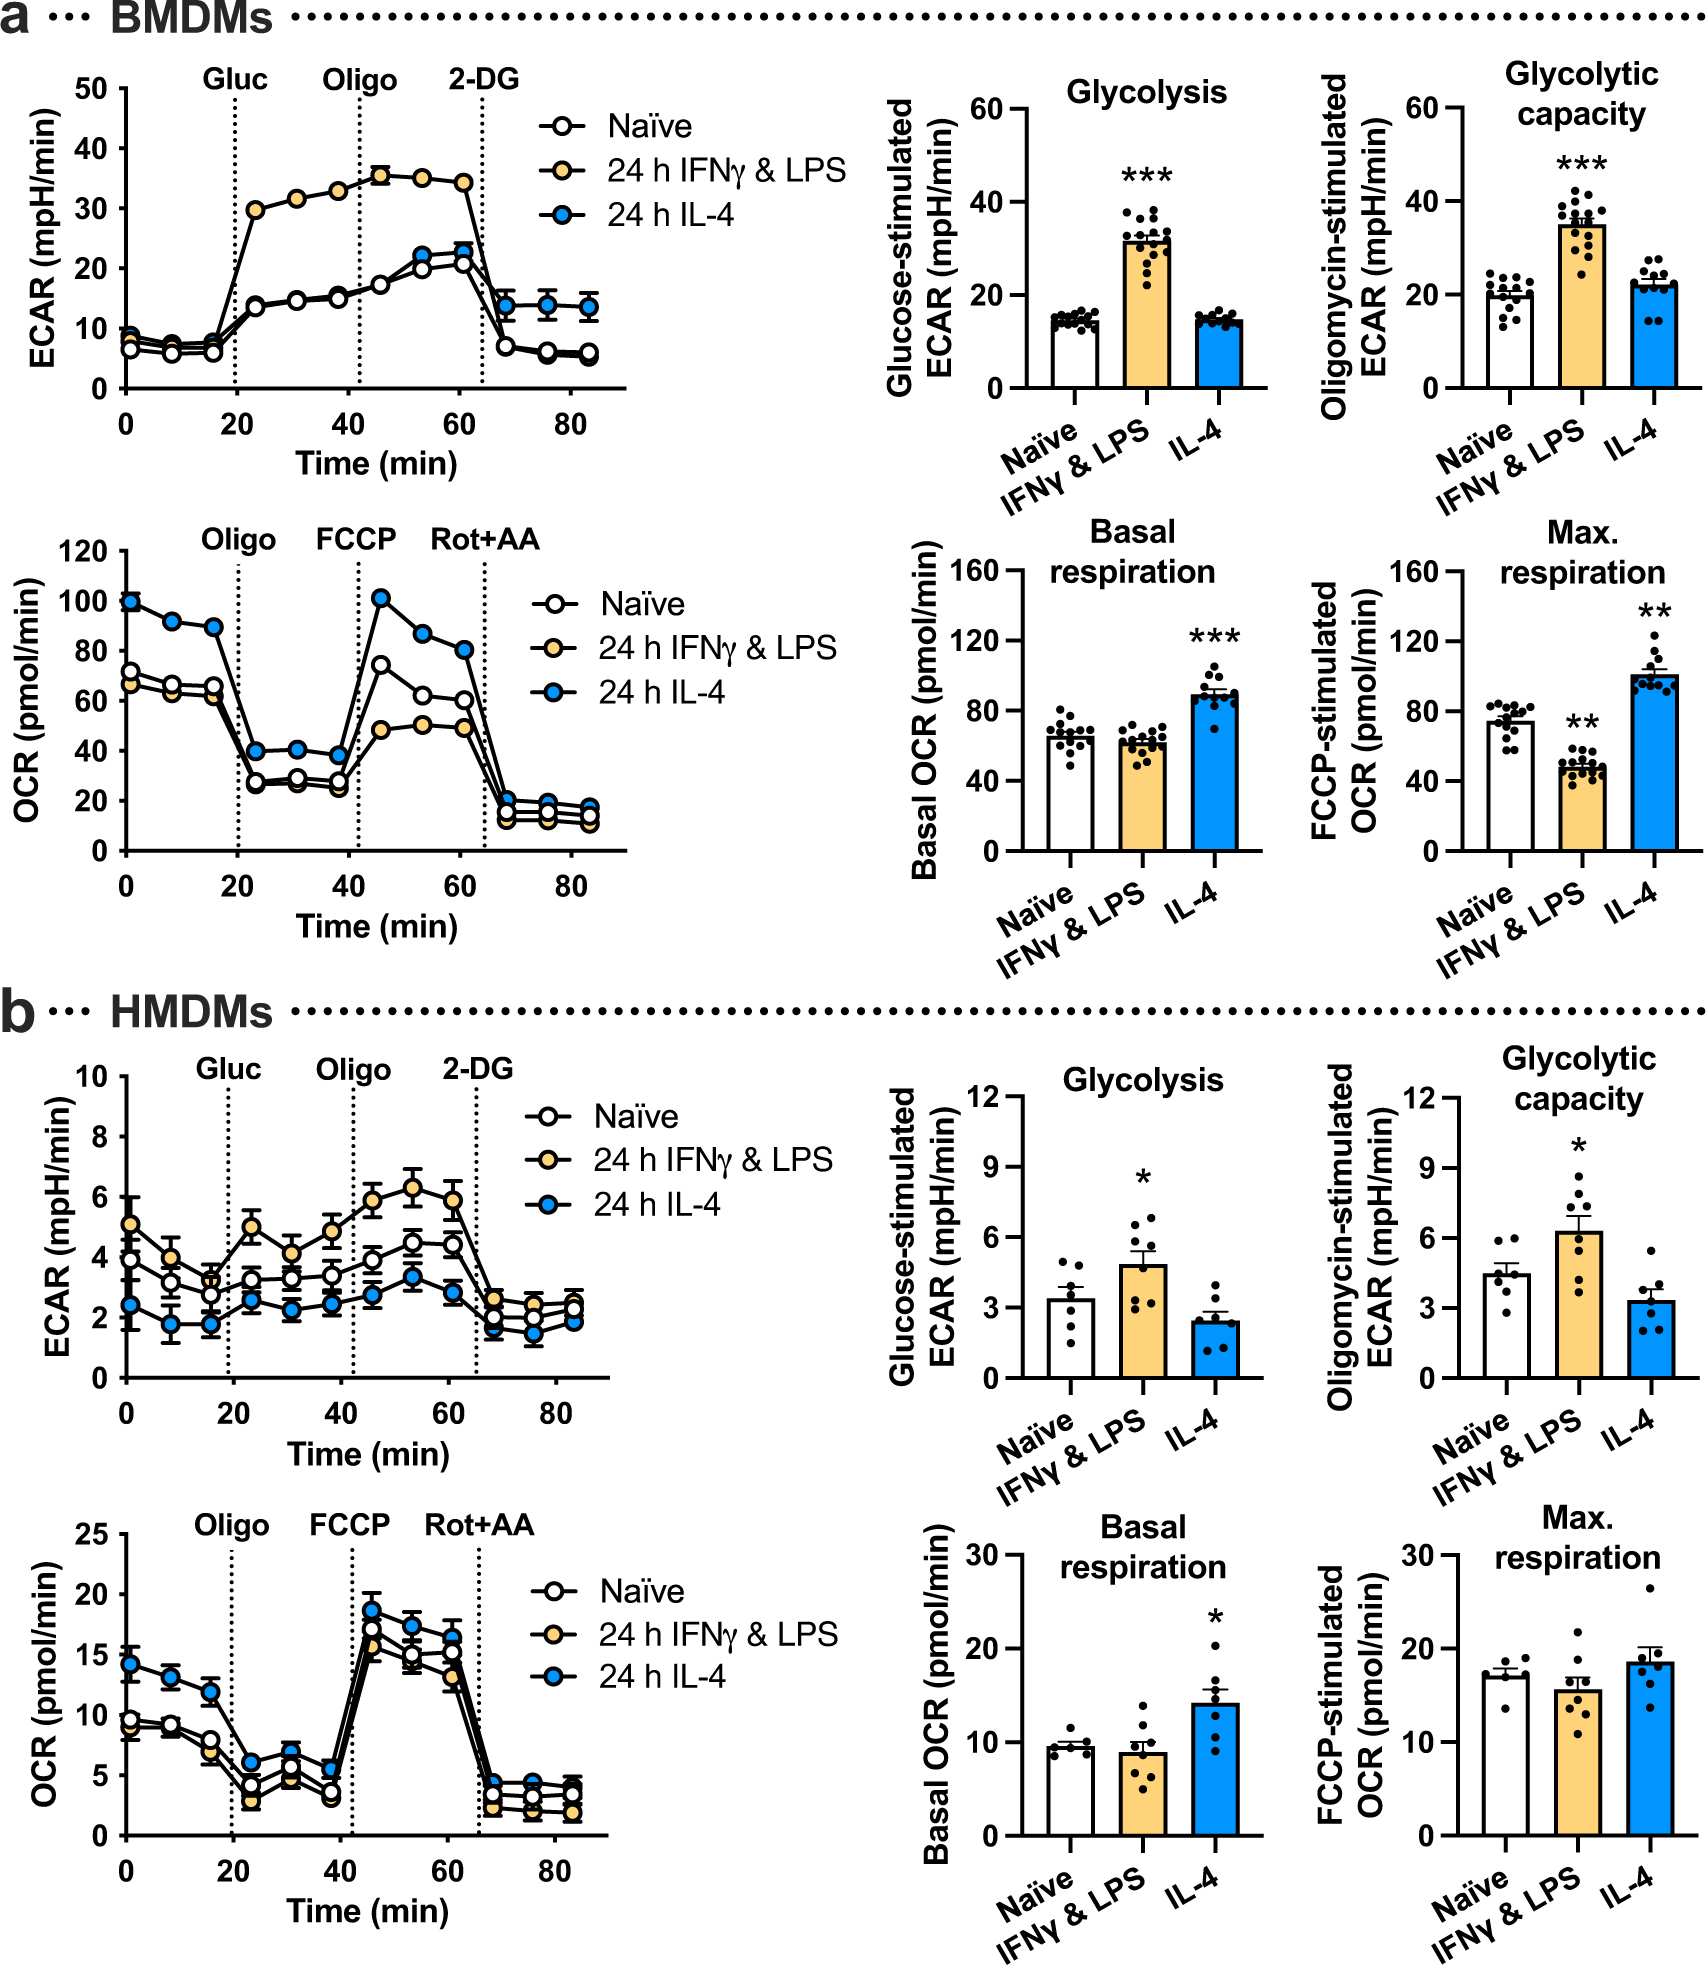
a, Naïve BMDMs were polarized towards a proinflammatory phenotype with IFNγ and LPS or a pro-resolving phenotype with IL-4 for 24 h followed by Seahorse analysis. The extracellular acidification rate (ECAR), a measure of glycolysis, was measured at baseline and after the addition of glucose (‘glycolysis’), oligomycin (‘glycolytic capacity’), and 2-DG. The oxygen consumption rate (OCR), a measure of oxidative phosphorylation, was measured at baseline (‘basal respiration’) and after the addition of oligomycin, FCCP (‘maximal respiration), and rotenone plus antimycin A (n = 15–16 wells/group). **P = 0.0017 (naïve vs. IFNγ and LPS), **P = 0.0048 (naïve vs. IL-4), ***P < 0.0001, as compared to the naïve groups. b, The same experiment as described under panel a was performed in HMDMs (n = 7–8 wells/group). *P = 0.046 for glycolysis, *P = 0.044 for glycolytic capacity, *P = 0.021 for basal respiration, as compared to the naïve groups. All values are means ± SEM, and significance was determined by one-way ANOVA with Fisher’s LSD post hoc analysis.
Extended Data Fig. 2 |. Seahorse analysis of macrophages at various times following incubation with apoptotic cells, and in apoptotic cells alone.
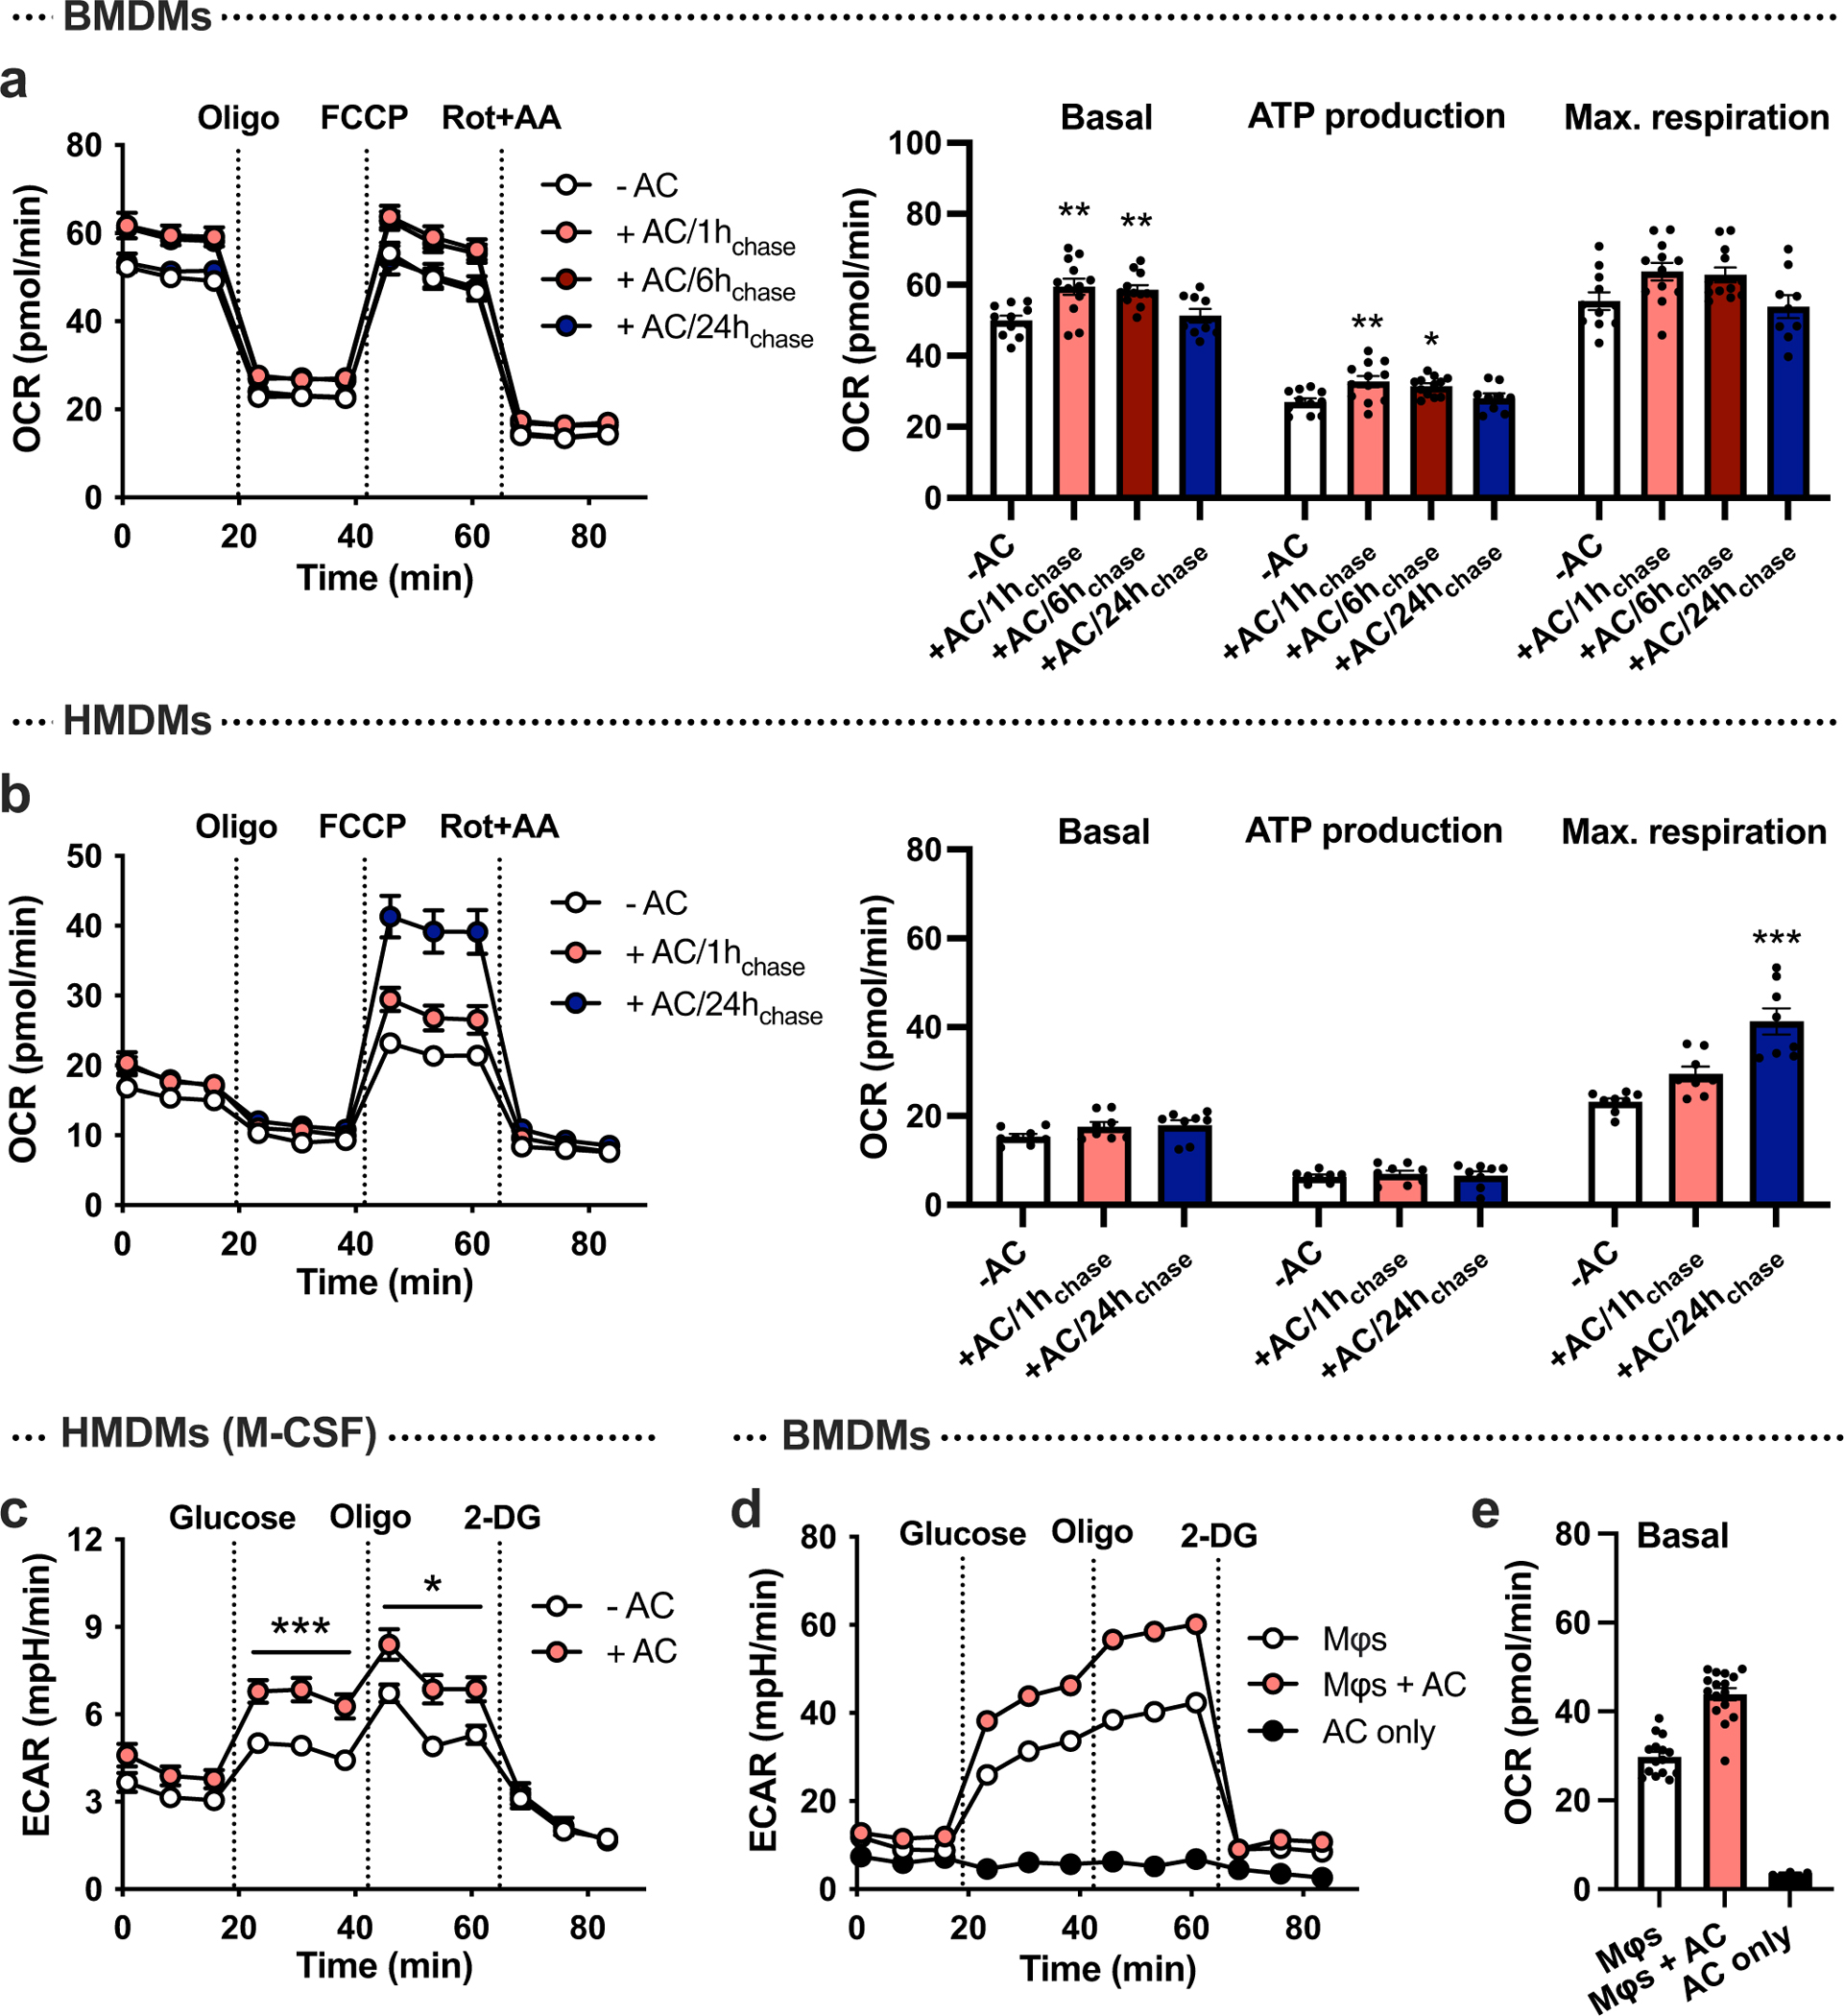
a, BMDMs (were incubated with apoptotic Jurkat cells (ACs) for 45 min (pulse), followed by rinsing to remove unengulfed ACs, and then subjected to Seahorse analysis 1, 6, or 24 h later (chase). The oxygen consumption rate (OCR), a measure of oxidative phosphorylation, was measured at baseline (‘basal respiration’) and after the addition of oligomycin, FCCP (‘maximal respiration), and rotenone plus antimycin A (n = 11–12 wells/group). *P = 0.0027, **P = 0.0011 (basal 1 h chase), **P = 0.0031 (basal 6 h chase), **P = 0.0036 (ATP production 1 h chase), as compared to the -AC groups. b, The same experiment as described under panel a was performed in HMDMs (n = 8 wells/group). ***P < 0.0001, as compared to the -AC group. c, A glycolysis stress test was performed in HMDMs differentiated with M-CSF instead of GM-CSF, after a 1 h chase without or with ACs (n = 11–12 wells/group). *P < 0.05, ***P < 0.001. d,e, A glycolysis stress test was performed in BMDMs after a 1 h chase without or with ACs (n = 14–15 wells/group; 20,000 macrophages per well), or in ACs alone (n = 3 wells; 100,000 ACs/well). The ECAR and OCR were measured to evaluate glycolysis (d) and oxidative phosphorylation (e), respectively. All values are means ± SEM, and significance was determined by one-way ANOVA with Fisher’s LSD post hoc analysis (a-b) or multiple two-tailed Student’s t-tests (c).
Extended Data Fig. 3 |. Flow cytometry analysis of cell-surface GLUT1 expression in efferocytic macrophages.
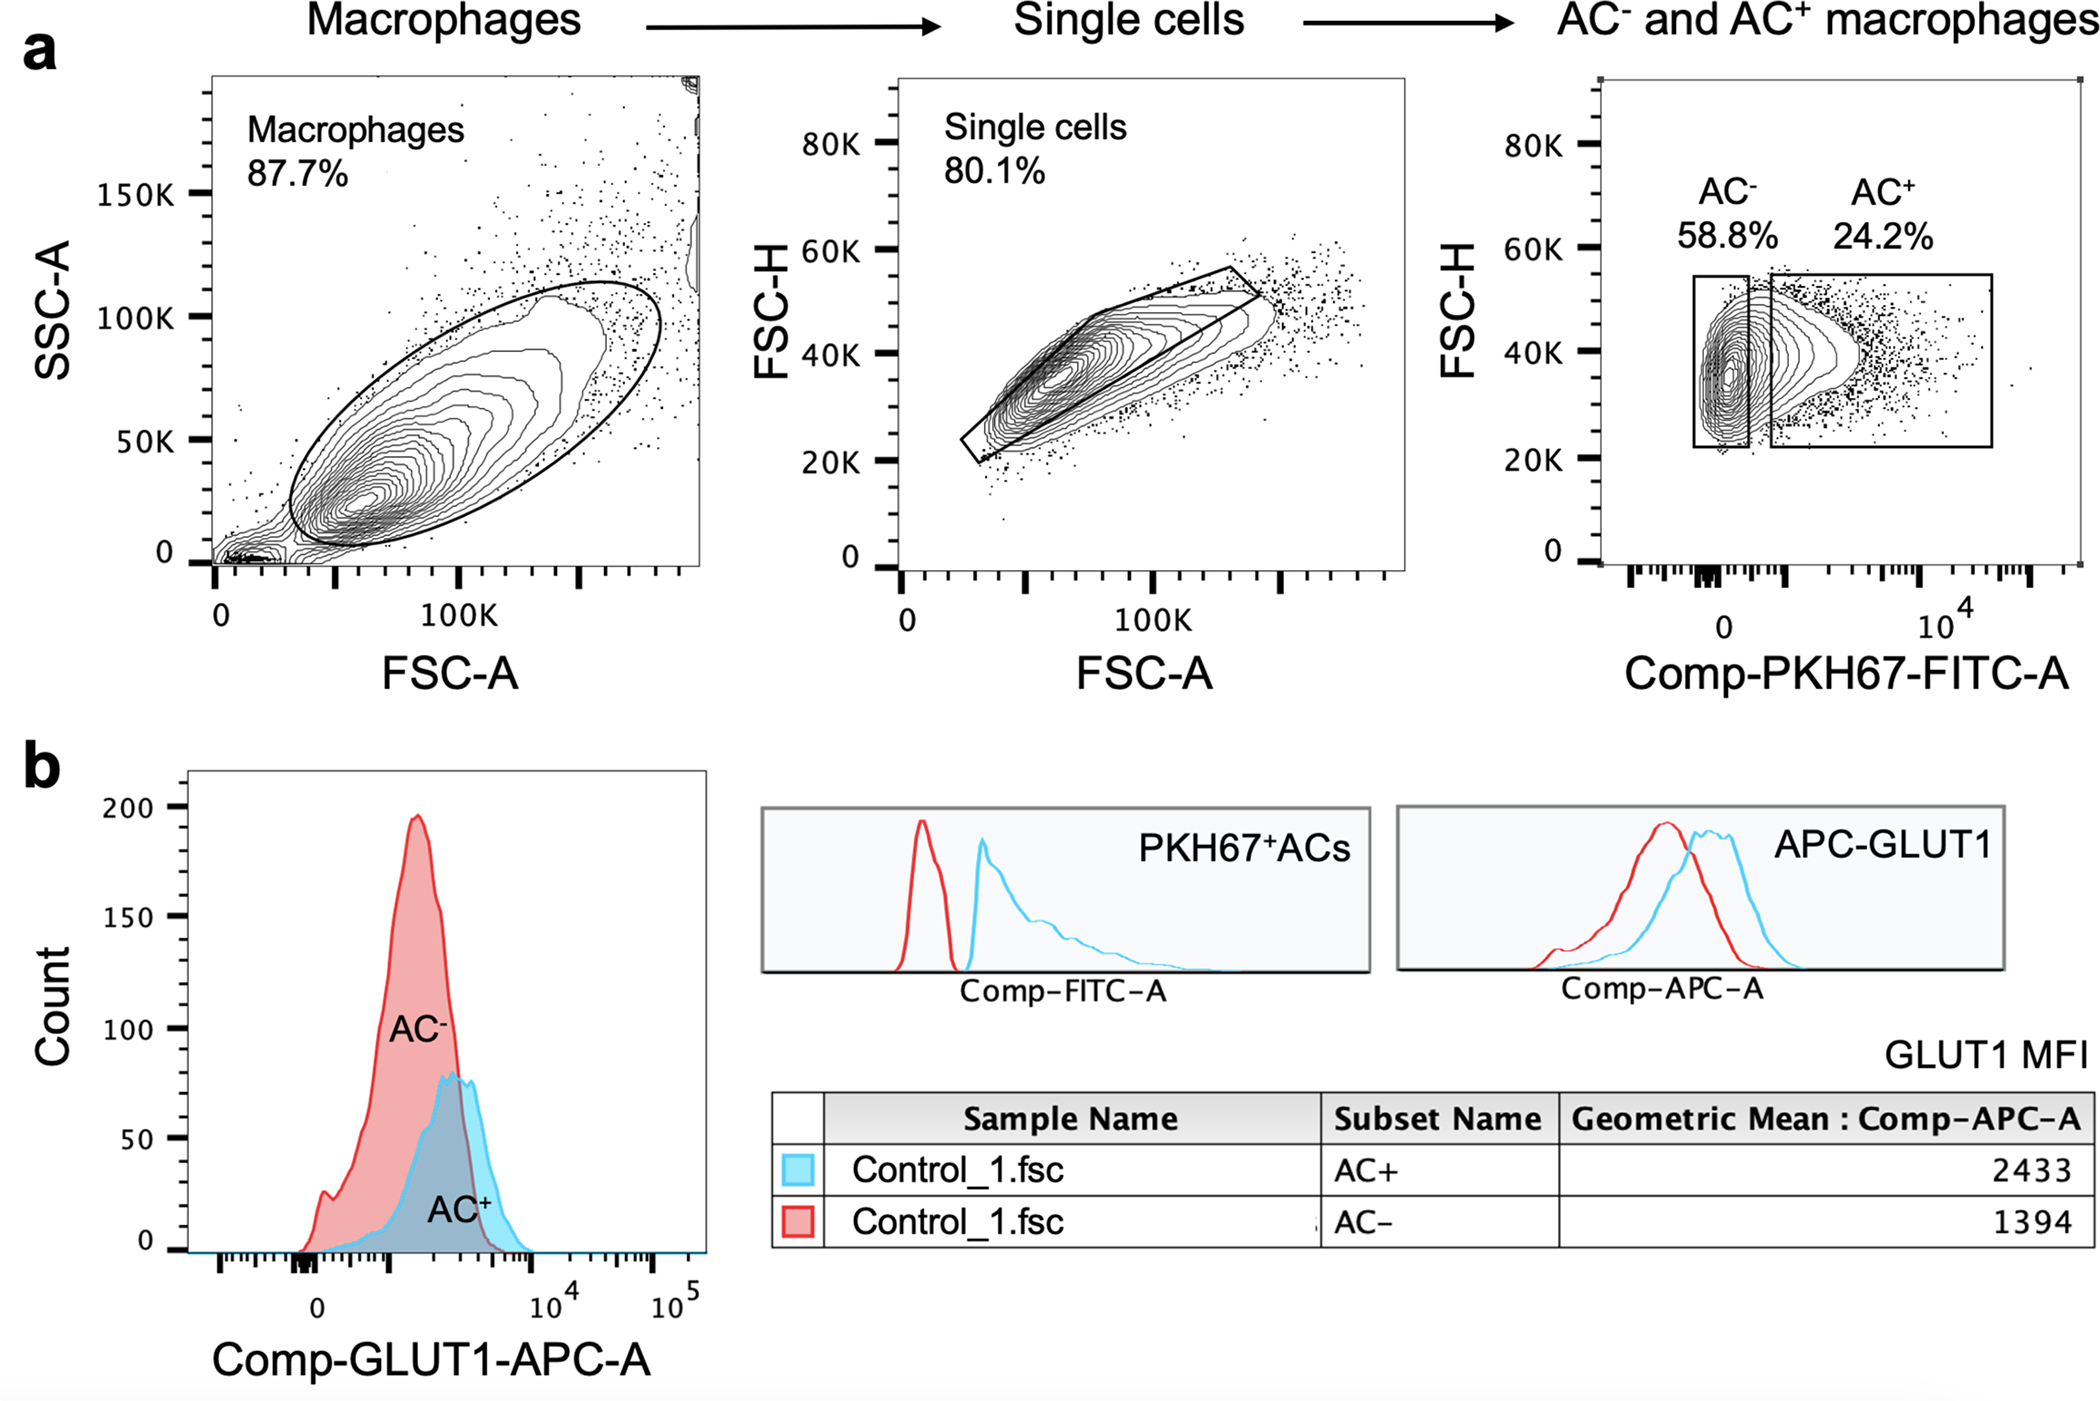
BMDMs were incubated with PKH67-labeled apoptotic cells (ACs) for 45 min, rinsed and harvested 1 h later for flow cytometric analysis of cell-surface GLUT1 using an APC-conjugated GLUT1 antibody. a, Gating strategy for AC− and AC+ macrophages, with PKH67 detected in the FITC channel. b, The mean fluorescent intensity (MFI) of cell-surface GLUT1 based on the flow cytometric data.
Extended Data Fig. 4 |. Analysis of siRNA silencing efficiency, efferocytosis-induced gene expression, and 2-NBDG uptake.
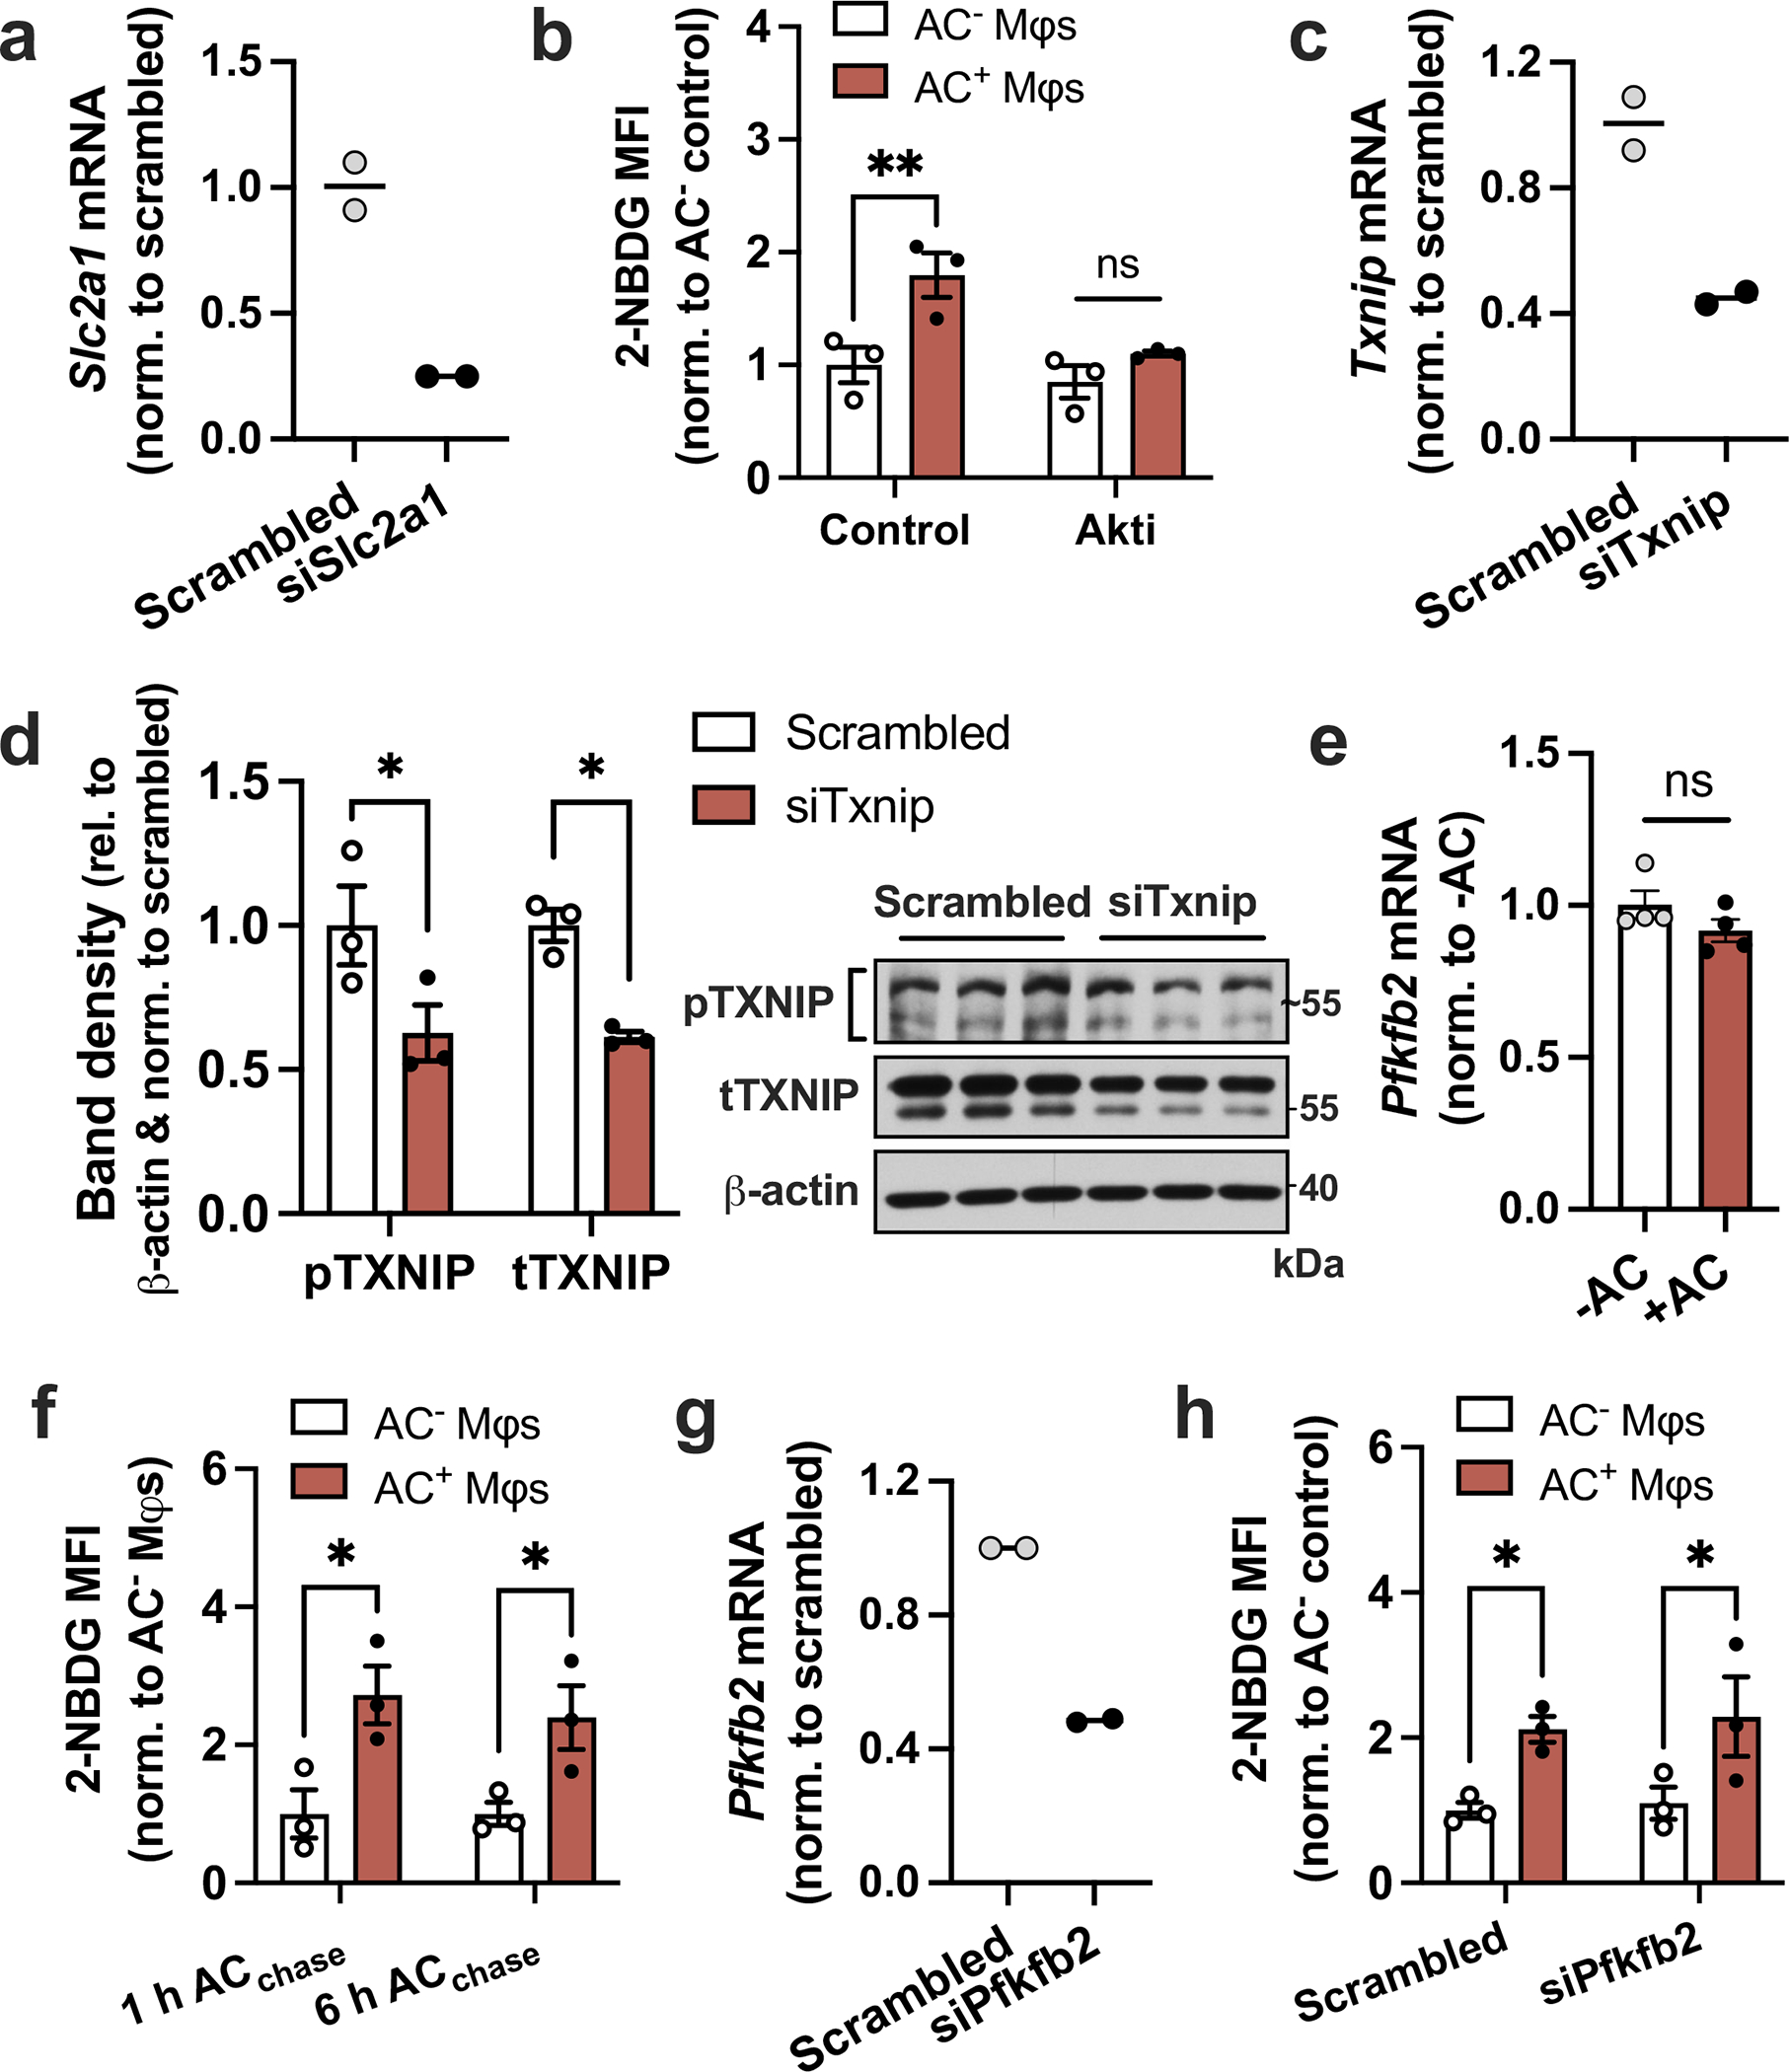
a, BMDMs were transfected with scrambled RNA or siSlc2a1, and Slc2a1 expression was measured by RT-qPCR (n = 2 wells/group). b, BMDMs (Mφs) pretreated with the Akt inhibitor MK-2205 (5 μM) were incubated with fluorescently labeled apoptotic Jurkat cells (ACs) for 45 min, followed by rinsing and addition of glucose-free medium containing 2-NBDG without or with MK-2205. After 1 h, macrophages were fixed and the mean fluorescent intensity (MFI) of 2-NBDG was quantified in AC− and AC+ macrophages by fluorescent microscopy (n = 3 images/group). **P = 0.0047. c,d, BMDMs were transfected with scrambled RNA or siTxnip, and knockdown was validated by RT-qPCR (n = 2 wells/group) and immunoblotting (n = 3 samples/group). e, BMDMs were incubated in the absence or presence of ACs for 45 min, rinsed, and Pfkfb2 expression was measured 1 h later (n = 4 wells/group). *P = 0.018 (pTXNIP), *P = 0.015 (tTXNIP). f, A 2-NBDG assay as described under panel B was performed in Mφs after 1 or 6 h of incubation with ACs (n = 3 images/group). *P = 0.011 (1 h ACchase), *P = 0.028 (6 h ACchase). g, BMDMs were transfected with scrambled RNA or siPfkfb2, and Pfkfb2 expression was measured by RT-qPCR (n = 2 wells/group). h, A 2-NBDG assay as described under panel B was performed in Mφs transfected with scrambled RNA or siPfkfb2 (n = 3 images/group). *P = 0.035 (Scrambled), *P = 0.027 (siPfkfb2) All values are means ± SEM, and significance was determined by two-way ANOVA with Fisher’s LSD post hoc analysis. ns, not significant (P > 0.05).
Extended Data Fig. 5 |. Additional efferocytosis assays and validation of siRNA silencing efficiency.
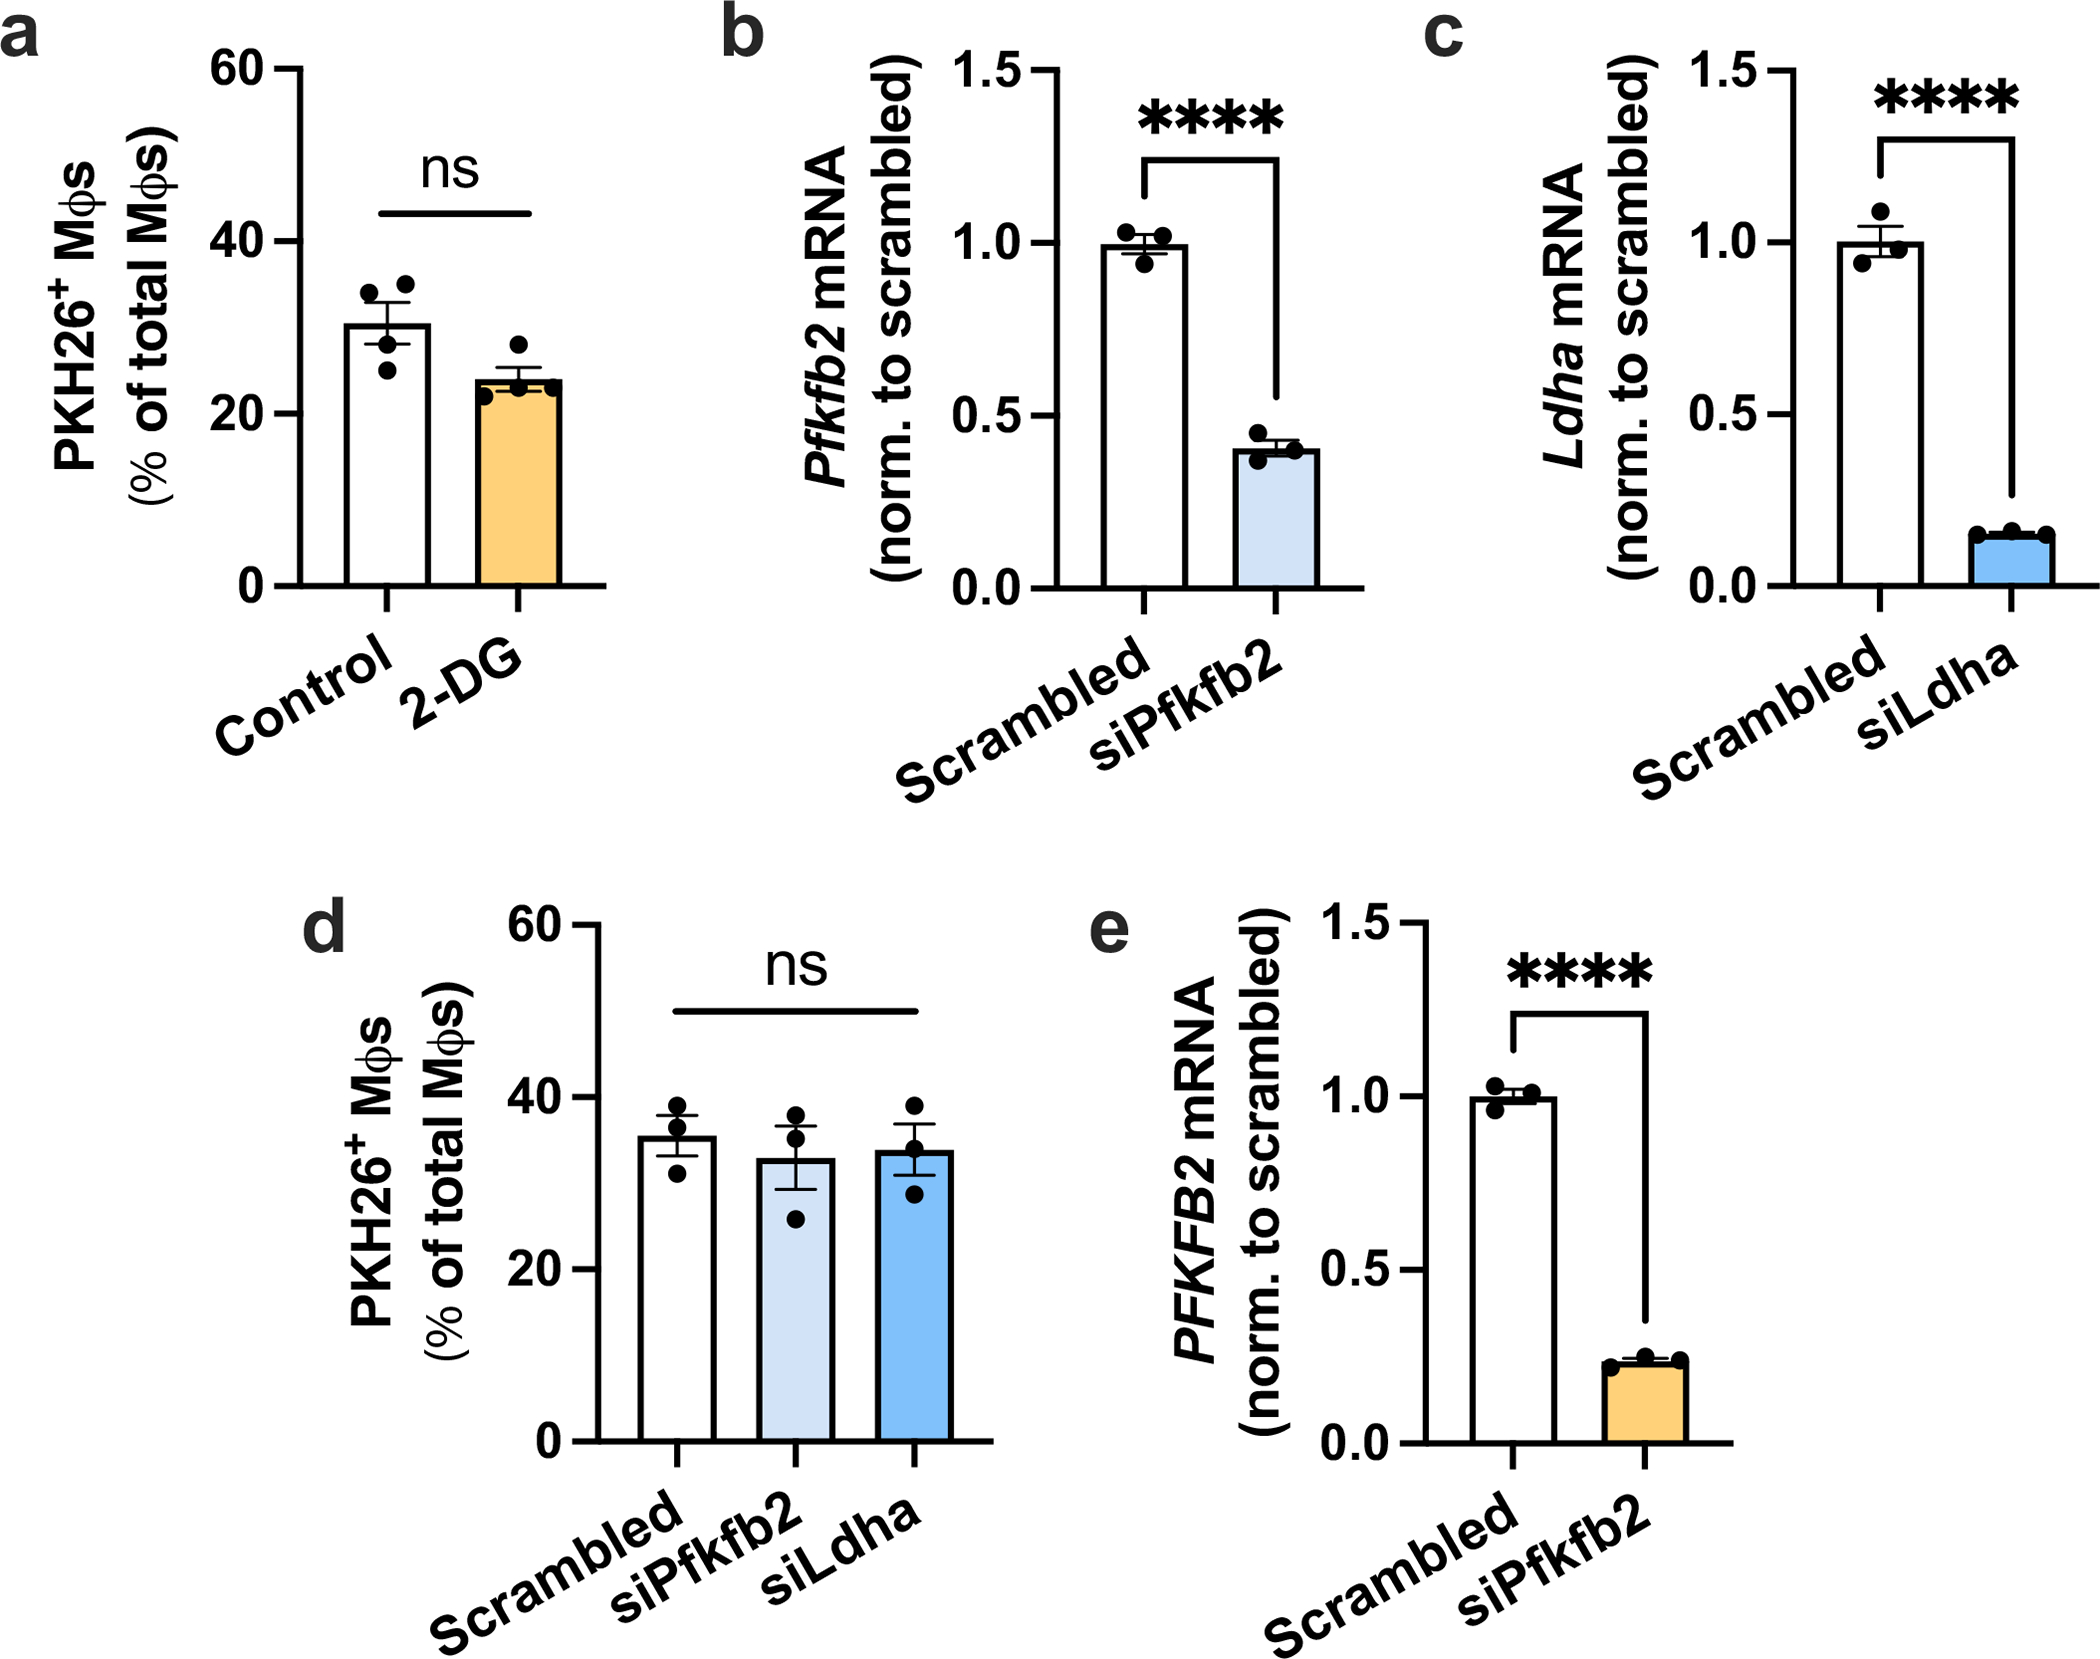
a, BMDMs were pretreated without or with 10 mM 2-DG for 1 h, followed by incubation with PKH26-labeled apoptotic Jurkat cells (ACs) for 45 min. Unengulfed ACs were then rinsed away, and the number of PKH26+ macrophages were quantified as a measure of single efferocytosis (n = 4 wells/group). b, BMDMs were transfected with scrambled RNA or siPfkfb2, and Pfkfb2 gene expression was measured by RT-qPCR (n = 3 wells/group). ****P < 0.0001. c, BMDMs were transfected with scrambled RNA or siLdha, and Ldha gene expression was measured by RT-qPCR (n = 3 wells/group). ****P < 0.0001. d, BMDMs were transfected with scrambled RNA, siPfkfb2 or siLdha, followed by a single efferocytosis assay as described for panel A (n = 3 wells/group). e, HMDMs were transfected with scrambled RNA or siPfkfb2, and PFKFB2 gene expression was measured by RT-qPCR (n = 3 wells/group). ****P < 0.0001. All values are means ± SEM, and significance was determined by the two-tailed Student’s t-test (a-c & e) or two-way ANOVA with Fisher’s LSD post hoc analysis in panel d. ns, not significant (P > 0.05).
Extended Data Fig. 6 |. Pfkfb3 and Pfkfb4 are upregulated by IFNγ and LPS, and partial silencing of Pfkfb3 and Pfkfb4 does not affect efferocytosis.
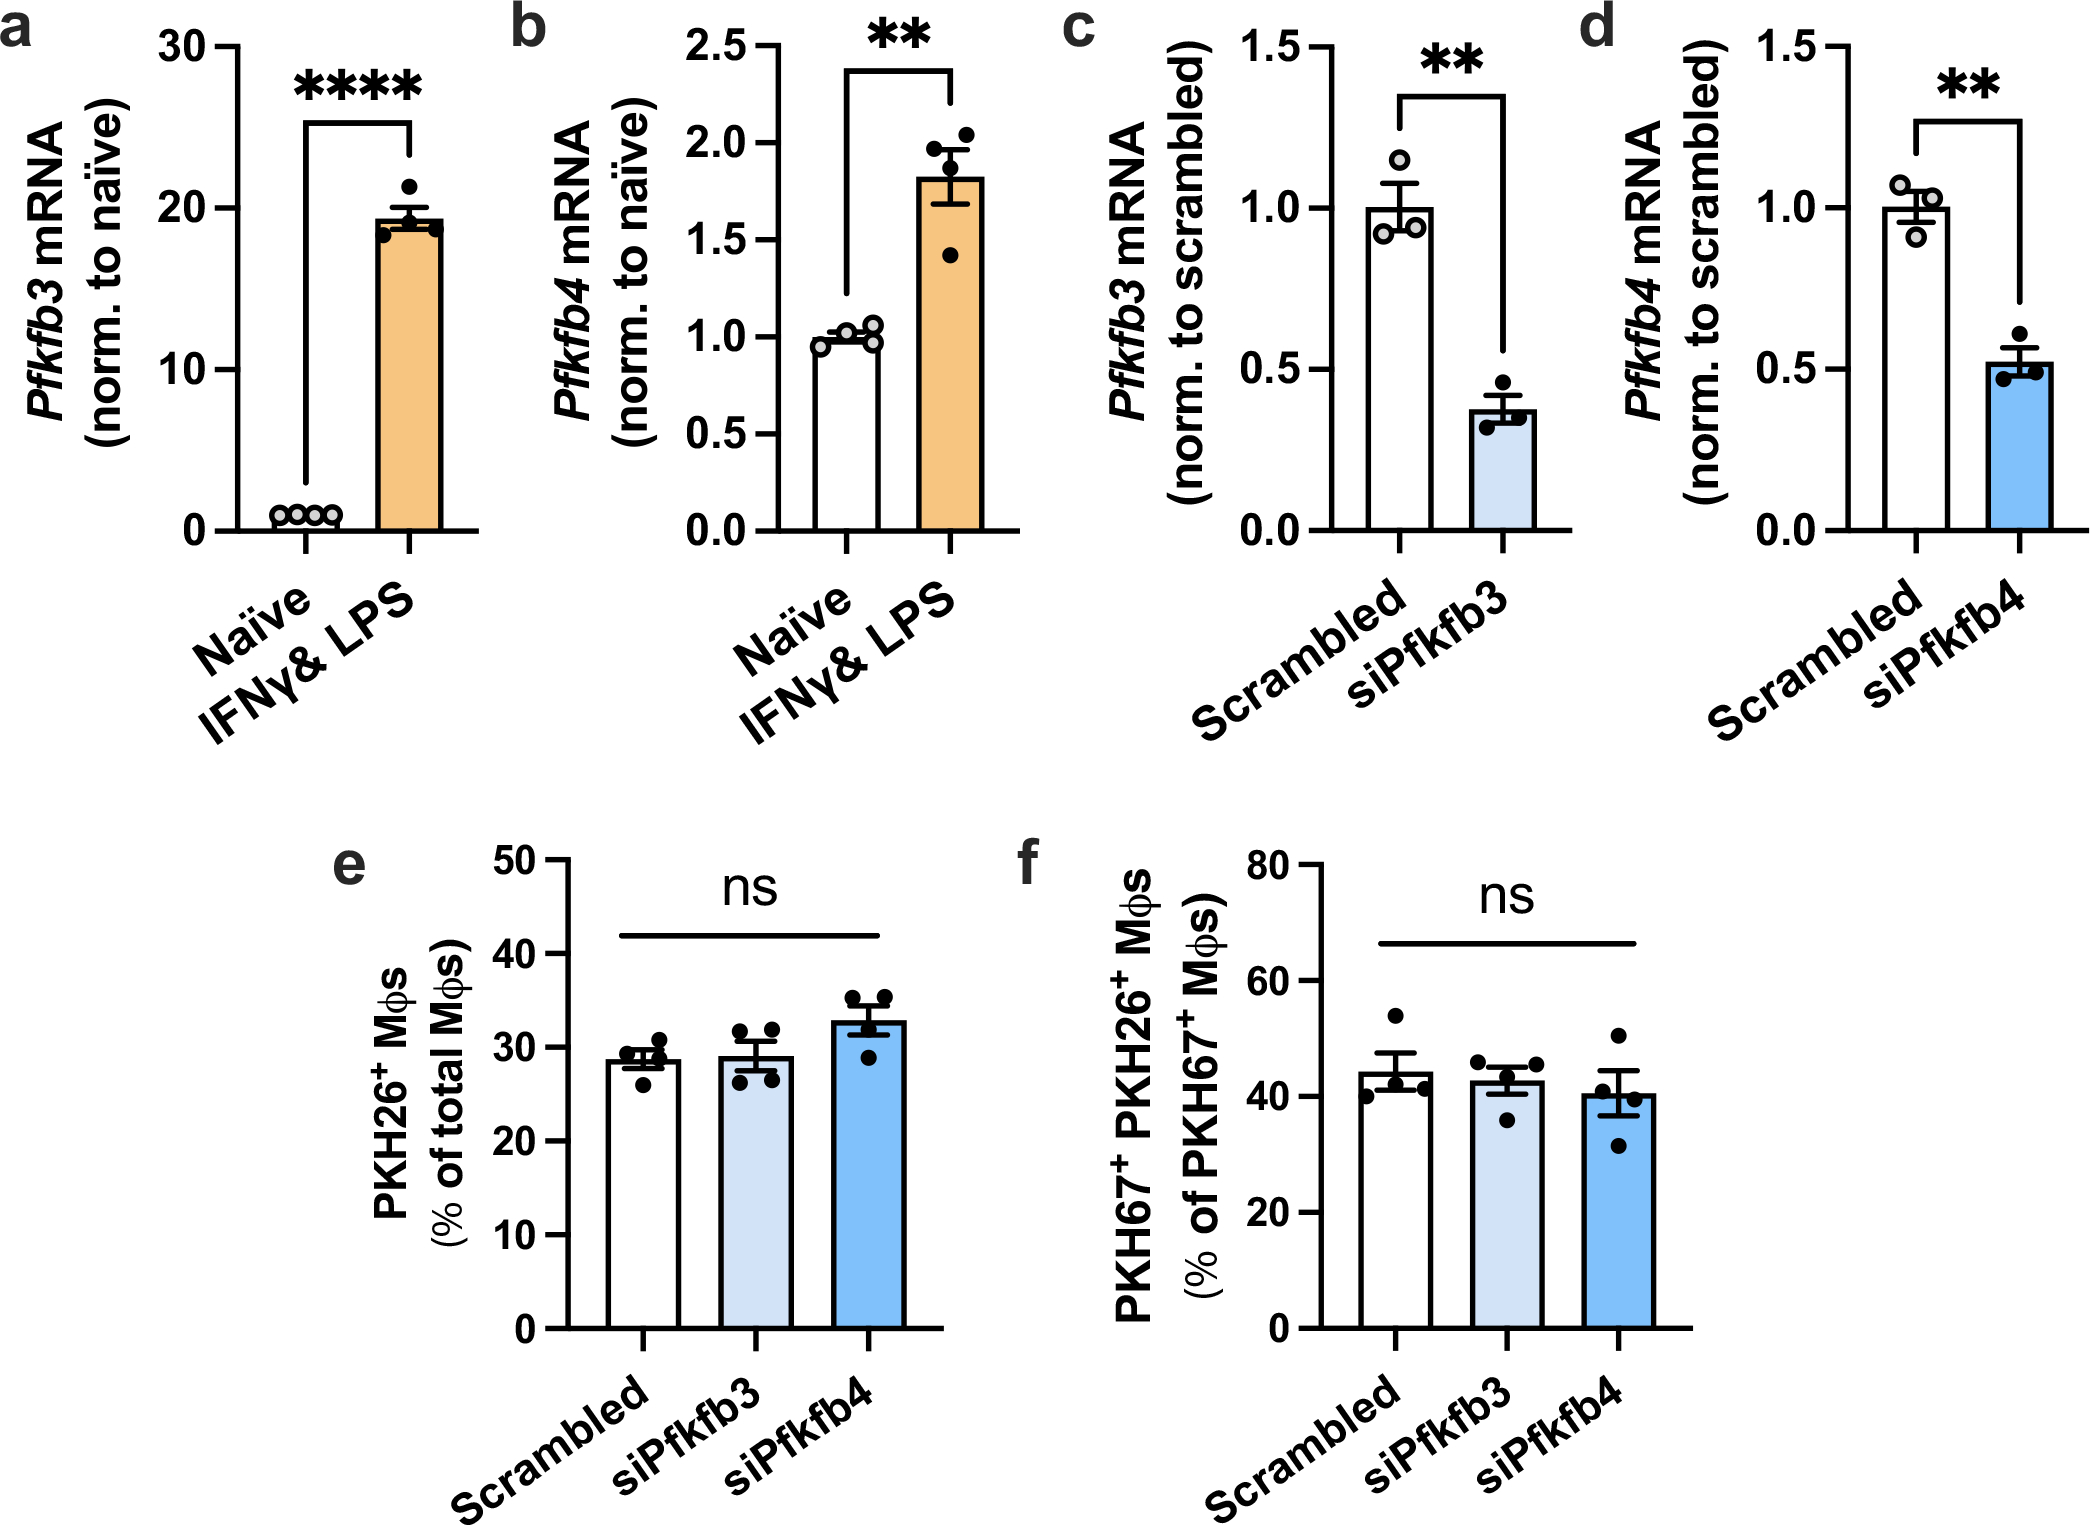
a,b, Expression levels of Pfkfb3 and Pfkfb4 were measured by RT-qPCR in naïve macrophages and macrophages polarized towards a pro-inflammatory phenotype with IFNγ and LPS (n = 4 wells/group). **P = 0.0011, ****P < 0.0001. c, BMDMs were transfected with scrambled RNA or siPfkfb3, and Pfkfb3 expression was measured (n = 3 wells/group). **P = 0.0018. d, BMDMs were transfected with scrambled RNA or siPfkfb4, and Pfkfb4 expression was measured (n = 3 wells/group). **P = 0.0018. e, BMDMs transfected with scrambled RNA, siPfkfb3, or siPfkfb4 were incubated with PKH26-labeled apoptotic Jurkat cells (ACs) for 45 min. Unengulfed ACs were removed by rinsing, and the number of PKH26+ macrophages were quantified (n = 4 wells/ group). f, BMDMs transfected with scrambled RNA, siPfkfb3, or siPfkfb4 were first incubated with PKH67-labeled ACs for 45 min, rinsed, and 2 h later incubated with PKH26-labeled ACs for 45 min. The number of PKH67+ PKH26+ Mφs relative to PKH67+ Mφs was quantified as a measure of continual efferocytosis (n = 4 wells/group). All values are means ± SEM, and significance was determined by the two-tailed Student’s t-test (a-d) or one-way ANOVA with Fisher’s LSD post hoc analysis (e-f). ns, not significant (P > 0.05).
Extended Data Fig. 7 |. Macrophages from PFKFB2 mutant mice show attenuated efferocytosis-induced glycolysis.
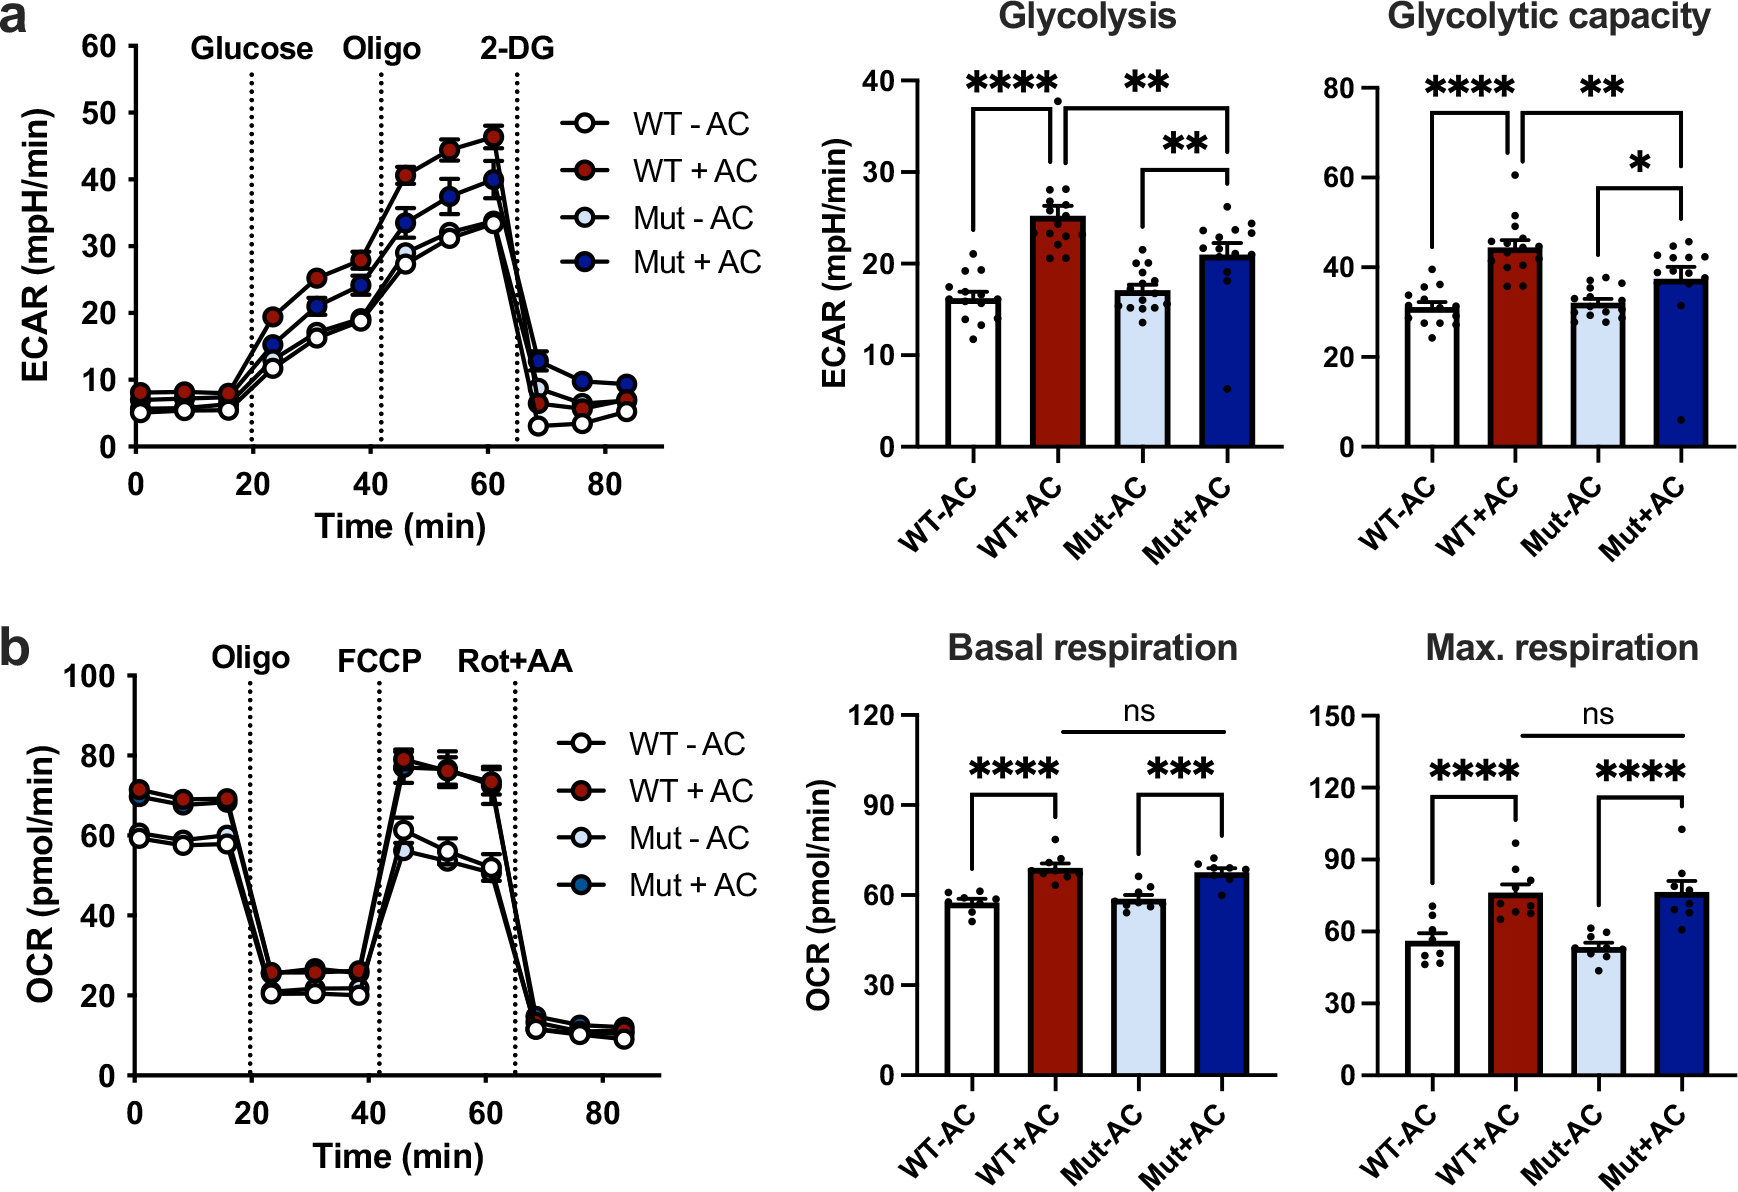
BMDMs from PFKFB2 mutant mice (Mut) and wild-type littermates (WT) were incubated without or with apoptotic Jurkat cells (ACs) for 45 min, followed by rinsing to remove unengulfed ACs, and then subjected to Seahorse analysis 1 h later. a, The extracellular acidification rate (ECAR), a measure of glycolysis, was measured at baseline and after the addition of glucose (‘glycolysis’), oligomycin (‘glycolytic capacity’), and 2-DG (n = 8–9 wells/group). **P = 0.0028 (WT+AC vs. Mut+AC), **P = 0.0070 (Mut-AC vs. Mut+AC), ****P < 0.0001 for glycolysis, *P = 0.031, **P = 0.0057, ****P < 0.0001 for glycolytic capacity. b, The oxygen consumption rate (OCR), a measure of oxidative phosphorylation, was measured at baseline (‘basal respiration’) and after the addition of oligomycin, FCCP (‘maximal respiration), and rotenone plus antimycin A (n = 8–9 wells/group). ***P = 0.0001, ****P < 0.0001. All values are means ± SEM, and significance was determined by two-way ANOVA with Fisher’s LSD post hoc analysis. ns, not significant (P > 0.05).
Extended Data Fig. 8 |. Immunoblotting for MerTK and LRP1, validation of siRNA silencing efficiency, and experiments with siSlc16a1.
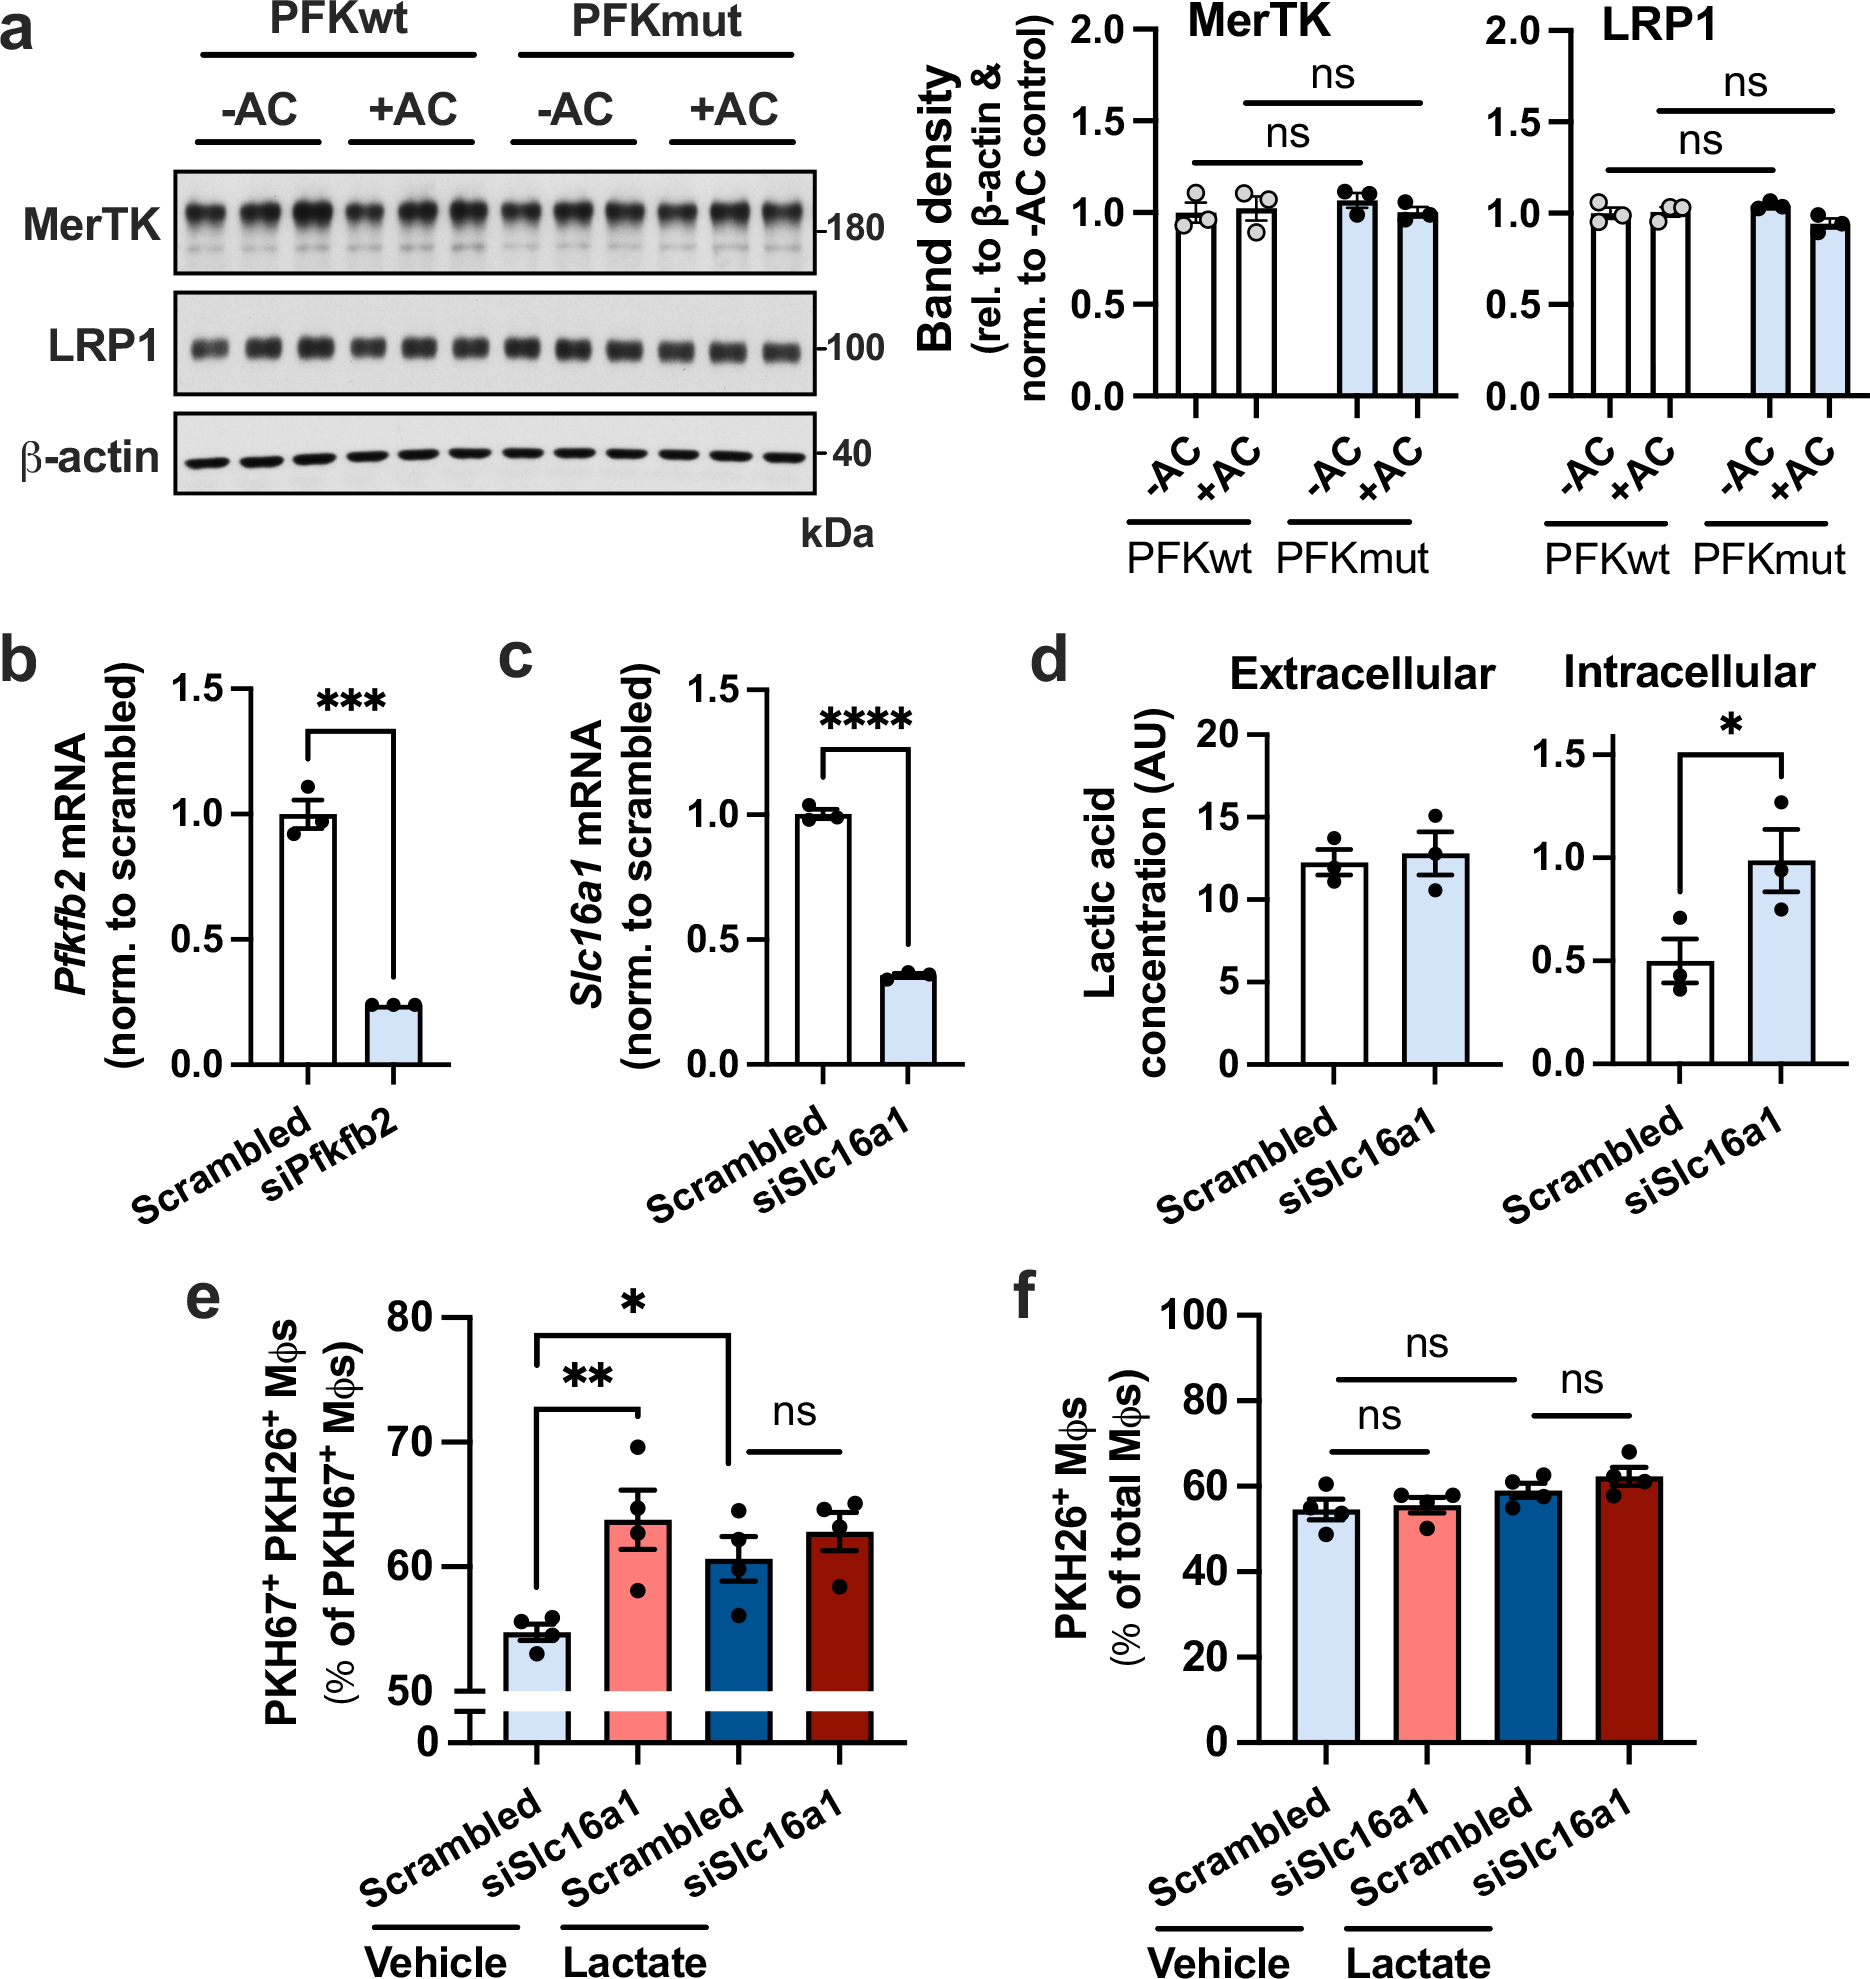
a, BMDMs from PFKFB2 mutant mice and wild-type littermates were incubated without or with apoptotic Jurkat cells (ACs) for 45 min, rinsed, and harvested 2 h later for immunoblotting of MerTK, LRP1 and β-actin. The relative level of MerTK/LRP1 vs. β-actin was quantified by band densitometry (n = 3 samples/group). b, BMDMs were transfected with scrambled RNA or siPfkfb2, and Pfkfb2 gene expression was measured by RT-qPCR (n = 3 wells/group). ***P = 0.0002. c, BMDMs were transfected with scrambled RNA or siSlc16a1, and Slc16a1 expression was measured (n = 3 wells/group). ****P < 0.0001 d, BMDMs transfected with scrambled RNA or siSlc16a1 were incubated with ACs for 45 min, rinsed and 1 h later harvested for lactate measurement in the media (extracellular) and the cells (intracellular) (n = 3 wells/group). *P = 0.029. e,f, A continual efferocytosis assay (f) and single efferocytosis assay (g), as described in the legend of Extended Data Fig. 6, were performed in macrophages treated with scrambled RNA or siSlc16a1 and incubated with vehicle or lactate (10 mM) before adding the first or second round of ACs, respectively (n = 4 wells/group). *P = 0.031, **P = 0.0028. All values are means ± SEM, and significance was determined by two-way ANOVA with Fisher’s LSD post hoc analysis (a, e-f) or the one- or two-tailed Student’s t-test (b-d). ns, not significant (P > 0.05).
Extended Data Fig. 9 |. Additional analyses and representative images of the dexamethasone-thymus experiment.
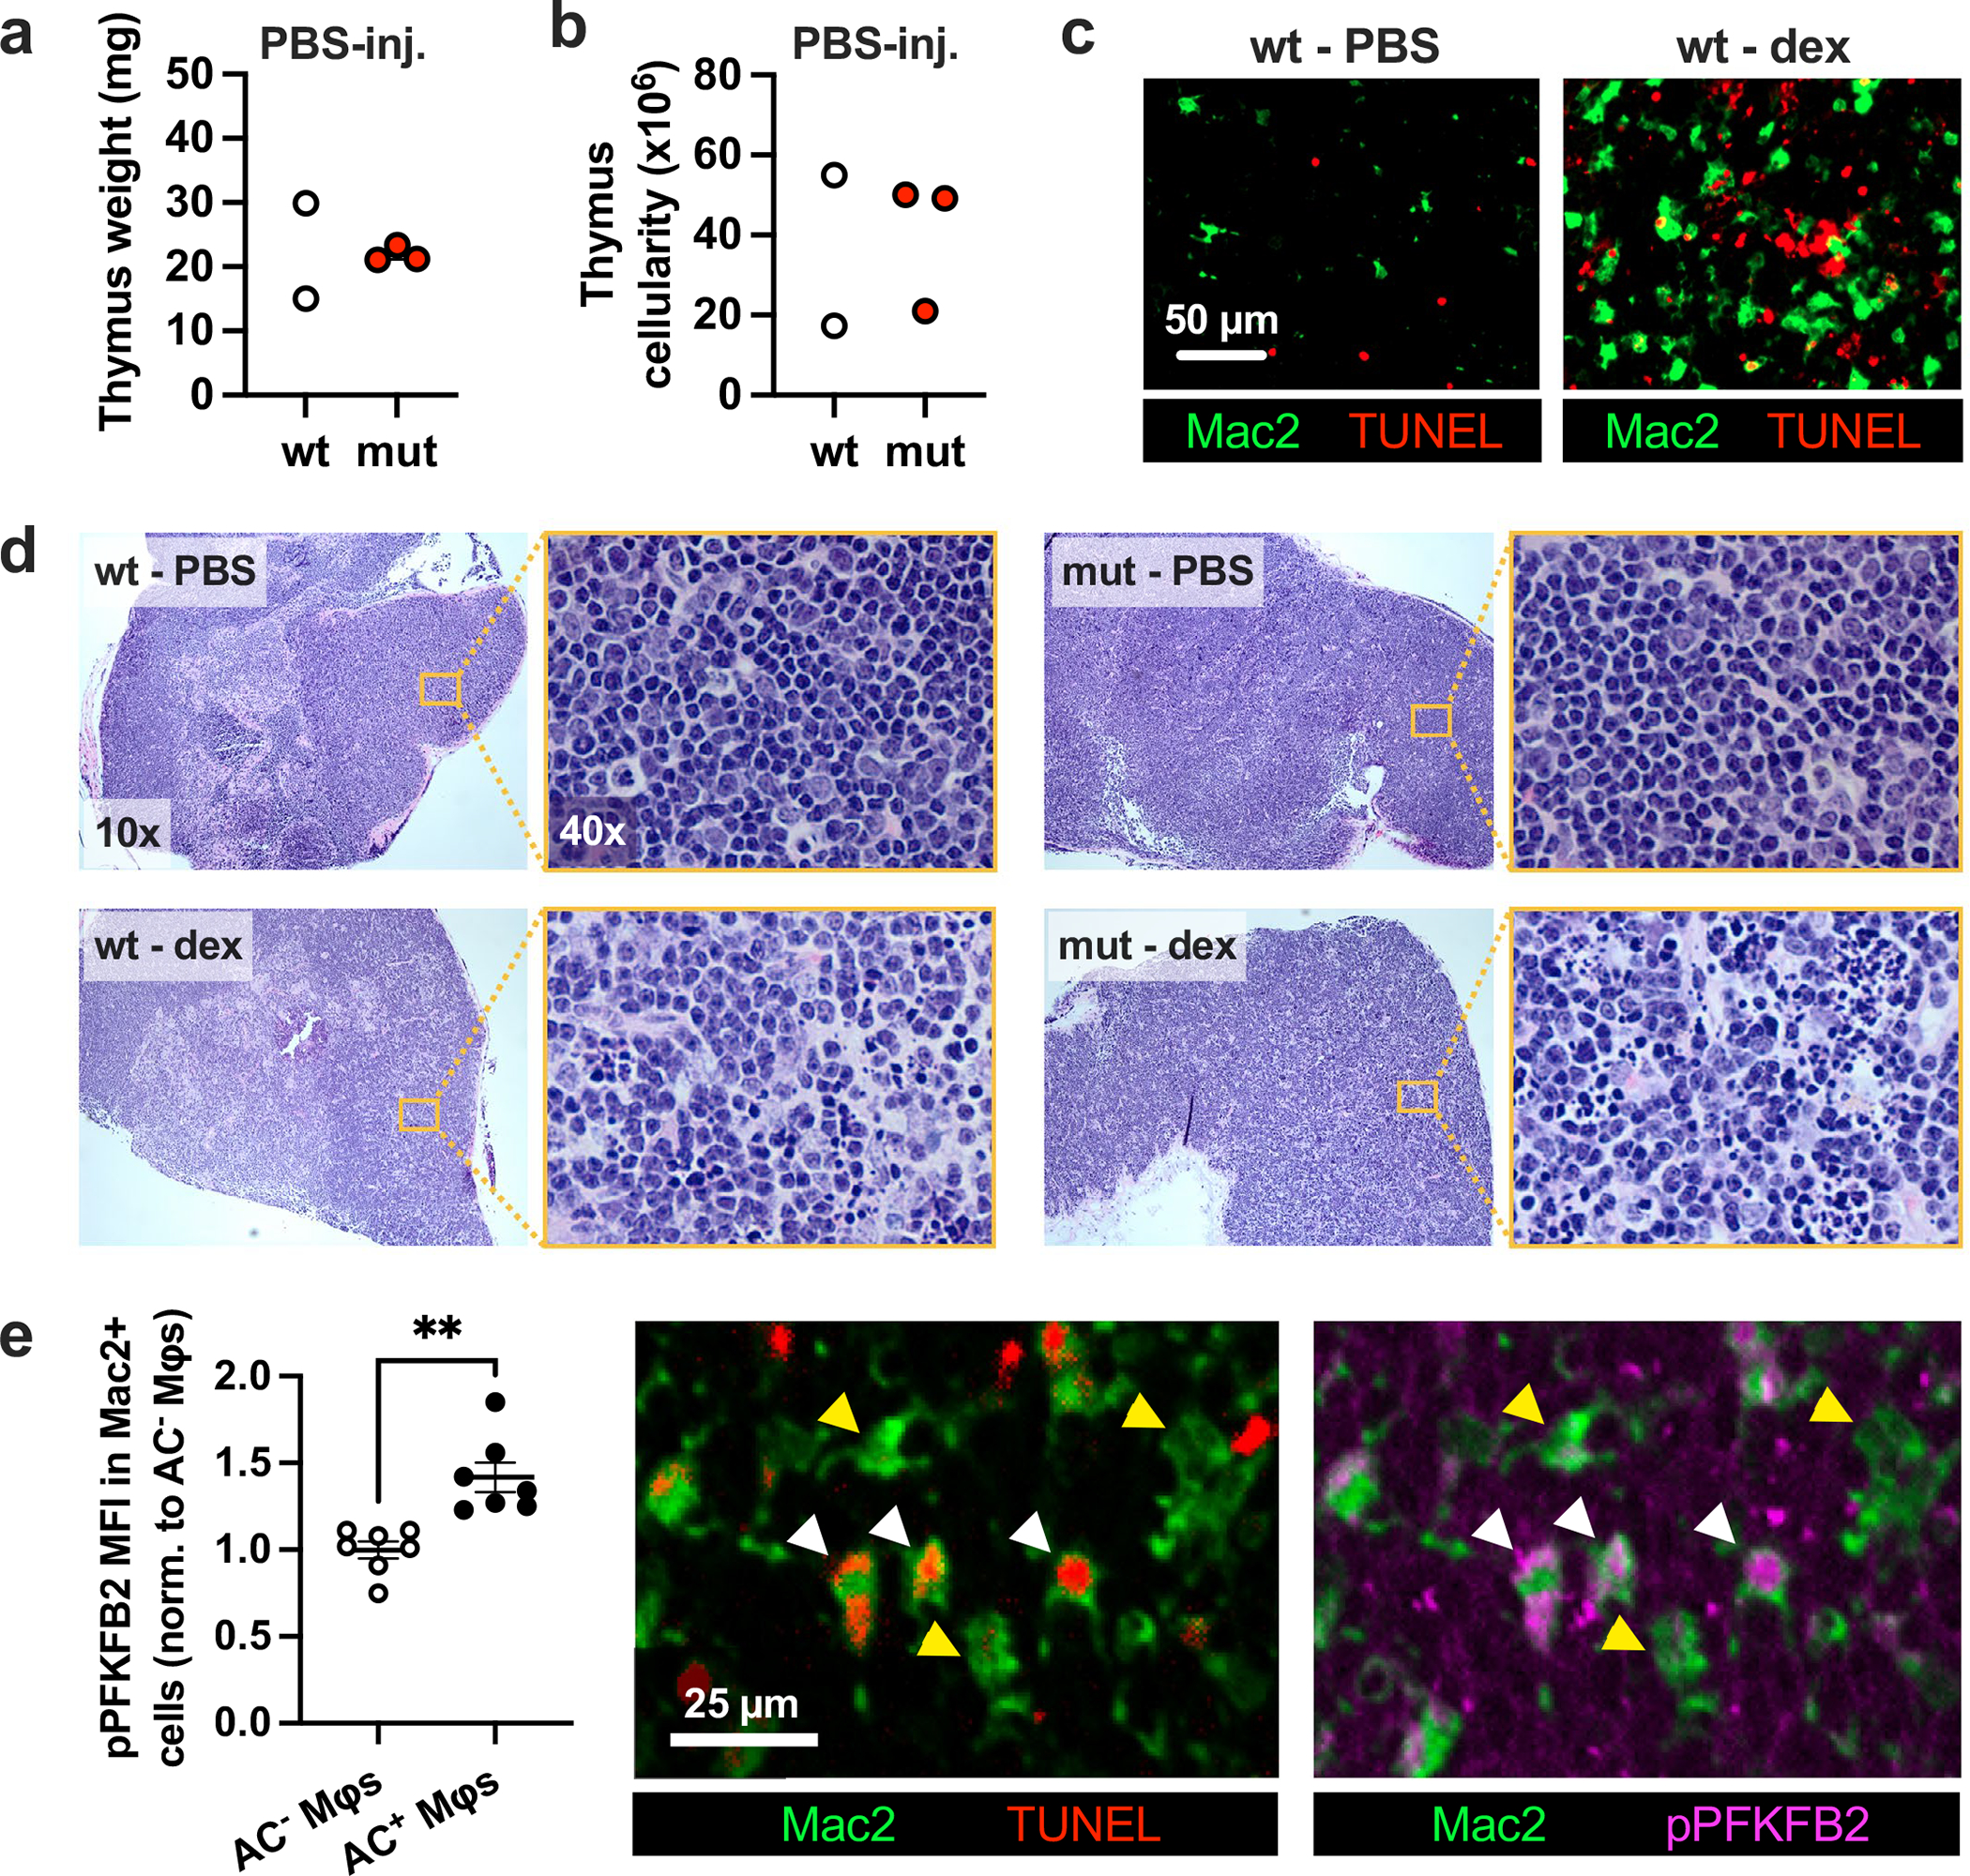
a, Thymus weight and b, cellularity of PBS-injected hematopoietic wild-type (wt) and PFKFB2 mutant (mut) mice (n = 2–3 mice/group). c, Representative images of thymus sections from PBS-injected (n = 2) and dexamethasone (dex)-injected (n = 7) wild-type mice stained for Mac2 (macrophages) and TUNEL (apoptotic cells). d, Representative images of H&E-stained thymus sections of hematopoietic wild-type and PFKFB2 mutant mice at 10x magnification, and from the thymic cortex at 40x magnification, as indicated by the magnified inset (n = 2–3 mice in the PBS-injected groups, n=7 mice in the dex-injected groups). e, The mean fluorescent intensity (MFI) of phospho-PFKFB2 was measured in Mac2+ AC− (yellow arrowheads) and Mac2+ AC+ (that is, TUNEL+; white arrowheads) macrophages in the thymus of dex-injected wt mice by IFM (n = 7 mice/group). **P = 0.0011. All values are means ± SEM, and significance determined by the two-tailed Student’s t-test.
Extended Data Fig. 10 |. Flow cytometric analysis of apoptotic thymocytes from the dexamethasone-thymus experiment.

All cells were isolated from the thymi of hematopoietic PFKFB2 mutant and wild-type mice of the dexamethasone-thymus experiment (see Fig. 5 of the main manuscript) and subjected to flow cytometric analysis. The cells were immunostained for the apoptotic cell marker annexin V (AnnV; FITC) and, using the depicted gating strategy, quantified for the percentages of AnnV− (live) and AnnV+ (apoptotic) thymocytes.
Supplementary Material
Acknowledgements
This work was supported by an American Heart Association Postdoctoral Fellowship (900337; to M. S.); the Niels Stensen Fellowship (to M. S.) and NIH/NHLBI grants R35-HL145228 and P01-HL087123 (to I. T.). We thank H.-W. Snoeck for facilitating the Seahorse-based bioenergetic analyses, A. Yurdagul Jr (LSUHSC-Shreveport) for being a valuable advisor and consultant, and T. McGraw (Weill-Cornell Medical College) and N. Wu (Van Andel Institute) for helpful discussions related to TXNIP. We thank T. Swayne for assistance with confocal microscopy, which was conducted using the Confocal and Specialized Microscopy Shared Resource of the Herbert Irving Comprehensive Cancer Center at Columbia University, supported by NIH grant P30CA013696. We thank C. Lu at the Columbia Center for Translational Immunology (CCTI) for assistance with flow cytometry experiments, which were conducted using the Herbert Irving Comprehensive Cancer Center Flow Cytometry Shared Resources funded in part through Center Grant P30CA013696. LC–MS/MS analysis of fructose-1,6-bisphosphate was conducted at the Albert Einstein College of Medicine Stable Isotope and Metabolomics Core, with the helpful advice of the Core’s director, I. Kirkland.
Footnotes
Competing interests
The authors declare no competing interests.
Reporting summary
Further information on research design is available in the Nature Portfolio Reporting Summary linked to this article.
Extended data is available for this paper at https://doi.org/10.1038/s42255-023-00736-8.
Supplementary information The online version contains supplementary material available at https://doi.org/10.1038/s42255-023-00736-8.
Peer review information Nature Metabolism thanks Vishwa Dixit and the other, anonymous, reviewer(s) for their contribution to the peer review of this work. Primary handling editor: Alfredo Giménez-Cassina, in collaboration with the Nature Metabolism team
Reprints and permissions information is available at www.nature.com/reprints.
Data availability
All data supporting the present study are available within the manuscript and supplementary information files. Source data are provided within this paper. Source data are provided with this paper.
References
- 1.Raymond MH et al. Live cell tracking of macrophage efferocytosis during Drosophila embryo development in vivo. Science 375, 1182–1187 (2022). [DOI] [PMC free article] [PubMed] [Google Scholar]
- 2.Morioka S, Maueröder C & Ravichandran KS Living on the edge: efferocytosis at the interface of homeostasis and pathology. Immunity 50, 1149–1162 (2019). [DOI] [PMC free article] [PubMed] [Google Scholar]
- 3.Doran AC, Yurdagul A Jr. & Tabas I Efferocytosis in health and disease. Nat. Rev. Immunol. 20, 254–267 (2020). [DOI] [PMC free article] [PubMed] [Google Scholar]
- 4.Vandivier RW, Henson PM & Douglas IS Burying the dead: the impact of failed apoptotic cell removal (efferocytosis) on chronic inflammatory lung disease. Chest 129, 1673–1682 (2006). [DOI] [PubMed] [Google Scholar]
- 5.Yurdagul A Jr., Doran AC, Cai B, Fredman G & Tabas IA Mechanisms and consequences of defective efferocytosis in atherosclerosis. Front. Cardiovasc. Med. 4, 86 (2017). [DOI] [PMC free article] [PubMed] [Google Scholar]
- 6.Wu Y, Singh S, Georgescu MM & Birge RB A role for Mer tyrosine kinase in alphavbeta5 integrin-mediated phagocytosis of apoptotic cells. J. Cell Sci. 118, 539–553 (2005). [DOI] [PubMed] [Google Scholar]
- 7.Gardai SJ et al. Cell-surface calreticulin initiates clearance of viable or apoptotic cells through trans-activation of LRP on the phagocyte. Cell 123, 321–334 (2005). [DOI] [PubMed] [Google Scholar]
- 8.Lemke G & Burstyn-Cohen T TAM receptors and the clearance of apoptotic cells. Ann. NY Acad. Sci. 1209, 23–29 (2010). [DOI] [PMC free article] [PubMed] [Google Scholar]
- 9.Yurdagul A Jr. et al. Macrophage metabolism of apoptotic cell-derived arginine promotes continual efferocytosis and resolution of injury. Cell Metab. 31, 518–533 (2020). [DOI] [PMC free article] [PubMed] [Google Scholar]
- 10.Mehrotra P & Ravichandran KS Drugging the efferocytosis process: concepts and opportunities. Nat. Rev. Drug Discov. 21, 601–620 (2022). [DOI] [PMC free article] [PubMed] [Google Scholar]
- 11.Park D et al. Continued clearance of apoptotic cells critically depends on the phagocyte Ucp2 protein. Nature 477, 220–224 (2011). [DOI] [PMC free article] [PubMed] [Google Scholar]
- 12.Wang Y et al. Mitochondrial fission promotes the continued clearance of apoptotic cells by macrophages. Cell 171, 331–345 (2017). [DOI] [PMC free article] [PubMed] [Google Scholar]
- 13.Morioka S et al. Efferocytosis induces a novel SLC program to promote glucose uptake and lactate release. Nature 563, 714–718 (2018). [DOI] [PMC free article] [PubMed] [Google Scholar]
- 14.Liu Y et al. Metabolic reprogramming in macrophage responses. Biomark. Res. 9, 1 (2021). [DOI] [PMC free article] [PubMed] [Google Scholar]
- 15.Viola A, Munari F, Sánchez-Rodríguez R, Scolaro T & Castegna A The metabolic signature of macrophage responses. Front. Immunol. 10, 1462 (2019). [DOI] [PMC free article] [PubMed] [Google Scholar]
- 16.Freemerman AJ et al. Myeloid Slc2a1-deficient murine model revealed macrophage activation and metabolic phenotype are fueled by GLUT1. J. Immunol. 202, 1265–1286 (2019). [DOI] [PMC free article] [PubMed] [Google Scholar]
- 17.Nishizawa T et al. Testing the role of myeloid cell glucose flux in inflammation and atherosclerosis. Cell Rep. 7, 356–365 (2014). [DOI] [PMC free article] [PubMed] [Google Scholar]
- 18.Wu N et al. AMPK-dependent degradation of TXNIP upon energy stress leads to enhanced glucose uptake via GLUT1. Mol. Cell 49, 1167–1175 (2013). [DOI] [PMC free article] [PubMed] [Google Scholar]
- 19.Waldhart AN et al. Phosphorylation of TXNIP by AKT mediates acute influx of glucose in response to insulin. Cell Rep. 19, 2005–2013 (2017). [DOI] [PMC free article] [PubMed] [Google Scholar]
- 20.Gerlach BD et al. Efferocytosis induces macrophage proliferation to help resolve tissue injury. Cell Metab. 33, 2445–2463 (2021). [DOI] [PMC free article] [PubMed] [Google Scholar]
- 21.Nishi C, Yanagihashi Y, Segawa K & Nagata S MERTK tyrosine kinase receptor together with TIM4 phosphatidylserine receptor mediates distinct signal transduction pathways for efferocytosis and cell proliferation. J. Biol. Chem. 294, 7221–7230 (2019). [DOI] [PMC free article] [PubMed] [Google Scholar]
- 22.Yancey PG et al. Macrophage LRP-1 controls plaque cellularity by regulating efferocytosis and Akt activation. Arterioscler. Thromb. Vasc. Biol. 30, 787–795 (2010). [DOI] [PMC free article] [PubMed] [Google Scholar]
- 23.Mor I, Cheung EC & Vousden KH Control of glycolysis through regulation of PFK1: old friends and recent additions. Cold Spring Harb. Symp. Quant. Biol. 76, 211–216 (2011). [DOI] [PubMed] [Google Scholar]
- 24.Novellasdemunt L et al. Akt-dependent activation of the heart 6-phosphofructo-2-kinase/fructose-2,6-bisphosphatase (PFKFB2) isoenzyme by amino acids. J. Biol. Chem. 288, 10640–10651 (2013). [DOI] [PMC free article] [PubMed] [Google Scholar]
- 25.Deprez J, Vertommen D, Alessi DR, Hue L & Rider MH Phosphorylation and activation of heart 6-phosphofructo2-kinase by protein kinase B and other protein kinases of the insulin signaling cascades. J. Biol. Chem. 272, 17269–17275 (1997). [DOI] [PubMed] [Google Scholar]
- 26.Rossi DC et al. A metabolic inhibitor arms macrophages to kill intracellular fungal pathogens by manipulating zinc homeostasis. J. Clin. Invest. 131, e147268 (2021). [DOI] [PMC free article] [PubMed] [Google Scholar]
- 27.Finucane OM, Sugrue J, Rubio-Araiz A, Guillot-Sestier MV & Lynch MA The NLRP3 inflammasome modulates glycolysis by increasing PFKFB3 in an IL-1β-dependent manner in macrophages. Sci. Rep. 9, 4034 (2019). [DOI] [PMC free article] [PubMed] [Google Scholar]
- 28.Jiang H et al. PFKFB3-driven macrophage glycolytic metabolism is a crucial component of innate antiviral defense. J. Immunol. 197, 2880–2890 (2016). [DOI] [PubMed] [Google Scholar]
- 29.Tawakol A et al. HIF-1α and PFKFB3 mediate a tight relationship between proinflammatory activation and anerobic metabolism in atherosclerotic macrophages. Arterioscler. Thromb. Vasc. Biol. 35, 1463–1471 (2015). [DOI] [PMC free article] [PubMed] [Google Scholar]
- 30.Thorp E, Cui D, Schrijvers DM, Kuriakose G & Tabas I Mertk receptor mutation reduces efferocytosis efficiency and promotes apoptotic cell accumulation and plaque necrosis in atherosclerotic lesions of Apoe−/− mice. Arterioscler. Thromb. Vasc. Biol. 28, 1421–1428 (2008). [DOI] [PMC free article] [PubMed] [Google Scholar]
- 31.Lee M et al. Mutation of regulatory phosphorylation sites in PFKFB2 worsens renal fibrosis. Sci. Rep. 10, 14531 (2020). [DOI] [PMC free article] [PubMed] [Google Scholar]
- 32.Gronski MA, Kinchen JM, Juncadella IJ, Franc NC & Ravichandran KS An essential role for calcium flux in phagocytes for apoptotic cell engulfment and the anti-inflammatory response. Cell Death Differ. 16, 1323–1331 (2009). [DOI] [PMC free article] [PubMed] [Google Scholar]
- 33.Kasikara C et al. Deficiency of macrophage PHACTR1 impairs efferocytosis and promotes atherosclerotic plaque necrosis. J. Clin. Invest 131, e145275 (2021). [DOI] [PMC free article] [PubMed] [Google Scholar]
- 34.Ampomah PB et al. Macrophages use apoptotic cell-derived methionine and DNMT3A during efferocytosis to promote tissue resolution. Nat. Metab. 4, 444–457 (2022). [DOI] [PMC free article] [PubMed] [Google Scholar]
- 35.Scott RS et al. Phagocytosis and clearance of apoptotic cells is mediated by MER. Nature 411, 207–211 (2001). [DOI] [PubMed] [Google Scholar]
- 36.Mills EL et al. Succinate dehydrogenase supports metabolic repurposing of mitochondria to drive inflammatory macrophages. Cell 167, 457–470 (2016). [DOI] [PMC free article] [PubMed] [Google Scholar]
- 37.Murphy MP & O’Neill LAJ Krebs cycle reimagined: the emerging roles of succinate and itaconate as signal transducers. Cell 174, 780–784 (2018). [DOI] [PubMed] [Google Scholar]
- 38.Tannahill GM et al. Succinate is an inflammatory signal that induces IL-1β through HIF-1α. Nature 496, 238–242 (2013). [DOI] [PMC free article] [PubMed] [Google Scholar]
- 39.Nakayama Y, Mukai N, Kreitzer G, Patwari P & Yoshioka J Interaction of ARRDC4 with GLUT1 mediates metabolic stress in the ischemic heart. Circ. Res. 131, 510–527 (2022). [DOI] [PMC free article] [PubMed] [Google Scholar]
- 40.Freemerman AJ et al. Metabolic reprogramming of macrophages: glucose transporter 1 (GLUT1)-mediated glucose metabolism drives a proinflammatory phenotype. J. Biol. Chem. 289, 7884–7896 (2014). [DOI] [PMC free article] [PubMed] [Google Scholar]
- 41.Kumagai S et al. Lactic acid promotes PD-1 expression in regulatory T cells in highly glycolytic tumor microenvironments. Cancer Cell 40, 201–218 (2022). [DOI] [PubMed] [Google Scholar]
- 42.Choi SY, Collins CC, Gout PW & Wang Y Cancer-generated lactic acid: a regulatory, immunosuppressive metabolite? J. Pathol. 230, 350–355 (2013). [DOI] [PMC free article] [PubMed] [Google Scholar]
- 43.Colegio OR et al. Functional polarization of tumour-associated macrophages by tumour-derived lactic acid. Nature 513, 559–563 (2014). [DOI] [PMC free article] [PubMed] [Google Scholar]
- 44.Wang T et al. HIF1α-induced glycolysis metabolism Is essential to the activation of inflammatory macrophages. Mediators Inflamm. 2017, 9029327 (2017). [DOI] [PMC free article] [PubMed] [Google Scholar]
- 45.Luo W et al. Pyruvate kinase M2 is a PHD3-stimulated coactivator for hypoxia-inducible factor 1. Cell 145, 732–744 (2011). [DOI] [PMC free article] [PubMed] [Google Scholar]
- 46.Palsson-McDermott EM et al. Pyruvate kinase M2 regulates Hif-1α activity and IL-1β induction and is a critical determinant of the warburg effect in LPS-activated macrophages. Cell Metab. 21, 65–80 (2015). [DOI] [PMC free article] [PubMed] [Google Scholar]
- 47.Van den Bossche J, O’Neill LA & Menon D Macrophage immunometabolism: where are we (going)? Trends Immunol. 38, 395–406 (2017). [DOI] [PubMed] [Google Scholar]
- 48.O’Neill LA A broken krebs cycle in macrophages. Immunity 42, 393–394 (2015). [DOI] [PubMed] [Google Scholar]
- 49.Van den Bossche J et al. Mitochondrial dysfunction prevents repolarization of inflammatory macrophages. Cell Rep. 17, 684–696 (2016). [DOI] [PubMed] [Google Scholar]
- 50.Crochet RB et al. Crystal structure of heart 6-phosphofructo-2-kinase/fructose-2,6-bisphosphatase (PFKFB2) and the inhibitory influence of citrate on substrate binding. Proteins 85, 117–124 (2017). [DOI] [PMC free article] [PubMed] [Google Scholar]
- 51.May P, Bock HH & Nofer JR Low density receptor-related protein 1 (LRP1) promotes anti-inflammatory phenotype in murine macrophages. Cell Tissue Res. 354, 887–889 (2013). [DOI] [PubMed] [Google Scholar]
- 52.Doddapattar P et al. Myeloid cell PKM2 deletion enhances efferocytosis and reduces atherosclerosis. Circ. Res. 130, 1289–1305 (2022). [DOI] [PMC free article] [PubMed] [Google Scholar]
- 53.Gorovoy M, Gaultier A, Campana WM, Firestein GS & Gonias SL Inflammatory mediators promote production of shed LRP1/CD91, which regulates cell signaling and cytokine expression by macrophages. J. Leukoc. Biol. 88, 769–778 (2010). [DOI] [PMC free article] [PubMed] [Google Scholar]
- 54.Freire-de-Lima CG et al. Apoptotic cells, through transforming growth factor-beta, coordinately induce anti-inflammatory and suppress pro-inflammatory eicosanoid and NO synthesis in murine macrophages. J. Biol. Chem. 281, 38376–38384 (2006). [DOI] [PubMed] [Google Scholar]
- 55.Dalli J et al. Annexin A1 regulates neutrophil clearance by macrophages in the mouse bone marrow. FASEB J. 26, 387–396 (2012). [DOI] [PMC free article] [PubMed] [Google Scholar]
- 56.Matsuura Y et al. Diabetes suppresses glucose uptake and glycolysis in macrophages. Circ. Res. 130, 779–781 (2022). [DOI] [PMC free article] [PubMed] [Google Scholar]
- 57.Qu J, Yang J, Chen M, Wei R & Tian J CircFLNA acts as a sponge of miR-646 to facilitate the proliferation, metastasis, glycolysis, and apoptosis inhibition of gastric cancer by targeting PFKFB2. Cancer Manag. Res. 12, 8093–8103 (2020). [DOI] [PMC free article] [PubMed] [Google Scholar]
Associated Data
This section collects any data citations, data availability statements, or supplementary materials included in this article.
Supplementary Materials
Data Availability Statement
All data supporting the present study are available within the manuscript and supplementary information files. Source data are provided within this paper. Source data are provided with this paper.


