

Abstract
Background/objective:
Maternal paraben exposure and diet quality are both independently associated with birth outcomes, but whether these interact is unknown. We assessed sex-specific associations of parabens with birth outcomes and differences by maternal diet quality.
Methods:
Illinois pregnant women (n=458) provided five first-morning urines collected at 8–40 weeks gestation, which we pooled for quantification of ethylparaben, methylparaben, and propylparaben concentrations. We collected/measured gestational age at delivery, birth weight, body length, and head circumference within 24 hours of birth, and calculated sex-specific birth weight-for-gestational-age z-scores and weight/length ratio. Women completed three-month food frequency questionnaires in early and mid-to-late pregnancy, which we used to calculate the Alternative Healthy Eating Index (AHEI)-2010. Linear regression models evaluated sex-specific associations of parabens with birth outcomes, and differences in associations by average pregnancy AHEI-2010.
Results:
In this predominately non-Hispanic white, college-educated sample, maternal urinary paraben concentrations were modestly inversely associated with head circumference and gestational length. However, methylparaben and propylparaben were inversely associated with birth weight, birth weight z-scores, body length, and weight/length ratio in female, but not male newborns. For example, each 2-fold increase in methylparaben concentrations was associated with −46.5 g (95% CI: −74.6, −18.3) lower birth weight, −0.10 (95% CI: −0.16, −0.03) lower birth weight z-scores, −0.20 cm (95% CI: −0.33, −0.07) shorter body length, and −0.6 g/cm (95% CI: −1.1, −0.2) smaller weight/length ratio in females. These inverse associations were more prominent in females of mothers with poorer diets (AHEI-2010 < median), but attenuated in those with healthier diets (AHEI-2010 ≥ median). In newborn males of mothers with healthier diets, moderate inverse associations emerged for propylparaben with gestational length and head circumference.
Conclusions:
Maternal diet may moderate associations of parabens with birth size in a sex-specific manner. Additional studies may consider corroborating these findings in other populations.
Keywords: Parabens, birth size, gestational length, head circumference, newborn sex, maternal diet
1. INTRODUCTION
A newborn’s gestational age at birth, birth size (weight and length), and head circumference are known predictors of neonatal morbidity and mortality (Manuck et al., 2016), and are associated with maternal and child lifelong health. Babies born pre-term (birth before 37 weeks gestation) and early-term (birth after 37 weeks, but before 39 weeks gestation) have higher risks of developing metabolic disorders, respiratory issues, and cognitive problems compared to full-term infants (birth after 39 weeks, but before 41 weeks) (Espel et al., 2014; Markopoulou et al., 2019; Spong, 2013; Tita et al., 2009). Similarly, late-term birth (birth after 41 weeks gestation) is associated with higher risk of delivery complications for both mother and newborn, as well as childhood and adulthood obesity (Mitchell et al., 2017; Palatianou et al., 2014; Zhao et al., 2012). After accounting for gestational age at birth, smaller body size at birth also predicts child cognitive problems and other adverse developmental outcomes that may persist through adolescence (Hack et al., 1995). Similarly, larger birth size is associated with long-term cardiometabolic consequences for children, including increased risk of type 2 diabetes and obesity (Palatianou et al., 2014), but also with delivery complications that can adversely impact both mother and newborn (Bjorstad et al., 2010). Finally, head circumference measured at birth has been shown to be a clinical indicator of newborn brain volume (Lindley et al., 1999), though the consequences of this are not fully understood. Therefore, it is important to understand risk factors in pregnancy that influence a baby’s gestational age at birth, birth size, and head circumference.
Greater than 90% of reproductive-aged women in the United States (U.S.) have measurable urinary biomarker concentrations of parabens (alkyl esters of p-hydroxybenzoic acid) (Mortensen et al., 2014). Parabens are anti-microbial agents found in many personal care products and cosmetics, as well as some food products and medications (Program, 2017). Studies in cells, animal models, and pregnant populations suggest that parabens target inflammatory (Aung et al., 2019a; Bairati et al., 1994; Bereketoglu and Pradhan, 2019; Guzel Bayulken and Ayaz Tuylu, 2019; Watkins et al., 2015), hormonal (Ahn et al., 2012; Aker et al., 2018; Aker et al., 2016; Kolatorova et al., 2018; Lee et al., 2017), and metabolic (Elmore et al., 2020; Hu et al., 2013; Quiros-Alcala et al., 2018) pathways, which are important pathways for fetal growth. Additionally, observational studies have detected parabens in cord blood (Towers et al., 2015), amniotic fluid (Philippat et al., 2013), and placental tissue (Valle-Sistac et al., 2016), suggesting that parabens can cross the placenta. Consequently, some studies evaluating associations of parabens with gestational length, birth size, and head circumference observed that parabens are associated with unfavorable birth outcomes (Agier et al., 2020; Aung et al., 2019b; Chang et al., 2019; Hajizadeh et al., 2021; Mustieles et al., 2020; Wu et al., 2019). However, a 2019 systematic review qualitatively summarized six previous studies evaluating associations of paraben biomarkers with birth weight, length, and head circumference, and concluded that the strength and direction of associations are inconsistent across studies (Jamal et al., 2019). Similarly, a 2020 meta-analysis pooled six to eight studies (depending on the paraben) evaluating associations of paraben biomarkers with birth weight, but observed no significant pooled associations for any paraben biomarker (Zhong et al., 2020). More recently, several studies suggest that associations of parabens with birth size may be sex-specific (Agier et al., 2020; Chang et al., 2019; Hajizadeh et al., 2021; Jamal et al., 2020; Rodríguez-Carmona et al., 2020; Vrijens et al., 2020), though results from these studies have also been inconsistent. Therefore, further research can help clarify sex-specific associations of parabens with birth outcomes.
Appropriate maternal diet is critical for optimal fetal growth and development, whereas poor maternal diet quality is associated with adverse birth outcomes, including shorter gestational length and smaller birth size (Chen et al., 2021; Chia et al., 2019). Importantly, a growing body of literature suggests that healthy maternal diets may protect the developing fetus from the adverse effects of environmental exposures (Dolinoy et al., 2007; Hertz-Picciotto et al., 2000; Oken et al., 2008). With regards to birth size, some studies observed that adverse associations of maternal exposure to chemicals, including per- and polyfluoroalkyl substances and metals, with birth weight or birth weight-for-gestational age z-scores are attenuated in newborns of mothers with better diets, measured by consumption of select whole foods or specific individual macro- or micronutrients (Gennings et al., 2020; Zhang et al., 2022). Studies suggest both parabens and diet may interact with similar inflammatory and metabolic pathways (Aung et al., 2019a; Lecorguille et al., 2021; Wen et al., 2020), which are important mechanisms involved in regulating gestational length and fetal growth. However, no studies have evaluated diet as a moderator of associations between parabens and birth outcomes. Additionally, most prior studies evaluating diet as a moderator of associations between environmental chemicals and health outcomes only focused on individual nutrients or foods, while few considered assessing dietary patterns or diet quality (Gonzalez-Nahm et al., 2020). Utilizing diet indices that reflect diet quality accounts for the combined effect of many dietary behaviors and the interactive effects of foods and nutrients on health (McCullough et al., 2002). For example, the Alternative Healthy Eating Index 2010 (AHEI-2010) focuses on foods predictive of chronic disease risk, and a higher AHEI-2010 score in pregnancy, specifically, has been associated with improved maternal and offspring outcomes (Li et al., 2021; Mahmassani et al., 2021; Reyes-Lopez et al., 2021; Yisahak et al., 2021). Additionally, higher AHEI-2010 scores are correlated with lower inflammation (Wirth et al., 2016). Therefore, it may be important to consider holistic dietary patterns when evaluating whether diet can attenuate the negative impacts of environmental toxicant exposures, especially exposures to parabens.
Given the current status of the literature, our first objective was to evaluate sex-specific associations of maternal urinary paraben concentrations with gestational length, birth size (birth weight, birth weight z-scores, body length, and weight/length ratio), and head circumference. Our second objective was to determine if sex-specific associations of paraben biomarkers with birth outcomes differ by maternal diet quality, which we evaluated using the AHEI-2010.
2. MATERIALS AND METHODS
2.1. Illinois Kids Development Study (I-KIDS) recruitment and enrollment
The current study includes pregnant women from I-KIDS, an ongoing prospective pregnancy/birth cohort designed to evaluate the impacts of prenatal environmental chemical exposures on infant neurodevelopment. I-KIDS recruitment and enrollment have been described elsewhere (Pacyga et al., 2021). Briefly, pregnant women were recruited at their first prenatal care appointment from two local obstetric clinics in Champaign-Urbana, IL. Women were eligible to participate if they were ≥ 10 but < 15 weeks pregnant, 18–40 years old, fluent in English, in a low-risk singleton pregnancy, living within a 30-minute drive of the University of Illinois campus, and not planning to move out of the area before their child’s first birthday. A total of 482 pregnant women enrolled in I-KIDS between 2013 and 2018 and remained in the study through the birth of their infant. We excluded the limited number of women who delivered before 37 weeks gestation, and those who were missing information on important covariates. Therefore, the current analysis includes a total of 458 mothers-newborn pairs (233 females and 225 males). These women provided written informed consent, and the study was approved by the Institutional Review Board at the University of Illinois. The analysis of de-identified specimens at the Centers for Disease Control and Prevention (CDC) laboratory was determined not to constitute engagement in human subjects’ research.
2.2. Collection of maternal sociodemographic, lifestyle, and health information
Immediately after enrollment, study staff visited I-KIDS participants at home to obtain information about their sociodemographic, lifestyle, and health characteristics. We collected information about the following characteristics from an interviewer-administered questionnaire: age, race/ethnicity, pre-pregnancy weight, height, and parity. Self-reported pre-pregnancy weight and height were used to calculate pre-pregnancy BMI (kg/m2) (Bannon et al., 2017; Holland et al., 2013; Natamba et al., 2016). To calculate conception season, we used reported due dates based on the first day of the last menstrual period, which we confirmed after the first trimester ultrasound. To assess early pregnancy depression symptoms, participants also completed an adapted version of the Edinburgh Postnatal Depression Scale (EPDS), which excluded the question “The thought of harming myself has occurred to me” (Cox et al., 1987).
2.3. Assessment of urinary paraben biomarker concentrations
Women provided at least three and up to five first-morning urine samples at study home visits or routine prenatal care visits at the following gestational timepoints: 8–15, 13–22, 19–28, 25–33, 32–40 weeks gestation (median 13, 17, 23, 28, and 34 weeks gestation, respectively) as described previously (Pacyga et al., 2021). Greater than 95% of women contributed all five urine samples, and the remaining 5% contribute three or four urines. Urine samples were collected in polypropylene urine cups and refrigerated immediately. Within 24 hours of collection, we aliquoted urine samples for long-term storage (at −80 °C) or pooled from each timepoint. To create the pool sample, we added 900 µL of fresh urine from each timepoint to a 5 mL cryovial, and the sample was immediately stored at −80 °C between each gestational timepoint. As a result, after the first visit, we layered fresh urine onto frozen urine from previous gestational timepoints (frozen urine was not thawed). At the end of pregnancy, we thawed, vortexed, and measured specific gravity of pooled samples. We shipped frozen pooled samples on dry ice to the CDC Division of Laboratory Sciences in three batches, in the chronological order of enrollment (batch one enrolled December 2013 - February 2015, batch two enrolled February 2015 - July 2016, and batch three enrolled July 2016 - August 2018). Pooled urine samples were analyzed for urinary concentrations of the following four commonly measured paraben biomarkers: butylparaben, propylparaben, ethylparaben, and methylparaben using automated on-line solid phase extraction-high performance liquid chromatography–isotope dilution tandem mass spectrometry based on previously published methods (Ye et al., 2006a; Ye et al., 2006b). These methods have rigorous quality control/quality assurance protocols and excellent long-term reproducibility, and inter- and intra-day variability were < 9% indicating good precision for all measured paraben concentrations (Ye et al., 2006b). The limits of detection were 0.1 ng/mL for butylparaben and propylparaben and 1.0 ng/mL for ethylparaben and methylparaben.
2.4. Collection of gestational length, birth size, and head circumference measures
Within 24 hours of birth, I-KIDS staff visited participants at the hospital to obtain delivery date, which we used to calculate gestational length, and to conduct newborn anthropometric measurements. Hospital staff measured birth weight (g) immediately after delivery, which we obtained from crib cards. Sex-specific birth weight for gestational age z-scores were calculated using a U.S. population-based reference according to published methods (Talge et al., 2014). I-KIDS staff measured body length (cm; Seca Light & Stable Measuring Board) and head circumference (cm; flexible retractable ruler) in triplicate, and the mean of multiple values was used in statistical analyses. In the few cases where we were unable to measure body length and head circumference at the hospital (n = 28 and 9, respectively), we used body length and head circumference information obtained from hospital crib cards. We calculated newborn weight/length ratio (g/cm) by dividing birth weight by body length.
2.5. Collection of dietary intakes and calculation of Alternative Healthy Eating Index (AHEI-2010)
Participants completed semi-quantitative food frequency questionnaires (FFQs) at 8–15 and 32–40 weeks gestation. This FFQ was adapted for pregnant women from the full length Block-98 FFQ (NutritionQuest, Berkeley, CA) and has been validated in pregnant populations (Bodnar and Siega-Riz, 2002; Laraia et al., 2007). The FFQ asks women to report their diet during the previous three months (Boucher et al., 2006). Therefore, dietary intakes at 8–15 and 32–40 weeks gestation reflect maternal diets in early and mid-to-late pregnancy, respectively. Data on dietary intakes at each timepoint were used to calculate early and mid-to-late pregnancy AHEI-2010, which is an 11 component diet quality measure (scored out of 110) based on foods and nutrients predictive of chronic disease risk and mortality (Chiuve et al., 2012; McCullough et al., 2002). The 11 food or nutrient components (six positive and five negative) include: vegetables, fruit, whole grain, nuts/legumes, omega-3 fatty acids (docosahexaenoic acid and eicosapentaenoic acid), polyunsaturated fatty acids, sugar-sweetened beverages/fruit juice, red/processed meat, trans fat, sodium, and alcohol. Based on recommendations from the American College of Obstetrics and Gynecology that pregnant women should abstain from alcohol during pregnancy (2015), we removed the alcohol component from the total AHEI-2010 score. Therefore, AHEI-2010 in this study is scored out of 100, and higher AHEI-2010 scores reflect better overall diet quality. The AHEI-2010 has been validated in other pregnancy cohorts, reporting that AHEI-2010 is associated with gestational length and various measures of newborn size at birth (Emond et al., 2018; Li et al., 2021; Reyes-Lopez et al., 2021; Yisahak et al., 2021). We used the mean of early and mid-to-late pregnancy AHEI-2010 scores to reflect average pregnancy diet quality as we observed no meaningful differences in associations when considering the two timepoints separately (data not shown).
2.6. Statistical Analysis
We used instrumental reading values for non-zero paraben biomarker concentrations below the LOD to avoid bias associated with imputing values for non-detectable concentrations (Succop et al., 2004). To account for urine dilution, we used the following formula to adjust all urinary paraben biomarker concentrations: Pc = P[(1.016 − 1)/(SG − 1)], where Pc is the specific gravity-adjusted paraben biomarker concentration, P is the measured paraben concentration (ng/mL), 1.016 is the sample median specific gravity, and SG is the specific gravity of each woman’s pooled urine sample (Meeker et al., 2009). We evaluated ethylparaben, methylparaben, and propylparaben as continuous variables that were ln-transformed. Six women had ethylparaben concentrations of zero, so we added a constant (1.0) before ln-transformation to avoid undefined estimates (Weiss et al., 2015). Due to the narrow distribution of urinary butylparaben concentrations that centered around the LOD (Table 2), and because only 44% of women had butylparaben concentrations above the LOD, we excluded butylparaben from further analyses.
Table 2.
Urinary paraben biomarker concentrations.
| I-KIDS 2013–2018 | NHANES 2013–2016 | ||
|---|---|---|---|
| Detectable | Overall sample (n=458) | Women 18 – 40 years old (n=742) | |
| Biomarker | % ≥ LOD | Median (25th, 75th percentile) | Median (25th, 75th percentile) |
| Butylparaben | 43.9 | 0.1 (<LOD, 0.3) | 0.1 (0.1, 0.5) |
| Propylparaben | 99.8 | 8.3 (2.2, 28.1) | 15.4 (2.8, 68.7) |
| Ethylparaben | 55.2 | 1.3 (<LOD, 7.5) | 2.2 (0.7, 13.9) |
| Methylparaben | 100.0 | 49.6 (18.2, 134.4) | 86.2 (18.9, 263.7) |
All reported concentrations in ng/mL are not corrected for specific gravity (I-KIDS) or creatinine (NHANES). I-KIDS, Illinois Kids Development Study; LOD, limit of detection; NHANES, National Health and Nutrition Examination Survey. LOD, Limit of detection (0.1 ng/mL for butylparaben and propylparaben, 1.0 ng/mL for ethylparaben and methylparaben).
We presented maternal characteristics by newborn sex and maternal average pregnancy diet quality as n (%) or median (range). Paraben biomarker concentrations from I-KIDS and the National Health and Nutrition Examination Survey (NHANES) cycles 2013–2016 are presented as the median (25th, 75th percentiles) (NHANES, 2013–2014; NHANES, 2015–2016) – for comparability, these concentrations were not adjusted for urine dilution. Birth outcomes are reported as the median (25th, 75th percentiles) by newborn sex and maternal diet quality. We tested for statistical differences in maternal characteristics and birth outcomes by newborn sex and diet quality using chi-squared or Fisher’s exact test for categorical variables and Kruskal-Wallis test for continuous variables.
We used linear regression models that included a multiplicative interaction between paraben biomarkers and newborn sex to evaluate sex-specific associations of maternal urinary paraben concentrations with continuous gestational length, birth size, and head circumference (objective 1). We were unable to evaluate newborn weight using clinical size-for-gestational-age categories (large, appropriate, or small-for-gestational age) because few newborns were born small-for-gestational age in this cohort. Gestational length, birth weight, birth weight z-scores, body length, weight/length ratio, and head circumference were normally distributed, and we checked regression models for non-constant residual variance to ensure model assumptions were met. We evaluated both unadjusted and adjusted sex-specific associations of paraben biomarkers with birth outcomes, and reported all results stratified by sex regardless of the significance of the interaction P-value (Pint) between parabens and newborn sex. We identified important confounders a priori and using previously published literature that informed a directed acyclic graph (Supplemental Figure 1) (Jamal et al., 2019). We evaluated correlations (Pearson for continuous and polychoric for categorical variables) between all covariates; however, none of the chosen covariates were strongly correlated with each other (r < 0.4; data not shown). Therefore, adjusted linear regression models accounted for age, race/ethnicity, conception season, pre-pregnancy BMI, parity, depression status in early pregnancy, newborn sex, and average pregnancy diet quality. Pre-pregnancy BMI, EPDS scores, and diet quality were included as continuous variables, while the remaining variables were categorical, with the reference groups indicated in Table 1.
Table 1.
Maternal and select delivery/newborn characteristics (n=458).
| Characteristics | Mothers of female newborns | Mothers of male newborns | |||
|---|---|---|---|---|---|
| Worse diet quality | Better diet quality | Worse diet quality | Better diet quality | ||
| n = 121 | n = 112 | n = 108 | n = 117 | ||
| n (%) | n (%) | n (%) | n (%) | P 2 | |
| Age | 0.0002 | ||||
| < 30 years (ref) | 64 (52.9) | 40 (35.7) | 53 (49.1) | 32 (27.4) | |
| ≥ 30 years | 57 (47.1) | 72 (64.3) | 55 (50.9) | 85 (72.7) | |
| Race/ethnicity | 0.66 | ||||
| Non-Hispanic White (ref) | 95 (78.5) | 94 (83.9) | 86 (79.6) | 91 (77.8) | |
| Others1 | 26 (21.5) | 18 (16.1) | 22 (20.4) | 26 (22.2) | |
| Education | <0.0001 | ||||
| Some college or less | 30 (24.8) | 8 (7.1) | 36 (33.3) | 13 (11.1) | |
| College grad or high | 91 (75.2) | 104 (92.9) | 72 (66.7) | 104 (88.9) | |
| Employment | 0.43 | ||||
| Unemployed | 19 (15.7) | 11 (9.8) | 18 (16.7) | 19 (16.2) | |
| Employed | 102 (84.3) | 101 (90.2) | 90 (83.3) | 98 (83.8) | |
| Parity | 0.84 | ||||
| Nulliparous (ref) | 59 (48.8) | 58 (51.8) | 51 (47.2) | 61 (52.1) | |
| Primiparous | 37 (30.6) | 39 (33.9) | 35 (32.4) | 38 (32.5) | |
| Multiparous | 25 (20.6) | 16 (14.3) | 22 (20.4) | 18 (15.4) | |
| Smoking in the first trimester | 0.06 | ||||
| No | 106 (87.6) | 98 (87.5) | 89 (82.4) | 108 (92.3) | |
| Yes | 7 (5.8) | 2 (1.8) | 11 (10.2) | 4 (3.4) | |
| Unknown | 8 (6.6) | 12 (10.7) | 8 (7.4) | 5 (4.3) | |
| Conception season | 0.13 | ||||
| Winter | 30 (24.8) | 25 (22.3) | 37 (34.3) | 22 (18.8) | |
| Spring (ref) | 32 (26.4) | 35 (31.3) | 29 (26.9) | 32 (27.4) | |
| Summer | 29 (24.0) | 22 (19.6) | 17 (15.7) | 37 (31.6) | |
| Fall | 30 (24.8) | 30 (26.8) | 25 (23.1) | 26 (22.2) | |
| Mode of delivery | 0.51 | ||||
| Vaginal delivery | 97 (80.8) | 78 (70.8) | 77 (73.3) | 80 (69.0) | |
| Scheduled C-section | 12 (10.0) | 16 (14.6) | 15 (14.3) | 17 (14.6) | |
| Emergency C-section | 11 (9.2) | 16 (14.6) | 13 (12.4) | 19 (16.4) | |
| Size-for-gestational age | 0.04 | ||||
| Small-for-gestational age (SGA) | 5 (4.9) | 8 (8.3) | 0 (0.0) | 7 (7.0) | |
| Appropriate-for-gestational age (AGA) | 85 (82.5) | 71 (74.0) | 88 (88.0) | 77 (77.0) | |
| Large-for-gestational age (LGA) | 13 (12.6) | 17 (17.7) | 12 (12.0) | 16 (16.0) | |
| Median (min, max) | Median (min, max) | Median (min, max) | Median (min, max) | P 3 | |
| Pre-pregnancy BMI (kg/m2) | 25.1 (17.5, 52.1) | 23.2 (17.1, 41.0) | 26.0 (18.2, 44.9) | 24.0 (18.2, 48.8) | 0.001 |
| EPDS score | 4.0 (0.0, 19.0) | 4.0 (0.0, 15.0) | 4.0 (0.0, 17.0) | 4.0 (0.0, 19.0) | 0.72 |
| AHEI-2010 score | 45.8 (25.6, 51.9) | 59.7 (52.0, 75.5) | 44.6 (30.7, 51.9) | 59.6 (52.0, 76.2) | <0.0001 |
Includes Hispanic white, non-Hispanic black, Asians, Native American or Alaska Natives, Native Hawaiians or Pacific Islanders, multiracial or others.
P-values from chi-squared or Fisher’s Exact test.
P-values from Kruskal-Wallis test.
Percentages may not add up to 100% due to missing. AHEI-2010, Alternative Healthy Eating Index 2010; BMI, body mass index; EPDS, Edinburgh Postnatal Depression Scale.
To evaluate if sex-specific associations of paraben biomarkers with gestational length, birth size, and head circumference differed by maternal diet quality (objective 2), we used linear regression models accounting for the previously mentioned covariates, a three-way interaction, and all relevant two-way interactions between parabens, sex, and AHEI-2010. We dichotomized average pregnancy AHEI-2010 at the sample median (score of 55.9) to determine if sex-specific associations of parabens with birth outcomes differed in male or female newborns of mothers with poorer (AHEI-2010 < median) or better (AHEI-2010 ≥ median) average diet qualities. We reported all results regardless of the significance of the three-way interaction P-value (Pint) between parabens, sex, and diet quality.
We also conducted sensitivity analyses to determine the robustness of associations. First, gestational length could mediate associations of paraben biomarkers with birth weight, body length, weight/length ratio, and head circumference (Kamai et al., 2019), therefore, we also evaluated these relationships by additionally adjusting for gestational age at birth (Supplemental Table 2). Second, we also conducted sensitivity analyses where we included preterm births (n = 21). Because we observed that associations of paraben biomarkers with birth outcomes did not change after inclusion of preterm births (data not shown), we excluded pre-term births from our analyses. Lastly, for a small number of newborns, we obtained body length and head circumference data from hospital crib cards (n = 28 and 9 measurements, respectively). Ultimately, we included these babies in final statistical models because associations of parabens with birth outcomes did not differ upon their exclusion in sensitivity analyses (data not shown).
Because parabens were ln-transformed for all analyses, we back-transformed the resulting β-estimates and 95% confidence intervals (CIs) using the equation [β * ln(2.00)] to represent the change in birth outcome for every two-fold increase in paraben biomarker concentration. All analyses were conducted in SAS version 9.4 (SAS Institute Inc, Cary, NC) using PROC GLM. We focused on patterns of associations rather than statistical significance. We considered associations potentially meaningful if (1) the upper and lower confidence limits did not cross the null or (2) the upper or lower confidence limit did cross the null but the limit was close to zero (Amrhein et al., 2019; Wasserstein and Lazar, 2016). Based on recommendations from others (Rothman, 1990), we did not adjust for multiple comparisons.
3. RESULTS
3.1. Sociodemographic and lifestyle characteristics of the I-KIDS sample
In this sample, most mothers were older than 30 years (59%), non-Hispanic white (80%), college educated (81%), employed (85%), and did not smoke in the first trimester (87%), while 50% were nulliparous. Around half of mothers were normal weight, whereas the other half had overweight or obesity before pregnancy. Conception season was uniformly distributed over the four seasons, and most women (74%) had a vaginal delivery. Median (range) EPDS score was 4.0 (0.0 – 19.0), while maternal average pregnancy AHEI-2010 score was 51.9 (25.6 – 76.2). Characteristics of the I-KIDS sample by newborn sex and maternal average pregnancy diet quality are presented in Table 1. Out of 458 newborns included in this study, 121 and 112 were females of mothers with worse or better diet quality, respectively, while 108 and 117 were males of mothers with worse or better quality, respectively (Table 1). Maternal age, education, pre-pregnancy BMI, and AHEI-2010 scores significantly differed by newborn sex and maternal diet quality (Table 1).
3.2. Maternal paraben biomarker concentrations
All women had detectable (above the LOD) urinary concentrations of methylparaben, while > 99% of women had detectable urinary levels of at least two paraben biomarkers (Table 2). The order of median paraben biomarker concentrations was as follows: methylparaben > propylparaben > ethylparaben > butylparaben. Moderate-to-strong correlations were observed between methylparaben and propylparaben concentrations (r = 0.70) and between ethylparaben and methylparaben concentrations (r = 0.43; Supplemental Figure 2). Median I-KIDS maternal urinary paraben biomarker concentrations were lower than those of same-aged women from NHANES during similar time periods (Table 2) (NHANES, 2013–2014; NHANES, 2015–2016). Only maternal urinary ethylparaben concentrations significantly differed by newborn sex and maternal diet quality, where mothers who had females and better diet qualities had highest, while those who had males and worse diet qualities had lowest ethylparaben concentrations (Supplemental Table 1).
3.3. Distribution of gestational length, birth size, and head circumference
In the full sample, the distribution of gestational age at birth across clinical categories was as follows: 5% pre-term, 24% early term, 60% full term, and 11% late term. Around 5% of infants were born small-for-gestational age, 81% were born appropriate-for-gestational age, and 14% were born large-for-gestational age (Table 1). In the current analytic sample, women delivered at median 39 weeks gestation (min: 37, max: 42). Median (25th, 75th percentiles) birth weight, length, weight/length ratio, and head circumference were 3.5 kg (3.2, 3.8), 50.0 cm (48.3, 51.0), 70.2 g/cm (64.8, 75.3), and 34.9 cm (34.0, 35.8), respectively. Newborn females and males had similar mean gestational lengths, and newborns of mothers with worse diet qualities were delivered earlier (Table 3). Males appeared to have larger mean birth weight (before calculating z-scores), body length, weight/length ratio, and head circumference than females. Newborn females of mothers with worse diet qualities consistently had the smallest mean birth size and head circumference.
Table 3.
Distribution of gestational length and newborn anthropometrics (n=458).
| Female newborns | Male newborns | ||||
|---|---|---|---|---|---|
| n | Mean (std) | n | Mean (std) | P 1 | |
| Gestational length (wks) | 0.02 | ||||
| Better diet quality | 112 | 39.7 (1.0) | 117 | 39.7 (1.1) | |
| Worse diet quality | 121 | 39.5 (1.2) | 108 | 39.2 (1.1) | |
| Birth weight (g) | 0.004 | ||||
| Better diet quality | 96 | 3452.7 (466.4) | 100 | 3577.5 (430.0) | |
| Worse diet quality | 103 | 3372.7 (402.2) | 100 | 3569.7 (393.4) | |
| Birth weight z-score | 0.48 | ||||
| Better diet quality | 96 | 0.3 (1.1) | 100 | 0.2 (0.9) | |
| Worse diet quality | 103 | 0.1 (0.9) | 100 | 0.3 (0.8) | |
| Body length (cm) | <0.0001 | ||||
| Better diet quality | 101 | 49.4 (2.1) | 110 | 50.6 (2.0) | |
| Worse diet quality | 112 | 49.1 (1.9) | 100 | 50.2 (2.1) | |
| Weight-to-length ratio (g/cm) | 0.12 | ||||
| Better diet quality | 95 | 69.9 (7.4) | 100 | 70.7 (7.1) | |
| Worse diet quality | 103 | 68.6 (6.5) | 99 | 71.0 (6.5) | |
| Head circumference (cm) | <0.0001 | ||||
| Better diet quality | 102 | 34.6 (1.3) | 110 | 35.2 (1.3) | |
| Worse diet quality | 112 | 34.5 (1.2) | 101 | 35.2 (1.3) |
P-value from Kruskal-Wallis test.
3.4. Sex-specific associations of paraben biomarkers with birth outcomes
Associations of maternal urinary paraben concentrations with birth outcomes in the full sample are presented in Supplemental Table 2. When stratified by newborn sex and after adjusting for important confounders, associations of select parabens with birth weight, birth weight z-scores, body length, and weight/length ratio appeared more prominent in females than males (Table 4). For example, in females, two-fold increases in maternal urinary methylparaben and propylparaben concentrations were associated with −46.6 g (95% CI: −74.7, −18.5) and −25.9 g (95% CI: −48.6, −3.2) lower birth weight, as well as −0.1 (95% CI: −0.2, 0.0) and −0.1 (95% CI: −0.1, 0.0) lower birth weight z-scores, respectively. Additionally, two-fold increases in maternal urinary methylparaben and propylparaben concentrations were associated with −0.2 cm (95% CI: −0.3, −0.1) and −0.2 cm (95% CI: −0.3, 0.0) shorter body length, respectively. We observed similar inverse association of methylparaben with weight/length ratio (β: −0.6 g/cm; 95% CI: −1.1, −0.2) and marginal inverse association of propylparaben with weight/length ratio (β: −0.3 g/cm; 95% CI: −0.7, 0.0) in females. In female, but not male newborns, we also observed a marginal inverse association between methylparaben and gestational length (β: −0.1 week; 95% CI: −0.1, 0.0), and a potentially meaningful inverse association between ethylparaben and birth weight (β: −21.0 g; 95% CI: −50.0, 8.1). After adjusting for gestational length, inverse associations of maternal urinary methylparaben and propylparaben with birth weight, body length, and weight/length ratio in female newborns remained, although the effect estimates were slightly reduced compared to models not accounting for gestational length (Supplemental Table 3).
Table 4.
Adjusted associations of urinary specific gravity-adjusted paraben concentrations with birth outcomes by newborn sex.
| Ethylparaben | Methylparaben | Propylparaben | |||||||
|---|---|---|---|---|---|---|---|---|---|
| Female newborn | Male newborn | Pint | Female newborn | Male newborn | Pint | Female newborn | Male newborn | Pint | |
| Δ (95% CI) | Δ (95% CI) | Δ (95% CI) | Δ (95% CI) | Δ (95% CI) | Δ (95% CI) | ||||
| Gestational length (wks) | −0.06 (−0.13, 0.01) | 0.00 (−0.07, 0.08) | 0.24 | −0.06 (−0.13, 0.01) | 0.00 (−0.08, 0.08) | 0.30 | −0.01 (−0.07, 0.04) | 0.00 (−0.06, 0.06) | 0.80 |
| Birth weight (g) | −20.96 (−50.04, 8.12) | 4.96 (−23.43, 33.35) | 0.21 | −46.61 (−74.70, −18.51) | −5.68 (−36.11, 24.75) | 0.05 | −25.94 (−48.66, −3.21) | −12.36 (−35.02, 10.3) | 0.41 |
| Birth weight z-scores | −0.05 (−0.11, 0.02) | 0.01 (−0.05, 0.07) | 0.20 | −0.09 (−0.15, −0.03) | −0.02 (−0.08, 0.05) | 0.09 | −0.06 (−0.11, −0.01) | −0.03 (−0.08, 0.02) | 0.42 |
| Body length (cm) | −0.10 (−0.24, 0.04) | 0.05 (−0.09, 0.18) | 0.14 | −0.21 (−0.34, −0.07) | 0.04 (−0.1, 0.19) | 0.01 | −0.15 (−0.25, −0.04) | −0.02 (−0.13, 0.09) | 0.11 |
| Weight/length ratio (g/cm) | −0.26 (−0.74, 0.21) | 0.02 (−0.44, 0.48) | 0.39 | −0.64 (−1.10, −0.19) | −0.20 (−0.69, 0.30) | 0.19 | −0.33 (−0.70, 0.04) | −0.22 (−0.58, 0.15) | 0.68 |
| Head circumference (cm) | −0.03 (−0.12, 0.06) | −0.03 (−0.12, 0.06) | 0.93 | −0.03 (−0.11, 0.06) | −0.03 (−0.12, 0.07) | 0.96 | −0.01 (−0.08, 0.06) | −0.03 (−0.10, 0.04) | 0.70 |
Data from linear regression models are presented as Δ (95% CI) in birth outcome for every 2-fold increase in urinary ethylparaben, methylparaben, or propylparaben concentrations. Models account for age (<30 (ref), ≥30 years), race/ethnicity (non-Hispanic white (ref), others), parity (nulliparous (ref), primiparous, multiparous), pre-pregnancy body mass index (continuous), conception season (winter, spring (ref), summer, fall), depression (continuous), fetal sex (male (ref), female), the average pregnancy diet quality (continuous), and a multiplicative interaction between paraben and fetal sex (P-value for the interaction between parabens and newborn sex, Pint). Gestational length (female newborns n=233, male newborns n=225); birth weight and birth weight z-score (females newborns n=199, male newborns n=200); body length (female newborns n=213, male newborns n=210); weight/length ratio (female newborns n=198, male newborns n=199); head circumference (female newborns n=214, male newborns n=211). Bold indicate potentially meaningful findings. CI, confidence interval.
3.5. Differences in overall and sex-specific associations by early pregnancy maternal diet quality
Newborn sex-specific associations of paraben biomarkers with birth outcomes differed by maternal diet quality (Figure 1 and Supplemental Table 4). Previously observed inverse associations of methylparaben and propylparaben with birth weight, birth weight z-scores, body length, and weight/length ratio in females were more prominent in females of women with poorer pregnancy diet (AHEI-2010 scores below the median) than in females of women with better pregnancy diet or male newborns. For example, in females of women with poorer diet quality, every two-fold increases in methylparaben and propylparaben concentrations were associated with −61.0 g (95% CI: −97.0, −24.9) and −47.8 g (95% CI: −78.8, −16.8) lower birth weight (Figure 1H, N), as well as −0.1 (95% CI: −0.2, 0.0) and −0.1 (95% CI: −0.2, 0.0) lower birth weight z-scores (Figure 1I, O), respectively. We observed similar, but marginal inverse associations of maternal urinary ethylparaben concentrations with birth weight (β: −33.3 g; 95% CI: −72.1, 5.6; Figure 1B) and birth weight z-scores (β: −0.1; 95% CI: −0.2, 0.0; Figure 1C) in females of mothers with worse diet quality. Additionally, in females of women with poorer diet quality, every two-fold increases in maternal methylparaben and propylparaben concentrations were associated with −0.3 cm (95% CI: −0.5, −0.1) and −0.2 cm (95% CI: −0.4, −0.1) shorter body length (Figure 1J, P), respectively. We observed similar inverse associations of maternal urinary methylparaben (β: −0.8 g/cm; 95% CI: −1.4, −0.3) and propylparaben (β: −0.6 g/cm; 95% CI: −1.1, −0.1) with weight/length ratio in females of women with poorer diet quality (Figure 1K, Q). Additionally, in females, but not males, of mothers with worse diet quality, we observed marginal inverse associations of ethylparaben (β: −0.1 weeks; 95% CI: −0.2, 0.0) and methylparaben (β: −0.1 weeks; 95% CI: −0.2, 0.0) with gestational length (Figure 1A, G), as well as a marginal inverse association between propylparaben and head circumference (β: −0.1 cm; 95% CI: −0.2, 0.0; Figure 1R). Interestingly, in males of mothers with worse diet quality, two-fold increases in maternal urinary ethylparaben concentrations were marginally associated with −0.1 cm (95% CI: −0.3, 0.0) smaller head circumference (Figure 1F), whereas in male newborns of mothers with better diet quality, maternal urinary propylparaben concentrations were associated with −0.1 weeks (95% CI: −0.2, 0.0) shorter gestational length and −0.1 cm (95% CI: −0.2, 0.0) smaller head circumference (Figure 1M, R). After adjusting for gestational length, inverse associations of methylparaben and propylparaben with birth weight, body length, and weight/length ratio in females of mothers with worse diet quality remained, but with slightly reduced effect estimates compared to models that did not account for gestational length (Supplemental Table 5).
Figure 1. Adjusted sex-specific associations of urinary specific gravity-adjusted paraben concentrations with birth outcomes by maternal diet quality.
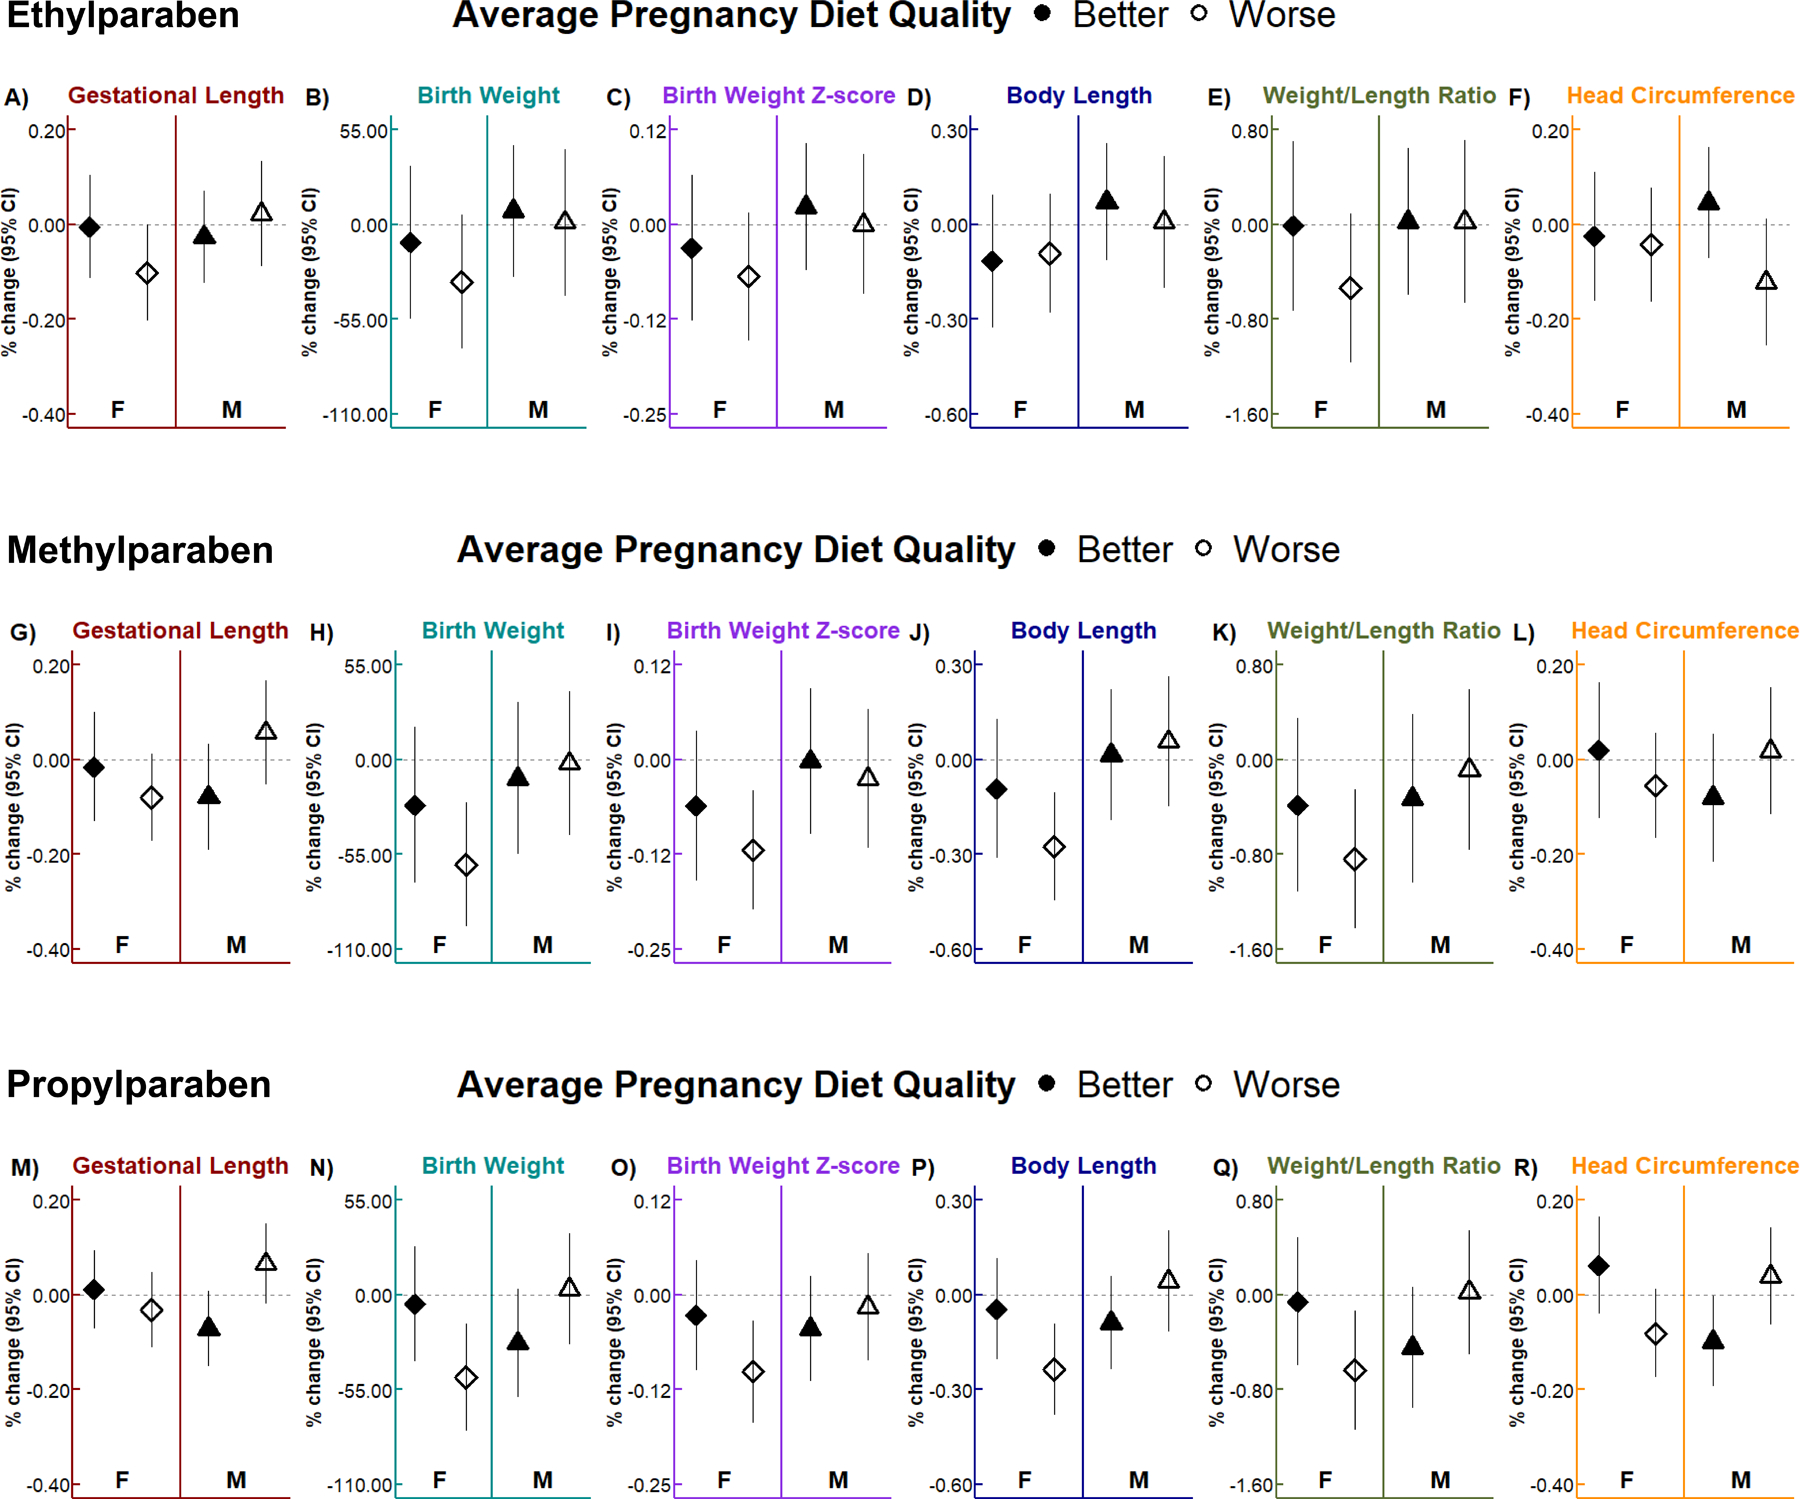
Linear regression models accounted for age, race/ethnicity, parity, pre-pregnancy body mass index, conception season, depression, newborn sex, average pregnancy diet quality, and a three-way interaction (with all corresponding two-way interactions) between paraben, newborn sex, and diet quality. Worse and better diet quality are indicated by the empty and filled shapes, respectively. Data are presented as the change (shape) and 95% CI (vertical solid lines) in gestational length (wk), birth weight (g), birth weight z-score, body length (cm), weight/length ratio (g/cm), and head circumference (cm) for every 2-fold increase in maternal urinary ethylparaben (A, B, C, D, E, F), methylparaben (G, H, I, J, K, L), and propylparaben (M, N, O, P, Q, R) concentrations. Results are presented separately for female (F) and male (M) newborns. Sample sizes for each group can be found in Table 3. CI, confidence interval.
4. DISCUSSION
4.1. Summary of major findings
In this sample of pregnant women with lower paraben concentrations than U.S. reproductive-aged women, we observed that maternal urinary methylparaben and propylparaben concentrations were negatively associated with birth weight, birth weight z-scores, body length, and weight/length ratio in female, but not male newborns; these results persisted even after additionally adjusting for gestational length. Additionally, methylparaben was marginally negatively associated with gestational length in females, but not males, while parabens were not associated with head circumference in either sex. Furthermore, in females, negative associations of paraben biomarkers, especially methylparaben and propylparaben, with birth size measures and gestational length were more prominent in newborns of mothers with poorer diet quality. However, in males, some marginal inverse associations of propylparaben with gestational length and head circumference emerged if their mothers had a better diet quality. Overall, our results suggest that parabens are associated with birth size in a sex-specific manner and that diet quality may moderate this association. However, our diet- and sex-specific findings will need to be further corroborated in populations with higher prevalence of pre-term birth and small-for-gestational age newborns to determine whether intervening on maternal diet may be useful against paraben exposure in more at-risk populations.
4.2. Paraben biomarkers were associated with smaller birth size in female newborns
Birth weight, body length, and weight/length ratio are sex-specific outcomes that are important determinants of child life-long health (Risnes et al., 2011). Numerous studies suggest that newborn sex may influence susceptibility to environmental insults (Cowell and Wright, 2017; Gabory et al., 2009), however studies evaluating sex-specific associations of paraben biomarkers with birth size have been inconsistent (Jamal et al., 2019; Zhong et al., 2020). To our knowledge, no study has evaluated associations of parabens with weight/length ratio. Our results indicating that urinary concentrations of parabens, specifically methylparaben and propylparaben, were associated with lower birth weight and shorter body length in female newborns are consistent with some previous studies. For example, a study of 199 Taiwanese pregnant women showed that females of women with urinary methylparaben concentrations above the 75th percentile (compared to those with concentrations below the 75th percentile) had lower birth weight and shorter birth length (Chang et al., 2019). Two other studies from Iran (Jamal et al., 2020) and China (Wu et al., 2019) observed that urinary maternal propylparaben and methylparaben concentrations, respectively, were negatively associated with body length in females. However, a study of 142 Belgian pregnant women observed that only ethylparaben concentrations measured in placental tissue were negatively associated with birth weight and body length in females (Vrijens et al., 2020). Additionally, some studies reported positive associations of paraben urinary biomarkers with birth weight in females (Fadaei et al., 2020; Hajizadeh et al., 2021). Other studies only observed associations of paraben biomarkers with birth weight (Agier et al., 2020; Jamal et al., 2020; Philippat et al., 2014; Rodríguez-Carmona et al., 2020; Wu et al., 2019) or body length (Hajizadeh et al., 2021; Wu et al., 2017) in males or reported null associations of paraben biomarkers with birth weight (Aker et al., 2019b; Ferguson et al., 2018; Geer et al., 2017; Goodrich et al., 2019; Messerlian et al., 2018; Philippat et al., 2012; Wu et al., 2017) and body length (Fadaei et al., 2020; Geer et al., 2017; Philippat et al., 2014; Philippat et al., 2012) in both sexes. Although most studies approximated paraben exposure from maternal urine concentrations, the Belgian study quantified parabens from homogenized placental tissue, which could explain discrepancies in our findings. Parabens have been detected in cord blood (Towers et al., 2015), amniotic fluid (Philippat et al., 2013), and placental tissue (Valle-Sistac et al., 2016), suggesting parabens can cross the placenta resulting in direct fetal exposure. However, in one study, maternal urinary paraben concentrations were only moderately positively correlated with concentrations in cord blood samples (Pycke et al., 2015), and in another study, maternal urinary paraben concentrations were only weakly-to-moderately positively correlated with concentrations in amniotic fluid (Brauner et al., 2022). Additionally, for other non-persistent chemicals, such as di(2-ethylhexyl) phthalate and bisphenol A, if urine samples are collected around delivery, the measured chemical concentrations may reflect exposure during the biospecimen collection procedure rather than throughout pregnancy (Vandentorren et al., 2011). Therefore, it is important to consider the biological matrix and sample collection timing used for approximating paraben exposure. Discrepancies could also be due to differences in the number of urines collected for maternal urinary paraben biomarker assessment, the types of covariates included in statistical models, operationalization of birth size measures, and the study population. Overall, the current literature remains mixed with regards to sex-specific associations of parabens with birth outcomes.
Parabens, especially methylparaben and propylparaben, may be associated with reduced birth size through a variety of mechanisms, including hormonal, inflammatory, and metabolic pathways. In experimental animal and cell models, parabens disrupted hormonal pathways related to estrogens, androgens, and thyroid hormones by binding to hormone receptors (Makieva et al., 2014). Similarly, studies in pregnant women reported that methylparaben and propylparaben were associated with altered testosterone and sex-hormone binding globulin concentrations (Aker et al., 2019a; Kolatorova et al., 2018). In vitro and in vivo studies also observed that parabens can disrupt inflammatory and oxidative stress pathways by altering mRNA levels of cytokines and disrupting immune cell activity (Bairati et al., 1994; Bereketoglu and Pradhan, 2019). Correspondingly, in pregnant women, methylparaben and propylparaben biomarker concentrations were found to be associated with altered concentrations of maternal blood cytokine and oxidative stress biomarker concentrations (Aung et al., 2019a; Watkins et al., 2015). Furthermore, in experimental studies, parabens can disrupt adipocyte differentiation and metabolism (Elmore et al., 2020), which can have critical implications for energy balance including glucose and lipid homeostasis (Rosen and Spiegelman, 2006). In pregnant women, parabens are associated with altered pregnancy glucose levels and gestational weight gain (Bellavia et al., 2019; Wen et al., 2020). Sexually dimorphic responses of these pathways to paraben exposures may exist, since hormonal, inflammatory, and metabolic milieus differ in women carrying females versus males (Al-Qaraghouli and Fang, 2017; Enninga et al., 2015). Given the sexual dimorphism of the placenta (Rosenfeld, 2015), it may also contribute to sex differences in the response to parabens. However, it remains unclear why for some studies (like ours) associations were primarily observed in female newborns, while in other studies, associations were only observed in male newborns.
4.3. Paraben biomarkers were not associated with gestational length or head circumference
Gestational age at delivery is an important determinant of neonatal morbidity and mortality (Drife, 2021; Markopoulou et al., 2019). In our study, we only observed a marginal negative association of maternal urinary methylparaben with gestational length in female newborns. However, some previous studies observed significant associations of paraben biomarkers with gestational length, many of which dichotomized gestational length at 37 weeks gestation to evaluate associations of maternal urinary paraben concentrations with the odds of pre-term birth (Aker et al., 2019b; Aung et al., 2019b; Zhang et al., 2021). These studies were conducted in populations with high pre-term birth prevalence (greater than 10%), while in our study, only 5% of newborns were born pre-term, making us unable to effectively evaluate associations of parabens with clinically-relevant markers of gestational length.
Head circumference is correlated with newborn brain volume (Lindley et al., 1999). In our study, paraben biomarkers were not meaningfully associated with head circumference in female or male newborns, which was consistent with studies from the U.S. (Ferguson et al., 2018; Geer et al., 2017) and France (Philippat et al., 2014; Philippat et al., 2012). However, several other studies reported significant but inconsistent sex-specific associations of paraben biomarkers with head circumference (Chang et al., 2019; Fadaei et al., 2020; Hajizadeh et al., 2021; Jamal et al., 2020; Vrijens et al., 2020). Results from these studies suggest that sex-specific associations of parabens with head circumference may be trimester-specific, which may explain why we did not observe associations by measuring paraben biomarkers in a pool of five first-morning urines collected across pregnancy. However, most studies that observed significant associations of parabens with head circumference only collected one spot urine (generally in the first or third trimesters) or quantified parabens using another biological matrix (i.e., placental tissue), which may not accurately capture maternal paraben exposure during pregnancy (Vernet et al., 2018). Therefore, findings for associations of parabens with head circumference should be interpreted with caution.
4.4. Maternal diet quality during pregnancy moderated associations of parabens with birth outcomes
Maternal diet quality is an important modulator of pregnancy health, as well as fetal growth and development (Chia et al., 2019). In our study, we consistently observed more prominent inverse associations of paraben biomarkers with birth size measures and gestational length in females of mothers with poorer diets. This suggests that better maternal diets may attenuate some associations of parabens with birth outcomes in females. Maternal diet influences birth outcomes by interacting with inflammatory and metabolic pathways (Bragg et al., 2022; Hennig et al., 2007; Lecorguille et al., 2021) – the same pathways parabens may also target. Diet is a known modulator of chronic inflammation and oxidative stress, and pregnant women with healthier dietary patterns consume more anti-inflammatory and antioxidant-rich foods that protect against adverse birth and child outcomes, including unfavorable birth size or shorter gestational length (Lecorguille et al., 2021). Diet also has a major influence on metabolic pathways that are closely linked with inflammation, especially glucose and lipid homeostasis. Pregnant women with healthier dietary patterns tend to have more favorable gestational weight gain, body fat distribution, and metabolic profiles (i.e., levels of insulin, total cholesterol), which are also important determinants of fetal growth and development. Therefore, our results suggest that diet may be a stronger modulator of inflammatory and metabolic pathways than parabens and may offset some paraben-related disruptions of these pathways in the mother and/or placenta (Hennig et al., 2007). Interestingly, in males of women with better pregnancy diet qualities, some marginal inverse associations of propylparaben with gestational length and head circumference emerged. As a result, we cannot rule out chance findings due to confounding by other healthy lifestyle behaviors or socioeconomic factors unaccounted for in our models that may explain our results. For example, we were unable to account for maternal physical activity in pregnancy, which has been shown to be associated with appropriate birth size (Vargas-Terrones et al., 2019), may predict maternal paraben biomarker concentrations (Fadaei et al., 2021), and has some of the same anti-inflammatory and favorable metabolic effects during pregnancy as diet (Bilodeau et al., 2019; Mudd and Evenson, 2015).
4.5. Strengths and limitations
Our study has several limitations. First, using urinary paraben concentrations from a pooled sample as a proxy for pregnancy exposure to parabens limited our ability to evaluate trimester-specific associations of parabens with birth outcomes. Second, the AHEI-2010 includes food/nutrients predictive of chronic disease risk in the Nurses’ Health Study and Health Professional Follow-Up Study, which are cohorts of non-pregnant women and men, respectively. Third, given that majority of women in this study are non-Hispanic white and of higher socioeconomic status, our findings may not be generalizable to other diverse populations or populations with high prevalence of clinically relevant adverse birth outcomes, including pre-term birth and small-for-gestational age. Fourth, there may be residual confounding unaccounted for in our statistical models. Lastly, we were likely underpowered to detect certain newborn sex- and diet-specific associations between parabens and birth outcomes.
Our study also has some important strengths. First, using a pooled sample of five first morning urines for quantification of nonpersistent chemicals reduces exposure measurement error, provides a more stable measure of mean gestational exposure, and may, in fact, be a better reflection of exposure at any given timepoint during pregnancy (Shin et al., 2021; Vernet et al., 2019). Second, using a diet quality index like the AHEI-2010 accounts for dietary patterns and the interactive effects of foods and nutrients, and the individual food and nutrient components of this index have been shown to be associated with birth size (Li et al., 2021; Mahmassani et al., 2021; Reyes-Lopez et al., 2021; Yisahak et al., 2021). Third, we used a priori consideration and previous literature to make informed decisions about covariate selection. Finally, our findings contribute information about environmental risk factors for birth outcomes in a sample with low pre-term birth and small-for-gestational age prevalence that is ubiquitously exposed to parabens but is heterogenous with regards to diet quality.
5. CONCLUSIONS
To our knowledge, this is the first study to evaluate whether associations between urinary paraben biomarkers and birth outcomes differ by maternal diet quality, as measured by a diet quality index that accounts for the interactive effects of foods and nutrients. Our study suggests that parabens have sex-specific impacts on birth size independent of gestational length, and that maternal diet quality may attenuate these associations in a sex-specific manner. Our findings corroborate those from previous studies also showing that associations of paraben biomarkers with birth outcomes differ by newborn sex, although sex-specific associations differ across studies. Future studies in experimental models and pregnant women can help elucidate the sex-specific mechanisms and biological pathways by which parabens impact birth size, as well as the gestational windows most vulnerable to paraben exposure. Additionally, given that women are exposed to many environmental pollutants that may interact with parabens, future research could consider evaluating mixtures of chemicals, including parabens, with gestational length, birth size measures, and head circumference. Most importantly, even if women cannot reduce their exposure to parabens, our study informs how diet quality may be a potential modifiable factor that moderates the relationship between parabens and birth outcomes.
Supplementary Material
Funding sources:
This publication was made possible by the National Institute of Environmental Health Sciences (NIH/NIEHS) grants ES024795, ES032227, ES022848, the U.S. Environmental Protection Agency grant RD83543401, National Institute of Health Office of the Director grant OD023272, and Office of Dietary Supplements Administrative Supplement OD023272–05S2. Its contents are solely the responsibility of the grantee and do not necessarily represent the official views of the US EPA or NIH. Further, the US EPA does not endorse the purchase of any commercial products or services mentioned in the publication. This project was also supported by the USDA National Institute of Food and Agriculture and Michigan AgBioResearch.
Abbreviations:
- AHEI-2010
Alternative Healthy Eating Index 2010
- CDC
Centers for Disease Control and Prevention
- CI
confidence interval
- EPDS
Edinburgh Postnatal Depression Scale
- FFQs
food frequency questionnaires
- I-KIDS
Illinois Kids Development Study
- LOD
limit of detection
- NHANES
National Health and Nutrition Examination Survey
- U.S.
United States
Footnotes
Statement of ethics: The authors have no conflicts of interest to disclose.
Disclaimer: The findings and conclusions in this report are those of the authors and do not necessarily represent the official position of the CDC. Use of trade names is for identification only and does not imply endorsement by the CDC, the Public Health Service, or the US Department of Health and Human Services.
REFERENCES
- 2015. Committee opinion no. 633: Alcohol abuse and other substance use disorders: ethical issues in obstetric and gynecologic practice. Obstet Gynecol 125, 1529–1537. [DOI] [PubMed] [Google Scholar]
- Agier L, et al. , 2020. Association between the pregnancy exposome and fetal growth. Int J Epidemiol 49, 572–586. [DOI] [PMC free article] [PubMed] [Google Scholar]
- Ahn HJ, et al. , 2012. Parabens inhibit the early phase of folliculogenesis and steroidogenesis in the ovaries of neonatal rats. Mol Reprod Dev 79, 626–36. [DOI] [PubMed] [Google Scholar]
- Aker AM, et al. , 2019a. A repeated measures study of phenol, paraben and Triclocarban urinary biomarkers and circulating maternal hormones during gestation in the Puerto Rico PROTECT cohort. Environ Health 18, 28. [DOI] [PMC free article] [PubMed] [Google Scholar]
- Aker AM, et al. , 2019b. The associations between prenatal exposure to triclocarban, phenols and parabens with gestational age and birth weight in northern Puerto Rico. Environ Res 169, 41–51. [DOI] [PMC free article] [PubMed] [Google Scholar]
- Aker AM, et al. , 2018. Associations between maternal phenol and paraben urinary biomarkers and maternal hormones during pregnancy: A repeated measures study. Environ Int [DOI] [PMC free article] [PubMed]
- Aker AM, et al. , 2016. Phenols and parabens in relation to reproductive and thyroid hormones in pregnant women. Environ Res 151, 30–37. [DOI] [PMC free article] [PubMed] [Google Scholar]
- Al-Qaraghouli M, Fang YMV, 2017. Effect of Fetal Sex on Maternal and Obstetric Outcomes. Front Pediatr 5, 144. [DOI] [PMC free article] [PubMed] [Google Scholar]
- Amrhein V, et al. , 2019. Scientists rise up against statistical significance. Nature 567, 305–307. [DOI] [PubMed] [Google Scholar]
- Aung MT, et al. , 2019a. Associations between maternal plasma measurements of inflammatory markers and urinary levels of phenols and parabens during pregnancy: A repeated measures study. Sci Total Environ 650, 1131–1140. [DOI] [PMC free article] [PubMed] [Google Scholar]
- Aung MT, et al. , 2019b. Preterm birth in relation to the bisphenol A replacement, bisphenol S, and other phenols and parabens. Environ Res 169, 131–138. [DOI] [PMC free article] [PubMed] [Google Scholar]
- Bairati C, et al. , 1994. The esters of p-hydroxy-benzoate (parabens) inhibit the release of lysosomal enzymes by mitogen-stimulated peripheral human lymphocytes in culture. Clin Chim Acta 224, 147–57. [DOI] [PubMed] [Google Scholar]
- Bannon AL, et al. , 2017. Comparison of Self-reported and Measured Pre-pregnancy Weight: Implications for Gestational Weight Gain Counseling. Matern Child Health J 21, 1469–1478. [DOI] [PubMed] [Google Scholar]
- Bellavia A, et al. , 2019. Urinary concentrations of parabens mixture and pregnancy glucose levels among women from a fertility clinic. Environ Res 168, 389–396. [DOI] [PMC free article] [PubMed] [Google Scholar]
- Bereketoglu C, Pradhan A, 2019. Comparative transcriptional analysis of methylparaben and propylparaben in zebrafish. Sci Total Environ 671, 129–139. [DOI] [PubMed] [Google Scholar]
- Bilodeau JF, et al. , 2019. Physical fitness is associated with prostaglandin F2alpha isomers during pregnancy. Prostaglandins Leukot Essent Fatty Acids 145, 7–14. [DOI] [PubMed] [Google Scholar]
- Bjorstad AR, et al. , 2010. Macrosomia: mode of delivery and pregnancy outcome. Acta Obstet Gynecol Scand 89, 664–9. [DOI] [PubMed] [Google Scholar]
- Bodnar LM, Siega-Riz AM, 2002. A Diet Quality Index for Pregnancy detects variation in diet and differences by sociodemographic factors. Public Health Nutr 5, 801–9. [DOI] [PubMed] [Google Scholar]
- Boucher B, et al. , 2006. Validity and reliability of the Block98 food-frequency questionnaire in a sample of Canadian women. Public Health Nutr 9, 84–93. [DOI] [PubMed] [Google Scholar]
- Bragg M, et al. , 2022. Prenatal Diet as a Modifier of Environmental Risk Factors for Autism and Related Neurodevelopmental Outcomes. Curr Environ Health Rep 9, 324–338. [DOI] [PMC free article] [PubMed] [Google Scholar]
- Brauner EV, et al. , 2022. Presence of parabens, phenols and phthalates in paired maternal serum, urine and amniotic fluid. Environ Int 158, 106987. [DOI] [PMC free article] [PubMed] [Google Scholar]
- Chang CH, et al. , 2019. The sex-specific association between maternal paraben exposure and size at birth. Int J Hyg Environ Health 222, 955–964. [DOI] [PubMed] [Google Scholar]
- Chen LW, et al. , 2021. Associations of maternal dietary inflammatory potential and quality with offspring birth outcomes: An individual participant data pooled analysis of 7 European cohorts in the ALPHABET consortium. PLoS Med 18, e1003491. [DOI] [PMC free article] [PubMed] [Google Scholar]
- Chia AR, et al. , 2019. Maternal Dietary Patterns and Birth Outcomes: A Systematic Review and Meta-Analysis. Adv Nutr 10, 685–695. [DOI] [PMC free article] [PubMed] [Google Scholar]
- Chiuve SE, et al. , 2012. Alternative dietary indices both strongly predict risk of chronic disease. J Nutr 142, 1009–18. [DOI] [PMC free article] [PubMed] [Google Scholar]
- Cowell WJ, Wright RJ, 2017. Sex-Specific Effects of Combined Exposure to Chemical and Non-chemical Stressors on Neuroendocrine Development: a Review of Recent Findings and Putative Mechanisms. Curr Environ Health Rep 4, 415–425. [DOI] [PMC free article] [PubMed] [Google Scholar]
- Cox JL, et al. , 1987. Detection of postnatal depression. Development of the 10-item Edinburgh Postnatal Depression Scale. Br J Psychiatry 150, 782–6. [DOI] [PubMed] [Google Scholar]
- Dolinoy DC, et al. , 2007. Maternal nutrient supplementation counteracts bisphenol A-induced DNA hypomethylation in early development. Proc Natl Acad Sci U S A 104, 13056–61. [DOI] [PMC free article] [PubMed] [Google Scholar]
- Drife JO, 2021. The history of labour induction: How did we get here? Best Pract Res Clin Obstet Gynaecol [DOI] [PubMed]
- Elmore SE, et al. , 2020. Disruption of normal adipocyte development and function by methyl- and propyl- paraben exposure. Toxicol Lett 334, 27–35. [DOI] [PubMed] [Google Scholar]
- Emond JA, et al. , 2018. Better Diet Quality during Pregnancy Is Associated with a Reduced Likelihood of an Infant Born Small for Gestational Age: An Analysis of the Prospective New Hampshire Birth Cohort Study. J Nutr 148, 22–30. [DOI] [PMC free article] [PubMed] [Google Scholar]
- Enninga EA, et al. , 2015. Fetal sex-based differences in maternal hormones, angiogenic factors, and immune mediators during pregnancy and the postpartum period. Am J Reprod Immunol 73, 251–62. [DOI] [PMC free article] [PubMed] [Google Scholar]
- Espel EV, et al. , 2014. Longer gestation among children born full term influences cognitive and motor development. PLoS One 9, e113758. [DOI] [PMC free article] [PubMed] [Google Scholar]
- Fadaei S, et al. , 2020. Association of maternal urinary concentration of parabens and neonatal anthropometric indices. J Environ Health Sci Eng 18, 617–628. [DOI] [PMC free article] [PubMed] [Google Scholar]
- Fadaei S, et al. , 2021. Investigating determinants of parabens concentration in maternal urine. Human and Ecological Risk Assessment 27, 668–686. [Google Scholar]
- Ferguson KK, et al. , 2018. Environmental phenol associations with ultrasound and delivery measures of fetal growth. Environ Int 112, 243–250. [DOI] [PMC free article] [PubMed] [Google Scholar]
- Gabory A, et al. , 2009. Sexual dimorphism in environmental epigenetic programming. Mol Cell Endocrinol 304, 8–18. [DOI] [PubMed] [Google Scholar]
- Geer LA, et al. , 2017. Association of birth outcomes with fetal exposure to parabens, triclosan and triclocarban in an immigrant population in Brooklyn, New York. J Hazard Mater 323, 177–183. [DOI] [PMC free article] [PubMed] [Google Scholar]
- Gennings C, et al. , 2020. Contrasting prenatal nutrition and environmental exposures in association with birth weight and cognitive function in children at 7 years. BMJ Nutr Prev Health 3, 162–171. [DOI] [PMC free article] [PubMed] [Google Scholar]
- Gonzalez-Nahm S, et al. , 2020. Associations between Maternal Cadmium Exposure with Risk of Preterm Birth and Low after Birth Weight Effect of Mediterranean Diet Adherence on Affected Prenatal Outcomes. Toxics 8. [DOI] [PMC free article] [PubMed] [Google Scholar]
- Goodrich JM, et al. , 2019. First trimester maternal exposures to endocrine disrupting chemicals and metals and fetal size in the Michigan Mother-Infant Pairs study. J Dev Orig Health Dis 10, 447–458. [DOI] [PMC free article] [PubMed] [Google Scholar]
- Guzel Bayulken D, Ayaz Tuylu B, 2019. In vitro genotoxic and cytotoxic effects of some paraben esters on human peripheral lymphocytes. Drug Chem Toxicol 42, 386–393. [DOI] [PubMed] [Google Scholar]
- Hack M, et al. , 1995. Long-term developmental outcomes of low birth weight infants. Future Child 5, 176–96. [PubMed] [Google Scholar]
- Hajizadeh Y, et al. , 2021. The sex-specific association between maternal urinary paraben levels and offspring size at birth. Environ Sci Pollut Res Int 28, 36029–36038. [DOI] [PubMed] [Google Scholar]
- Hennig B, et al. , 2007. Using nutrition for intervention and prevention against environmental chemical toxicity and associated diseases. Environ Health Perspect 115, 493–5. [DOI] [PMC free article] [PubMed] [Google Scholar]
- Hertz-Picciotto I, et al. , 2000. Patterns and determinants of blood lead during pregnancy. Am J Epidemiol 152, 829–37. [DOI] [PubMed] [Google Scholar]
- Holland E, et al. , 2013. Self-reported pre-pregnancy weight versus weight measured at first prenatal visit: effects on categorization of pre-pregnancy body mass index. Matern Child Health J 17, 1872–8. [DOI] [PMC free article] [PubMed] [Google Scholar]
- Hu P, et al. , 2013. Effects of parabens on adipocyte differentiation. Toxicol Sci 131, 56–70. [DOI] [PMC free article] [PubMed] [Google Scholar]
- Jamal A, et al. , 2019. Prenatal exposure to parabens and anthropometric birth outcomes: A systematic review. Environ Res 173, 419–431. [DOI] [PubMed] [Google Scholar]
- Jamal A, et al. , 2020. Prenatal urinary concentrations of environmental phenols and birth outcomes in the mother-infant pairs of Tehran Environment and Neurodevelopmental Disorders (TEND) cohort study. Environmental Research 184, 109331. [DOI] [PubMed] [Google Scholar]
- Kamai EM, et al. , 2019. Fetal growth in environmental epidemiology: mechanisms, limitations, and a review of associations with biomarkers of non-persistent chemical exposures during pregnancy. Environ Health 18, 43. [DOI] [PMC free article] [PubMed] [Google Scholar]
- Kolatorova L, et al. , 2018. Exposure to bisphenols and parabens during pregnancy and relations to steroid changes. Environ Res 163, 115–122. [DOI] [PubMed] [Google Scholar]
- Laraia BA, et al. , 2007. Pregravid body mass index is negatively associated with diet quality during pregnancy. Public Health Nutr 10, 920–6. [DOI] [PubMed] [Google Scholar]
- Lecorguille M, et al. , 2021. Maternal Dietary Quality and Dietary Inflammation Associations with Offspring Growth, Placental Development, and DNA Methylation. Nutrients 13. [DOI] [PMC free article] [PubMed] [Google Scholar]
- Lee JH, et al. , 2017. Parabens Accelerate Ovarian Dysfunction in a 4-Vinylcyclohexene Diepoxide-Induced Ovarian Failure Model. Int J Environ Res Public Health 14. [DOI] [PMC free article] [PubMed] [Google Scholar]
- Li M, et al. , 2021. Healthy dietary patterns and common pregnancy complications: a prospective and longitudinal study. Am J Clin Nutr 114, 1229–1237. [DOI] [PMC free article] [PubMed] [Google Scholar]
- Lindley AA, et al. , 1999. The relationship in neonates between clinically measured head circumference and brain volume estimated from head CT-scans. Early Hum Dev 56, 17–29. [DOI] [PubMed] [Google Scholar]
- Mahmassani HA, et al. , 2021. Maternal diet quality during pregnancy and child cognition and behavior in a US cohort. Am J Clin Nutr [DOI] [PMC free article] [PubMed]
- Makieva S, et al. , 2014. Androgens in pregnancy: roles in parturition. Hum Reprod Update 20, 542–59. [DOI] [PMC free article] [PubMed] [Google Scholar]
- Manuck TA, et al. , 2016. Preterm neonatal morbidity and mortality by gestational age: a contemporary cohort. Am J Obstet Gynecol 215, 103 e1–103 e14. [DOI] [PMC free article] [PubMed] [Google Scholar]
- Markopoulou P, et al. , 2019. Preterm Birth as a Risk Factor for Metabolic Syndrome and Cardiovascular Disease in Adult Life: A Systematic Review and Meta-Analysis. J Pediatr 210, 69–80 e5. [DOI] [PubMed] [Google Scholar]
- McCullough ML, et al. , 2002. Diet quality and major chronic disease risk in men and women: moving toward improved dietary guidance. Am J Clin Nutr 76, 1261–71. [DOI] [PubMed] [Google Scholar]
- Meeker JD, et al. , 2009. Urinary phthalate metabolites in relation to preterm birth in Mexico city. Environ Health Perspect 117, 1587–92. [DOI] [PMC free article] [PubMed] [Google Scholar]
- Messerlian C, et al. , 2018. Preconception and prenatal urinary concentrations of phenols and birth size of singleton infants born to mothers and fathers from the Environment and Reproductive Health (EARTH) study. Environ Int 114, 60–68. [DOI] [PMC free article] [PubMed] [Google Scholar]
- Mitchell EA, et al. , 2017. Birth weight and subsequent body mass index in children: an international cross-sectional study. Pediatr Obes 12, 280–285. [DOI] [PubMed] [Google Scholar]
- Mortensen ME, et al. , 2014. Urinary concentrations of environmental phenols in pregnant women in a pilot study of the National Children’s Study. Environ Res 129, 32–8. [DOI] [PMC free article] [PubMed] [Google Scholar]
- Mudd LM, Evenson KR, 2015. Review of impacts of physical activity on maternal metabolic health during pregnancy. Curr Diab Rep 15, 572. [DOI] [PubMed] [Google Scholar]
- Mustieles V, et al. , 2020. Maternal and paternal preconception exposure to phenols and preterm birth. Environment International 137, 105523. [DOI] [PMC free article] [PubMed] [Google Scholar]
- Natamba BK, et al. , 2016. Concordance between self-reported pre-pregnancy body mass index (BMI) and BMI measured at the first prenatal study contact. BMC Pregnancy Childbirth 16, 187. [DOI] [PMC free article] [PubMed] [Google Scholar]
- NHANES, National Health and Nutrition Examination Survey Data In: N. C. f. H. S. (NCHS), (Ed.). U.S. Department of Health and Human Services, Centers for Disease Control and Prevention, Hyattsville, Maryland, 2013–2014. [Google Scholar]
- NHANES, National Health and Nutrition Examination Survey Data In: N. C. f. H. S. (NCHS), (Ed.). U.S. Department of Health and Human Services, Centers for Disease Control and Prevention, Hyattsville, Maryland, 2015–2016. [Google Scholar]
- Oken E, et al. , 2008. Maternal fish intake during pregnancy, blood mercury levels, and child cognition at age 3 years in a US cohort. Am J Epidemiol 167, 1171–81. [DOI] [PMC free article] [PubMed] [Google Scholar]
- Pacyga DC, et al. , 2021. Maternal phthalate and phthalate alternative metabolites and urinary biomarkers of estrogens and testosterones across pregnancy. Environ Int 155, 106676. [DOI] [PMC free article] [PubMed] [Google Scholar]
- Palatianou ME, et al. , 2014. Long-term metabolic effects of high birth weight: a critical review of the literature. Horm Metab Res 46, 911–20. [DOI] [PubMed] [Google Scholar]
- Philippat C, et al. , 2014. Prenatal exposure to phenols and growth in boys. Epidemiology 25, 625–35. [DOI] [PMC free article] [PubMed] [Google Scholar]
- Philippat C, et al. , 2012. Exposure to phthalates and phenols during pregnancy and offspring size at birth. Environ Health Perspect 120, 464–70. [DOI] [PMC free article] [PubMed] [Google Scholar]
- Philippat C, et al. , 2013. Prenatal exposure to environmental phenols: concentrations in amniotic fluid and variability in urinary concentrations during pregnancy. Environ Health Perspect 121, 1225–31. [DOI] [PMC free article] [PubMed] [Google Scholar]
- Program, N. B., Parabens. In: C. f. D. C. a. Prevention, (Ed.), Biomonitoring Summary, Vol. 2019, 2017. [Google Scholar]
- Pycke BF, et al. , 2015. Maternal and fetal exposure to parabens in a multiethnic urban U.S. population. Environ Int 84, 193–200. [DOI] [PMC free article] [PubMed] [Google Scholar]
- Quiros-Alcala L, et al. , 2018. Parabens and measures of adiposity among adults and children from the U.S. general population: NHANES 2007–2014. Int J Hyg Environ Health 221, 652–660. [DOI] [PMC free article] [PubMed] [Google Scholar]
- Reyes-Lopez MA, et al. , 2021. Diet Quality Is Associated with a High Newborn Size and Reduction in the Risk of Low Birth Weight and Small for Gestational Age in a Group of Mexican Pregnant Women: An Observational Study. Nutrients 13. [DOI] [PMC free article] [PubMed] [Google Scholar]
- Risnes KR, et al. , 2011. Birthweight and mortality in adulthood: a systematic review and meta-analysis. Int J Epidemiol 40, 647–61. [DOI] [PubMed] [Google Scholar]
- Rodríguez-Carmona Y, et al. , 2020. Determinants and characterization of exposure to phthalates, DEHTP and DINCH among pregnant women in the PROTECT birth cohort in Puerto Rico. Journal of Exposure Science & Environmental Epidemiology 30, 56–69. [DOI] [PMC free article] [PubMed] [Google Scholar]
- Rosen ED, Spiegelman BM, 2006. Adipocytes as regulators of energy balance and glucose homeostasis. Nature 444, 847–53. [DOI] [PMC free article] [PubMed] [Google Scholar]
- Rosenfeld CS, 2015. Sex-Specific Placental Responses in Fetal Development. Endocrinology 156, 3422–34. [DOI] [PMC free article] [PubMed] [Google Scholar]
- Rothman KJ, 1990. No adjustments are needed for multiple comparisons. Epidemiology 1, 43–6. [PubMed] [Google Scholar]
- Shin HM, et al. , 2021. Variability of Urinary Concentrations of Phenols, Parabens, and Triclocarban during Pregnancy in First Morning Voids and Pooled Samples. Environ Sci Technol 55, 16001–16010. [DOI] [PMC free article] [PubMed] [Google Scholar]
- Spong CY, 2013. Defining “term” pregnancy: recommendations from the Defining “Term” Pregnancy Workgroup. JAMA 309, 2445–6. [DOI] [PubMed] [Google Scholar]
- Succop PA, et al. , 2004. Imputation of data values that are less than a detection limit. J Occup Environ Hyg 1, 436–41. [DOI] [PubMed] [Google Scholar]
- Talge NM, et al. , 2014. United States birth weight reference corrected for implausible gestational age estimates. Pediatrics 133, 844–53. [DOI] [PubMed] [Google Scholar]
- Tita AT, et al. , 2009. Timing of elective repeat cesarean delivery at term and neonatal outcomes. N Engl J Med 360, 111–20. [DOI] [PMC free article] [PubMed] [Google Scholar]
- Towers CV, et al. , 2015. Transplacental passage of antimicrobial paraben preservatives. J Expo Sci Environ Epidemiol 25, 604–7. [DOI] [PubMed] [Google Scholar]
- Valle-Sistac J, et al. , 2016. Determination of parabens and benzophenone-type UV filters in human placenta. First description of the existence of benzyl paraben and benzophenone-4. Environ Int 88, 243–249. [DOI] [PubMed] [Google Scholar]
- Vandentorren S, et al. , 2011. Bisphenol-A and phthalates contamination of urine samples by catheters in the Elfe pilot study: implications for large-scale biomonitoring studies. Environ Res 111, 761–4. [DOI] [PubMed] [Google Scholar]
- Vargas-Terrones M, et al. , 2019. Impact of exercise during pregnancy on gestational weight gain and birth weight: an overview. Braz J Phys Ther 23, 164–169. [DOI] [PMC free article] [PubMed] [Google Scholar]
- Vernet C, et al. , 2019. An Empirical Validation of the Within-subject Biospecimens Pooling Approach to Minimize Exposure Misclassification in Biomarker-based Studies. Epidemiology 30, 756–767. [DOI] [PMC free article] [PubMed] [Google Scholar]
- Vernet C, et al. , 2018. Within-Day, Between-Day, and Between-Week Variability of Urinary Concentrations of Phenol Biomarkers in Pregnant Women. Environmental Health Perspectives 126, 037005. [DOI] [PMC free article] [PubMed] [Google Scholar]
- Vrijens K, et al. , 2020. Weight and head circumference at birth in function of placental paraben load in Belgium: an ENVIRONAGE birth cohort study. Environ Health 19, 83. [DOI] [PMC free article] [PubMed] [Google Scholar]
- Wasserstein RL, Lazar NA, 2016. The ASA’s Statement on p-Values: Context, Process, and Purpose. American Statistician 70, 129–131. [Google Scholar]
- Watkins DJ, et al. , 2015. Associations between urinary phenol and paraben concentrations and markers of oxidative stress and inflammation among pregnant women in Puerto Rico. Int J Hyg Environ Health 218, 212–9. [DOI] [PMC free article] [PubMed] [Google Scholar]
- Weiss L, et al. , 2015. Temporal variability and sources of triclosan exposure in pregnancy. Int J Hyg Environ Health 218, 507–13. [DOI] [PubMed] [Google Scholar]
- Wen Q, et al. , 2020. Association between urinary paraben concentrations and gestational weight gain during pregnancy. Journal of Exposure Science and Environmental Epidemiology 30, 845–855. [DOI] [PubMed] [Google Scholar]
- Wirth MD, et al. , 2016. Anti-inflammatory Dietary Inflammatory Index scores are associated with healthier scores on other dietary indices. Nutr Res 36, 214–9. [DOI] [PMC free article] [PubMed] [Google Scholar]
- Wu C, et al. , 2017. Maternal urinary paraben levels and offspring size at birth from a Chinese birth cohort. Chemosphere 172, 29–36. [DOI] [PubMed] [Google Scholar]
- Wu C, et al. , 2019. Repeated Measurements of Paraben Exposure during Pregnancy in Relation to Fetal and Early Childhood Growth. Environ Sci Technol 53, 422–433. [DOI] [PubMed] [Google Scholar]
- Ye X, et al. , 2006a. Parabens as urinary biomarkers of exposure in humans. Environ Health Perspect 114, 1843–6. [DOI] [PMC free article] [PubMed] [Google Scholar]
- Ye X, et al. , 2006b. Quantification of the urinary concentrations of parabens in humans by on-line solid phase extraction-high performance liquid chromatography-isotope dilution tandem mass spectrometry. J Chromatogr B Analyt Technol Biomed Life Sci 844, 53–9. [DOI] [PubMed] [Google Scholar]
- Yisahak SF, et al. , 2021. Maternal diet patterns during early pregnancy in relation to neonatal outcomes. Am J Clin Nutr 114, 358–367. [DOI] [PMC free article] [PubMed] [Google Scholar]
- Zhang X, et al. , 2022. Joint associations among prenatal metal mixtures and nutritional factors on birth weight z-score: Evidence from an urban U.S. population. Environ Res 208, 112675. [DOI] [PMC free article] [PubMed] [Google Scholar]
- Zhang Y, et al. , 2021. Prenatal urinary concentrations of phenols and risk of preterm birth: exploring windows of vulnerability. Fertil Steril 116, 820–832. [DOI] [PubMed] [Google Scholar]
- Zhao Y, et al. , 2012. Birth weight and overweight/obesity in adults: a meta-analysis. Eur J Pediatr 171, 1737–46. [DOI] [PubMed] [Google Scholar]
- Zhong Q, et al. , 2020. Association of prenatal exposure to phenols and parabens with birth size: A systematic review and meta-analysis. Sci Total Environ 703, 134720. [DOI] [PubMed] [Google Scholar]
Associated Data
This section collects any data citations, data availability statements, or supplementary materials included in this article.