

Abstract
Single-molecule superresolution microscopy is a powerful tool for the study of biological structures on size scales smaller than the optical diffraction limit. Imaging samples at cryogenic temperatures (77 K) reduces the quantum yield of photobleaching for many fluorescent labels, yielding localization precisions below 10 nm. Cryogenic imaging further enables correlation with cryogenic electron tomography. A key limitation in applying methods such as PALM and STORM to samples maintained at 77 K is the limited number of fluorophores known to undergo efficient turn-on and turn-off mechanisms necessary to control the sparsity of active emitters. We find that mApple, a red-emitting fluorescent protein, undergoes a novel turn-off mechanism in response to simultaneous illumination with two colors of light. This turn-off mechanism enables localization of many individual molecules in initially bright samples, but the final density of localizable emitters is limited by relatively inefficient turn-on (photoactivation). Bulk excitation and emission spectroscopy shows that mApple has access to two distinct emissive states as well as dark states accessible optically or through changes in pH. The bright and stable emission of mApple enables widefield collection of single-molecule emission spectra, which highlight the complex nature and environmental sensitivity of states observed in red fluorescent proteins.
Introduction
Single-molecule-based superresolution microscopy provides a powerful tool for imaging cellular structures with size scales below the optical diffraction limit of ∼250 nm for visible light. In widefield microscopy, specifically labeled biomolecules can be localized with a precision on the order of 10 nm if the concentration of emitters in any given data frame is kept sufficiently low to isolate fluorescence from individual emitters. Over the last two decades, many advances in fluorophore design and imaging methods have provided novel insights into the subdiffraction spatial organizations of a wide range of biological systems at room temperature (RT). Various single-molecule active control microscopy (SMACM) techniques (also referred to as single-molecule localization microscopy, SMLM), such as PALM and STORM, achieve the required low active emitter concentration through a photoactivation or a stochastic blinking mechanism.1,2 The majority of fluorophores in the region of interest (ROI) at any given moment in time are kept in a nonfluorescent “off-state”, while a small number of nonoverlapping molecules in a fluorescent “on-state” can be imaged sequentially to gradually build up a pointillist image of the underlying labeled structure. An extensive palette of fluorophores, including many engineered fluorescent proteins (FPs), has been developed for RT SMACM with different labeling strategies, excitation and emission colors, photostabilities, and photoswitching mechanisms.3−5
Recently, there has been a growing interest in performing superresolution under cryogenic conditions. Cryogenic fluorescence imaging can be performed in a manner amenable for correlation with cryogenic electron tomography (CryoET), combining the benefits of specific labeling in fluorescence microscopy with the high-resolution cellular context provided by electron microscopy.6−8 However, a key limitation continues to be the dearth of fluorophores with access to efficient active control mechanisms required for SMACM within the limits imposed on the optical intensities to prevent damage of the plunge-frozen sample through melting.9 Historically, many initial breakthroughs in single-molecule spectroscopy and imaging were achieved through cooling of rigid organic fluorophores in solid hosts to cryogenic temperatures.10−13 Later, when studies of green fluorescent protein (GFP) introduced FPs as candidates for the in situ labeling of proteins in a wide range of biological systems,14 low-temperature spectroscopy and hole burning studies of GFP mutants provided key insights into the electronic states contributing toward its observed photoswitching behavior.15−19 Understanding of the optical control of this photoswitching was crucial in developing engineered FPs, such as the photoactivatable PA-GFP, establishing the necessary sparsity of active emitters underpinning a wide range of superresolution microscopy techniques relying on single-molecule active control mechanisms.20−23
Single-molecule superresolution imaging requires each emitter to be maintained in an on-state for a sufficient duration (on-time) to allow for the collection of enough photons for precise localization, followed by a return to an off-state to provide sufficient sampling of a large number of emitters within the sample. Active control mechanisms used at RT rely on an intramolecular reaction or even an interaction with a diffusing reaction partner to transition the molecules between these states on a convenient time scale. At cryogenic temperatures, the atomic or molecular motion involved in these on/off mechanisms is hindered by frozen solvent environments and reduced thermal energy. This severely limits the library of labels available for cryogenic SMACM techniques. Small-molecule organic fluorophores in particular seldom undergo the switching reactions for which they were optimized when held in a solid matrix at cryogenic temperatures, but some small-molecule labels have been shown to undergo switching for superresolution under high illumination intensities (∼ kW/cm2) in samples below 10 K.24−26 Fluorescent proteins, as a function of the unique environment of the chromophore within the β barrel, have been shown to have access to some reaction steps under cryogenic conditions, while others are hindered.27 However, there are only very few examples of FPs efficiently undergoing controlled transitions between on- and off-states within the limits posed on sample temperature and optical intensity by the desire for subsequent correlation to cryogenic electron microscopy,6,28,29 and there is as of yet little understanding in the field of how to select or engineer proteins for this purpose.
Two such proteins, PA-GFP and PAmKate, successfully undergo photoactivation with similar efficiency in vitrified samples at 77 K compared to RT experiments and have been used for cryogenic SMACM imaging correlated with CryoET.6,29 Under these low-temperature and low-intensity optical imaging conditions, the reduced rate of photobleaching provides improvements in the attainable localization precision.30 However, the observed long on-times of several minutes can reduce the number of molecules that can be imaged in a single experiment. To progress toward improved superresolution imaging of densely labeled structures, we require access to fluorophores that have both an efficient mechanism transitioning molecules into an emissive state (turn-on) and also a mechanism to return them to a nonfluorescent state (turn-off) within a reasonable time scale. This will allow for the imaging of more densely labeled samples within the limits imposed on the total experimental time set by the increased risk of ice contamination of vitrified samples as they are imaged in open cryostat configurations.
We have found that mApple, a red FP known to undergo complex photoswitching at RT,31 has access at cryogenic temperatures to a turn-off mechanism not present at RT. The mechanism produces a bright-to-dark transition in response to simultaneous 405 and 561 nm light. Switching in response to simultaneous illumination has been reported in other FPs previously at RT and is known as primed conversion.32 This is not unlike previously reported two-color mechanisms of low-temperature photochemistry.33,34 In primed conversion, the reported mechanism is that the readout laser produces a population of emitters in a triplet state that can then be excited again with another wavelength to produce photoswitching.35,36 It is unclear in our case if the intermediate state is a triplet or some other long-lived intermediate stabilized at cryogenic temperatures and detailed assignment of that state is beyond the scope of this work. In this work, we show that mApple can be moved into a dark state with sufficient efficiency to create the required low active emitter concentrations for single-molecule imaging, as well as stochastic and photoactivatable turn-on mechanisms allowing for the subsequent localization of individual emitters. We find that the photophysical processes underlying mApple’s behavior at cryogenic temperature involve multiple electronic ground states capable of efficient fluorescence (on-states) and provide initial insight into the spectral nature of these states. Here the properties of mApple at RT and 77 K are explored using both bulk and single-molecule spectroscopy and microscopy. We also show with single-molecule emission spectra that the photodynamics of these emitters can be quite complex, with switching, spectrally diffusing, and wandering behaviors reminiscent of early single-molecule spectral studies at 2 K.
Experimental Methods
mApple Expression, Purification, and Cell Labeling
mApple-pBAD with an N-terminal 6xHis tag for purification was a gift from Michael Davidson & Nathan Shaner & Roger Tsien (Addgene plasmid # 545366). The expression plasmids were transformed into competent E. coli (NEB C3019). Single colony stocks from LB-Amp plates were inoculated into 5 mL cultures in LB broth and grown overnight before being diluted into 1 L of LB broth. After 7 h of growth, protein expression was induced with 0.01% (w/w) of arabinose overnight at 37 °C. Cells were pelleted at 4000 rpm for 45 min before being frozen at −20 °C. For protein purification, pellets were thawed and resuspended in 20 mL of lysis buffer (50 mM HEPES, 500 mM KCl, 25 mM imidazole, 10% glycerol, 1× Halt protease inhibitor, and Pierce universal nuclease (Thermo Scientific). Cells were lysed by three 4 min passes through an Emulsiflex homogenizer (Avestin), resting on ice for 4 min between passes, and spun down at 15,000g for 1.5 h at 4 °C. The supernatant was incubated with Ni-NTA agarose beads (Thermo Fisher) for 2 h. After binding, the beads were washed five times with wash buffer (50 mM HEPES, 500 mM KCl, 25 mM imidazole, 10% glycerol). The protein was eluted in 30 mL of elution buffer (50 mM HEPES, 500 mM KCl, 275 mM imidazole, 10% glycerol) and dialyzed twice at 4 °C (1 h and overnight) against 1 L of dialysis buffer (50 mM HEPES, 200 mM KCl, 10% glycerol).
Labeled C. crescentus cell strains were generated using a synthesized pXyl-mApple-CreS plasmid (Synbio Technologies) codon-optimized for C. crescentus, containing the mApple gene fused to the CreS gene with a -GGGSGGGS- linker on the pXYFPC-1 backbone.37 The plasmid was transformed into C. crescentus NA1000 cells via electroporation and single colonies were selected after culturing on M2G-kan plates. Expression of the fusion protein construct was confirmed with RT fluorescence microscopy.
Bulk Fluorescence and Absorption Spectra
Samples for bulk spectroscopy were prepared by diluting purified mApple in dialysis buffer pH-adjusted with HCl or KOH, with 50% (v/v) glycerol added for cryogenic experiments to encourage glass formation of the sample upon freezing. RT spectra were collected using commercial UV–vis (Cary 6000i) and fluorescence (Horiba Fluorolog) spectrometers (data in Figure 2). Emission spectra were collected under excitation with 540 nm light and a slit width of 3 nm in the excitation path and 1 nm in the emission path. Excitation spectra were collected based on the emission at 620 nm with a slit width of 1 nm in the excitation path and 3 nm in the emission path. For cryogenic spectra, the sample was placed into a quartz cuvette (Starna 1-Q-2) and loaded into a nitrogen-cooled cryostat (Janis VNF-100) with optical access windows, allowing it to be cooled to 80 K. The sample temperature was maintained just above 77 K with a sample heater in order to prevent condensation of nitrogen vapor within the optical path, which would cause significant scattering from nitrogen boil-off. Absorbance was calculated relative to a blank collected with frozen dialysis buffer with 50% glycerol. Significant constant offsets were observed in spectra even after subtracting this blank, due to small changes in macroscopic ice crystal structure within the sample causing varying amounts of scattering. To correct the baseline of absorbance measurements for this scatter, the signal at 650 nm, where there is no absorbance, was subtracted as a constant offset from the full spectrum.
Figure 2.

RT and cryogenic absorption, excitation, and emission spectra of purified mApple in buffer. (a) Emission and excitation spectra show a slight narrowing of spectral features and a decrease in the Stokes shift upon cooling from RT to 77 K. (b) RT absorption spectra show strong pH dependence, with decreased pH resulting in a red shift of the main absorption feature before a transition to a blue-shifted nonfluorescent state. (c) Cryogenic absorption spectra show significant changes upon even small pH changes within a physiologically relevant range. The shorter-wavelength O-state (O for orange) shows an absorption peak near 568 nm. Decreasing the pH results in the appearance of signal from the longer-wavelength R-state (R for red), with its absorption appearing as a shoulder near 580 nm. (d) Cryogenic excitation and emission spectra at these pH values show emission peaks from the O and R states peaked near 578 and 593 nm, which dominate at pH 8 and 7.3, respectively. Inset shows a closer view of the emission spectra at these pH values showing overlapping signals from two distinct states, with reference lines at 578 and 593 nm. Emission spectra collected at λex = 540 nm. Excitation spectra collected at λem = 620 nm.
Bulk Spectra under Continuous Laser Illumination
In order to measure spectral changes caused by optical pumping, a custom spectrometer was designed to combine multiple laser lines at the sample plane within the optical access cryostat described above (data in Figure 3). For absorption measurements in this bespoke setup, white light from a halogen lamp (ThorLabs OSL2, with OSLFOC2 collimator and FGT165M filter) was focused onto a small spot (d ∼ 1.5 mm) on the sample, and the transmitted light was imaged through a grating spectrometer (Acton SpectraPro 2150i, 150g/mm) onto a camera (IDS uEye UI-3270CP Rev. 2) to record the spectral information along one axis. The wavelength axis was calibrated using the sharp absorption features of a piece of holmium glass placed at the sample plane (Hellma 666F1-339). For fluorescence spectra from laser excitation, a 561 nm laser (Crystalaser) was aligned to coincide with and fill the sample area defined by the white lamp’s spot size at the sample plane. Fluorescence light was collected with the same lenses used to collect transmitted white light and imaged onto the same detector. For continuous illumination experiments, a 405 nm laser (Coherent Obis) was coaligned onto the same spot. OD filters placed between the sample and the detector were used to attenuate the fluorescence under intense illumination as needed to prevent saturation of the detector. Calibration of the wavelength axis for emission spectra was confirmed by measuring the sharp lines of a HeNe discharge light source held at the sample plane. Shutters in the path of each of the three light sources allowed for control of the continuous illumination as well as intermittent collection of absorption spectra by blocking the laser lines to prevent their bright scattered light from obscuring the absorption measurement. No significant fluorescence signal was observed from 405 nm pumping alone, but intermittent fluorescence spectra were collected with the 405 nm laser shuttered to prevent any emission generated from 405 nm illumination from affecting the experiment.
Figure 3.

Bulk cryogenic spectroscopy showing photoinduced changes in mApple emission. (a) Time-dependent change in fluorescence intensity over 580–640 nm under 561 nm excitation of purified mApple in buffer with 50% glycerol measured in the bulk phase in three experiments using a custom cryogenic spectrometer. Continuous illumination with 561 nm (black line) does not result in significant photobleaching. Continuous illumination with 405 nm light with intermittent 561 nm readout (purple dots) also shows no change. Joint continuous illumination with both 405 and 561 nm (blue line) shows the same enhanced turn-off behavior previously observed under the microscope (Figure 1b). (b) Emission spectra (left) of purified mApple at different time points along the experiment represented by the blue line in (a), and difference spectra showing the change in fluorescence intensity as a function of wavelength by subtracting the spectrum measured at t = 0 (right). The two peaks belonging to the O and R states show different rates of change in response to joint 405 and 561 nm illumination, with the O state decaying more significantly, while loss of signal from the R state diminishes after the first few hours of the experiment.
Cryogenic Microscopy Sample Preparation on Electron Microscopy Grids
For cryogenic microscopy on grids, bacterial cells were cultured at 37° in LB broth (for E. coli) or 28 °C in PYE (for C. crescentus). After induction for 2–5 h with 1% arabinose (for E. coli) or 0.3% xylose (for C. crescentus), samples were prepared by plunge-freezing into liquid ethane (Gatan Cp3) onto electron microscopy grids (EMS QUANTIFOIL). After plunge-freezing, samples were stored in liquid nitrogen for at least 24 h to allow any ethane frozen on top of the sample to sublimate before being imaged.
Cryogenic Fluorescence Imaging
Samples maintained in liquid nitrogen were loaded into a cryogenic microscopy stage (Linkam CMS196) mounted onto a home-built upright widefield epifluorescence microscope with an air objective (Nikon CFI TU Plan Apo 100×/NA0.9) as previously described.7 Fluorescence emission between 580 and 640 nm was collected through a dichroic mirror (Chroma ZT405/488/561rpc) and filters (Semrock FF01-607/70-25 and Chroma ZETE561NF) before detection with a silicon-based EMCCD camera (Andor iXon DU897) using integration times of 0.2–1 s and multiplication gains of 1–300 depending on cell brightness. The multiplication gain and conversion gain of this camera were carefully calibrated to be able to convert camera counts to detected photons per second before further analysis.38 For single-molecule imaging, a cylindrical lens (f = 1 m) was placed in the emission path to generate an astigmatic point spread function. This allowed for live correction in response to z-drift of the sample on the cryogenic stage during long experiments. For carbon-coated electron microscopy grids, the total peak intensity of 405 + 561 nm light was kept below 50 W/cm2. For gold grids (EMS AuFoil), the total peak intensity was kept below 200 W/cm2. For silver grids,9 the total peak intensity was kept below 1 kW/cm2.
Cryogenic Single-Molecule Spectroscopy
In order to collect single-molecule spectra, dilute samples of purified mApple in buffer were plunge-frozen onto electron microscopy grids and loaded onto the bespoke microscope described above. In order to collect more of the blue edge of mApple’s emission spectrum, at the cost of worsened suppression of the laser light, the emission filters featured a more blueshifted passband enabling collection from 572 to 640 nm (Chroma T5665LPXR dichroic mirror, 2× Semrock FF01-607/70-25, Chroma ET605/70m). The emission was spectrally resolved using a diffraction grating (ThorLabs GT13-03) placed in front of the camera as described previously.39 The spatial illumination profile size was reduced such that the zeroth and first-order diffraction spots could both be imaged on the same camera without overlap. Each emitter’s location in the zeroth-order image could then be matched to its spectrum in the first-order image, with the distance between the zeroth and first-order diffraction for each emitter being a function of the emission wavelength. The wavelength-dependent separation was calibrated by imaging light from Ar and Ne pen lamps through a small pinhole to simulate a point source.
Analysis of Single-Molecule Microscopy Data for Fluorophore Characterization
The single-molecule analysis workflow used in this work prioritized the confident detection of signal from single emitters over the density of localizations in order to prevent errors from multiemitter overlap or overcounting of molecules emitting during many frames. C. crescentus cells expressing mApple-CreS were induced sparsely to provide tens of emitters along each cell body and plunge-frozen on gold UltrAuFoil grids (EMS), which showed reduced fluorescence from the substrate compared to carbon-coated Quantifoil grids and benefitted from a higher intensity threshold before sample devitrification.9 The initially bright cells were simultaneously illuminated with 405 and 561 nm light with an intensity ratio of 2:1 for 30–90 min in order to turn off a sufficient number of mApple emitters to reach the required low concentration of active emitters for single-molecule localization. Fluorescence emission under 561 nm illumination with a peak intensity of 40 W/cm2 integrated over 1 s frames was collected, with occasional periods of reactivation by switching to 80 W/cm2 405 nm illumination when the density of bright emitters was depleted. Using custom MATLAB code, all fluorescence data sets were corrected for lateral drift using cross-correlation and subsequently binned into 2 s frames to reduce data volume and improve the signal-to-noise ratio. In order to identify emission events showing clear single-step turn-on and turn-off events and thus representing single molecules, the final frame of the data set was subtracted from the full data set in order to remove static background from cellular and substrate autofluorescence. Localizations were manually screened by plotting the time-dependent intensity trace integrated over a 5 × 5 pixel (800 × 800 nm) ROI around the brightest pixel and selecting only those emission events showing clear single-step turn-on and turn-off events. After this selection, each molecule’s signal was determined based on the raw data (without having subtracted the final frame) by averaging the on-frames of each ROI during each identified single-molecule event, and the background signal was calculated by averaging frames of constant intensity immediately preceding or following the single-molecule event (in order to capture any time-varying background caused by overlapping emission from other mApple emitters in or near the ROI). During the process of manual identification of single emitters, the signal over background of each ROI was visualized for each event to refine the selection to those emission events clearly stemming from single molecules centered within the ROI. In order to characterize mApple as a fluorophore at 77 K, this process of finding clear on-times based on intensity traces in the final-frame-subtracted data set, calculating the effective signal, and saving those cases belonging to single emitters was repeated 500 times to find 500 candidate molecules from a single data set. Pixelated molecular PSFs were fit using a nonlinear least-squares fit to a 2D Gaussian model function, and the localization precision of each molecule was calculated as the standard error of the mean of the calculated center positions of all collected frames for that molecule. Total photons collected from each molecule were calculated from the integrated signal during its on-time after subtracting the integrated background intensity identified over the same ROI. This analysis pipeline is more labor-intensive than previous workflows,29 but does more to avoid overcounting the number of emitters.
Results and Discussion
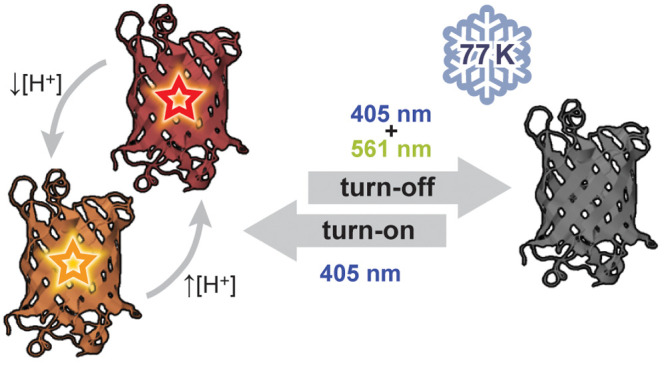
mApple (Figure 1a) is a red-emitting FP derived from Discosoma sp. initially developed via directed evolution of mOrange in search of more photostable red FPs.31 The chromophore of mApple is formed from condensation of MYG amino acids. The chromophore undergoes complex photoswitching behavior at RT, reversibly transitioning between on- and off-states in response to illumination with blue light.31 Judged to have complex photophysics, mApple has not been extensively utilized at RT as a single-molecule label. We set out to investigate its cryogenic behavior in hopes that its complex photophysics would enable greater control over its emission. We find that cooling the protein to cryogenic temperatures significantly changes both its bulk spectral characteristics and the observed single-molecule switching behavior. The reduced thermal energy and conformationally restricted frozen environment affect the accessible potential energy surface of the chromophore, resulting in distinct behaviors in response to optical illumination in the different temperature regimes. As a test sample to illustrate, E. coli cells cytosolically expressing mApple were rapidly brought to liquid nitrogen temperatures via plunge-freezing in liquid ethane40 and then imaged at 77 K using a cryogenic microscopy stage (see Experimental Methods). At 77 K, mApple shows a slower but nonzero rate of photobleaching under continuous readout illumination with 561 nm light, and we find that photoactivation in response to illumination with only 405 nm light is conserved (Figure 1b). However, unlike at RT, attempting to perform 405 nm photoactivation in the simultaneous presence of 561 nm light, intended for fluorescence readout, results in a net loss of fluorescence intensity. This suggests that mApple has access to a potentially useful turn-off mechanism needed to increase the number of individual fluorophores that can be imaged at cryogenic temperatures within a reasonable experimental time scale.
Figure 1.

Observed photophysical behavior of mApple. (a) RT excitation (dashed) and emission (solid) spectra of purified mApple in buffer. mApple is a red FP amenable for imaging with 561 nm light (green line) previously shown to be reversibly photoswitchable in response to 405 nm light (blue line). The inset shows the cis form of the MYG chromophore, but its isomerization state in mApple is not known. (b) Fluorescence intensity traces averaged over the volume of several E. coli cells expressing mApple in their cytosol, showing the change in intensity in response to periods of 405 nm illumination alone (left) or in combination with 561 nm illumination (right). At RT (top), short periods of 405 nm illumination result in an increase of fluorescence intensity (red arrows), both in the absence and presence of simultaneous 561 nm readout illumination. At 77 K (bottom), some photoactivation is observed under isolated 405 nm illumination, but surprisingly, the fluorescence intensity decreases in response to simultaneous 405 and 561 nm illumination. Green and blue bars indicate illumination with 561 and 405 nm light, respectively. Black dashed lines indicate frames acquired while lasers were being switched on or off.
In order to investigate the spectral features of mApple contributing to the unusual turn-on and turn-off behavior, we measured fluorescence and absorption spectra of purified mApple in the bulk phase both at RT and at 77 K. The fluorescence spectra of purified mApple in buffer (Figure 2a) upon freezing show a slight narrowing of spectral features and clearer resolution of vibronic sidebands as well as an apparent reduction in the Stokes shift analogous to that seen in other FPs.29 At RT, we find that the absorption spectrum of mApple is strongly dependent on pH (Figure 2b), with a decrease in pH resulting both in a gradual redshift of the main absorption feature (λmax,A = 570 nm at pH 8.7, 582 nm at pH 4.3) and ultimately a transition to a distinct blue-absorbing state (λmax,A ∼ 435 nm), with a clear isosbestic point at 480 nm. Exploring the effect of small pH changes near the physiological range at 77 K shows that these absorption changes are resolved into distinct features (Figure 2c), with a decrease in pH from 8 to 7.3 resulting in the appearance of an absorption shoulder near 585 nm. The cryogenic fluorescence spectra (Figure 2d) show a 580 nm feature appearing in the excitation spectrum. Correspondingly, there is the appearance of a red-shifted signal in the emission spectrum. We refer to this red-shifted state present at lower pH as “R” (λmax,ex:R ∼ 580 nm, λmax,em:R ∼ 593 nm), and the orange-emitting state dominating at higher pH as “O” (λmax,ex:O ∼ 568 nm, λmax,em:O ∼ 578 nm). Two-dimensional cryogenic excitation and emission spectra (Figure S1) further show these spectral shifts in response to changes in pH.
Several Discosoma sp. FP variants have previously shown to be sensitive to pH in their emission. For example, this behavior enabled the development of pHuji, a pH-sensing variant of mApple with a single point mutation shifting the chromophore pKa.41 As the pH is decreased, a larger fraction of the pHuji chromophores become protonated at the phenol site, forming the nonfluorescent neutral state, which corresponds to the absorption peak observed at 435 nm. Most reported work using related pH sensors involves tuning of the total fluorescence intensity by transitioning from the anionic to neutral state. Little focus has been placed on more subtle changes in the peak wavelength of absorption or emission. Behavior such as the initial gradual redshift in the absorption peak observed in mApple between pH 8 and 4 before the stark change in intensity upon population of the nonfluorescent protonated state, as well as the presence of multiple distinct emissive states observed upon freezing, has not previously been reported for any FPs in this family. This highlights the surprising degree of complexity of mApple’s behavior that can be observed at cryogenic temperatures. In mApple, both the O and R states are fluorescent, and their absorption is significantly red-shifted from the neutral form’s 435 nm absorption peak, suggesting that they are two distinct anionic forms of the MYG chromophore. Previous work exploring the RT photophysics of R-GECO1, which is a Ca2+ indicator containing a circularly permuted copy of mApple fused to a calcium binding domain,42 has shown it to also have access to two fluorescent states at RT, though the more blueshifted state (λmax,em = 545 nm) is only observed in response to 405 nm photoactivation. It has been proposed that this blueshifted state is the trans isomer of the MYG chromophore.43
After discovering the presence of the distinct O and R states and their sensitivity to pH, we set out to extend our spectral studies of purified mApple in the bulk phase to measure changes in the protein’s fluorescence in response to optical pumping. Purified mApple molecules in buffer with 50% glycerol were loaded into a custom fluorescence spectrometer, enabling the collection of emission and absorption spectra at cryogenic temperatures during continuous illumination with 405 and 561 nm light. Even at the lower illumination intensities achievable in this experimental geometry, and in the distinct solvent environment of purified protein in buffer compared to protein in frozen cells, the key behavior was shown to be consistent: joint illumination with 405 and 561 nm light results in enhanced fluorescence turn-off (Figure 3a). Emission spectra recorded at different time points during this experiment show that the loss of fluorescence intensity is not evenly distributed between the O and R states: The O state undergoes turn-off to a larger extent than the R state, evidenced by a greater loss of fluorescence on the blue side of the emission spectrum (Figure 3b). This suggests that while both of the emissive ground states have access to a turn-off mechanism under joint 405 and 561 nm illumination, their access to this “off-switch” does not occur with the same kinetics. During these experiments, the absorption spectra changed much less significantly in either shape or amplitude than the emission spectra (Figure S2), suggesting that the loss of fluorescence intensity is caused by transition to a state with a similar absorption spectrum but reduced fluorescence quantum yield. The lack of observed change in absorption suggests that the “dark” state(s) of the chromophore formed in response to joint 405 and 561 nm illumination does(do) not entail a significant chemical change to the chromophore. Instead, the bright O and R states likely transition to a quenched state where absorbed energy instead is lost through nonradiative pathways.
mApple’s access to this turn-off mechanism makes it possible to perform cryogenic SMACM experiments with a similar workflow to many RT STORM experiments: Cells expressing mApple fusion constructs initially containing many emitters in an on-state at too high a local emitter concentration for single-molecule localization can be “bleached down” by shelving most emitters in the quenched dark state until the remaining concentration of emitters in the bright O and R states is sufficiently low for single-molecule imaging. This process can be performed under conditions amenable to subsequent cryogenic electron microscopy. In order to characterize mApple as a fluorophore for cryogenic SMACM within these experimental constraints, C. crescentus cells were induced to express a fusion construct of mApple with CreS, a filament-like protein running along the ventral side of each C. crescentus cell and responsible for their curved shape,44 at sufficient concentration to provide an initial concentration of tens of bright emitters in each cell (Figure 4a). After 1 h of simultaneous illumination with 405 and 561 nm, single emitters could be identified, and further joint illumination showed the digital single-step nature of the turn-off events (Figure 4b). These results show that the loss of fluorescence intensity in the bulk phase stems from a transition to a dark (off) state, not a dimmer state or a difference in intensity between the O and R states. Continuous imaging with 561 nm light shows blinking of individual mApple molecules (Figure 4c). Plotting the integrated intensity in a 5 × 5 pixel area around each molecule shows clear single-step turn-on and turn-off events with a broad distribution of on-times for different molecules (Figure 4d). While joint illumination consistently results in eventual turn-off of mApple emitters, 405 nm illumination alone does result in some reactivation, analogous to the photoswitching behavior observed at RT (Figure 4c).
Figure 4.

Cryogenic single-molecule turn-on and turn-off events of mApple emitters in situ observed with fluorescence microscopy. (a) C. crescentus cells expressing mApple-CreS under sparse induction conditions initially show too many overlapping emitters for single-molecule localization. (b) After extended joint 405 and 561 nm illumination, cells are dimmer under 561 nm readout and single emitters are visible (left). Adding 405 nm illumination shows increased cellular autofluorescence, above which single emitters (outlined in red) can be seen to turn off after periods of joint illumination (middle two panels). Returning to 561 nm only readout shows the loss of signal from these emitters (right). (c) Continued 561 nm readout shows some stochastic on- and off-blinking of single emitters within the same ROI. Illumination with 405 nm light causes photoactivation (turn-on) of some emitters (outlined in light blue), with their emission apparent under subsequent 561 nm readout. (d) Representative intensity traces of some single-molecule emitters from this ROI, highlighted in yellow in panel (c), show a wide range of on-times between different molecules with clear single-molecule turn-on and turn-off steps. (e) Mean fluorescence intensities averaged over several cells in one ROI show photoactivation in response to 405 nm illumination. Dashed lines indicate the fluorescence intensity immediately after return to 561 nm readout. The extent of reactivation (red arrow) varies as a function of 405 nm illumination intensity and duration. (f) Repeating this experiment with different periods of 405 nm illumination over several different fields of view reveals the turn-on response as a result of different periods of time normalized to the response measured in that FOV after 60 s of illumination (to correct for differences in the number of emitters captured in each ROI). The extent of reactivation increases with longer periods of 405 nm illumination, but with a sublinear response that matches a saturable absorber model (dotted line). Controls in which the 561 nm readout was paused without addition of the 405 nm laser do not show a turn-on response due to dark recovery alone (data not shown). Panels a–c show images with color scale ranging from 0 (black) to 100 (white) photons/s per pixel. Bars under each panel indicate whether the 405 nm (blue) and/or 561 nm (green) laser were illuminating the sample during the acquisition of the pictured frame. Timestamps are h:mm.
Observing the turn-on and turn-off behavior at the single-molecule level enables refreshing the supply of bright emitters in a sequential imaging method in order to increase the total number of emitters imaged. The extent of reactivation can be characterized by recording the integrated intensity of several C. crescentus cells containing many mApple molecules before and after periods of 405 nm illumination (Figure 4e) and finding the difference between the frames immediately preceding and following the 405 nm illumination period (red arrows). Repeating this analysis over multiple regions of interest with different reactivation time periods and correcting for differences in the number of mApple molecules present in different fields of view by normalizing to the response to 60 s of 405 nm reactivation enables quantification of the photoactivation dosage response. Our analysis shows that the overall response correlates positively but sublinearly with the 405 nm dose in a manner well described by fitting to a saturable absorber model (Figure 4f, see Supporting Information). 405 nm light in isolation thus provides a tunable on-switch to maintain the concentration of bright mApple emitters during single-molecule experiments. However, compared to the previously used PAmKate, this photoactivation pathway in mApple appears to be very inefficient–only a small fraction of initially active emitters can be recovered to an “on” state after initial bleach-down, even when using the increased optical intensities recently made possible by advanced metallic sample substrates (Figure S4).9
The characterization of single emitters in data sets such as those collected with this low-intensity cryogenic imaging technique is often complicated by the overcounting of emitters, which occurs when molecules remain in a bright state and are localized in a large number of frames. This can be addressed by pooling the photons over many frames, but there can be an additional complication arising from overlapping emitters. In an effort to more carefully characterize single mApple fluorophores for cryogenic SMACM and to measure representative parameters such as the average on-time and localization precisions of individual emitters, we prioritized certainty that a given localization event does stem from a single unique mApple molecule over maximizing the count of emitter candidates; overlapping emitters were not included in the analysis. Based on this analysis, when imaged with a peak 561 nm readout intensity of only 40 W/cm2, mApple can be localized with a median 7.6 nm localization precision (Figure 5a). This improvement in localization precision compared to that attainable with PAmKate in previous studies29 stems in part from the improved photon budget of mApple, with a median of more than 40,000 photons collected from each molecule over the duration of their minutes-long on-times (Figure 5b–d). These parameters are very promising for mApple as a fluorophore for cryogenic SMACM, providing a bright and long-lasting single-molecule emitter in a spectral range benefiting from low cellular background in many biological systems. However, the experimental limits on total acquisition time within the cryogenic fluorescence microscope pose a challenge in localizing a high density of emitters after the extended “bleachdown” stage required to reach the single-molecule level coupled with the inefficient photoactivation and long on-times. Future work is required to develop this method’s utility further both in terms of label photophysics, in order to understand how the turn-off mechanism accessible to mApple can be coupled with other convenient features such as a more optimal photoactivation mechanism where the initial concentration of emitters in a bright state is low; and also in terms of engineering challenges, enabling longer imaging times and higher illumination intensities by designing different cryostage and sample geometries.
Figure 5.

Cryogenic characterization of mApple’s fluorescence characteristics based on identified single-molecule events in C. crescentus cells expressing mApple-CreS. (a) Localization precisions calculated as the standard error of the mean from repeated localizations of the same emitter in subsequent frames. (b) Total photons collected from single mApple molecules during each distinct on-time. A small fraction of fluorophores show very long on-times and allow for the collection of hundreds of thousands of photons from a single “on” event. (c) Emission rates characterized as the number of photons collected per second with a peak illumination intensity of 50 W/cm2. (d) On-times calculated as the time difference between clear single-molecule turn-on and turn-off events under 561 nm illumination only.
In order to further explore the nature of the optically induced spectral changes of mApple, we performed cryogenic single-molecule emission spectroscopy.39,45,46 mApple’s bright and persistent fluorescence at 77 K enabled the collection of emission spectra of single FP emitters with an integration time of 500 ms and a spectral resolution of ∼6 nm. Waterfall plots representing the time evolution of observed spectra of single mApple molecules over time show the spectral behavior of individual emitters, which were found to be characterized by three common types of behavior (Figure 6a). Type I molecules show a stable emission spectrum peaked near 580 nm, matching the expected spectrum belonging to the O state observed in bulk spectra described previously (Figure 2d). With rare exception, however, the corresponding behavior expected of the R state showing a similarly narrow stable emission feature near 595 nm was not observed. Instead, Type II molecules show stable emission spectra peaked near 595 nm, but with broader peaks than those seen in Type I. Time-averaged single-molecule spectra (Figure 6b) clearly show the difference between Type I molecules (black) corresponding to the expected emission spectrum for the O state, while the emission spectrum of Type II molecules (green) is red-shifted and broadened. Each of these spectra belongs to a single bright mApple molecule, as evidenced by the single-step turn-on and turn-off events captured for several molecules during the spectrally resolved data acquisition (Figure 5c). In addition to these two behaviors, a significant number of molecules show Type III behavior, where the observed emission peak wavelength changes over time more slowly in a very stochastic fashion. This spectral diffusion effect has previously been recorded in many other single-molecule spectroscopic studies of small-molecule fluorophores and is a sign that the chromophore emission wavelength is sensitive to small fluctuations in its host environment.45 Because this spectral diffusion can occur in a number of forms (from gradual wandering to distinct jumps in emission peaks) and also over a wide range of time scales based on unique molecule-environment interactions, it seems likely that the broad Type II emission behavior in fact stems from the same electronic state as Type III. In Type II cases, the spectral diffusion is occurring faster than the experimental time scale and thus captured as an overall broadening of the measured emission spectrum. This suggests that in the case where mApple molecules are purified and plunge-frozen in amorphous ice on an electron microscopy grid, both the O and R states remain fluorescent, but molecules in the R state are more sensitive to interactions with their local environment, thus resulting in broad or diffusing spectra (Type II-R and III-R) compared to the stable spectra observed in the O state (Type I-O). This is consistent with the presence of two states in the bulk cryogenic spectra.
Figure 6.

Time dependence of single-molecule emission spectra of purified mApple at cryogenic temperatures showing heterogeneous behavior. (a) Representative spectra of single mApple molecules presented as a waterfall plot show distinct behaviors. Type I molecules show emission matching that expected of molecules in the O state from bulk experiments. Type II and III molecules show red-shifted emission as expected from the R state in bulk experiments, but with a perceived broadening of the emission spectrum likely due to spectral diffusion occurring faster than the experimental time scale (II) or steplike changes in the emission peak occurring slowly (III). Guiding lines at 580, 595, and 620 nm highlight the connection of these emissive states to the O and R states observed in bulk measurements. (b) Average emission spectra of several molecules demonstrating type I (black) and II (green) behavior. (c) A representative sharp single-step turn-on event shows that these spectral traces stem from the emission of single emitters. (d) Integrated intensity of molecule in panel (c) as a function of time.
A range of possibilities exist for the natures of the O and R emissive states as well as the dark state(s), which can be reached both through changes in pH and through optical pumping. Changes of protonation states of residues in the proteins’ β barrel close to the chromophore have been shown to affect the wavelength of the emission of red FPs. For example, the glutamic acid residue at position E220 (numbered relative to mOrange) has been shown to contribute to a blueshift in mCherry and mStrawberry upon deprotonation at high pH and is implicated in the presence of a transient dark state at RT.47,48 Changes in the protonation state or mutations of these barrel residues often cause spectral shifts coupled with effects such as changes in brightness and lifetime of FPs in a complex manner, making it challenging to control all of these parameters in tandem.49 Alternatively, the two emission states may correspond to trans and cis isomers of the MYG chromophore; the reorganization to the cis isomer would result in different interaction sites between the chromophore and the β barrel, resulting in different sensitivities to the environment based on which sites on the β barrel are more directly coupled to the amorphous ice host outside of the protein barrel. In many cases, isomerization of the chromophore results in loss of fluorescence emission and large spectral shifts, but there are some examples of red FP chromophores where both the cis and trans form are fluorescent.50 Because of the high degree of sensitivity to the environment seen in our single-molecule spectra, it is reasonable that the exact nature of the behavior shown in Figure 6 is highly dependent on the environment in which mApple molecules are solvated and how they are frozen. We hope that these experiments will serve to highlight the complexity of states present in these red FPs and their sensitivity to small changes in their environment as well as the power of single-molecule spectroscopy in exploring such behavior.
Conclusions
In this work, we have described a fluorophore in which the active control mechanisms necessary to control emitter sparsity for SMACM are distinctly different between RT and 77 K. Access to a two-color turn-off mechanism provides significant leverage in controlling fluorophores to localize single molecules at a higher rate than possible in previous experiments. This is crucial in our advancement toward higher label densities required to achieve the sampling density needed for true superresolution imaging at cryogenic temperatures. Spectroscopic investigation of the contributions leading to the switching behavior seen in imaging experiments revealed a surprising degree of complexity of the underlying states present in mApple. Two distinct emissive states are present in an equilibrium affected by the sample pH at the time of freezing. The population of these states and their response to optical illumination are sensitive to the molecules’ local environment. It may be possible in future experiments to utilize these two emissive forms to achieve an increase in the ability to distinguish overlapping emitters or provide local environmental information.51
While mApple’s access to a novel turn-off mechanism among cryogenic fluorophores presents one solution to one of the technique’s key challenges, we found that the efficiency of the turn-on mechanism induced by isolated 405 nm illumination was insufficient to localize a large number of emitters within a single diffraction-limited volume, as most molecules were not recoverable from the dark state after the initial bleachdown. The challenge of high-quality superresolution imaging will require further investigation into whether the enhanced two-color turn-off can be replicated in different fluorophores which also have an efficient turn-on mechanism. With this work, we hope to show that the low-temperature photophysics of red FPs remains mostly unexplored. There is growing investigation in the literature today into the complex RT photophysics and photochemistry of many other red FPs,52−54 with RT studies showing complex photoswitching mechanisms involving isomerizations, photoreductions, and proton transfers in both the ground and excited states.55−61 Many red FPs have significant structural similarities to mApple, and it is likely that behavior such as the optically induced turn-off and the presence of multiple distinct emissive states will be found in other related proteins in the future. However, an understanding of the connection between the observed two-color turn-off behavior and the range of states accessible to mApple will require further mechanistic and computational effort. More deliberate study and development of fluorophores with low-temperature imaging in mind will be an important contribution.
As the library of fluorophores compatible with cryogenic SMACM grows, we hope that further insight on the complexity of different FPs’ behaviors under cryogenic conditions will offer a starting point for the rational design or selection of fluorophores. Features of red FPs such as their commonly observed “flickering” or photoswitching behaviors and reduced photostabilities compared to EGFP, which pose a challenge for RT imaging, present exciting avenues for new mechanisms of active control at cryogenic temperatures, where the overall reduction in photobleaching means that the primary challenge in fluorophore design is not photostability but access to efficient switching mechanisms. We hope that future work in this field will advance our understanding of the photochemical nature of these proteins far enough to allow for the development of new fluorophores combining properties such as the off-switch accessible to mApple with convenient parameters, such as the initial high population of the dark state observed in photoactivatable FPs. Together with technological advancements in fluorescence imaging and substrate design, this will be instrumental in the development of improved cryogenic superresolution imaging.
Acknowledgments
We thank Dr. Srijit Mukherjee for useful discussions and Prof. Lucy Shapiro for loan of selected molecular biology apparatus and bacterial strains. This work was supported in part by the National Institute of General Medical Sciences grant no. R35GM118067 (W.E.M.). A.M.S. was supported in part by the William and Lynda Steere Bio-X Stanford Interdisciplinary Graduate Fellowship. D.D.P. was supported by a Stanford Graduate Fellowship. P.D.D. was supported in part by the Panofsky Fellowship at the SLAC National Accelerator Laboratory as part of the Department of Energy Laboratory Directed Research and Development program under contract DE-AC02-76SF00515 and by grant 2021-234593 from the Chan Zuckerberg Initiative DAF, an advised fund of Silicon Valley Community Foundation.
Supporting Information Available
The Supporting Information is available free of charge at https://pubs.acs.org/doi/10.1021/acs.jpcb.2c08995.
Cryogenic 2D fluorescence spectra of mApple (Figure S1), cryogenic absorption spectra under joint 561 and 405 nm illumination (Figure S2), cryogenic absorption and emission spectra under 561 nm illumination alone (Figure S3), turn-off rate under high-intensity joint 561 and 405 nm illumination (Figure S4), mApple peptide sequence, model function used to fit response to 405 nm photoactivation (PDF)
Author Contributions
Sample preparation, imaging, and spectroscopy data were obtained by A.M.S. D.D.P. provided the apparatus for microscopic spectral measurements. P.D.D. and W.E.M. supported and supervised the research. The manuscript was written through contributions of all authors. All authors have given approval to the final version of the manuscript.
The authors declare no competing financial interest.
Special Issue
Published as part of The Journal of Physical Chemistry virtual special issue “Early-Career and Emerging Researchers in Physical Chemistry Volume 2”.
Supplementary Material
References
- Patterson G.; Davidson M.; Manley S.; Lippincott-Schwartz J. Superresolution imaging using single-molecule localization. Annu. Rev. Phys. Chem. 2010, 61, 345–368. 10.1146/annurev.physchem.012809.103444. [DOI] [PMC free article] [PubMed] [Google Scholar]
- Möckl L.; Moerner W. E. Super-resolution microscopy with single molecules in biology and beyond - essentials, current trends, and future challenges. J. Am. Chem. Soc. 2020, 142, 17828–17844. 10.1021/jacs.0c08178. [DOI] [PMC free article] [PubMed] [Google Scholar]
- Davidson M. W.; Campbell R. E. Engineered fluorescent proteins: innovations and applications. Nat. Methods 2009, 6, 713–717. 10.1038/nmeth1009-713. [DOI] [PubMed] [Google Scholar]
- Zhou X. X.; Lin M. Z. Photoswitchable fluorescent proteins: ten years of colorful chemistry and exciting applications. Curr. Opin. Cell Biol. 2013, 17, 682–690. 10.1016/j.cbpa.2013.05.031. [DOI] [PMC free article] [PubMed] [Google Scholar]
- Lelek M.; Gyparaki M. T.; Beliu G.; Schueder F.; Griffie J.; Manley S.; Jungmann R.; Sauer M.; Lakadamyali M.; Zimmer C. Single-molecule localization microscopy. Nat. Rev. Methods Primers 2021, 1, 39. 10.1038/s43586-021-00038-x. [DOI] [PMC free article] [PubMed] [Google Scholar]
- Chang Y. W.; Chen S.; Tocheva E. I.; Treuner-Lange A.; Lobach S.; Sogaard-Andersen L.; Jensen G. J. Correlated cryogenic photoactivated localization microscopy and cryo-electron tomography. Nat. Methods 2014, 11, 737–739. 10.1038/nmeth.2961. [DOI] [PMC free article] [PubMed] [Google Scholar]
- Dahlberg P. D.; Saurabh S.; Sartor A. M.; Wang J. R.; Mitchell P. G.; Chiu W.; Shapiro L.; Moerner W. E. Cryogenic single-molecule fluorescence annotations for electron tomography reveal in situ organization of key in Caulobacter. Proc. Natl. Acad. Sci. U. S. A. 2020, 117, 13937–13944. 10.1073/pnas.2001849117. [DOI] [PMC free article] [PubMed] [Google Scholar]
- Dahlberg P. D.; Moerner W. E. Cryogenic super-resolution fluorescence and electron microscopy correlated at the nanoscale. Annu. Rev. Phys. Chem. 2021, 72, 253–278. 10.1146/annurev-physchem-090319-051546. [DOI] [PMC free article] [PubMed] [Google Scholar]
- Dahlberg P. D.; Perez D.; Hecksel C. W.; Chiu W.; Moerner W. E. Metallic support films reduce optical heating in cryogenic correlative light and electron tomography. J. Struct. Biol. 2022, 214, 107901. 10.1016/j.jsb.2022.107901. [DOI] [PMC free article] [PubMed] [Google Scholar]
- Moerner W. E.; Kador L. Optical detection and spectroscopy of single molecules in a solid. Phys. Rev. Lett. 1989, 62, 2535–2538. 10.1103/PhysRevLett.62.2535. [DOI] [PubMed] [Google Scholar]
- Moerner W. E. Fundamentals of single-molecule spectroscopy in solids. J. Lumin. 1994, 60-61, 997–1002. 10.1016/0022-2313(94)90330-1. [DOI] [Google Scholar]
- Orrit M.; Bernard J.; Personov R. I. High-resolution spectroscopy of organic molecules in solids: from fluorescence line narrowing and hole burning to single molecule spectroscopy. J. Phys. Chem. 1993, 97, 10256–10268. 10.1021/j100142a003. [DOI] [Google Scholar]
- Moerner W. E. Examining nanoenvironments in solids on the scale of a single, isolated impurity molecule. Science 1994, 265, 46–53. 10.1126/science.265.5168.46. [DOI] [PubMed] [Google Scholar]
- Heim R.; Prasher D. C.; Tsien R. Y. Wavelength mutations and posttranslational autoxidation of green fluorescent protein. Proc. Natl. Acad. Sci. U.S.A. 1994, 91, 12501–12504. 10.1073/pnas.91.26.12501. [DOI] [PMC free article] [PubMed] [Google Scholar]
- Seebacher C.; Deeg F. W.; Braeuchle C.; Wiehler J.; Steipe B. Stable low-temperature photoproducts and hole burning of green fluorescent protein (GFP). J. Phys. Chem. B 1999, 103, 7728–7732. 10.1021/jp990883k. [DOI] [Google Scholar]
- Chattoraj M.; King B. A.; Bublitz G. U.; Boxer S. G. Ultra-fast excited state dynamics in green fluorescent protein: Multiple states and proton transfer. Proc. Natl. Acad. Sci. U.S.A. 1996, 93, 8362–8367. 10.1073/pnas.93.16.8362. [DOI] [PMC free article] [PubMed] [Google Scholar]
- Dickson R. M.; Cubitt A. B.; Tsien R. Y.; Moerner W. E. On/off blinking and switching behavior of single molecules of green fluorescent protein. Nature 1997, 388, 355–358. 10.1038/41048. [DOI] [PubMed] [Google Scholar]
- Bublitz G.; King B. A.; Boxer S. G. Electronic structure of the chromophore in green fluorescent protein (GFP). J. Am. Chem. Soc. 1998, 120, 9370–9371. 10.1021/ja981606e. [DOI] [Google Scholar]
- Shi X.; Abbyad P.; Shu X.; Kallio K.; Kanchanawong P.; Childs W.; Remington S. J.; Boxer S. G. Ultrafast excited-state dynamics in the green fluorescent protein variant S65T/H148D. 2. Unusual photophysical properties. Biochemistry 2007, 46, 12014–12025. 10.1021/bi700904a. [DOI] [PMC free article] [PubMed] [Google Scholar]
- Patterson G. H.; Lippincott-Schwartz J. A photoactivatable GFP for selective photolabeling of proteins and cells. Science 2002, 297, 1873–1877. 10.1126/science.1074952. [DOI] [PubMed] [Google Scholar]
- Betzig E.; Patterson G. H.; Sougrat R.; Lindwasser O. W.; Olenych S.; Bonifacino J. S.; Davidson M. W.; Lippincott-Schwartz J.; Hess H. F. Imaging intracellular fluorescent proteins at nanometer resolution. Science 2006, 313, 1642–1645. 10.1126/science.1127344. [DOI] [PubMed] [Google Scholar]
- Hess S. T.; Girirajan T. P. K.; Mason M. D. Ultra-high resolution imaging by fluorescence photoactivation localization microscopy. Biophys. J. 2006, 91, 4258–4272. 10.1529/biophysj.106.091116. [DOI] [PMC free article] [PubMed] [Google Scholar]
- Biteen J.; Thompson M.; Tselentis N.; Bowman G.; Shapiro L.; Moerner W. Super-resolution imaging in live Caulobacter crescentus cells using photoswitchable EYFP. Nat. Methods 2008, 5, 947–949. 10.1038/nmeth.1258. [DOI] [PMC free article] [PubMed] [Google Scholar]
- Hoffman D. P.; Shtengel G.; Xu C. S.; Campbell K. R.; Freeman M.; Wang L.; Milkie D. E.; Pasolli H. A.; Iyer N.; Bogovic J. A.; et al. Correlative three-dimensional super-resolution and block-face electron microscopy of whole vitreously frozen cells. Science 2020, 367, eaaz5357 10.1126/science.aaz5357. [DOI] [PMC free article] [PubMed] [Google Scholar]
- Weisenburger S.; Boening D.; Schomburg B.; Giller K.; Becker S.; Griesinger C.; Sandoghdar V. Cryogenic optical localization provides 3D protein structure data with Angstrom resolution. Nat. Methods 2017, 14, 141. 10.1038/nmeth.4141. [DOI] [PubMed] [Google Scholar]
- Mazal H.; Wieser F.-F.; Sandoghdar V. Deciphering a hexameric protein complex with Angstrom optical resolution. eLife 2022, 11, e76308 10.7554/eLife.76308. [DOI] [PMC free article] [PubMed] [Google Scholar]
- Regis Faro A.; Carpentier P.; Jonasson G.; Pompidor G.; Arcizet D.; Demachy I.; Bourgeois D. Low-temperature chromophore isomerization reveals the photoswitching mechanism of the fluorescent protein Padron. J. Am. Chem. Soc. 2011, 133, 16362–16365. 10.1021/ja207001y. [DOI] [PubMed] [Google Scholar]
- Nahmani M.; Lanahan C.; DeRosier D.; Turrigiano G. G. High-numerical-aperture cryogenic light microscopy for increased precision of superresolution reconstructions. Proc. Natl. Acad. Sci. U. S. A. 2017, 114, 3832. 10.1073/pnas.1618206114. [DOI] [PMC free article] [PubMed] [Google Scholar]
- Dahlberg P. D.; Sartor A. M.; Wang J. R.; Saurabh S.; Shapiro L.; Moerner W. E. Identification of PAmKate as a red photoactivatable fluorescent protein for cryogenic super-resolution imaging. J. Am. Chem. Soc. 2018, 140, 12310–12313. 10.1021/jacs.8b05960. [DOI] [PMC free article] [PubMed] [Google Scholar]
- Hulleman C. N.; Li W.; Gregor I.; Rieger B.; Enderlein J. Photon yield enhancement of red fluorophores at cryogenic temperatures. ChemPhysChem 2018, 19, 1774–1780. 10.1002/cphc.201800131. [DOI] [PubMed] [Google Scholar]
- Shaner N. C.; Lin M. Z.; McKeown M. R.; Steinbach P. A.; Hazelwood K. L.; Davidson M. W.; Tsien R. Y. Improving the photostability of bright monomeric orange and red fluorescent proteins. Nat. Methods 2008, 5, 545–551. 10.1038/nmeth.1209. [DOI] [PMC free article] [PubMed] [Google Scholar]
- Dempsey W. P.; Georgieva L.; Helbling P. M.; Sonay A. Y.; Truong T. V.; Haffner M.; Pantazis P. In vivo single-cell labeling by confined primed conversion. Nat. Methods 2015, 12, 645–648. 10.1038/nmeth.3405. [DOI] [PubMed] [Google Scholar]
- Carter T. P.; Braeuchle C.; Lee V. Y.; Manavi M.; Moerner W. E. Photon-gated spectral hole burning by donor-acceptor electron transfer. Opt. Lett. 1987, 12, 370–372. 10.1364/OL.12.000370. [DOI] [PubMed] [Google Scholar]
- Carter T. P.; Braeuchle C.; Lee V. Y.; Manavi M.; Moerner W. E. Mechanism of photon-gated persistent spectral hole burning in metal-tetrabenzoporphyrin/halomethane systems: donor-acceptor electron transfer. J. Phys. Chem. 1987, 91, 3998–4004. 10.1021/j100299a015. [DOI] [Google Scholar]
- Mohr M. A.; Kobitski A. Y.; Sabater L. R.; Nienhaus K.; Obara C. J.; Lippincott-Schwartz J.; Nienhaus G. U.; Pantazis P. Rational engineering of photoconvertible fluorescent proteins for dual-color fluorescence nanoscopy enabled by a triplet-state mechanism of primed conversion. Angew. Chem., Int. Ed. 2017, 56, 11628–11633. 10.1002/anie.201706121. [DOI] [PubMed] [Google Scholar]
- Mohr M. A.; Pantazis P. Primed conversion: the new kid on the block for photoconversion. Chem. - Eur. J. 2018, 24, 8268–8274. 10.1002/chem.201705651. [DOI] [PubMed] [Google Scholar]
- Thanbichler M.; Iniesta A. A.; Shapiro L. A comprehensive set of plasmids for vanillate- and xylose-inducible gene expression in Caulobacter crescentus. Nucleic Acids Res. 2007, 35, e137 10.1093/nar/gkm818. [DOI] [PMC free article] [PubMed] [Google Scholar]
- Thompson M. A.The development of techniques for three-dimensional super-resolution fluorescence microscopy and their application to biological systems. Ph.D. Thesis, Stanford University: Stanford, CA, 2011. [Google Scholar]
- Dahlberg P.; Perez D.; Su Z.; Chiu W.; Moerner W. E. Cryogenic correlative single-particle photoluminescence spectroscopy and electron tomography for investigation of nanomaterials. Angew. Chem., Int. Ed. 2020, 59, 15642–15648. 10.1002/anie.202002856. [DOI] [PMC free article] [PubMed] [Google Scholar]
- Dobro M. J.; Melanson L. A.; Jensen G. J.; McDowall A. W. In Cryo-EM Part A: Sample preparation and data collection; Jensen G. J., Ed.; Academic Press, 2010; Vol. 481, pp 63–82. [Google Scholar]
- Shen Y.; Rosendale M.; Campbell R. E.; Perrais D. pHuji, a pH-sensitive red fluorescent protein for imaging of exo-and endocytosis. J. Cell Biol. 2014, 207, 419–432. 10.1083/jcb.201404107. [DOI] [PMC free article] [PubMed] [Google Scholar]
- Zhao Y.; Araki S.; Wu J.; Teramoto T.; Chang Y.-F.; Nakano M.; Abdelfattah Ahmed S.; Fujiwara M.; Ishihara T.; Nagai T.; et al. An expanded palette of genetically encoded Ca2+ indicators. Science 2011, 333, 1888–1891. 10.1126/science.1208592. [DOI] [PMC free article] [PubMed] [Google Scholar]
- Wu J.; Liu L.; Matsuda T.; Zhao Y.; Rebane A.; Drobizhev M.; Chang Y.-F.; Araki S.; Arai Y.; March K.; et al. Improved orange and red Ca2+ indicators and photophysical considerations for optogenetic applications. ACS Chem. Neurosci. 2013, 4, 963–972. 10.1021/cn400012b. [DOI] [PMC free article] [PubMed] [Google Scholar]
- Ausmees N.; Kuhn J. R.; Jacobs-Wagner C. The bacterial cytoskeleton: an intermediate filament like function in cell shape. Cell 2003, 115, 705–713. 10.1016/S0092-8674(03)00935-8. [DOI] [PubMed] [Google Scholar]
- Ambrose W. P.; Basché T.; Moerner W. E. Detection and spectroscopy of single pentacene molecules in a p-terphenyl crystal by means of fluorescence excitation. J. Chem. Phys. 1991, 95, 7150–7163. 10.1063/1.461392. [DOI] [Google Scholar]
- Moerner W. E.; Plakhotnik T.; Irngartinger T.; Croci M.; Palm V.; Wild U. P. Optical probing of single molecules of terrylene in a Shpolskii matrix - A two-state single-molecule switch. J. Phys. Chem. 1994, 98, 7382–7389. 10.1021/j100081a025. [DOI] [Google Scholar]
- Hendrix J.; Flors C.; Dedecker P.; Hofkens J.; Engelborghs Y. Dark states in monomeric red fluorescent proteins studied by fluorescence correlation and single molecule spectroscopy. Biophys. J. 2008, 94, 4103–4113. 10.1529/biophysj.107.123596. [DOI] [PMC free article] [PubMed] [Google Scholar]
- Shu X.; Shaner N. C.; Yarbrough C. A.; Tsien R. Y.; Remington S. J. Novel chromophores and buried charges control color in mFruits. Biochemistry 2006, 45, 9639–9647. 10.1021/bi060773l. [DOI] [PubMed] [Google Scholar]
- Mukherjee S.; Jimenez R. Photophysical engineering of fluorescent proteins: accomplishments and challenges of physical chemistry strategies. J. Phys. Chem. B 2022, 126, 735–750. 10.1021/acs.jpcb.1c05629. [DOI] [PubMed] [Google Scholar]
- Nienhaus K.; Nar H.; Heilker R.; Wiedenmann J.; Nienhaus G. U. Trans-cis isomerization is responsible for the red-shifted fluorescence in variants of the red fluorescent protein eqFP611. J. Am. Chem. Soc. 2008, 130, 12578–12579. 10.1021/ja8046443. [DOI] [PubMed] [Google Scholar]
- Perez D.; Dahlberg P. D.; Wang J.; Sartor A. M.; Borden J. S.; Shapiro L.; Moerner W. Identification and demonstration of roGFP2 as an environmental sensor for cryogenic correlative light and electron microscopy. J. Struct. Biol. 2022, 214, 107881. 10.1016/j.jsb.2022.107881. [DOI] [PMC free article] [PubMed] [Google Scholar]
- Subach F. V.; Verkhusha V. V. Chromophore transformations in red fluorescent proteins. Chem. Rev. 2012, 112, 4308–4327. 10.1021/cr2001965. [DOI] [PMC free article] [PubMed] [Google Scholar]
- Shcherbakova D. M.; Verkhusha V. V. Chromophore chemistry of fluorescent proteins controlled by light. Curr. Opin. Chem. Biol. 2014, 20, 60–68. 10.1016/j.cbpa.2014.04.010. [DOI] [PMC free article] [PubMed] [Google Scholar]
- Acharya A.; Bogdanov A. M.; Grigorenko B. L.; Bravaya K. B.; Nemukhin A. V.; Lukyanov K. A.; Krylov A. I. Photoinduced chemistry in fluorescent proteins: curse or blessing?. Chem. Rev. 2017, 117, 758–795. 10.1021/acs.chemrev.6b00238. [DOI] [PubMed] [Google Scholar]
- Kremers G.-J.; Hazelwood K. L.; Murphy C. S.; Davidson M. W.; Piston D. W. Photoconversion in orange and red fluorescent proteins. Nat. Methods 2009, 6, 355–358. 10.1038/nmeth.1319. [DOI] [PMC free article] [PubMed] [Google Scholar]
- Henderson J. N.; Osborn M. F.; Koon N.; Gepshtein R.; Huppert D.; Remington S. J. Excited state proton transfer in the red fluorescent protein mKeima. J. Am. Chem. Soc. 2009, 131, 13212–13213. 10.1021/ja904665x. [DOI] [PMC free article] [PubMed] [Google Scholar]
- Mudalige K.; Habuchi S.; Goodwin P. M.; Pai R. K.; De Schryver F.; Cotlet M. Photophysics of the red chromophore of HcRed: evidence for cis-trans isomerization and protonation-state changes. J. Phys. Chem. B 2010, 114, 4678–4685. 10.1021/jp9102146. [DOI] [PubMed] [Google Scholar]
- Pletneva N. V.; Pletnev V. Z.; Shemiakina I. I.; Chudakov D. M.; Artemyev I.; Wlodawer A.; Dauter Z.; Pletnev S. Crystallographic study of red fluorescent protein eqFP578 and its far-red variant Katushka reveals opposite pH-induced isomerization of chromophore. Protein Sci. 2011, 20, 1265–1274. 10.1002/pro.654. [DOI] [PMC free article] [PubMed] [Google Scholar]
- Vegh R. B.; Bravaya K. B.; Bloch D. A.; Bommarius A. S.; Tolbert L. M.; Verkhovsky M.; Krylov A. I.; Solntsev K. M. Chromophore photoreduction in red fluorescent proteins is responsible for bleaching and phototoxicity. J. Phys. Chem. B 2014, 118, 4527–4534. 10.1021/jp500919a. [DOI] [PMC free article] [PubMed] [Google Scholar]
- Shen Y.; Wiens M. D.; Campbell R. E. A photochromic and thermochromic fluorescent protein. RSC Adv. 2014, 4, 56762–56765. 10.1039/C4RA10107C. [DOI] [Google Scholar]
- Protasova E. A.; Mishin A. S.; Lukyanov K. A.; Maksimov E. G.; Bogdanov A. A.-O. X. Chromophore reduction plus reversible photobleaching: how the mKate2 ″photoconversion″ works. Photochem. Photobiol. 2021, 20, 791–803. 10.1007/s43630-021-00060-8. [DOI] [PubMed] [Google Scholar]
Associated Data
This section collects any data citations, data availability statements, or supplementary materials included in this article.