

Abstract
Background
Machine learning (ML) approaches facilitate risk prediction model development using high-dimensional predictors and higher-order interactions at the cost of model interpretability and transparency. We compared the relative predictive performance of statistical and ML models to guide modeling strategy selection for surveillance mammography outcomes in women with a personal history of breast cancer (PHBC).
Methods
We cross-validated 7 risk prediction models for two surveillance outcomes, failure (breast cancer within 12 months of a negative surveillance mammogram) and benefit (surveillance-detected breast cancer). We included 9447 mammograms (495 failures, 1414 benefits and 7538 non-events) from years 1996-2017 using a 1:4 matched case-control samples of women with PHBC in the Breast Cancer Surveillance Consortium. We assessed model performance of conventional regression, regularized regressions (LASSO and elastic-net) and ML methods (random forests and gradient boosting machines) by evaluating their calibration and, among well-calibrated models, comparing the area under the receiver operating characteristic curve (AUC) and 95% confidence intervals (CI).
Results
LASSO and elastic-net consistently provided well-calibrated predicted risks for surveillance failure and benefit. The AUCs of LASSO and elastic-net were both 0.63 (95%CI 0.60-0.66) for surveillance failure and 0.66 (95%CI 0.64-0.68) for surveillance benefit, the highest among well-calibrated models.
Conclusions
For predicting breast cancer surveillance mammography outcomes, regularized regression outperformed other modeling approaches and balanced the trade-off between model flexibility and interpretability.
Impact:
Regularized regression may be preferred for developing risk prediction models in other contexts with rare outcomes, similar training sample sizes, and low dimensional features.
Introduction
Numerous prediction modeling methods exist and have been applied in various health-care settings for predicting the risk of clinical outcomes.1–3 Machine learning methods may achieve superior predictive performance relative to more traditional regression-based approaches by flexibly incorporating non-linear functional forms and higher-order interactions to improve predictive accuracy. However, in real-world health-care settings with modest sample sizes (for example thousands) and limited numbers of features (for example dozens), regression-based modeling approaches have achieved equivalent or better performance in a variety of clinical contexts.4–7 These regression-based approaches also have the advantage of providing analytic expressions for the resultant prediction model, which facilitates direct interpretation and supports clinical dissemination. It has been shown that, in biomedical contexts, no single approach to clinical risk prediction model development consistently outperforms others,7 demonstrating that the relative utility of these modeling approaches is context-dependent.
In addition to assessing global predictive performance, methodologic evaluation is needed to ensure prediction models perform equitably across racial and ethnic groups and do not perpetuate or exacerbate racial and ethnic disparities.8–13 This is a particular concern when assessing the performance of machine learning methods, which generally require large sample sizes and large numbers of events per variable to achieve good performance overall14 and may perform poorly in underrepresented race and ethnicity groups.
For women with a personal history of breast cancer (PHBC), current guidelines recommended a “one size fit all” surveillance strategy using surveillance imaging for early detection of an in-breast event to reduce morbidity and mortality.15–17 Annual surveillance mammography was recommended for women with a PHBC (except women with bilateral mastectomies, who do not have residual breast tissue at risk)18,19 with variable endorsement of supplemental surveillance with breast MRI and full-breast ultrasound.18–22 Despite surveillance mammography use, 35% of second breast cancers are diagnosed within one year of a negative surveillance mammogram.23–25 These “interval cancers” may be considered a failure of surveillance imaging. Targeted supplemental surveillance imaging of women at increased risk of interval cancers may improve surveillance outcomes. Because personalized surveillance strategy selection includes weighing benefits and harms of each option, estimation of surveillance benefit (surveillance-detected second breast cancers) is another important consideration for acceptance of surveillance with mammography alone. Accurate and equitable risk prediction models for surveillance mammography failures and benefits could potentially guide identification of women with PHBC for more effective supplemental surveillance imaging. Yet it remains unclear which risk modeling approaches are best suited for developing these risk prediction models.
Our objective was to develop prediction models for surveillance mammography outcomes using a variety of statistical and machine learning approaches and evaluate their relative predictive performance to provide a proof of principle for these modeling approaches. We compared calibration and discrimination of alternative modeling approaches in this context both overall and within racial and ethnic groups.
Materials and Methods
Study Population
This study included females (hereafter referred to as women) with PHBC from the 6 Breast Cancer Surveillance Consortium (BCSC)26 registries: Carolina Mammography Registry (North Carolina), Kaiser Permanente Washington Registry, Metropolitan Chicago Breast Cancer Registry, New Hampshire Mammography Network, San Francisco Mammography Registry, and Vermont Breast Cancer Surveillance System. Eligible women were previously diagnosed with an incident American Joint Committee on Cancer (8th edition) anatomic stage27 0-III index breast cancer (hereafter referred to as index breast cancer) and at ages 18 years or older between 1996 and 2016 who received surgical treatment. We excluded women with incomplete diagnosis dates of index breast cancer and those receiving bilateral mastectomy. Women with non-surgical treatments were additionally excluded from the analysis as they were not treated with curative intent, likely due to increased age or comorbidities, and were different from our intended population. Each BCSC registry and the Statistical Coordinating Center (SCC) have received institutional review board approval for all study procedures, including passive consenting processes (three registries) or a waiver of consent (three registries and the SCC) to enroll participants, link data, and perform analytic studies. All procedures are Health Insurance Portability and Accountability Act (HIPAA) compliant. All registries and the SCC have received a Federal Certificate of Confidentiality and other protections for the identities of women, Physicians, and facilities who are subjects of this research.
Data Collection
Index and second breast cancers, either ductal carcinoma in situ (DCIS) or invasive, were identified from state tumor registries, regional SEER programs and pathology databases. Second breast cancers included recurrences and new primary breast cancers. We evaluated surveillance mammograms (mammography examinations performed for detecting asymptomatic subsequent breast cancer in women with PHBC)28 captured in the 6 BCSC registries from all eligible women. We included all surveillance mammograms occurring during 1996-2017 and ≥6 months after the diagnosis of index breast cancer, to allow time for treatment completion. For women with a second ipsilateral or contralateral breast cancer, only exams before the second diagnosis were included in the analysis. Eligible surveillance mammograms all had complete follow-up to the next surveillance mammogram, second breast cancer diagnosis, death, or 12 months, whichever came first.
Surveillance Mammography Outcomes
A surveillance mammogram was considered positive if the final American College of Radiology Breast Imaging Reporting and Data System (BI-RADS)29 assessment was a Category 3 (Probably benign), 4 (Suspicious), or 5 (Highly suspicious). Surveillance failure was defined as a second breast cancer diagnosed within the follow-up period after a negative surveillance exam with BI-RADS assessments of Category 1 (Negative) or 2 (Benign). Surveillance benefit was defined as a second breast cancer diagnosed within the follow-up period after a positive surveillance exam. A mammogram with no second breast cancer diagnosis during the follow-up period was defined as a non-event.
Predictor Variables
We considered women’s demographic and clinical features, and characteristics of index breast cancer as candidate predictors.30,31 Demographic characteristics included each woman’s racial and ethnic group (Non-Hispanic Asian and Pacific Islander [Asian/PI], Non-Hispanic Black, Hispanic, Non-Hispanic Other, and Non-Hispanic White); age, menopausal status, first-degree family history of breast cancer, body mass index (BMI) measured at each surveillance mammogram; age and calendar year of index breast cancer diagnosis. Clinical features included radiologist-interpreted BI-RADS breast density, mammography modality (film-screen, digital mammography, or digital breast tomosynthesis), time since previous mammography, and previous surveillance mammography (first surveillance, 3-8 months, 9-14 months, 15-23 months, ≥24 months). The characteristics of index breast cancer included mode of detection (surveillance-detected, interval-detected, and clinically detected); pathological features including histology, stage,27 grade, and estrogen and progesterone receptor (ER/PR) status; and treatment including the type of surgery, receipt of radiation, and receipt and the type of adjuvant therapy.32 We also considered two-way interactions between BMI, breast density, and race/ethnicity.33 Continuous predictors were included in regression models using natural cubic splines with 4 degrees of freedom. Years since index breast cancer diagnosis was accounted for in all modeling approaches.
Case-control Matching Design
We used a frequency-matching design with a 1-to-4 case-control ratio per outcome based on two considerations, increasing efficiency for regression models34,35 and minimizing the impact of class imbalance on prediction performance of machine learning approaches.36,37 Given that the number of years since the index breast cancer diagnosis impacts second breast cancer rates38,39 but not the risk of surveillance failures,31 we matched cases and controls on this variable to increase similarity in the second breast cancer rate among cases and controls in the analytical data. The controls per outcome were selected from non-events and mammograms meeting the definition for the other outcome. For example, in modeling surveillance failure, both non-events and surveillance benefit served as potential controls. The response per outcome was encoded as a binary variable (1: case vs. 0: control) in all modeling approaches described below.
Regression Techniques
We considered an “expert” model with covariates based on prior research findings31 (race and ethnicity, breast density, characteristics of index breast cancer including treatment, mode of detection, grade, histology, ER/PR status, and age at diagnosis), a model with all candidate predictors (full model), and two regularized regressions, LASSO40 and elastic-net41 which selected predictors and regularized effect estimations simultaneously using constrained optimization. Additionally, logistic regression with predictors selected by LASSO but re-estimated without a penalty term (debiased LASSO) was evaluated as regularized parameter estimates are biased.42 We conducted a sensitivity analysis for regularized regressions in which we enforced unregularized inclusion of years since index breast cancer diagnosis to verify the robustness of prediction performance against the variable selection on the matching factor. Regularized regressions were fitted using a R package “glmnet” (version 4.1-2) with a logit link for binary outcomes. The penalty was chosen via 10-fold cross-validation.
Machine Learning Algorithms
We considered two ensemble tree-based machine learning approaches: random forests43 and gradient boosting machines.44 Random forests built multiple decision trees, which were trained individually using random subsets of predictors in random subsamples, and produced the final prediction by averaging predictions from individual decision trees. Gradient boosting machines are ensemble algorithms, which aggregate multiple weak decision trees built in a sequential way. Each weak decision tree is trained by a gradient-descent based method to improve the error (so-called ‘boosting’) in the ensemble aggregating the preceding trees. Details of choosing hyperparameters are descripted in Supplemental Methods.
Descriptive Statistics
We summarized the distributions of women’s demographic and clinical features and index breast cancer characteristics stratified by outcome (surveillance benefit, surveillance failure, or non-event). Categorical variables were summarized using frequencies and percentages. Continuous variables were summarized with 1st quartile, median and 3rd quartile.
Missing Data
Multiple imputation by chained equations45,46 was used to impute missing data. We imputed missing values of each predictor using all other candidate predictors, interaction terms and two indicators of surveillance failure and benefit. For non-linear and interaction terms, we imputed using the ‘just another variable’ approach,47 which directly imputes transformed values. All predictions and assessments were based on 10 imputed complete datasets.
Cross-validation
We conducted a 10-fold cross-validation to assess risk model performance built using the 7 modeling approaches. Samples were randomly partitioned into 10 groups, among which 9 groups were used as the training set and the remaining one as the testing set in each cross-validation round.
Performance Evaluation
We first evaluated and compared the 7 risk prediction models for each of surveillance failure and benefit assessing the calibration48 of predicted risks. Calibration was assessed using the expected-to-observed event ratio (E/O ratio) and the Cox calibration intercept and slope, which detected any systematic bias and over/underfitting, respectively. Here overfitting (underfitting) refers to cases in which predicted risks in high- and low-risk groups are more (less) extreme than observed risks. We additionally evaluated weak calibration for alignment between predicted and observed risks within deciles stratified by predicted risks, quantified by Hosmer-Lemeshow test49 p-value. A well-calibrated model met all the following criteria: the 95% confidence intervals (95% CI) for E/O ratio, calibration intercept and slope overlapping 1, 0, and 1, respectively; and Hosmer-Lemeshow p-value >0.05. The discriminatory accuracy of well-calibrated models and the expert model were then evaluated using the area under the receiver operating characteristic curve (AUC). The 95% CI for each performance metric are reported. A secondary calibration assessment of predicted risks was carried out in individual racial and ethnic groups, including Non-Hispanic Asian/PI, Non-Hispanic Black, and Non-Hispanic White, to evaluate algorithmic fairness given that Non-Hispanic Black experiences breast cancer disparities relative to Non-Hispanic Asian/PI and Non-Hispanic White.50,51
Variable Importance
We evaluated the importance of predictors for regularized regressions by the frequency of predictors being selected into the prediction models, averaged across imputed datasets. We quantified variable importance in random forests by Mean Decrease Accuracy,52 and in gradient boosting machines by the improvement in accuracy to each tree contributed by each feature (i.e. a continuous predictor or a dummy variable representing a level of a categorical predictor). The transformation from feature-level importance to predictor-level is illustrated in Supplemental Methods. Variable importance per predictor was calculated in individual imputed datasets, then averaged across imputation sets. For cross-approach comparison, predictor importance ranks for random forests and gradient boosting machines were used.
Data availability
The data underlying this article will be shared on reasonable request to the corresponding author and BCSC with appropriate regulatory approvals.
Results
Descriptive Statistics
The analytical sample consisted of 9447 surveillance mammograms, including 495 (5.2%) surveillance failures, 1414 (15.0%) surveillance benefits, and 7538 (79.8%) non-events (Table 1). Most mammograms were from Non-Hispanic White women (7453 (81.4%)). Non-Hispanic Asian/PI women contributed 769 (8.4%) exams, Non-Hispanic Black women 486 (5.3%), Hispanic women 266 (2.9%), Non-Hispanic other racial or mixed group women 185 (2.0%), and 288 (3.0%) mammograms from women with unknown race and ethnicity information. Median age at surveillance mammograms was 64 years (1st and 3rd quartiles: 55 and 73 years). The missing rate of predictors ranged from 0.2% to 35% with a median of 2.2%. Among the three outcome groups, surveillance failures tended to occur more in women with younger age, heterogeneously or extremely dense breasts, and index breast cancer that was interval or clinically detected, stage IIB or above, grade 3, both ER and PR negative, treated with mastectomy, or received chemotherapy. Surveillance benefits occurred more frequently among women with a family history of breast cancer and shorter surveillance intervals (3-8 months), whose index breast cancer tended to be DCIS and treated with breast conserving surgery without any adjuvant therapy, compared to mammograms associated with no second breast cancer diagnosis.
Table 1.
Distribution of risk factors stratified by surveillance mammography outcome
| Risk factors | Surveillance failurea (N=495, 5.2%) | Surveillance benefitb (N=1414, 15.0%) | No second breast cancer diagnosis (N=7538, 79.8%) | Overallc (N=9447) |
|---|---|---|---|---|
| Age at surveillance exam | ||||
| Median (Q1, Q3)d | 60 (52, 71) | 65 (56, 74) | 64 (56, 73) | 64 (55, 73) |
| Race and ethnicity (missing n=288, 3.0%) | ||||
| Non-Hispanic Asian/PIe | 43 (9.1%) | 127 (9.3%) | 599 (8.2%) | 769 (8.4%) |
| Non-Hispanic Black | 37 (7.8%) | 75 (5.5%) | 374 (5.1%) | 486 (5.3%) |
| Hispanic | 10 (2.1%) | 41 (3.0%) | 215 (2.9%) | 266 (2.9%) |
| Non-Hispanic Othersf | 11 (2.3%) | 23 (1.7%) | 151 (2.1%) | 185 (2.0%) |
| Non-Hispanic White | 374 (78.7%) | 1098 (80.5%) | 5981 (81.7%) | 7453 (81.4%) |
| Menopausal status (missing n=1432, 15.2%) | ||||
| Post-menopause | 308 (76.2%) | 1058 (85.5%) | 5637 (88.5%) | 7003 (87.4%) |
| Peri/Pre-menopause | 96 (23.8%) | 180 (14.5%) | 736 (11.5%) | 1012 (12.6%) |
| First degree family history of breast cancer (missing n=208, 2.2%) | ||||
| No | 356 (73.4%) | 964 (70.2%) | 5618 (76.1%) | 6938 (75.1%) |
| Yes | 129 (26.6%) | 409 (29.8%) | 1763 (23.9%) | 2301 (24.9%) |
| Body mass index, kg/m2 (missing n=3306, 35%) | ||||
| Median (Q1, Q3) | 25.3 (22.2, 29.8) | 26.4 (23.2, 31.1) | 25.7 (22.8, 30.1) | 25.7 (22.8, 30.2) |
| Surveillance mammography modality (missing n=64, 0.7%) | ||||
| Film mammography | 189 (38.3%) | 495 (35.3%) | 2356 (31.5%) | 3040 (32.4%) |
| Digital mammography | 276 (55.9%) | 822 (58.7%) | 4577 (61.1%) | 5675 (60.5%) |
| Digital breast tomosynthesis | 29 (5.9%) | 84 (6.0%) | 555 (7.4%) | 668 (7.1%) |
| BI-RADS breast density (missing n=1095, 11.6%) | ||||
| Almost entirely fatty | 23 (5.4%) | 114 (9.6%) | 632 (9.4%) | 769 (9.2%) |
| Scattered fibroglandular | 157 (36.7%) | 549 (46.4%) | 3208 (47.6%) | 3914 (46.9%) |
| Heterogeneously dense | 209 (48.8%) | 453 (38.3%) | 2509 (37.2%) | 3171 (38.0%) |
| Extremely dense | 39 (9.1%) | 68 (5.7%) | 391 (5.8%) | 498 (6.0%) |
| Months since last mammogram (missing n=24, 0.3%) | ||||
| Median (Q1, Q3) | 13 (11, 13) | 13 (10, 13) | 13 (12, 13) | 13 (12, 13) |
| Months since last surveillance mammogram (missing n=30, 0.3%) | ||||
| 1st surveillance mammogram | 107 (21.7%) | 266 (18.9%) | 1616 (21.5%) | 1989 (21.1%) |
| 3 - 8 | 47 (9.6%) | 214 (15.2%) | 498 (6.6%) | 759 (8.1%) |
| 9 - 14 | 266 (54.1%) | 679 (48.2%) | 4357 (58.0%) | 5302 (56.3%) |
| 15 - 23 | 31 (6.3%) | 120 (8.5%) | 542 (7.2%) | 693 (7.4%) |
| 24+ | 41 (8.3%) | 129 (9.2%) | 504 (6.7%) | 674 (7.2%) |
| Mode of detection of index breast cancer (missing n=685, 7.3%) | ||||
| Screening detected | 215 (47.4%) | 862 (66.0%) | 4472 (63.9%) | 5549 (63.3%) |
| Interval detected | 167 (36.8%) | 314 (24.0%) | 1794 (25.6%) | 2275 (26.0%) |
| Clinically detected | 72 (15.9%) | 130 (10.0%) | 736 (10.5%) | 938 (10.7%) |
| Age at index breast cancer diagnosis (years) | ||||
| Median (Q1, Q3) | 55 (47, 66) | 59 (50, 68) | 58 (50, 67) | 58 (50, 67) |
| Calendar year of index breast cancer diagnosis | ||||
| Median (Q1, Q3) | 2003 (1999, 2007) | 2003 (1999, 2006) | 2003 (2000, 2007) | 2003 (2000, 2007) |
| Histology of index breast cancer (missing n=2245, 23.8%) | ||||
| Ductal | 317 (82.3%) | 794 (83.8%) | 4854 (82.7%) | 5965 (82.8%) |
| Non-ductal | 68 (17.7%) | 154 (16.2%) | 1015 (17.3%) | 1237 (17.2%) |
| AJCC v8 stage of index breast cancer (anatomic) | ||||
| DCIS | 112 (22.6%) | 472 (33.4%) | 1685 (22.4%) | 2269 (24.0%) |
| Stage I | 205 (41.4%) | 617 (43.6%) | 3593 (47.7%) | 4415 (46.7%) |
| Stage IIA and II NOS | 89 (18.0%) | 181 (12.8%) | 1330 (17.6%) | 1600 (16.9%) |
| Stage IIB and above | 89 (18.0%) | 144 (10.2%) | 930 (12.3%) | 1163 (12.3%) |
| Grade of index breast cancer (missing n=793, 8.4%) | ||||
| 1 | 78 (17.0%) | 292 (23.0%) | 1698 (24.5%) | 2068 (23.9%) |
| 2 | 191 (41.6%) | 516 (40.6%) | 2923 (42.2%) | 3630 (41.9%) |
| 3 | 190 (41.4%) | 462 (36.4%) | 2304 (33.3%) | 2956 (34.2%) |
| ER and PR status of index breast cancer (missing n=1804, 19.1%) | ||||
| ER +, PR + | 261 (65.6%) | 755 (71.6%) | 4578 (74.0%) | 5594 (73.2%) |
| ER +, PR − | 29 (7.3%) | 81 (7.7%) | 580 (9.4%) | 690 (9.0%) |
| ER −, PR + | 8 (2.0%) | 14 (1.3%) | 97 (1.6%) | 119 (1.6%) |
| ER −, PR − | 100 (25.1%) | 205 (19.4%) | 935 (15.1%) | 1240 (16.2%) |
| Surgical treatment for index breast cancer (missing n=20, 0.2%) | ||||
| Mastectomy | 145 (29.3%) | 224 (15.8%) | 1888 (25.0%) | 2257 (23.9%) |
| Breast conserving surgery | 349 (70.5%) | 1187 (83.9%) | 5634 (74.7%) | 7170 (75.9%) |
| Radiation treatment for index breast cancer (missing n=77, 0.8%) | ||||
| With radiation | 241 (48.9%) | 757 (54.2%) | 4240 (56.7%) | 5238 (55.9%) |
| Without radiation | 252 (51.1%) | 639 (45.8%) | 3241 (43.3%) | 4132 (44.1%) |
| Adjuvant therapy for index breast cancer (missing n=539, 5.7%) | ||||
| None | 191 (40.4%) | 721 (54.3%) | 2626 (36.9%) | 3538 (39.7%) |
| Chemotherapy only | 115 (24.3%) | 164 (12.3%) | 1132 (15.9%) | 1411 (15.8%) |
| Hormonal therapy only | 96 (20.3%) | 318 (23.9%) | 2344 (33.0%) | 2758 (31.0%) |
| Both | 71 (15.0%) | 125 (9.4%) | 1005 (14.1%) | .5%) |
Surveillance failures were interval second breast cancers, including both DCIS and invasive cancers.
Surveillance benefits were surveillance-detected second breast cancers, including both DCIS and invasive cancers.
The overall examinations included all surveillance failures, surveillance benefits, and controls matched by years since index breast cancer diagnosis at a 1:4 case-control ratio. The controls for surveillance failures could be examinations with no cancer diagnosis or surveillance benefits. The controls for surveillance benefits could be examinations with no cancer diagnosis or surveillance failures.
Q1, Q3: the first and third quartiles.
PI: Pacific-Islanders.
Including Native American, Mixed, and other race.
Calibration
For surveillance failure (Figure 1, top), all regression-based approaches demonstrated E/O ratios of 1.00 (95%CI: 0.92-1.09) and calibration intercepts of 0.00 (95% CI:−0.11-0.10 for full model; −0.10-0.10 for the others), indicating no systematic biases. LASSO and elastic-net had calibration slopes of 1.02 (95% CI: 0.79-1.24) and 1.03 (95% CI: 0.80-1.26), respectively, and expert model of 0.83 (95% CI: 0.65-1.02), while the others had slopes significantly less than 1 (range: 0.60-0.72), suggesting overfitting. Random forest had no significant systematic bias as its E/O ratio (1.05, 95% CI: 0.97-1.15) and calibration intercept (−0.07, 95% CI: −0.17-0.03). However, it overfit as suggested by its calibration slope (0.79, 95% CI: 0.59-0.98). Gradient boosting machine predictions had a calibration intercept of −0.09 (95% CI: −0.19-0.01) and slope of 0.98 (95% CI: 0.75-1.22). The predicted risks from expert model, LASSO, elastic-net, and gradient boosting machines passed the Hosmer-Lemeshow test and demonstrated consistency between predicted and observed risks across most risk deciles (Figure 2). However, the expert model and gradient boosting machines overpredicted the risks in high-risk deciles.
Figure 1. Assessment on overall model calibration.
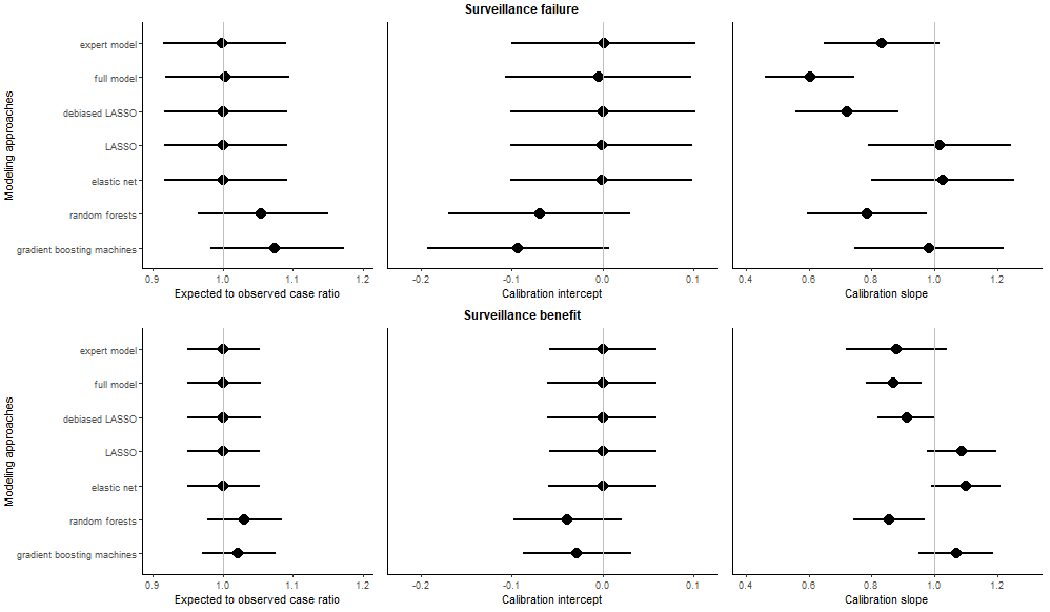
We showed the overall model calibration measured by three metrics, including the ratio of expected to observed events (E/O ratio) and calibration intercept and slope for surveillance failure (interval cancer; top panel) and benefit (surveillance-detected cancer; button panel) for each prediction modeling approach. The 95% CI for each calibration measure was shown using the error bars. The vertical lines showed the ideal value for each metric (1 for E/O ratio, 0 for calibration intercept, and 1 for calibration slope).
Figure 2. Weak calibration for 7 risk prediction models for surveillance failure (interval second breast cancer).
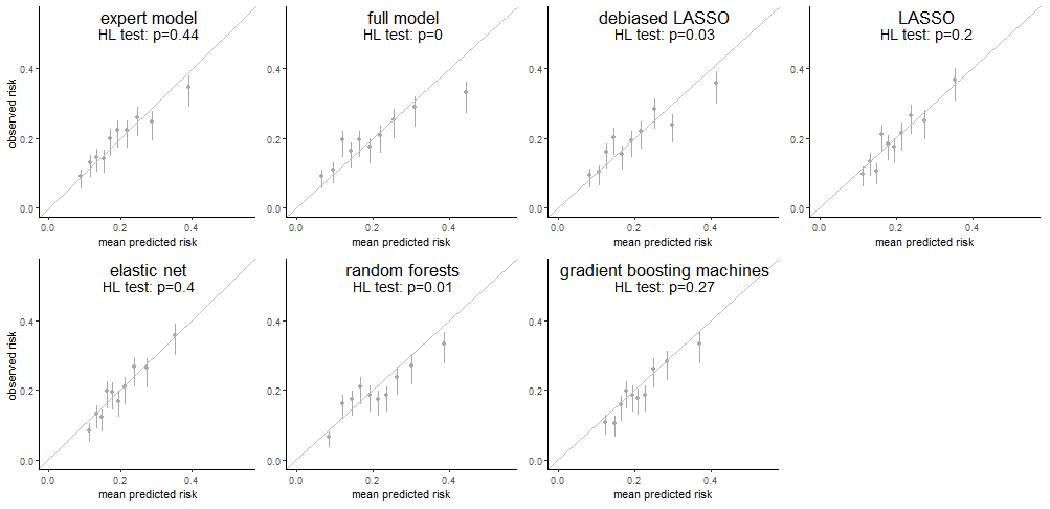
Each subfigure demonstrated the weak calibration of an individual modeling approach by comparing the mean predicted risk (x-axis) to the observed risk of surveillance failure (y-axis) in 10 deciles determined by the predicted risk. The vertical error bars showed the 95% confidence interval of the observed risk of surveillance failure in individual deciles. A p-value from the Hosmer-Lemeshow test (HL test) was shown as well for each modeling approach.
For surveillance benefits (Figure 1, bottom), all regression-based approaches had E/O ratios and calibration intercepts of 1 and 0, respectively, indicating no systematic biases. Of these, all except the full model showed calibration slopes close to 1 (range: 0.88 to 1.10) with 95% CI including 1. The full model calibration slope was significantly less than 1, suggesting overfitting. The gradient boosting machines was well-calibrated; however, the random forest showed overfitting as its calibration slope was significantly less than 1 (0.86, 95% CI: 0.74-0.97). The weak calibration (Figure 3) showed that the predicted risks from the expert model, LASSO, elastic-net, and gradient boosting machines were consistently close to the observed risks across the 10 risk deciles and passed the Hosmer-Lemeshow test. The sensitivity analysis on regularized regressions shown in Supplemental Table S1 demonstrated similar calibration after enforcing an adjustment of the matching factor for both surveillance outcomes.
Figure 3. Weak calibration for 7 risk prediction models for surveillance benefit (surveillance-detected cancer).
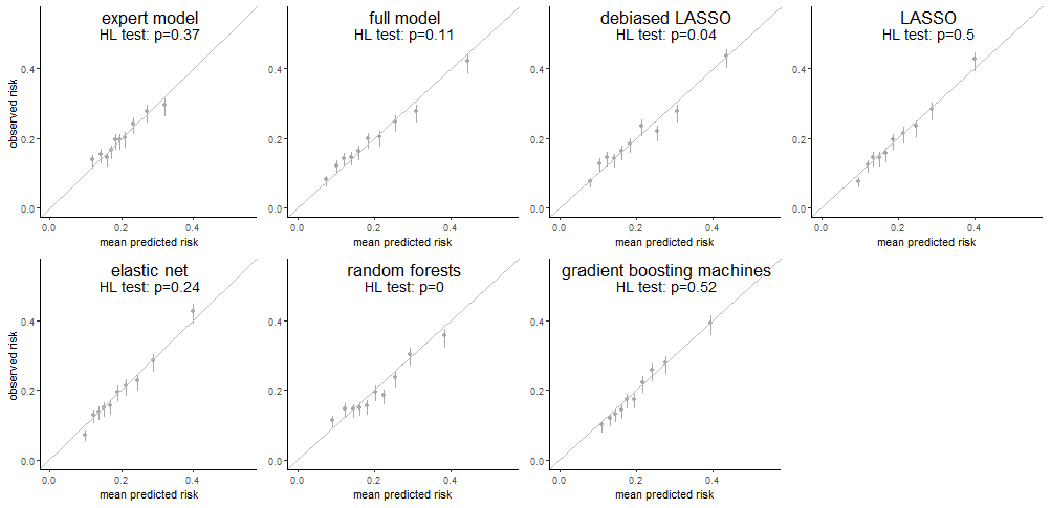
Each subfigure demonstrated the weak calibration of an individual modeling approach by comparing the mean predicted risk (x-axis) to the observed risk of surveillance benefit (y-axis) in 10 deciles determined by the predicted risk. The vertical error bars showed the 95% confidence interval of the observed risk of surveillance benefit in individual deciles. A p-value from the Hosmer-Lemeshow test (HL test) was shown as well for each modeling approach.
Discrimination
We compared the receiver operating characteristic curves and AUCs of the models with good calibration: the expert model, LASSO, elastic-net and gradient boosting machines (Figure 4A and 4B). The expert model, LASSO and elastic-net all had AUCs for surveillance failure of 0.63 (95% CIs: 0.60-0.66); gradient boosting machines had slightly lower AUC (0.62; 95% CI: 0.59-0.65) although not significantly different from LASSO (p=0.26). For surveillance benefit, the AUCs of LASSO and elastic-net were 0.66 (95% CIs: 0.64-0.68), slightly higher than that of gradient boosting machines (0.65; 95% CI: 0.63-0.66) (p<0.001) and substantially higher than the expert model (0.59; 95% CI: 0.58-0.61) (p<0.001).
Figure 4. Receiver operating characteristic curves for surveillance failure (panel A) and surveillance benefit (panel B) for well-calibrated risk modeling approaches.
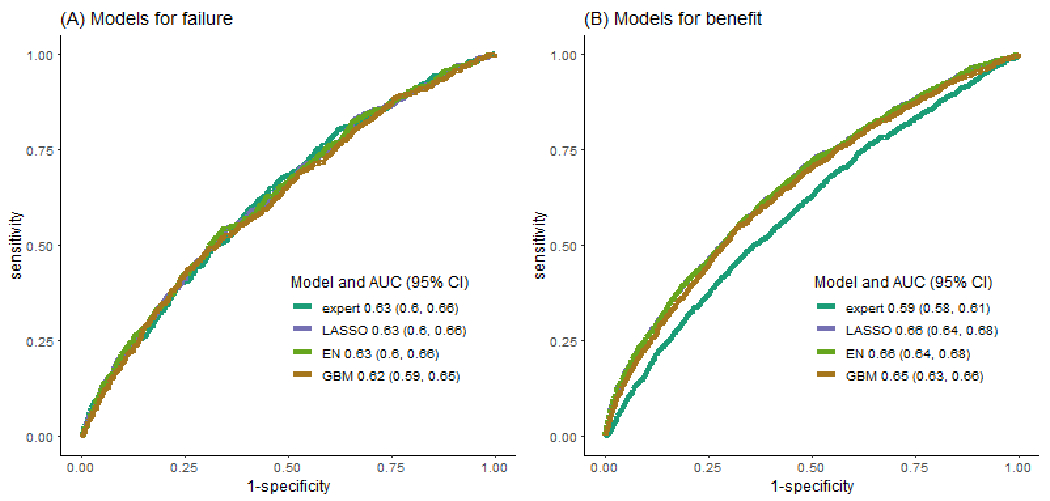
We showed the receiver operating characteristics curves for 4 well-calibrated risk prediction models, the expert model, LASSO model, elastic-net (EN) model and gradient boosting machines (GBM), along with their AUCs and the corresponding 95% confidence interval.
Calibration Stratified by Race and Ethnicity
Regression-based predicted risks of surveillance failures (Figure 5, top) were robustly unbiased across racial and ethnic groups. The machine learning approaches demonstrated more noticeable biases in estimated risks in several groups compared to regression-type approaches. Conventional regression approaches showed overfitting in Non-Hispanic Asian/PI and Black women. Overall, the predicted risks derived from LASSO, elastic-net and random forests were well-calibrated across Non-Hispanic Asian/PI, Black and White women. For surveillance benefit (Figure 5, bottom), all methods demonstrated unbiased risk predictions across Non-Hispanic Asian/PI, Black and White women. Except for random forests, other methods did not show significant over- or underfitting across these racial and ethnic groups.
Figure 5. Race and ethnicity-stratified model calibration for surveillance failures (top panel) and benefits (button panel) in Non-Hispanic racial and ethnic groups.
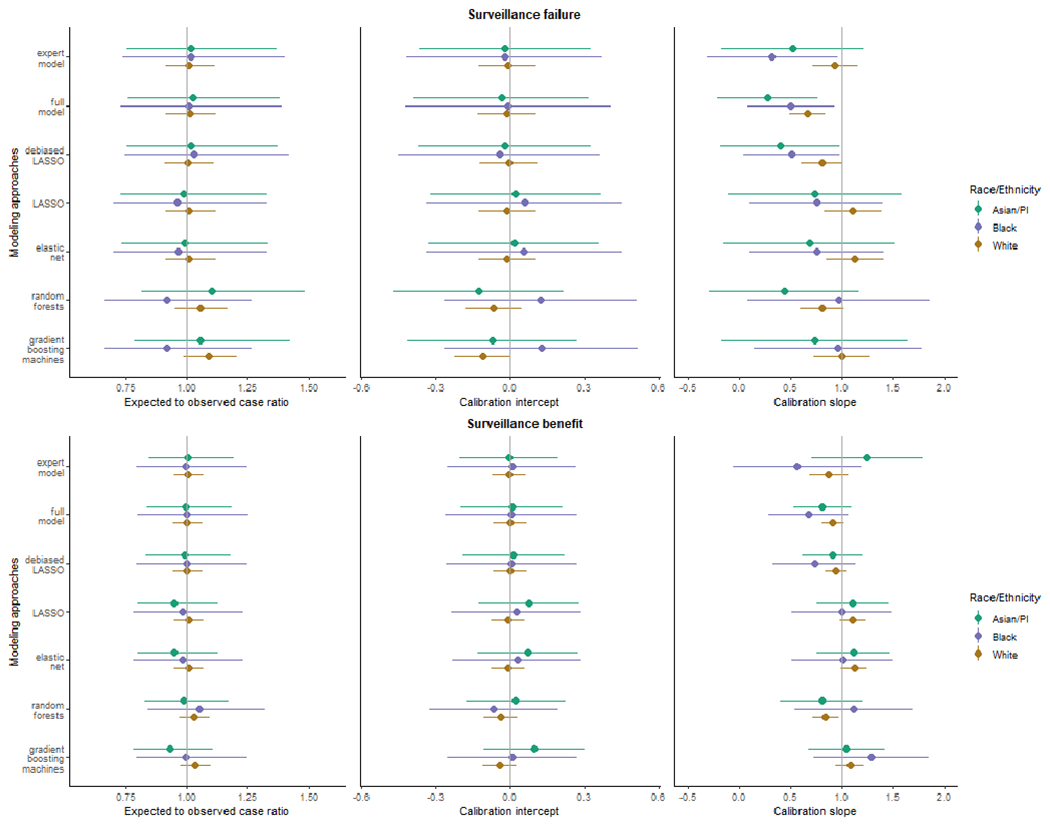
This figure showed the assessment of race and ethnicity-stratified model calibration by three metrics, including the ratio of expected and observed events (E/O ratio) and the calibration intercept and slope within three Non-Hispanic racial and ethnic groups, including Asian and Pacific Islander, Black, and White. The 95% CI for each calibration measure was shown using the error bars. The vertical lines showed the ideal value for each metric (1 for E/O ratio, 0 for calibration intercept, and 1 for calibration slope).
Variable Importance Measures
For predicting surveillance failure risk, the expert model consisted of 21 features, including dummy variables and spline basis functions, representing 9 predictors while on average 34 (range: 28-41) and 37 (range: 31-47) out of 90 features (representing 19 predictors) were selected by LASSO and elastic-net, respectively, across imputed data sets. Among the 9 expert-selected predictors, 6 (breast density, information of index breast cancer including age at diagnosis, mode of detection, grade, ER and PR status and receipt of radiation treatment) were consistently selected by both regularized regressions for modeling surveillance failure (Supplemental Figure S1(A)). The estimated effect sizes for these selected features were comparable between LASSO and elastic-net, and substantially larger in the expert model (Supplemental Table S2). Only age at diagnosis and mode of detection of index breast cancer among the 9 expert-selected predictors were ranked among the top 5 by variable importance in both machine learning approaches (Supplemental Figure S2).
For modelling surveillance benefits, similar patterns were observed for variable importance in regularized regressions. Among the 9 expert-selected predictors, index breast cancer characteristics including ER and PR status, grade, radiation, and surgical treatments, were constantly selected into regularized regressions (Supplemental Figure S1(B) and Supplemental Table S2. Index breast cancer radiation and surgical treatments were ranked with top 5 variable importance in gradient boosting machines while the age at index breast cancer diagnosis was ranked second important in random forests (Supplemental Figure S3).
Discussion
We compared model predictive performance for estimating surveillance mammography failure and benefit risks derived using conventional regression, regularized regression, and machine learning approaches. The clinical motivation for this methodological research was to identify women at greater risk of surveillance failure to potentially target for supplemental surveillance, and to support confidence in selecting guideline-concordant annual surveillance with mammography alone for others. Specifically, we evaluated the comparative calibration and discrimination of alternative approaches to determine whether more flexible models could lead to improvement. The evaluation presented in this study is only intended for guiding the method selection in risk model development in similar clinical contexts characterized by a moderate sample size, infrequent outcomes and modest number of predictor variables, particularly in the domain of cancer risk prediction. We found that regularized regression provided well-calibrated predictions for both outcomes and had comparable or better discriminatory accuracy compared to other approaches.
Despite greater model flexibility, machine learning methods did not outperform regression-type approaches, particularly random forests which overfit the risk of both surveillance outcomes. The expert model had fair calibration (well-calibrated overall and overpredicted in high-risk groups) but good discrimination for surveillance failure and good calibration but inferior discrimination for surveillance benefit. Overall, regularized regression provided the most consistently well-calibrated and accurate risk estimates for both surveillance failures and benefits. In this clinical context, regularized regression balances the tradeoff between the flexibility of more modern machine learning approaches and the parsimony and interpretability of traditional regression approaches.
The population reflected by the matched case-control sample used in this study differ from the clinical target population comprising women with a PHBC. The results cannot be directly applied to the target population because the predictive contribution of the matching factors in a case-control study is greatly distorted.53 The main goal of this study was to understand the relative predictive performance of these modeling approaches. In the future research, we will build 5-year risk models with the preferred modeling method informed by this study and a discrete survival framework using all eligible examinations from women with a PHBC in the BCSC.54 These 5-year models will be evaluated in samples reflecting the target population before being introduced into clinical practice.55
Our study adds to prior studies which have investigated the relative performance of alternative approaches to clinical risk prediction modeling and found no systematic benefit of machine learning.7 Our results reinforce the finding that clinical risk models in settings with modest numbers of predictors, moderate sample sizes and infrequent outcomes may not benefit from machine learning approaches. In many computer science studies of machine learning approaches, these methods have been found to substantially outperform regression methods for risk prediction.56 However, the settings of those studies often featured many more predictors, larger sample sizes, and more common outcomes than are typically available for developing clinical risk prediction models. Moreover, in addition to prediction performance of the models, ease of implementation is an important consideration in clinical risk prediction settings.28 While all approaches considered in this investigation require collection of a similar number of variables, the regression-based predictions can be disseminated via a regression equation whereas machine learning models do not have a simple representation, requiring dissemination via software. Implementation challenges and the limited transparency of such approaches is a barrier for patients, providers, and health systems, resulting in limited clinical uptake.11,28
Equity in Accuracy of Predictions
We found calibration was more likely to be differential across racial and ethnic groups for machine learning approaches. Calibration in racial and ethnic groups have important implications for risk model equity.9 Systematic over-prediction of risk in some groups and under-prediction in others has the potential to result in inequitable resource allocation. In the case of surveillance mammography, risk models with inequitable performance may result in differential access to supplemental surveillance imaging. The specific metrics that should be used to guide risk-model development to ensure equity vary depending on the intended use of the model9 and, importantly, it is often impossible to simultaneously achieve equity with respect to all metrics. In this study, regularized regression provided robust performance with respect to calibration. Our results suggest that surveillance risk prediction models using regularized regression approaches may less likely introduce additional inequities in resource allocation across racial and ethnic groups, other than the potential inequity due to disparities in data capture, including breast cancer diagnosis.
Limitations
A few limitations of this study should be noted. Machine learning methods are sensitive to the choice of hyperparameters. We followed best practices for tuning hyperparameters using cross-validation; nonetheless, results could vary if alternative hyperparameters were selected. Second, our results must be interpreted considering the features of the context in which they were generated. We have conducted this methodologic comparison in the specific setting of surveillance mammography for breast cancer using outcomes for each surveillance round. Our results are likely generalizable to other settings featuring similar sample size, total number of predictors, number of continuous and categorical predictors, and complexity of interactions. Third, as we multiply imputed missing data in a supervised manner (outcomes included in imputation models) prior to assessing model performance via cross-validation, the validation results may be subject to some optimism.57 Further investigation is warranted to understand whether such optimism differs across modeling approaches. Fourth, multiple imputation could hinder dissemination for regression-based approaches as predicted risks are averaged across multiple models fitted in individual imputed datasets. As a result, the final model is not available in the form of a single regression equation. However, an online calculator accompanied with regression equations derived from individual imputed datasets is easy to implement and share when the number of features is modest. Finally, the limited sample sizes and small number of outcomes in some racial and ethnic groups, particularly Hispanic women, could limit the reliability of the calibration assessment in these groups. An external validation in a diverse cohort may be warranted to provide more reliable assessment of model equity.
Conclusions
Regularized regression predicted surveillance mammography failure and benefit risks that were well-calibrated and with good discriminatory accuracy. Estimates were well-calibrated across non-Hispanic Asian/PI, non-Hispanic Black, and non-Hispanic White groups. Regularized regression balances the trade-off between model flexibility and interpretability and has an additional advantage of implementation compared with machine learning approaches such as random forests and gradient boosting machines. In the context of breast cancer surveillance imaging and other similar settings, regularized regression has the potential to support development of risk-guided clinical decision-making models that are both fair and accurate.
Supplementary Material
Acknowledgements
This research was funded by the National Cancer Institute (all authors except K.P. Lowry received P01CA154292, E.J.A. Bowles received R50CA211115). Data collection for this work was additionally supported, in part, by funding from the National Cancer Institute (U54CA163303 awarded to B.L. Sprague), the Patient-Centered Outcomes Research Institute (PCS-1504-30370 awarded to Y. Su, D.S.M. Buist, D.L. Miglioretti, E.J.A. Bowles, K.J. Wernli, K. Kerlikowske, A. Tosteson, L.M. Henderson and B.L. Sprague), and the Agency for Health Research and Quality (R01 HS018366-01A1). The collection of cancer and vital status data used in this study was supported in part by several state public health departments and cancer registries throughout the U.S. For a full description of these sources, please see: https://www.bcsc-research.org/about/work-acknowledgement. All statements in this report, including its findings and conclusions, are solely those of the authors and do not necessarily represent the views of the Patient-Centered Outcomes Research Institute (PCORI), its Board of Governors or Methodology Committee, nor those of the National Cancer Institute, the National Institutes of Health, or the Agency for Health Research and Quality. We thank the participating women, mammography facilities, and radiologists for the data they have provided for this study. You can learn more about the BCSC at: http://www.bcsc-research.org/.
Conflict of interest:
The following authors have potential conflicts of interest; Dr. Diana Buist: Athena WISDOM Study Data Safety and Monitoring Board (2015-present); Dr. Janie M Lee: Research Grant from GE Healthcare (11/15/2016-12/31/2020), Consulting agreement with GE Healthcare (2017 only); Dr. Diana Miglioretti: Honorarium from Society for Breast Imaging for keynote lecture in April 2019. Royalties from Elsevier; Dr. Karla Kerlikowske: Non-paid consultant for Grail on the STRIVE study (2017-present). No other disclosures were reported.
References
- (1).Parikh RB; Manz C; Chivers C; Regli SH; Braun J; Draugelis ME; et al. Machine Learning Approaches to Predict 6-Month Mortality Among Patients With Cancer. JAMA Netw Open 2019, 2 (10), e1915997. 10.1001/jamanetworkopen.2019.15997. [DOI] [PMC free article] [PubMed] [Google Scholar]
- (2).Goldstein BA; Navar AM; Carter RE Moving beyond Regression Techniques in Cardiovascular Risk Prediction: Applying Machine Learning to Address Analytic Challenges. Eur Heart J 2016, ehw302. 10.1093/eurheartj/ehw302. [DOI] [PMC free article] [PubMed] [Google Scholar]
- (3).Ming C; Viassolo V; Probst-Hensch N; Dinov ID; Chappuis PO; Katapodi MC Machine Learning-Based Lifetime Breast Cancer Risk Reclassification Compared with the BOADICEA Model: Impact on Screening Recommendations. Br J Cancer 2020, 123 (5), 860–867. 10.1038/s41416-020-0937-0. [DOI] [PMC free article] [PubMed] [Google Scholar]
- (4).Gravesteijn BY; Nieboer D; Ercole A; Lingsma HF; Nelson D; van Calster B; et al. Machine Learning Algorithms Performed No Better than Regression Models for Prognostication in Traumatic Brain Injury. Journal of Clinical Epidemiology 2020, 122, 95–107. 10.1016/j.jclinepi.2020.03.005. [DOI] [PubMed] [Google Scholar]
- (5).Nusinovici S; Tham YC; Chak Yan MY; Wei Ting DS; Li J; Sabanayagam C; et al. Logistic Regression Was as Good as Machine Learning for Predicting Major Chronic Diseases. J Clin Epidemiol 2020, 122, 56–69. 10.1016/j.jclinepi.2020.03.002. [DOI] [PubMed] [Google Scholar]
- (6).Witteveen A; Nane GF; Vliegen IMH; Siesling S; IJzerman MJ Comparison of Logistic Regression and Bayesian Networks for Risk Prediction of Breast Cancer Recurrence. Med Decis Making 2018, 38 (7), 822–833. 10.1177/0272989X18790963. [DOI] [PubMed] [Google Scholar]
- (7).Christodoulou E; Ma J; Collins GS; Steyerberg EW; Verbakel JY; Van Calster B A Systematic Review Shows No Performance Benefit of Machine Learning over Logistic Regression for Clinical Prediction Models. Journal of Clinical Epidemiology 2019, 110, 12–22. 10.1016/j.jclinepi.2019.02.004. [DOI] [PubMed] [Google Scholar]
- (8).Mittelstadt BD; Allo P; Taddeo M; Wachter S; Floridi L The Ethics of Algorithms: Mapping the Debate. Big Data & Society et al. , 3 (2), 205395171667967. 10.1177/2053951716679679. [DOI] [Google Scholar]
- (9).Rajkomar A; Hardt M; Howell MD; Corrado G; Chin MH Ensuring Fairness in Machine Learning to Advance Health Equity. Ann Intern Med 2018, 169 (12), 866. 10.7326/M18-1990. [DOI] [PMC free article] [PubMed] [Google Scholar]
- (10).Vyas DA; Eisenstein LG; Jones DS Hidden in Plain Sight — Reconsidering the Use of Race Correction in Clinical Algorithms. N Engl J Med 2020, 383 (9), 874–882. 10.1056/NEJMms2004740. [DOI] [PubMed] [Google Scholar]
- (11).Paulus JK; Kent DM Predictably Unequal: Understanding and Addressing Concerns That Algorithmic Clinical Prediction May Increase Health Disparities. NPJ Digit Med 2020, 3, 99. 10.1038/s41746-020-0304-9. [DOI] [PMC free article] [PubMed] [Google Scholar]
- (12).Oni-Orisan A; Mavura Y; Banda Y; Thornton TA; Sebro R Embracing Genetic Diversity to Improve Black Health. N Engl J Med et al. , 384 (12), 1163–1167. 10.1056/NEJMms2031080. [DOI] [PubMed] [Google Scholar]
- (13).Waters EA; Colditz GA; Davis KL Essentialism and Exclusion: Racism in Cancer Risk Prediction Models. J Natl Cancer Inst 2021, djab074. 10.1093/jnci/djab074. [DOI] [PMC free article] [PubMed] [Google Scholar]
- (14).van der Ploeg T; Austin PC; Steyerberg EW Modern Modelling Techniques Are Data Hungry: A Simulation Study for Predicting Dichotomous Endpoints. BMC Med Res Methodol 2014, 14, 137. 10.1186/1471-2288-14-137. [DOI] [PMC free article] [PubMed] [Google Scholar]
- (15).Houssami N; Ciatto S Mammographic Surveillance in Women with a Personal History of Breast Cancer: How Accurate? How Effective? Breast 2010, 19 (6), 439–445. 10.1016/j.breast.2010.05.010. [DOI] [PubMed] [Google Scholar]
- (16).Lu W; Schaapveld M; Jansen L; Bagherzadegan E; Sahinovic MM; Baas PC; et al. The Value of Surveillance Mammography of the Contralateral Breast in Patients with a History of Breast Cancer. Eur J Cancer 2009, 45 (17), 3000–3007. 10.1016/j.ejca.2009.08.007. [DOI] [PubMed] [Google Scholar]
- (17).Lu WL; Jansen L; Post WJ; Bonnema J; Van de Velde JC; De Bock GH Impact on Survival of Early Detection of Isolated Breast Recurrences after the Primary Treatment for Breast Cancer: A Meta-Analysis. Breast Cancer Res Treat 2009, 114 (3), 403–412. 10.1007/s10549-008-0023-4. [DOI] [PubMed] [Google Scholar]
- (18).Runowicz CD; Leach CR; Henry NL; Henry KS; Mackey HT; Cowens-Alvarado RL; et al. American Cancer Society/American Society of Clinical Oncology Breast Cancer Survivorship Care Guideline. J Clin Oncol 2016, 34 (6), 611–635. 10.1200/JCO.2015.64.3809. [DOI] [PubMed] [Google Scholar]
- (19).Khatcheressian JL; Hurley P; Bantug E; Esserman LJ; Grunfeld E; Halberg F; et al. Breast Cancer Follow-up and Management after Primary Treatment: American Society of Clinical Oncology Clinical Practice Guideline Update. J Clin Oncol 2013, 31 (7), 961–965. 10.1200/JCO.2012.45.9859. [DOI] [PubMed] [Google Scholar]
- (20).Expert Panel on Breast Imaging; Lewin AA; Moy L; Baron P; Didwania AD; diFlorio-Alexander RM; et al. ACR Appropriateness Criteria® Stage I Breast Cancer: Initial Workup and Surveillance for Local Recurrence and Distant Metastases in Asymptomatic Women. J Am Coll Radiol 2019, 16 (11S), S428–S439. 10.1016/j.jacr.2019.05.024. [DOI] [PubMed] [Google Scholar]
- (21).National Comprehensive Cancer Network (NCCN). Clinical Practice Guidelines in Oncology - Breast Cancer, Version 3, 2021. [DOI] [PubMed] [Google Scholar]
- (22).Monticciolo DL; Newell MS; Moy L; Niell B; Monsees B; Sickles EA Breast Cancer Screening in Women at Higher-Than-Average Risk: Recommendations From the ACR. J Am Coll Radiol 2018, 15 (3 Pt A), 408–414. 10.1016/j.jacr.2017.11.034. [DOI] [PubMed] [Google Scholar]
- (23).Houssami N; Abraham LA; Miglioretti DL; Sickles EA; Kerlikowske K; Buist DSM; et al. Accuracy and Outcomes of Screening Mammography in Women with a Personal History of Early-Stage Breast Cancer. JAMA 2011, 305 (8), 790–799. 10.1001/jama.2011.188. [DOI] [PMC free article] [PubMed] [Google Scholar]
- (24).Buist DSM; Abraham LA; Barlow WE; Krishnaraj A; Holdridge RC; Sickles EA; et al. Diagnosis of Second Breast Cancer Events after Initial Diagnosis of Early Stage Breast Cancer. Breast Cancer Res Treat 2010, 124 (3), 863–873. 10.1007/s10549-010-1106-6. [DOI] [PMC free article] [PubMed] [Google Scholar]
- (25).Lee JM; Ichikawa LE; Wernli KJ; Bowles E; Specht JM; Kerlikowske K; et al. Digital Mammography and Breast Tomosynthesis Performance in Women with a Personal History of Breast Cancer, 2007–2016. Radiology 2021, 300 (2), 290–300. 10.1148/radiol.2021204581. [DOI] [PMC free article] [PubMed] [Google Scholar]
- (26).Breast Cancer Surveillance Consortium. https://www.bcsc-research.org/. [Google Scholar]
- (27).American Joint Committee on Cancer. AJCC Cancer Staging Manual, 8th ed.; Springer-Verlag New York: New York, 2017. [Google Scholar]
- (28).Buist DSM Factors to Consider in Developing Breast Cancer Risk Models to Implement into Clinical Care. Curr Epidemiol Rep 2020, 7 (2), 113–116. 10.1007/s40471-020-00230-9. [DOI] [PMC free article] [PubMed] [Google Scholar]
- (29).American College of Radiology. American College of Radiology Breast Imaging Reporting and Data System Atlas (BI-RADS® Atlas), 5th ed.; Reston, VA: American College of Radiology, 2013. [Google Scholar]
- (30).Lee JM; Buist DSM; Houssami N; Dowling EC; Halpern EF; Gazelle GS; et al. Five-Year Risk of Interval-Invasive Second Breast Cancer. J Natl Cancer Inst 2015, 107 (7), djv109. 10.1093/jnci/djv109. [DOI] [PMC free article] [PubMed] [Google Scholar]
- (31).Lee JM; Abraham L; Lam DL; Buist DSM; Kerlikowske K; Miglioretti DL; et al. Cumulative Risk Distribution for Interval Invasive Second Breast Cancers After Negative Surveillance Mammography. J Clin Oncol 2018, 36 (20), 2070–2077. 10.1200/JCO.2017.76.8267. [DOI] [PMC free article] [PubMed] [Google Scholar]
- (32).Breast Cancer Surveillance Consortium. Breast Cancer Surveillance Consortium Glossary of Terms, Version 3, 2020. https://www.bcsc-research.org/application/files/6916/1429/6964/BCSC_Data_Definitions_v3__2020.09.23.pdf. [Google Scholar]
- (33).Bissell MCS; Kerlikowske K; Sprague BL; Tice JA; Gard CC; Tossas KY; et al. Breast Cancer Population Attributable Risk Proportions Associated with Body Mass Index and Breast Density by Race/Ethnicity and Menopausal Status. Cancer Epidemiol Biomarkers Prev 2020, 29 (10), 2048–2056. 10.1158/1055-9965.EPI-20-0358. [DOI] [PMC free article] [PubMed] [Google Scholar]
- (34).Hennessy S; Bilker WB; Berlin JA; Strom BL Factors Influencing the Optimal Control-to-Case Ratio in Matched Case-Control Studies. American Journal of Epidemiology 1999, 149 (2), 195–197. 10.1093/oxfordjournals.aje.a009786. [DOI] [PubMed] [Google Scholar]
- (35).Stürmer T; Brenner H Degree of Matching and Gain in Power and Efficiency in Case-Control Studies. Epidemiology 2001, 12 (1), 101–108. 10.1097/00001648-200101000-00017. [DOI] [PubMed] [Google Scholar]
- (36).Ali A; Shamsuddin SM; Ralescu AL Classification with Class Imbalance Problem: A Review. Int J Adv Soft Comput Appl 2015, 7, 166–204. [Google Scholar]
- (37).Japkowicz N; Stephen S The Class Imbalance Problem: A Systematic Study. IDA 2002, 6 (5), 429–449. 10.3233/IDA-2002-6504. [DOI] [Google Scholar]
- (38).Saphner T; Tormey DC; Gray R Annual Hazard Rates of Recurrence for Breast Cancer after Primary Therapy. J Clin Oncol 1996, 14 (10), 2738–2746. 10.1200/JCO.1996.14.10.2738. [DOI] [PubMed] [Google Scholar]
- (39).Colleoni M; Sun Z; Price KN; Karlsson P; Forbes JF; Thürlimann B; et al. Annual Hazard Rates of Recurrence for Breast Cancer During 24 Years of Follow-Up: Results From the International Breast Cancer Study Group Trials I to V. J Clin Oncol 2016, 34 (9), 927–935. 10.1200/JCO.2015.62.3504. [DOI] [PMC free article] [PubMed] [Google Scholar]
- (40).Tibshirani R Regression Shrinkage and Selection Via the Lasso. Journal of the Royal Statistical Society: Series B (Methodological) 1996, 58 (1), 267–288. 10.1111/j.2517-6161.1996.tb02080.x. [DOI] [Google Scholar]
- (41).Zou H; Hastie T Regularization and Variable Selection via the Elastic Net. J Royal Statistical Soc B 2005, 67 (2), 301–320. 10.1111/j.1467-9868.2005.00503.x. [DOI] [Google Scholar]
- (42).Javanmard A; Montanari A Confidence Intervals and Hypothesis Testing for High-Dimensional Regression. Journal of Machine Learning Research 2014, 15, 2869–2909. [Google Scholar]
- (43).Breiman L Random Forests. Machine Learning 2001, 45 (1), 5–32. 10.1023/A:1010933404324. [DOI] [Google Scholar]
- (44).Friedman JH Greedy Function Approximation: A Gradient Boosting Machine. Ann. Statist 2001, 29 (5). 10.1214/aos/1013203451. [DOI] [Google Scholar]
- (45).van Buuren S Multiple Imputation of Discrete and Continuous Data by Fully Conditional Specification. Stat Methods Med Res 2007, 16 (3), 219–242. 10.1177/0962280206074463. [DOI] [PubMed] [Google Scholar]
- (46).White IR; Royston P; Wood AM Multiple Imputation Using Chained Equations: Issues and Guidance for Practice. Stat Med 2011, 30 (4), 377–399. 10.1002/sim.4067. [DOI] [PubMed] [Google Scholar]
- (47).von Hippel PT How to Impute Interactions, Squares, and Other Transformed Variables. Sociological Methodology 2009, 39 (1), 265–291. 10.1111/j.1467-9531.2009.01215.x. [DOI] [Google Scholar]
- (48).Steyerberg EW; Vickers AJ; Cook NR; Gerds T; Gonen M; Obuchowski N; et al. Assessing the Performance of Prediction Models: A Framework for Traditional and Novel Measures. Epidemiology 2010, 21 (1), 128–138. 10.1097/EDE.0b013e3181c30fb2. [DOI] [PMC free article] [PubMed] [Google Scholar]
- (49).Hosmer DW; Lemeshow S Applied Logistic Regression: Hosmer/Applied Logistic Regression; John Wiley & Sons, Inc.: Hoboken, NJ, USA, 2000. 10.1002/0471722146. [DOI] [Google Scholar]
- (50).Wang F; Zheng W; Bailey CE; Mayer IA; Pietenpol JA; Shu X-O Racial/Ethnic Disparities in All-Cause Mortality among Patients Diagnosed with Triple-Negative Breast Cancer. Cancer Res 2021, 81 (4), 1163–1170. 10.1158/0008-5472.CAN-20-3094. [DOI] [PMC free article] [PubMed] [Google Scholar]
- (51).Hirschman J; Whitman S; Ansell D The Black:White Disparity in Breast Cancer Mortality: The Example of Chicago. Cancer Causes Control 2007, 18 (3), 323–333. 10.1007/s10552-006-0102-y. [DOI] [PubMed] [Google Scholar]
- (52).Han H; Guo X; Yu H Variable Selection Using Mean Decrease Accuracy and Mean Decrease Gini Based on Random Forest. In 2016 7th IEEE International Conference on Software Engineering and Service Science (ICSESS); IEEE: Beijing, China, 2016; pp 219–224. 10.1109/ICSESS.2016.7883053. [DOI] [Google Scholar]
- (53).Janes H; Longton G; Pepe M Accommodating Covariates in ROC Analysis. Stata J. 2009. Jan 1;9(1):17–39. [PMC free article] [PubMed] [Google Scholar]
- (54).Hubbard RA; Miglioretti DL A Semiparametric Censoring Bias Model for Estimating the Cumulative Risk of a False-Positive Screening Test under Dependent Censoring. Biometrics 2013, 69 (1), 245–253. 10.1111/j.1541-0420.2012.01831.x. [DOI] [PMC free article] [PubMed] [Google Scholar]
- (55).Gail MH; Pfeiffer RM Is the Benign Breast Disease Breast Cancer Model Well Calibrated? J Clin Oncol 2015, 33 (25), 2829–2830. 10.1200/JCO.2015.61.6177. [DOI] [PubMed] [Google Scholar]
- (56).Couronné R; Probst P; Boulesteix A-L Random Forest versus Logistic Regression: A Large-Scale Benchmark Experiment. BMC Bioinformatics 2018, 19 (1), 270. 10.1186/s12859-018-2264-5. [DOI] [PMC free article] [PubMed] [Google Scholar]
- (57).Jaeger BC; Tierney NJ; Simon NR When to Impute? Imputation before and during Cross-Validation. arXiv:2010.00718 [cs, stat] 2020. [Google Scholar]
Associated Data
This section collects any data citations, data availability statements, or supplementary materials included in this article.
Supplementary Materials
Data Availability Statement
The data underlying this article will be shared on reasonable request to the corresponding author and BCSC with appropriate regulatory approvals.