Abstract
The endothelium contains morphologically similar cells throughout the vasculature, but individual cells along the length of a single vascular tree or in different regional circulations function dissimilarly. When observations made in large arteries are extrapolated to explain the function of endothelial cells (ECs) in the resistance vasculature, only a fraction of these observations are consistent between artery sizes. To what extent endothelial (EC) and vascular smooth muscle cells (VSMCs) from different arteriolar segments of the same tissue differ phenotypically at the single-cell level remains unknown. Therefore, single-cell RNA-seq (10x Genomics) was performed using a 10X Genomics Chromium system. Cells were enzymatically digested from large (>300 µm) and small (<150 µm) mesenteric arteries from nine adult male Sprague-Dawley rats, pooled to create six samples (3 rats/sample, 3 samples/group). After normalized integration, the dataset was scaled before unsupervised cell clustering and cluster visualization using UMAP plots. Differential gene expression analysis allowed us to infer the biological identity of different clusters. Our analysis revealed 630 and 641 differentially expressed genes (DEGs) between conduit and resistance arteries for ECs and VSMCs, respectively. Gene ontology analysis (GO-Biological Processes, GOBP) of scRNA-seq data discovered 562 and 270 pathways for ECs and VSMCs, respectively, that differed between large and small arteries. We identified eight and seven unique ECs and VSMCs subpopulations, respectively, with DEGs and pathways identified for each cluster. These results and this dataset allow the discovery and support of novel hypotheses needed to identify mechanisms that determine the phenotypic heterogeneity between conduit and resistance arteries.
Keywords: endothelial, heterogeneity, mesenteric, single-cell RNAseq, smooth muscle
INTRODUCTION
The vascular wall’s primary cellular constituents are endothelial cells (ECs) and vascular smooth muscle cells (VSMCs). ECs synthesize and release substances that control vascular tone as well as enzymes and factors that control blood clotting, immune function, and platelet adhesion (1). VSMCs also play essential roles in blood vessel function, including maintaining vascular tone and the production of extracellular matrix components (2, 3).
Arteries of different sizes are exposed to different intraluminal pressure and potentially different metabolites from the surrounding tissue. As a result, although the vasculature contains morphologically similar cells throughout, individual cells along the length of a single vascular tree or in different regional circulations function quite differently. When observations made in large arteries are extrapolated to explain the function of vascular cells in the resistance circulation, only a fraction of these observations are consistent between artery sizes (4). Characterizing cellular heterogeneity is critical in understanding the mechanisms of the divergent vascular function in different arterial segments.
Vascular gene expression profiles have been performed in ECs and VSMCs using next-generation single-cell RNA sequencing (scRNA-seq) (5–14). Previous scRNA-seq studies have characterized EC heterogeneity in single tissues like the aorta (10) or brain (5, 11). Whereas, other studies investigated EC heterogeneity between organs (12). scRNA-seq studies examining intraorgan EC heterogeneity have revealed a diversity of endothelial-expressed genes among arterial, capillary, and venous populations suggesting that endothelial cells exist on a continuum from arterial to venous phenotypes (5, 7, 12, 13). Fewer studies exist examining VSMC heterogeneity in different vascular segments of a single organ (5) or disease-relevant transcriptional changes (6, 15). Studies examining intraorgan vascular cell heterogeneity have classified VSMCs into “arterial,” “capillary,” or “venous,” either by physical separation or based on transcriptomic profile. However, to what extent ECs and VSMCs within and between different arterial segments (i.e., vessel branch order) of the same tissue are phenotypically heterogeneous at the single-cell level remains unknown. We, therefore, performed scRNA-seq in cell within the vascular wall of large and small mesenteric arteries to characterize single-cell vascular heterogeneity within a single arteriolar system.
In addition, our previous work has shown that sensitivity to the vasodilator hydrogen sulfide (H2S) in large arteries (>200 μm) is dependent on the membrane cholesterol content of ECs, whereas smaller arteries (<200 μm) are inherently highly sensitive to H2S. In addition, we have demonstrated that ECs from large arteries contain more cholesterol in the plasma membrane than ECs from smaller arteries (16). We validated one of the genes identified in our in silico analysis of our scRNA-seq data involved in the regulation of cellular cholesterol content.
MATERIALS AND METHODS
Animals
Nine male Sprague-Dawley rats (Envigo, 250–300 g, 9–10 wk old) were used for all experiments. The Institutional Animal Care and Use Committee of the University of New Mexico School of Medicine reviewed and approved all animal protocols. All protocols conformed to National Institutes of Health guidelines for animal use.
Mesenteric Artery Isolation
Rats were euthanized with a lethal concentration of pentobarbital sodium (200 mg/kg ip). The left ventricle was injected with heparin (100 units, 1 mL total), followed by perfusion via the left ventricle with HEPES buffer (mmol/L: 1.4 CaCl2, 0.03 EDTA, 10.10 glucose, 10 HEPES, 6 KCl, 2.13 MgSO4, and 134 NaCl) containing 10 µM sodium-nitroprusside and 4% wt/vol bovine serum albumin. The mesentery was removed and placed in an ice-cold dissection buffer (HEPES containing 10 µM sodium-nitroprusside and 0.1% wt/vol bovine serum albumin). Arteries were isolated, cleaned of adipose tissue, and separated based on size. The superior mesenteric artery and first-order arteries (lumen diameter ∼>300 µm) were considered “large,” and fifth-order branches or higher (lumen diameter ∼< 150 µm) were considered “small” arteries. For consistency, all arteries from all samples were separated by size by one individual. For each sample, arteries from three rats were pooled to collect enough cells for downstream sequencing applications (3 rats/sample, 3 samples/group).
Mesenteric Artery Dissociation
Artery segments were transferred to tubes containing warm dissociation buffer: HEPES (mmol/L: 1.4 CaCl2, 0.03 EDTA, 10.10 glucose, 10 HEPES, 6 KCl, 2.13 MgSO4, and 134 NaCl), 0.1% bovine serum albumin, 13 U/mL papain, 427 U/mL collagenase II, 1 mg/mL dithiothreitol, and 150 U/mL deoxyribonuclease I. Arteries were incubated in a dissociation buffer for 40 min at 37°C. Artery segments were then gently triturated with a small-bore glass pipette to release cells. Isolated cells were then passed through a 70-µM cell strainer and rinsed with 5 mL of cold wash buffer (1× PBS containing 1% bovine serum albumin). Cells were pelleted by centrifugation at 1,050 rpm for 10 min at 4°C. The supernatant was aspirated, and cell pellets were resuspended in cold wash buffer before cell counting and 10× library prep.
Library Prep and Sequencing
Cell concentrations and viability were determined using the Cell Countess II FL (Thermo Fisher) before calculating cell counts and loading the suspension into the Next GEM (Gel bead-In EMulsions) Chip G and Chromium Controller (10x Genomics) per the manufacturer’s protocol for GEM formation. The 10x Chromium Next GEM 3′ protocol was used to create 3′ libraries for sequencing at the University of Colorado Anschutz Medical Campus’s Genomics Shared Resource Cancer Center using Illumina NovaSEQ 6000 instruments on S4 Flow cells. Briefly, cells were lysed and barcoded within each GEM before first-strand DNA synthesis, also within each GEM After GEM’s are broken, cells are pooled before library completion as described in the manufacturer’s protocol. Library quality was assessed after cDNA synthesis and after completion on the BioAnalyzer using a DNA High Sensitivity Chip (Agilent). Before sequencing, Agilent Tape Station 4200 and Invitrogen Qubit 4.0 reagents were used to determine final library concentrations before dilution, normalization, and pooling at 4 nM. qPCR was used to determine cluster efficiency before loading libraries into NovaSEQ machines.
Single-Cell Data Analysis: Multiple Samples, Integrated
Sample data were demultiplexed, and fastq files were generated using bcl2fastq (v.2.20.0.422, Illumina) with parameter “–barcode-mismatches” set to 1. Fastq files were aligned, and genes/cells were counted using CellRanger (v.3.1.1, 10x Genomics) against the Rattus norvegicus reference genome (Rnor_6.0) (17). CellRanger-generated filtered files were used for downstream analysis.
Seurat (v.4.1.0), an R package (v.4.1.2), was used for downstream analysis (17–20). Scater (v.1.22.1) was used to identify and remove cells that were outliers for counts or features and cells with >= 10% mitochondrial counts (20). scDblFinder (v.1.8.0) was used to identify and remove doublet cells (21). As implemented in Seurat, data was transformed using SCTransform (v.0.3.2, Ref. 7). Data from all samples were integrated using Seurat’s standard integration workflow. Principle component (PC) analysis and an elbow plot were used to visualize the variance and select PCs (1:40 for all cells, 1:20 for EC and VSMC subsets) before unsupervised clustering. Clusters were determined using the FindNeighbors and FindClusters function with default parameters and the resolution set to 0.5. Cell type prediction was performed using SingleR (v.1.4.0) against the publicly available data set from Cheng et al. (22). After subsetting, EC and VSMC populations were re-transformed, re-integrated, and re-clustered as described earlier. Differential gene expression between clusters and/or cell types was determined using the FindConservedMarkers function within Seurat, the grouping variable set to artery size. Differential gene expression between cells from small and large arteries was determined using the FindMarkers function. Significant genes were defined by average log fold-change >= 0.25, adjusted P value <= 0.05, and expressed in >10% of the cells in the cluster. An additional “biomarker” level of stringency was defined as genes either having an average log fold-change >= 1.0, or genes expressed in >= 70% of the cells in the cluster and <= 30% outside of the cluster. ClusterProfiler (23) and escape (24) were used for pathway analysis against the G.O. Ontology Biological Process database.
EC Tube Isolation
Mesenteric arteries (large >250 μm, small <150 μm) were placed in HEPES buffer containing 10 μM sodium nitroprusside and 0.1% bovine serum albumin and cleared of connective and adipose tissue. Arteries were flushed of blood and exposed to a HEPES-buffered digestion solution containing 0.1% bovine serum albumin, 0.62 mg/mL of papain, 1.5 mg/mL of collagenase II, and 1 mg/mL of dithiothreitol. Arteries were digested at 37°C for 33 min or 40 min for small and large arteries, respectively. Artery segments were then triturated to disrupt the adventitia and smooth muscle layers. Isolated endothelial tubes were then mounted on glass slides.
Quantification of EC Membrane Cholesterol
To detect membrane cholesterol, isolated endothelial tubes were fixed with 4% paraformaldehyde for 20 min at room temperature before staining with the cholesterol marker filipin III 50 μg/mL for 45 min at 37°C and mounted with ProlongGold Antifade (Thermo Fisher P10144) as described previously (16). A subset of arteries was also stained with CellMask-Deep Red Plasma Membrane Stain (1:1,000, Thermo Fisher C10046) to demonstrate plasma membrane delimited filipin staining (Supplemental Fig. S1, see https://doi.org/10.6084/m9.figshare.21830844) Samples were imaged using fluorescent confocal microscope (Zeiss LSM 800 AxioObserver.Z1/7; Göttingen, Germany) using a 353 nm laser (excitation), a 465 nm long pass filter (emission) for filipin staining, and a 642 nm laser (excitation), a 657 nm laser long pass filter (emission) for CellMask staining, with a Plan-Apochromat ×63/1.4 numerical aperture (NA) oil immersion objective. Filipin staining was quantified using ImageJ. A total of 4 tubes/artery size/animal from five animals were analyzed. The mean fluorescence intensity of each endothelial tube was measured and averaged to determine a mean fluorescence value for each animal.
ABCA1 Expression
ABCA1 expression was quantified using immunofluorescence in endothelial tubes. Briefly, endothelial tubes were fixed with 4% paraformaldehyde for 20 min at room temperature. Samples were blocked with 5% bovine serum albumin and treated with ABCA1 primary antibody (1:100) (Thermo Fisher, PA1-16789) overnight at 4°C. Endothelial tubes were then blocked with 5% normal donkey serum for 1 h at 37°C and incubated with donkey α-rabbit 488 (1:750) (Jackson ImmunoResearch Labs, 711-546-152) in 0.05% serum for 4 h at 37°C. Samples were mounted with Prolong Gold Antifade (Thermo Fisher, P36935) and images were acquired using confocal microscopy (Zeiss LSM 800 AxioObserver.Z1/7) using a 493 nm laser (excitation) and 517 nm long pass filter (emission) and a Plan-Apochromat ×63/1.4 NA oil immersion objective. A total of 4 tubes/artery size/animal from five animals were analyzed. The mean fluorescence intensity of each endothelial tube was measured and averaged to determine a mean fluorescence value for each animal.
Mesenchymal Stem Cell Marker Expression
Mesenchymal stem cell marker expression was quantified using immunofluorescence and confocal microscopy in rat mesenteric arteries. The arteries were frozen in O.C.T compound (optical cutting temperature) (Tissue Tek), cut in 10 µm cross-sections, and mounted on slides. The slides were air-dried at room temperature for 30 min followed by a 5-min wash in PBS. Artery sections were permeabilized with 0.1% Triton X-100 in PBS for 45 min at 37°C and blocked with 5% BSA in PBS for 1 h at 37°C. Artery sections were then stained overnight at 4°C with primary antibodies against CD34 (1:100, Abclonal A0761), CD44 (1:100, Abclonal 16807), and SM22 (1:300, Sigma A2547) and each was diluted in 1% BSA in PBS. Artery sections were then blocked with 5% normal donkey serum for 1 h at 37°C, incubated with donkey α-rabbit 488 (1:1,000) (Jackson ImmunoResearch Labs, 711-546-152) and donkey α-mouse-647 (1:1,000) (Jackson ImmunoResearch Labs, 211-005-109) in 0.05% normal donkey serum for 2 h at 37°C and mounted with Prolong Gold Antifade. Images were acquired using a confocal microscopy (Zeiss LSM 800 AxioObserver.Z1/7) using a 353 nm laser (excitation), and 465 nm long pass filter (emission) for nuclear staining, a 493 nm laser (excitation), and 517 nm long pass filter (emission) for the mesenchymal stem cell markers, a 653 nm laser (excitation), and 668 nm long pass filter (emission) for the smooth muscle marker and a Plan-Apochromat x63/1.4 NA oil immersion objective.
Reagents
Collagenase II (Cat. No. 4174) and deoxyribonuclease I (Cat. No. 2139) were purchased from Worthington Biochemical Corporation (Lakewood, NJ). Papain was purchased from Sigma Aldrich (P4762). All other reagents were from Sigma Aldrich (St. Louis, MO) unless otherwise stated.
Independent Data Access and Data Sharing
J.S.N. and K.J.B. had full access to all the study data and took responsibility for its integrity and data analysis. Both the raw and processed data are available at GEO (No. GSE202244).
RESULTS
Characterization of Vascular Cell Phenotype
We performed massively parallel single-cell transcriptomic profiling of large and small mesenteric arteries from nine male Sprague-Dawley rats. Large and small arteries from each animal were pooled to create three samples of each artery size. After quality control, 45,921 cells were included in the analysis, of which 3,601 and 3,605 were endothelial or VSM cells, respectively. The expression of Vcam1 has been shown to positively correlate with vessel diameter (25). In our study, Vcam1 was downregulated in ECs from small arteries, demonstrating that we isolated two distinct artery populations. More cells were isolated from small arteries (35,085) compared with large arteries (10,836).
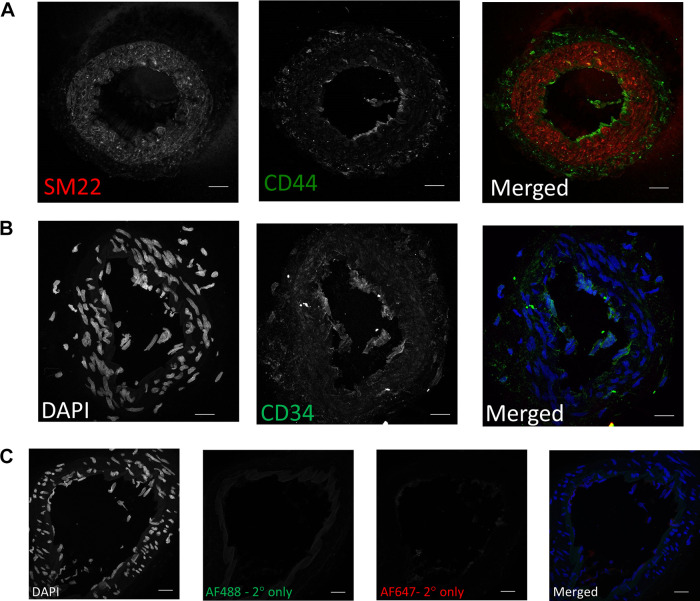
Unbiased cluster analysis of cells from large and small mesenteric arteries initially revealed 17 clusters (Supplemental Fig. S2; see https://doi.org/10.6084/m9.figshare.21830847). Smaller subclusters were manually merged to leave a final total of 12 clusters. These clusters are graphically illustrated in Fig. 1 as uniform manifold approximation and projection (UMAP) (Fig. 1A) and t-distributed stochastic neighbor embedding plots (t-SNE) (Fig. 1B). The proportion of cells per cluster differed between large and small arteries (Fig. 1C). Clusters were then annotated to major vascular cell types (Fig. 2A) using the designations described by Cheng et al. (22). Annotation accuracy was verified by checking the expression of known canonical marker genes. In this pooled population of cells from both large and small arteries, we identified two clusters of mesenchymal stem cells (MSC.; Gpx3, Dcn), two endothelial clusters (Fig. 2B; Cdh5, Vwf, Tek, Flt1), a single smooth muscle cluster (Fig. 2C; Acta2, Taglin, Myh11), two distinct clusters of neurons (Plp1), and five immune cell clusters (Ptprc). The single VSMC cluster suggests mesenteric artery VSMCs are more homogeneous than ECs (2 clusters). Figure 2, B and C, illustrates the expression level of canonical gene markers used for the in silico identification of ECs (Fig. 2B) and VSMCs (Fig. 2C). For ECs, Vwf and Tek were significantly downregulated in cells from small arteries compared with large arteries (Supplemental File S1, see https://doi.org/10.6084/m9.figshare.20459127). Whereas VSMC markers Acta2 and Myh11 exhibited significantly lower expression in cells from small arteries (Supplemental File S2; see https://doi.org/10.6084/m9.figshare.20459211). The mesenchymal stem cell population formed the largest population of cells in our analysis, accounting for 66.1% of all cells, suggesting a large reservoir of endogenous vascular wall-resident MSC, which could differentiate into VSMCs (26, 27) or ECs (28–30). This finding was supported using immunofluorescence staining in mesenteric artery cross-sections showing expression of the stem cell marker CD44 (31). These results show CD44 positive cells that appear to be located in the adventitial layer of mesenteric arteries (Fig. 3). CD44 expression did not appear to colocalize with the VSMC marker, SM22. Consistent with our observations, CD44 is known to be expressed by ECs and is important in maintaining the expression of CD31 and VE-cadherin (32). CD34 can be natively expressed in endothelial cells but not in VSMCs (33) and is typically used as a negative marker for mesenchymal stem cells (31). We observed light CD34 staining in the endothelial layer and medial, but not the adventitial layer. It is possible that these adventitial mesenchymal stem cells act as progenitors of VSMCs in remolding and repair. Further work is needed to fully characterize the large population of cells annotated as mesenchymal stem cells. Whereas immune cells, ECs, VSMCs, and neurons accounted for 16.2%, 7.8%, 7.8%, and 1.9% of all cells. The proportion of cell types differed between large and small arteries. MSC made up a greater proportion of cells from small arteries (71.8% vs. 47.8% for small and large, respectively). Whereas the proportion of cells identified as immune (12.2% and 29.5%), endothelial (7.0% vs. 10.4%), and VSMCs (6.9% vs. 11.0%) were lower in small compared with large arteries.
Figure 1.
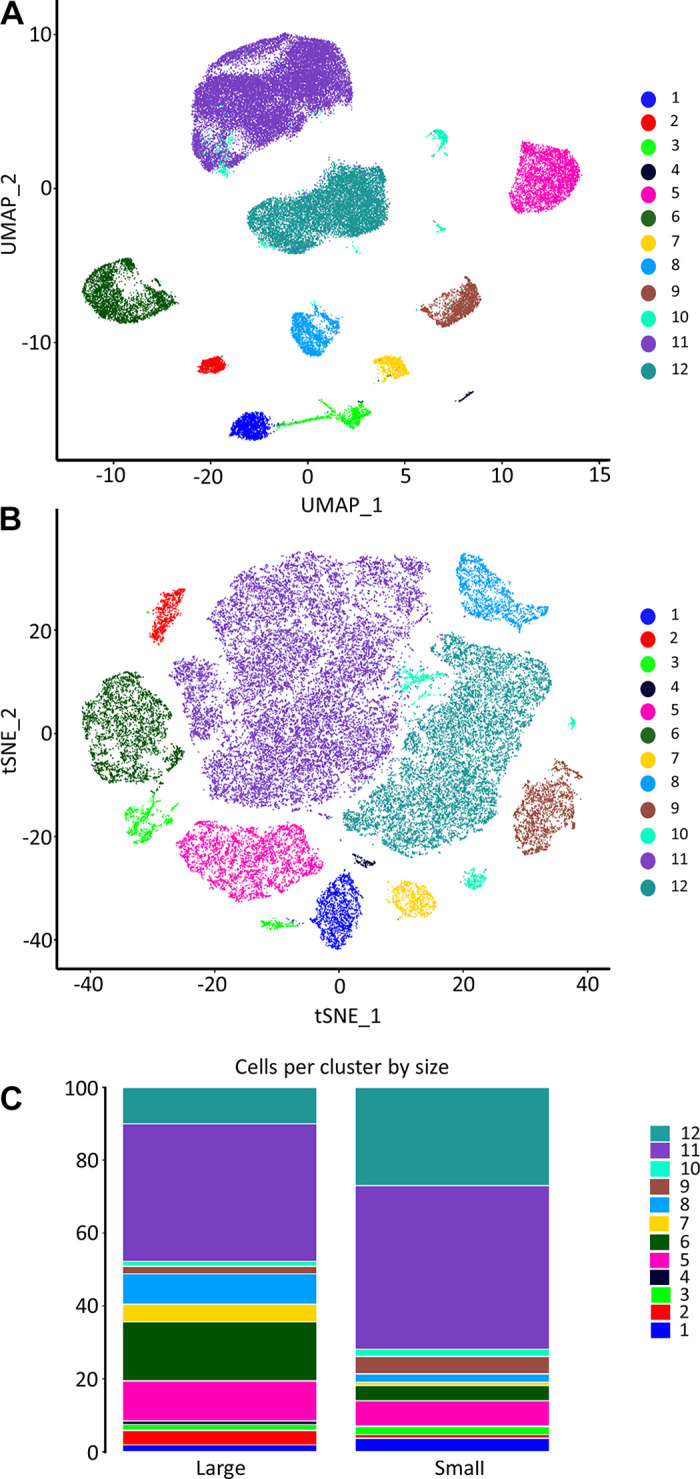
Single-cell RNA-sequencing atlas of mesenteric vascular wall cell types. Unbiased cluster analysis of cells from mesenteric arteries isolated by enzymatic digestion revealed 17 clusters. Smaller subclusters were manually merged to leave a final total of 12 clusters. Uniform manifold approximation and projection (UMAP; A) and t-distributed stochastic neighbor embedding plots (t-SNE; B). The proportion of cells per cluster between samples from large and small arteries (C).
Figure 2.
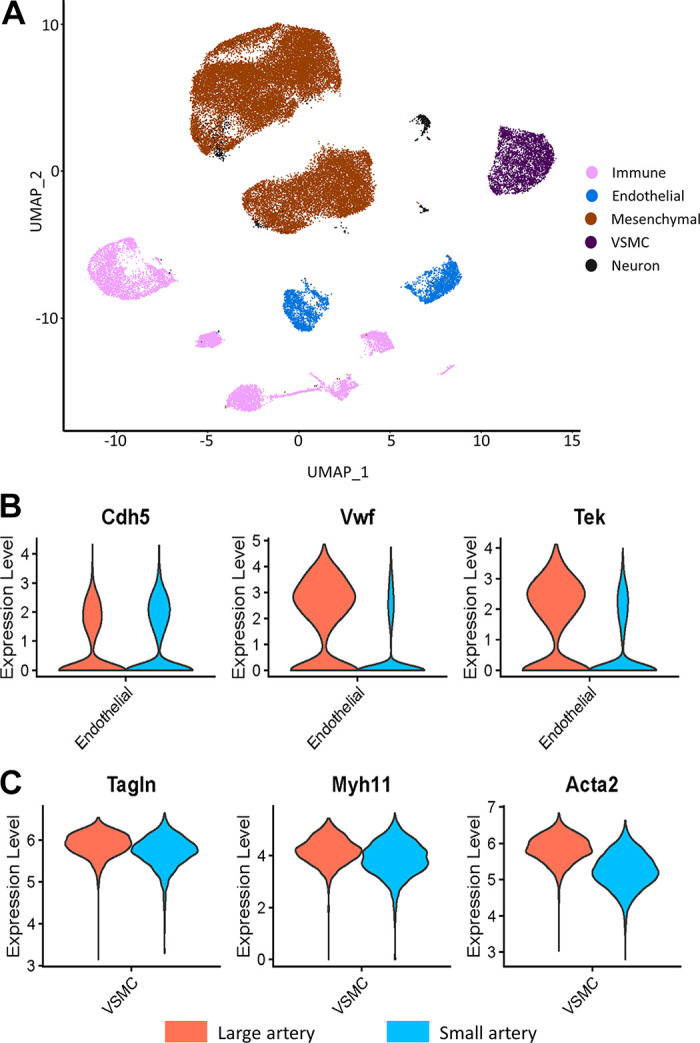
Uniform manifold approximation and projection (UMAP) plot of in silico identified cells, color coded by cell type (A). Violin plots of the expression of gene markers confirming in silico identification of endothelial cells (ECs) (B) and vascular smooth muscle cells (VSMCs) (C). MSC, mesenchymal stem cell. For A, immune cells (pink), endothelial cells (blue), mesenchymal cells (brown), SMC (purple), neurons (black). For B and C, large (orange) and small (blue).
Figure 3.
Representative images of the positive (CD44; A) and negative (CD34; B) mesenchymal stem cell markers in mesenteric artery cross sections. Sm22 (red) was used as a vascular smooth muscle cell (VSMC) marker, DAPI for nuclei (blue), CD44 and CD34 (green). C: seconday antibody only negative controls. Scale bar = 20 µm.
ECs and VSMCs from Large and Small Arteries Consist of Transcriptionally Distinct Subtypes
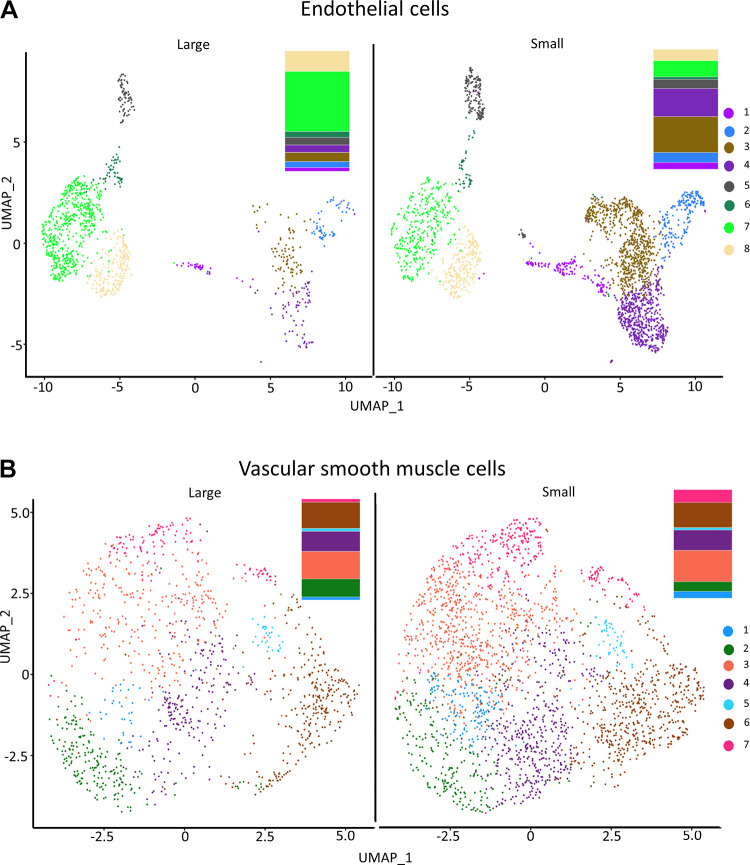
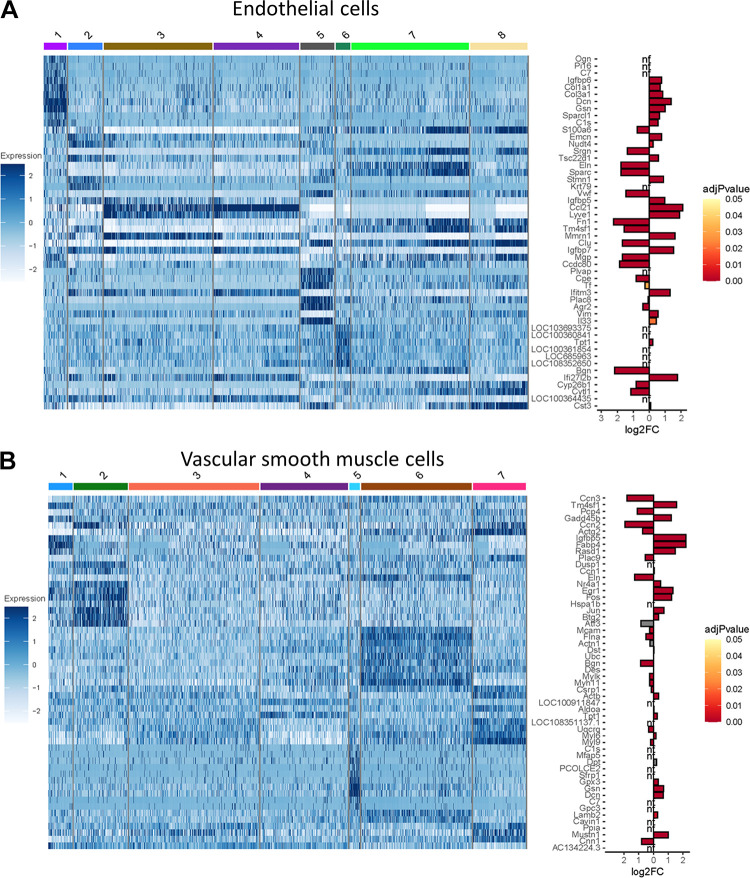
We identified 630 (ECs) and 641 (VSMCs) differentially expressed genes (DEGs) between large and small arteries (Supplemental Files S1 and S2). A list of all genes identified and “biomarker genes” in ECs and SMC can be found in Supplemental Files S3 and S3B (see https://doi.org/10.6084/m9.figshare.21979304 and https://doi.org/10.6084/m9.figshare.21979643) and Supplemental Files S4 and S4B (see https://doi.org/10.6084/m9.figshare.20459196 and https://doi.org/10.6084/m9.figshare.20465250), respectively. After analyzing cell types, we examined the EC and VSMC subgroups by clustering to define subpopulations within each cell type. Figure 4 illustrates UMAP plots of EC (Fig. 4A) and VSMC (Fig. 4B) subclusters in cells from large and small mesenteric arteries. Cluster analysis revealed eight EC and seven VSMC subclusters. All subclusters contained cells from both large and small arteries. The percentage of cells within each subcluster differed for both ECs and VSMCs (Fig. 4). A greater percentage of ECs from small arteries resided within subclusters 1, 2, 3, 4, and 5 than ECs from large arteries. At the same time, a smaller percentage of small artery ECs were contained within subclusters 6, 7, and 8 compared with large arteries. In addition, ∼50% of ECs from large arteries fell into cluster 7, whereas only 13.3% of small artery ECs fell within this cluster. For VSMCs, the percentage of cells within each subcluster was similar between large and small arteries except for cluster 2 (16.5% vs. 9% for large and small arteries, respectively). A heatmap of the top DEGs identified in each subcluster within pan-ECs (Fig. 5A) and pan-VSMCs (Fig. 5B) cell types is shown in Fig. 5. Analysis of UMAP plots (Fig. 4) and heatmaps (Fig. 5) can illustrate whether separate clusters identified within each cell type represent discrete subpopulations or a continuous phenotypic gradient. EC subclusters 1, 2, 5, and 6 express distinct and nonoverlapping genes, suggesting the presence of discrete subpopulations. In contrast, within EC subclusters 3 and 4 and 7 and 8, expression patterns overlap, suggesting a continuous phenotypic gradient rather than true subpopulations. Subclusters for VSMCs were much more homogeneous compared with EC subclusters. VSMC subclusters 1, 2, 5, 6, and 7 appear to be discrete subpopulations. The remaining subclusters may represent a continuous phenotypic gradient. In addition, many of these DEGs between EC or VSMC subclusters were upregulated in cells from either small or large arteries (bar charts; Fig. 5). Figure 6 contains volcano plots of DEGs between large and small arteries in ECs (Fig. 6A) and VSMCs (Fig. 6B) with genes with >1 log2fold change identified with gene name. In addition, we performed a pathway analysis (reactome.org) for the subclusters that appeared to be discrete subpopulations. We used the list of genes with a large log2FC (>1) when comparing expression in a given subcluster against all other clusters (Supplemental Fig. S3, see https://doi.org/10.6084/m9.figshare.21830850). This pathway analysis revealed that many DEGs in EC subcluster 1 belong to the extracellular matrix (ECM) proteoglycan pathway (genes from our list identified in this pathway include Col1a1, Col1a3, and Dcn, were all upregulated). Genes in EC subcluster 5 were involved in hemostasis and platelet activation (genes from our list identified in this pathway, Vwf, and Tf, were upregulated, and mmrn1 was downregulated). Genes differentially expressed in VSMC subcluster 2 had genes related to the pathway “cellular response to stress” and all of these genes were upregulated (Hspa1b, Fos, Jun, Atf3). For both ECs and VSMCs, the list of DEGs in the other subclusters did not appear to share a common pathway.
Figure 4.
Uniform manifold approximation and projection (UMAP) plot visualization of in silico identified endothelial cell (EC, A) and vascular smooth muscle cell (VSMC, B) subclusters in cells from large and small arteries color coded for the identification of EC and VSMC subclusters. Bar graphs showing the relative fractions (%) of each EC and VSMC subcluster are provided to the right of the UMAP plots.
Figure 5.
Gene expression profiles of endothelial cell (EC) and vascular smooth muscle cell (VSMC) subpopulations. Heatmaps of the top differentially expressed genes (DEGs) identified in each pan-EC (A) and pan-VSMC (B) subcluster (Comparison illustrated is subcluster x vs. all other subclusters). Bar graphs depict a comparison of these genes between large and small arteries. Genes with bars on the left-hand side of the bar plot were enriched in cells from large arteries, whereas genes with bars on the right are enriched in cells from small arteries. Genes with adj P values greater than 0.05 are shown in gray. nf, not found in gene list of DEGs between large and small arteries.
Figure 6.
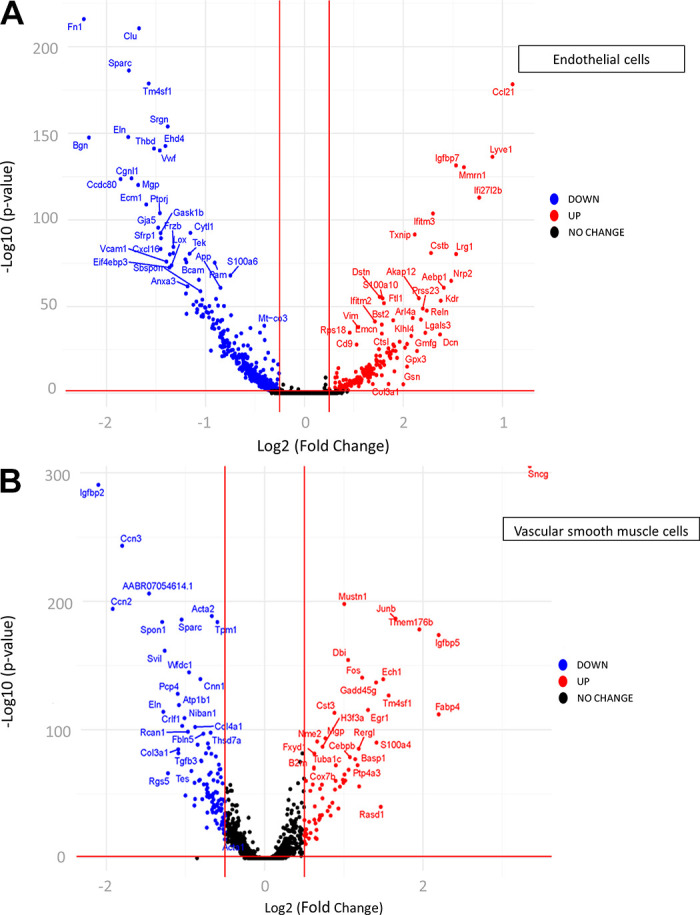
Volcano plots of differentially expressed genes (DEGs) in endothelial cells (ECs, A) and vascular smooth muscle cells (VSMCs, B) between large and small arteries. Genes significantly downregulated (blue) or upregulated (red) in small compared with large. Labels are included only for genes with > 1 log2fold change.
GO-Biological Processes in ECs and VSMCs between Large and Small Arteries
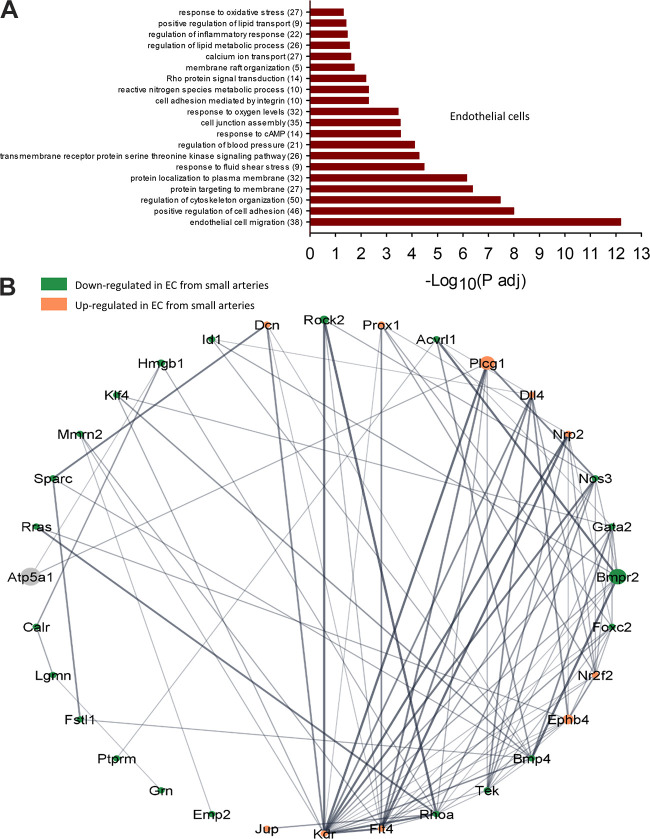
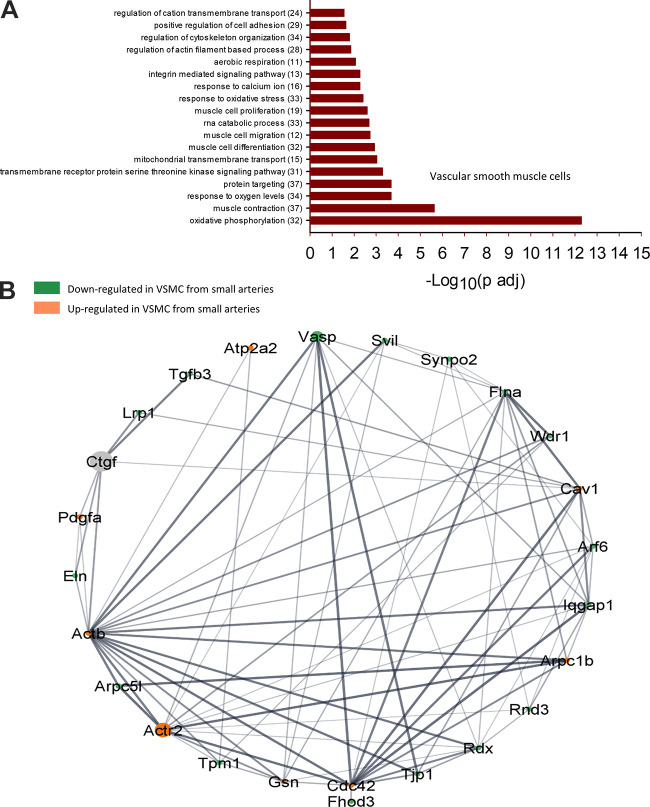
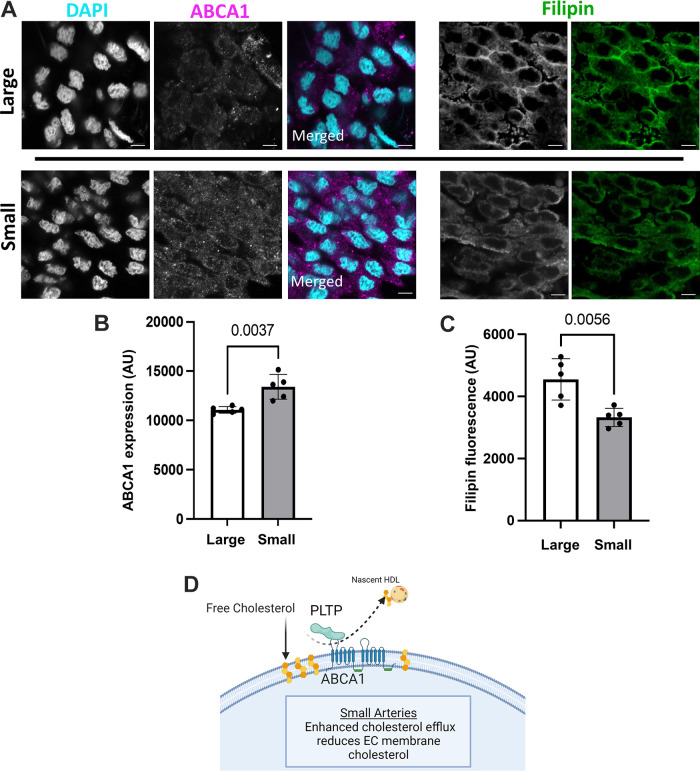
To understand the functional implications of these transcriptional changes, we performed a GO-Biological Processes (GOBP) pathway enrichment analysis using the 630 (ECs) and 641 (VSMCs) DEGs identified in the group analysis. This analysis discovered 562 pathways significantly different between ECs of large and small arteries and 270 pathways between VSMCs from large and small arteries (Supplemental File S5, see https://doi.org/10.6084/m9.figshare.20459184 and Supplemental File S6, https://doi.org/10.6084/m9.figshare.20459172). Figures 7 and 8 contain a subset of these pathways for ECs and VSMCs, respectively. Within ECs, the GOBP pathways containing the greatest number of DEGs between large and small arteries included pathways involved in endothelial cell migration, positive regulation of cell adhesion, and regulation of cytoskeleton organization (Fig. 7A). Figure 7B illustrates a GOBP endothelial cell migration pathway network analysis. As can be seen, most DEGs in this pathway are downregulated in small arteries compared with large arteries. In the VSMC cluster, pathways with the greatest number of DEGs involved oxidative phosphorylation, muscle contraction, response to oxygen levels, protein targeting, and regulation of cytoskeleton organization (Fig. 8A). Figure 8B illustrates a network analysis of the GOBP regulation of actin-filament-based processes pathway. Most DEGs in this pathway are downregulated in small arteries compared with large arteries. Figure 9A illustrates a network analysis of the GOBP positive regulation of cholesterol efflux pathway in ECs. Two genes (Abca1 and Pltp) critical for reverse cholesterol transport were upregulated in ECs from small arteries (Fig 9B). Moreover, ABCA1 protein expression is greater in isolated endothelial cell tubes from small arteries compared with large arteries (Fig. 10, A and B). Indeed, increased ABCA1 expression is associated with a lower plasma membrane cholesterol content in ECs from small arteries compared with ECs from large arteries (Fig. 10, A and C).
Figure 7.
Selected GO biological processes (GOBP) pathway enrichment analysis significantly different between large and small endothelial cells (ECs, A). The number of DEGs within each pathway is shown in parentheses. Network analysis of selected GOBP pathway (endothelial cell migration) generated using String App in Cytoscape (B). Ball diameter represents magnitude of adjusted P value. Downregulated in cells from small arteries (green), upregulated in small arteries (orange). Gray balls are 2nd shell string interactors not found in dataset. Unconnected genes are not shown. Thickness of gray lines indicates strength of the scientific evidence for interaction between two genes.
Figure 8.
Selected GO biological processes (GOBP) pathway enrichment analysis significantly different between large and small vascular smooth muscle cells (VSMCs, A). The number of DEGs within each pathway is shown in parentheses. Network analysis of selected GOBP pathway (Regulation of actin filament-based processes) generated using Search Tool for the Retrieval of Interaction Genes (String) App in Cytoscape (B). Ball diameter represents magnitude of adjusted P value. Downregulated in cells from small arteries (green), upregulated in small arteries (orange). Gray balls are 2nd shell string interactors not found in dataset. Unconnected genes are not shown. Thickness of gray lines indicates strength of the scientific evidence for interaction between two genes.
Figure 9.
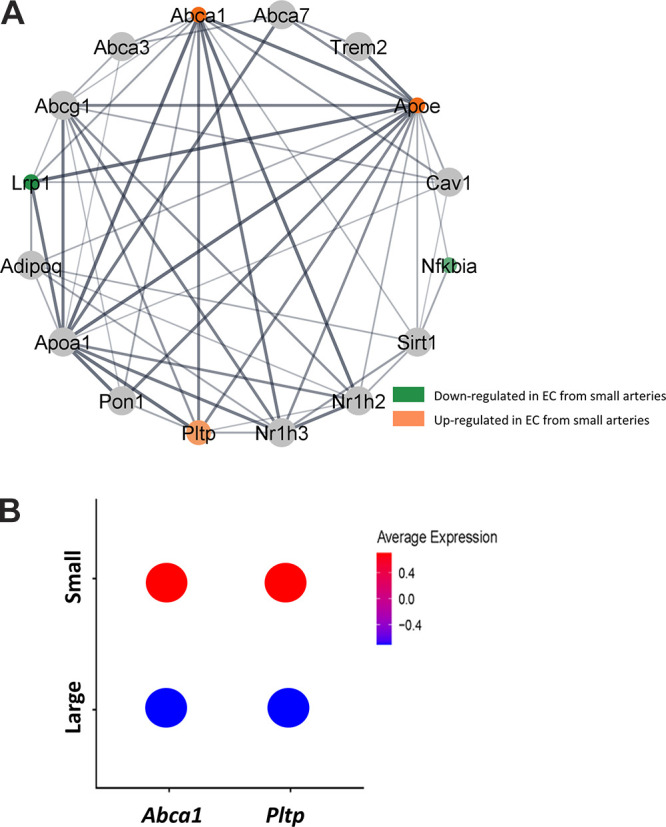
Network analysis of GO biological processes (GOBP) pathway (positive regulation of cholesterol efflux) generated using Search Tool for the Retrieval of Interaction Genes (String) App in Cytoscape (A). Ball diameter represents magnitude of adjusted P value. Downregulated in cells from small arteries (green), upregulated in small arteries (orange). Thickness of gray lines indicates strength of the scientific evidence for interaction between two genes. Average gene expression in endothelial cells (ECs) from large and small arteries from scRNA-seq analysis for Pltp and Abca1 (B).
Figure 10.
Representative images of ABCA1 expression and the membrane cholesterol marker, filipin in endothelial cell tubes from large and small arteries (A). Quantification of mean fluorescence intensity for ABCA1 (B) and Filipin fluorescence (C). Nuclear stain DAPI (cyan), ABCA1 (magenta), and Filipin (green). Secondary antibody only control (Supplemental Fig. S6). Proposed hypothesis of the role of PLTP and ABCA1 in mediating the heterogeneous membrane cholesterol between endothelial cells (ECs) from large and small arteries (D). n = 5 animals/group; statistical comparison, unpaired Student’s t test. Scale bar = 5 µm.
DISCUSSION
The vascular wall comprises multiple cell types, including smooth muscle, endothelial, pericytes, immune, and neurons, with distinct physiological functions. At the transcriptome level, gene expression heterogeneity allows for the clustering of cell types into these major classifications. In addition, there is also significant heterogeneity in gene expression between similar cell types from different organs (8, 11) and within subpopulations of a given cell type within a single organ (8, 10, 12). These previous studies examined vascular cells, particularly endothelial cell, heterogeneity between organs (10) or among broad vascular segments (e.g., arteries, capillaries, veins) (12). For example, Chi et al. (7) performed scRNA-seq studies comparing large artery ECs and microvascular ECs from humans. This study combined cells from different vascular beds to identify Pan-large and Pan-microvascular gene markers (7). Indeed, there is evidence that the mechanisms that regulate vascular function differ between arteriolar segments (16, 34). For example, the mechanisms mediating increases in cytosolic Ca2+ involved Ca2+ influx in the smooth muscle of afferent arterioles, whereas efferent arterioles were primarily dependent on Ca2+ release from intracellular stores (34). Moreover, in contrast to small mesenteric arteries, large mesenteric arteries are insensitive to the vasodilator H2S (16).
To our knowledge, this is the first study to examine heterogeneous gene expression in ECs and VSMCs between artery branch orders in mesenteric arteries. In the present study, we used a droplet-based scRNA-sequencing method (10x genomics) to characterize the genes and functional pathways expressed in vascular cells from two distinct arterial branch orders within the rat mesenteric circulation. Our unbiased approach uses the complete transcriptome to cluster similar cells, allowing the analysis of individual cell types and identifying distinct cell subpopulations. Using this approach, we identified eight distinct subpopulations of ECs and seven subpopulations of VSMCs in mesenteric arteries. We observed significant variation in gene expression both between vascular segments as well as between arterial branch orders within a cluster. However, it is not possible to establish if the variation in the gene expression profiles we identified arises solely from exposure to microenvironmental stimuli such as shear stress, interaction with the extracellular matrix, mechanical forces, or paracrine factors released from the local parenchyma. Indeed, changes in gene expression that occur under cell culture conditions suggest that the microenvironment is an essential regulator of gene expression (35, 36). Alternatively, it is possible that the EC and VSMC subpopulations we identified arise from discrete developmental precursors. For example, Marcu et al. (37) demonstrate organ-specific differences in EC gene expression using fetal ECs that persists for up to five passages.
Vascular EC lining the inner surface of blood vessels is continually exposed to shear stress because of the frictional force created by the blood flow. Shear stress can increase miRNA levels that can alter the expression of genes within endothelial cells, which can also be transported via exosome or argonaut-2 complexes to the adjacent medial layer, altering smooth muscle gene expression (38). For example, miR-143/miR-145 secreted by ECs in response to laminar shear stress has been shown to target gene expression in cocultured SMCs (39). Several studies have demonstrated that members of the Krüppel-like family (Klf) of transcription factors are enriched in the endothelium and play an important role in regulating endothelial genes such as Nos3, Cav1, Gja, and PCAM1 (40). Indeed, the expression of Klf2/4 has been shown to increase with shear stress (41). In the present study, rat mesenteric artery ECs expressed Klf3/4/7/9/10/13. However, only Klf3 and Klf4 were DEGs between ECs from large and small arteries, both being downregulated in cells from small arteries. As shear stress is higher in small arteries compared with large due to the decrease in luminal diameter (42), it is surprising that the expression of Klf family members would be lower in ECs from small arteries. One possible explanation is that both integrin subunit beta1 (Itgb1) and 4 (Itgb4), as well as integrin-linked kinase (Ilk), were downregulated in small, suggesting decreased EC mechanosensitivity in cells from small arteries. However, differences in expression of Itgb1, Itgb4, or Ilk along the vascular tree were not observed in mouse lung or cerebral ECs (5, 43).
In recent years, a rapid increase in scRNA-seq investigations has provided evidence of multiple VSMC phenotypes under normal physiological conditions. Yap et al. (44) suggested that up to 6 VSMC phenotypes can exist in healthy arteries and undergo phenotypic switching in response to certain endogenous triggers. We examined gene expression for gene markers of four of these proposed VSMC phenotypes (contractile, synthetic/proliferative, mesenchymal-like, and fibroblast-like). Marker genes for VSMC phenotypes (contractile, synthetic/proliferative, and fibroblast-like) were primarily downregulated in VSMCs from small arteries (Fig. 11). One mesenchymal-like phenotype marker (Kfl4) was upregulated in VSMCs from small arteries [other mesenchymal markers, including CD44, CD73, CD90, CD105, and Stor-1, were not found in cells annotated (in silico) as VSMCs]. In addition, we identified a downregulation of synthetic/proliferative phenotype genes (Cald1, Myh10, Tpm4, Srf) in VSMCs from small arteries. As proliferative cells have an increased reliance on glycolysis (45), downregulation of the glycolytic rate-limiting enzyme Hk2 is consistent with the reduced expression of proliferative phenotype genes. Overall, it does not appear that the seven identified VSMC subclusters could be clearly categorized into different VSMC phenotypes characterized by Yap et al. (Supplemental Table S1, see https://doi.org/10.6084/m9.figshare.20459109). However, our data are consistent with the findings of He and coworkers (5, 43) in mouse cerebral artery smooth muscle cells. This group demonstrated that gene markers for contractile and synthetic phenotypes tend to decrease as the source of the VSMCs changed from arterial to arteriole to venous vascular segments similarly to what we observed (Supplemental Fig. S4, https://doi.org/10.6084/m9.figshare.21830868). Their results suggest a continuous phenotypic gradient for VSM cells among arterial to the venous vasculature. Indeed, VSMC phenotypic switching has been shown to involve regulation of the expression of the transcription factor Klf4 (44), where increased expression of klf4 inhibits expression of contractile-phenotype markers (46). As stated earlier, klf4 expression was increased in VSMCs from small arteries associated with a suppression of contractile phenotype genes. In contrast, Kfl4 does not appear to be the driver of the downregulation of contractile- and synthetic-phenotype genes (from arteriolar to venous) in VSMCs from mouse cerebral arteries where Klf4 expression is higher in arterial VSMCs than in cells from arterioles or veins (43).
Figure 11.
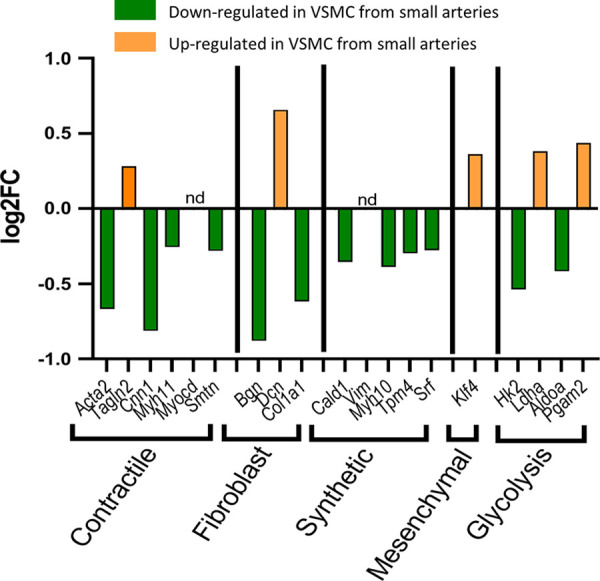
Differential expression of vascular smooth muscle cell (VSMC) phenotype marker genes between large and small arteries. Genes downregulated in cells from small arteries (green). Genes upregulated in cells from small arteries (orange). nd, not detected in this data set.
Pathway analysis revealed several functional gene sets differentially expressed between ECs and VSMCs from large and small arteries. The GO-Biological Processes pathways with the largest adjusted P values were endothelial cell migration and oxidative phosphorylation for ECs and VSMCs, respectively. Thirty-eight DEGs within the GOBP endothelial migration pathway were identified between ECs from small arteries (Fig. 7B and Supplemental File S5, https://doi.org/10.6084/m9.figshare.20459184). Genes upregulated in small artery ECs relative to large artery ECs include Dcn, Plcg1, Dll4, Nrp2, Nr2f2, Ephb4, Flt4, Kdr, and Jup. Genes downregulated in small artery ECs include Rock2, Acvrl1, Nos3, Gata2, Bmpr2, Foxc2 Bmp4, Tek, Rhoa, Emp2, Grn, Ptprm, Fstl1, Lgmn, Calr, Rras, Sparc, Mmrn2, Klf4, Hmgb1, and Id1. Indeed, the reduced Nos3 expression in ECs from small arteries is consistent with previous work demonstrating a reduced contribution of nitric oxide to endothelium-dependent vasodilation in the resistance vasculature (47). Although the mouse cerebral vascular did not exhibit segmental differences in EC Nos3 expression, mouse lung capillary ECs showed greater Nos3 expression than larger pulmonary arteries (43). Network analysis was done on this gene set using Search Tool for the Retrieval of Interaction Genes (String) App in Cytoscape. Molecular complex detection (MCODE Cytoscape plugin) clustering within this network revealed one highly interconnected subnetwork (Supplemental Fig. S5, https://doi.org/10.6084/m9.figshare.21830883; Nrp2, Ephb4, flt4, Dll4, Prox1, Foxc2, and Nr2f2). ECs from small arteries express both venous EC and arterial EC markers suggesting a starting point of phenotypic transition. Establishing arterial-venous EC identity involves vascular endothelial growth factor binding to its heterodimeric receptor (Flk1/Nrp1), activating the Notch signaling pathway in the endothelium, resulting in the induction of ephrin B2 expression and suppression of ephrin receptor B4 expression (Ephb4), establishing an arterial identity (48–50). In this study, Ephb4, a venous EC marker, was upregulated in small artery ECs. In addition, Nr2f2 is a transcription factor upregulated in small artery ECs. It has been shown to promote the expression of vein-specific genes by directly activating flanking enhancer elements while suppressing artery-specific genes (51, 52). Our results are consistent with data from mouse lung and brain ECs showing differential Ephb4 expression. Ephb4 expression was greater in lung capillary ECs and brain venous ECs than in arterial ECs. In addition, Nr2f2 was enriched in venous ECs from mouse brain and evenly expressed in ECs of mouse lung (43). However, in the present study, Dll4 was upregulated in small artery ECs and is considered a marker of arterial ECs (53) or angiogenic ECs (54). Similarly, Dll4 was enriched in mouse cerebral arterial and capillary ECs. In contrast, mouse lung did not show differential segmental expression (43). In addition, the increased expression of other proangiogenic genes (Flt4, Kdr, Nrp2) suggests that small artery ECs has a proangiogenic phenotype and represents an inflection point for transitioning to a venous EC phenotype. Flt4, Nrp2, and Kdr were all enriched in ECs from mouse cerebral capillaries compared with arterial ECs. However, only Kdr showed differential expression in mouse lung ECs and was enriched in arterial ECs compared with capillary ECs (43).
The GOBP pathway with the largest Log2FC between VSMCs from large and small arteries was oxidative phosphorylation. Within coronary artery VSM cells, mitochondrial oxidative phosphorylation accounts for 54.5% of ATP production at rest, with the remaining 45.5% due to glycolysis (55). All 32 DEGs belonging to the GOBP oxidative phosphorylation pathway were mitochondrial proteins, notably NADH:ubiquinone oxidoreductase subunits, ATP synthase peripheral stalk subunits, and cytochrome c oxidase subunits. Approximately 2/3 of these genes were upregulated in small artery VSMCs; the remaining were unchanged or downregulated (Supplemental Fig. S6, see https://doi.org/10.6084/m9.figshare.21830889). The bioenergetics of vascular smooth muscle ATP production has been shown to rely almost equally on oxidative phosphorylation and glycolysis (55). VSMCs shift to a greater reliance on glycolysis in pathologic states associated with a proliferative/synthetic phenotype (56). It is becoming increasingly evident that metabolism and mitochondrial function are associated with, and can potentially drive, changes in phenotype (45). In the present study, there was a downregulation of genes associated with contractile, synthetic, and fibroblast phenotype markers in VSMCs from small arteries. In addition, changes in the expression of genes involved in glycolysis were equivocal. Therefore, it is not readily apparent what impact this variation in metabolic genes has on smooth muscle energetic capacity or cellular phenotype.
Small resistance arteries play a greater role in determining total peripheral resistance and organ blood flow controlled by input from humoral and neural, as well as endothelial modulation of smooth muscle contractility. Interestingly, the GOBP pathway regulation of actin filament-based processes was identified as a pathway of significance between large and small arteries. Twenty-eight DEGs belonging to this pathway were identified (Fig. 8B and Supplemental File S6). Of these and Atp2a2, Vasp, Cav1, Arpc1b, Rdx, Tjp1, Cdc42, Gsn, Actr2, Actb, and Pdgfa were upregulated in small artery VSMCs. Previous work has shown that Atp2a2 (SERCA2a) deficiency resulted in higher phenylephrine-induced contractions and increased nonselective cation channel (NSCC) Ca2+ influx, slower refilling of the SR Ca2+ stores, and stronger coupling of NSCC Ca2+ influx with contraction, lower basal NO and slightly increased EC-dependent relaxation in mouse aortic rings compared with controls (57). Moreover, the vasodilator-stimulated phosphoprotein (Vasp) was also upregulated in smooth muscle cells from small arteries and is an important regulator of actin polymerization and tension development in smooth muscle (58, 59). These results suggest that smooth muscle cells from small arteries express genes that allow for greater control of cytosolic calcium and tension generation, consistent with resistance arteries’ role in regulating tissue blood flow.
The caveolin-1 (CAV1) family members are caveolae’s main protein components. Caveolae are flask-shaped invaginations of 50–100 nm in size at the plasma membrane and are increasingly becoming recognized as an essential organizational structure for various signal systems in VSMCs (60). For example, CAV1 and the formation of invaginated caveolae cluster channels of the plasma membrane creating spatial associations between sarcoplasmic reticulum ryanodine Ca2+ channels (i.e., Ca2+ sparks) and sarcolemmal large-conductance calcium-activated potassium channels to generate a spontaneous transient outward currents (STOC). For example, disruption of caveolae structure using cyclodextrin reduced Ca2+ spark (61). At the same time, CAV1 null animals showed reduced STOC activity (62). Greater expression of Cav1 in the small artery ECs, as observed in VSMCs from small arteries, would be consistent with a greater role of small arteries in the modulation of myogenic tone to maintain homeostatic blood flow control. These results are consistent with work by the Betsholtz group that showed increased Cav1 expression in small mouse cerebral artery VSM compared with larger arteries. However, cerebral EC did not exhibit segmental differences in expression. In contrast, mouse lung EC exhibit enriched Cav1 levels in capillary ECs compared with arterial (43).
Although the GOBP pathway, positive regulation of cholesterol efflux, only contained five DEGs (Nfkbia, Apoe, Lrp1, Abca1, Pltp), it was particularly interesting based on our prior work. We have previously observed differential sensitivity to the H2S between large and small mesenteric arteries that appeared to be dependent on the content of EC plasma membrane cholesterol (16). EC membrane cholesterol has an inhibitory effect on H2S signaling. Both ABCA1 and PLTP are ubiquitously expressed in animal tissue. ABCA1 plays a role in plasma membrane asymmetry and promotes cellular free cholesterol efflux to lipid-poor apolipoproteins (63, 64). PLTP appears to function as an intermediary in transferring cellular cholesterol to lipoproteins through its interaction with ABCA1 (65). The results of the current study suggest that ECs from small arteries are enriched for both Pltp and Abca1. Consistent with these results, ABCA1 protein expression is higher in ECs from small arteries compared with large arteries, and the upregulation of this component of the reverse cholesterol efflux pathway is associated with a decrease in membrane cholesterol in ECs from small arteries compared with large arteries (Fig. 10D). Previous work has shown that lower membrane cholesterol alters ion channel function and intracellular signaling. For example, chronic hypoxia has been shown to lower EC membrane cholesterol resulting in an unmasking of a large conductance Ca2+-activated K+ current in aortic ECs (66, 67) and reduced Orai1-mediated Ca2+ entry in pulmonary artery ECs (68). Furthermore, the contribution of the nonselective cation channel transient receptor potential cation channel subfamily A member 4 (TRPV4) to endothelial-dependent vasodilation is dependent on the content of EC membrane cholesterol (69, 70). Moreover, pulmonary VSMC membrane cholesterol is also reduced following chronic hypoxia resulting in enhanced pulmonary vasoconstriction that contributes to chronic hypoxia-induced pulmonary hypertension (71). Taken together, EC membrane cholesterol content appears to be an important regulator of EC function.
Although previous studies have identified cell-type-specific transcriptional heterogeneity between organs that correlate with organ function or between vessel-types within an organ, our results demonstrate for the first time in mesenteric arteries that there is significant plasticity in gene expression between arterial branch orders. Although He et al. (43) identified an arterial to venous continuum in the mouse cerebral vasculature similar to that observed in the rat mesenteric circulation, caution must be applied to extrapolating these findings to other vascular beds. Understanding the biological significance of EC and VSMC heterogeneity and their ability to adapt to their surrounding microenvironment will be crucial to understanding vascular function during homeostasis and disease.
DATA AVAILABILITY
The data (raw and processed) generated in the current study can be found at NIH Gene Expression Omnibus (GEO accession no. GSE202244) at https://www.ncbi.nlm.nih.gov/geo/query/acc.cgi?acc=GSE202244.
SUPPLEMENTAL DATA
Supplemental Fig. S1: https://doi.org/10.6084/m9.figshare.21830844.
Supplemental Fig. S2: https://doi.org/10.6084/m9.figshare.21830847.
Supplemental Fig. S3: https://doi.org/10.6084/m9.figshare.21830850.
Supplemental Fig. S4: https://doi.org/10.6084/m9.figshare.21830868.
Supplemental Fig. S5: https://doi.org/10.6084/m9.figshare.21830883.
Supplemental Fig. S6: https://doi.org/10.6084/m9.figshare.21830889.
Supplemental File S1: https://doi.org/10.6084/m9.figshare.20459127.
Supplemental File S2: https://doi.org/10.6084/m9.figshare.20459211.
Supplemental File S3: https://doi.org/10.6084/m9.figshare.21979304.
Supplemental File S3B: https://doi.org/10.6084/m9.figshare.21979643.
Supplemental File S4: https://doi.org/10.6084/m9.figshare.20459196.
Supplemental File S4B: https://doi.org/10.6084/m9.figshare.20465250.
Supplemental File S5: https://doi.org/10.6084/m9.figshare.20459184.
Supplemental File S6: https://doi.org/10.6084/m9.figshare.20459172.
Supplemental Table S1: https://doi.org/10.6084/m9.figshare.20459109.
GRANTS
This research was supported by NIH Grants R01 HL160606-01 (J.S.N.), R56 HL153065-01 (L.V.G.B.), R44 HL121871 (N.L.K.), R01 HL123301 (N.L.K.), 5T32HL007736-25 (E.E.M., J.A.), and 2K12GM088021-11 (E.E.M.), the University of New Mexico (UNM) Health Science Center Cardiovascular and Metabolic Disease Signature Program Award No. 624402 (J.S.N.), UNM Comprehensive Cancer Center Support Grant NCI P30CA118100, the Fluorescence Microscopy Shared Resource and the Analytical and Translational Genomics Shared Resource, which receives additional support for the State of New Mexico, and University of Colorado Anschutz Medical Campus Genomics Shared Resource Cancer Center Support Grant P30CA046934.
DISCLOSURES
No conflicts of interest, financial or otherwise, are declared by the authors.
AUTHOR CONTRIBUTIONS
L.V.G.B., N.L.K., and J.S.N. conceived and designed research; J.R.A., E.E.M., S.S., N.L.K., and J.S.N. performed experiments; J.R.A., E.E.M., K.J.B., N.L.K., and J.S.N. analyzed data; J.R.A., L.V.G.B., N.L.K., and J.S.N. interpreted results of experiments; J.R.A., K.J.B., and J.S.N. prepared figures; J.S.N. drafted manuscript; J.R.A., E.E.M., K.J.B., S.S., L.V.G.B., N.L.K., and J.S.N. edited and revised manuscript; J.R.A., E.E.M., K.J.B., S.S., L.V.G.B., N.L.K., and J.S.N. approved final version of manuscript.
REFERENCES
- 1. Krüger-Genge A, Blocki A, Franke R-P, Jung F. Vascular endothelial cell biology: an update. Int J Mol Sci 20: 4411, 2019. doi: 10.3390/ijms20184411. [DOI] [PMC free article] [PubMed] [Google Scholar]
- 2. Schuliga M. Smooth muscle and extracellular matrix interactions in health and disease. In: Muscle Cell and Tissue, edited by Sakuma K. London: IntechOpen, 2015, p. 486. doi: 10.5772/60403. [DOI] [Google Scholar]
- 3. Tykocki NR, Boerman EM, Jackson WF. Smooth muscle ion channels and regulation of vascular tone in resistance arteries and arterioles. Compr Physiol 7: 485–581, 2017. doi: 10.1002/cphy.c160011. [DOI] [PMC free article] [PubMed] [Google Scholar]
- 4. Jiang J, Zheng JP, Li Y, Gan Z, Jiang Y, Huang D, Li H, Liu Z, Ke Y. Differential contribution of endothelium-derived relaxing factors to vascular reactivity in conduit and resistance arteries from normotensive and hypertensive rats. Clin Exp Hypertens 38: 393–398, 2016. doi: 10.3109/10641963.2016.1148155. [DOI] [PubMed] [Google Scholar]
- 5. Vanlandewijck M, He L, Mäe MA, Andrae J, Ando K, Del Gaudio F, Nahar K, Lebouvier T, Laviña B, Gouveia L, Sun Y, Raschperger E, Räsänen M, Zarb Y, Mochizuki N, Keller A, Lendahl U, Betsholtz C. A molecular atlas of cell types and zonation in the brain vasculature. Nature 554: 475–480, 2018. [Erratum in Nature 560: E3, 2018]. doi: 10.1038/nature25739. [DOI] [PubMed] [Google Scholar]
- 6. Dobnikar L, Taylor AL, Chappell J, Oldach P, Harman JL, Oerton E, Dzierzak E, Bennett MR, Spivakov M, Jørgensen HF. Disease-relevant transcriptional signatures identified in individual smooth muscle cells from healthy mouse vessels. Nat Commun 9: 4567, 2018. doi: 10.1038/s41467-018-06891-x. [DOI] [PMC free article] [PubMed] [Google Scholar]
- 7. Chi J-T, Chang HY, Haraldsen G, Jahnsen FL, Troyanskaya OG, Chang DS, Wang Z, Rockson SG, van de Rijn M, Botstein D, Brown PO. Endothelial cell diversity revealed by global expression profiling. Proc Natl Acad Sci USA 100: 10623–10628, 2003. doi: 10.1073/pnas.1434429100. [DOI] [PMC free article] [PubMed] [Google Scholar]
- 8. Jambusaria A, Hong Z, Zhang L, Srivastava S, Jana A, Toth PT, Dai Y, Malik AB, Rehman J. Endothelial heterogeneity across distinct vascular beds during homeostasis and inflammation. eLife 9: e51413, 2020. doi: 10.7554/eLife.51413. [DOI] [PMC free article] [PubMed] [Google Scholar]
- 9. Orsenigo F, Conze LL, Jauhiainen S, Corada M, Lazzaroni F, Malinverno M, Sundell V, Cunha SI, Brännström J, Globisch MA, Maderna C, Lampugnani MG, Magnusson PU, Dejana E. Mapping endothelial-cell diversity in cerebral cavernous malformations at single-cell resolution. eLife 9: e61413, 2020. doi: 10.7554/eLife.61413. [DOI] [PMC free article] [PubMed] [Google Scholar]
- 10. Kalluri AS, Vellarikkal SK, Edelman ER, Nguyen L, Subramanian A, Ellinor PT, Regev A, Kathiresan S, Gupta RM. Single-cell analysis of the normal mouse aorta reveals functionally distinct endothelial cell populations. Circulation 140: 147–163, 2019. doi: 10.1161/CIRCULATIONAHA.118.038362. [DOI] [PMC free article] [PubMed] [Google Scholar]
- 11. Paik DT, Tian L, Williams IM, Rhee S, Zhang H, Liu C, Mishra R, Wu SM, Red-Horse K, Wu JC. Single-cell RNA sequencing unveils unique transcriptomic signatures of organ-specific endothelial cells. Circulation 142: 1848–1862, 2020. doi: 10.1161/CIRCULATIONAHA.119.041433. [DOI] [PMC free article] [PubMed] [Google Scholar]
- 12. Kalucka J, de Rooij LPMH, Goveia J, Rohlenova K, Dumas SJ, Meta E, et al. Single-cell transcriptome atlas of murine endothelial cells. Cell 180: 764–779.e20, 2020. doi: 10.1016/j.cell.2020.01.015. [DOI] [PubMed] [Google Scholar]
- 13. Sabbagh MF, Heng JS, Luo C, Castanon RG, Nery JR, Rattner A, Goff LA, Ecker JR, Nathans J. Transcriptional and epigenomic landscapes of CNS and non-CNS vascular endothelial cells. eLife 7: e36187, 2018. doi: 10.7554/eLife.36187. [DOI] [PMC free article] [PubMed] [Google Scholar]
- 14. Song HW, Foreman KL, Gastfriend BD, Kuo JS, Palecek SP, Shusta EV. Transcriptomic comparison of human and mouse brain microvessels. Sci Rep 10: 12358, 2020. doi: 10.1038/s41598-020-69096-7. [DOI] [PMC free article] [PubMed] [Google Scholar]
- 15. Miano JM, Fisher EA, Majesky MW. Fate and state of vascular smooth muscle cells in atherosclerosis. Circulation 143: 2110–2116, 2021. doi: 10.1161/CIRCULATIONAHA.120.049922. [DOI] [PMC free article] [PubMed] [Google Scholar]
- 16. Mendiola P, Naik J, Gonzalez Bosc L, Kanagy N. Cholesterol disrupts H2S-mediated vasodilation in large arteries. FASEB J 35: 2021. doi: 10.1096/fasebj.2021.35.S1.04893. [DOI] [Google Scholar]
- 17. Zheng GXY, Terry JM, Belgrader P, Ryvkin P, Bent ZW, Wilson R, et al. Massively parallel digital transcriptional profiling of single cells. Nat Commun 8: 14049, 2017. doi: 10.1038/ncomms14049. [DOI] [PMC free article] [PubMed] [Google Scholar]
- 18. Stuart T, Butler A, Hoffman P, Hafemeister C, Papalexi E, Mauck WM III, Hao Y, Stoeckius M, Smibert P, Satija R. Comprehensive integration of single-cell data. Cell 177: 1888–1902, 2019. doi: 10.1016/j.cell.2019.05.031. [DOI] [PMC free article] [PubMed] [Google Scholar]
- 19. Satija R, Farrell JA, Gennert D, Schier AF, Regev A. . Spatial reconstruction of single-cell gene expression data. Nat Biotechnol 33, 2015. doi: 10.1038/nbt.3192. [DOI] [PMC free article] [PubMed] [Google Scholar]
- 20.R Core Team. R: a language and environment for statistical computing. https://www.R-project.org/ [2020 Dec].
- 21. McCarthy DJ, Campbell KR, Lun ATL, Wills QF. Scater: pre-processing, quality control, normalization and visualization of single-cell RNA-seq data in R. Bioinformatics 33: 1179–1186, 2017. doi: 10.1093/bioinformatics/btw777. [DOI] [PMC free article] [PubMed] [Google Scholar]
- 22. Cheng J, Gu W, Lan T, Deng J, Ni Z, Zhang Z, Hu Y, Sun X, Yang Y, Xu Q. Single-cell RNA sequencing reveals cell type- and artery type-specific vascular remodelling in male spontaneously hypertensive rats. Cardiovasc Res 117: 1202–1216, 2021. doi: 10.1093/cvr/cvaa164. [DOI] [PMC free article] [PubMed] [Google Scholar]
- 23. Yu G, Wang LG, Han Y, He QY. ClusterProfiler: an R package for comparing biological themes among gene clusters. OMICS 16: 284–287, 2012. doi: 10.1089/omi.2011.0118. [DOI] [PMC free article] [PubMed] [Google Scholar]
- 24. Borcherding N, Vishwakarma A, Voigt AP, Bellizzi A, Kaplan J, Nepple K, Salem AK, Jenkins RW, Zakharia Y, Zhang W. Mapping the immune environment in clear cell renal carcinoma by single-cell genomics. Commun Biol 4: 122, 2021. doi: 10.1038/s42003-020-01625-6. [DOI] [PMC free article] [PubMed] [Google Scholar]
- 25. Gustavsson C, Agardh CD, Zetterqvist AV, Nilsson J, Agardh E, Gomez MF. Vascular cellular adhesion molecule-1 (VCAM-1) expression in mice retinal vessels is affected by both hyperglycemia and hyperlipidemia. PLoS One 5: e12699, 2010. doi: 10.1371/journal.pone.0012699. [DOI] [PMC free article] [PubMed] [Google Scholar]
- 26. Meng X, Chen M, Su W, Tao X, Sun M, Zou X, Ying R, Wei W, Wang B. The differentiation of mesenchymal stem cells to vascular cells regulated by the HMGB1/RAGE axis: its application in cell therapy for transplant arteriosclerosis. Stem Cell Res Ther 9: 85, 2018. doi: 10.1186/s13287-018-0827-z. [DOI] [PMC free article] [PubMed] [Google Scholar]
- 27. Brun J, Lutz KA, Neumayer KM, Klein G, Seeger T, Uynuk-Ool T, Wörgötter K, Schmid S, Kraushaar U, Guenther E, Rolauffs B, Aicher WK, Hart ML. Smooth muscle-like cells generated from human mesenchymal stromal cells display marker gene expression and electrophysiological competence comparable to bladder smooth muscle cells. PLoS One 10: e0145153, 2015. doi: 10.1371/journal.pone.0145153. [DOI] [PMC free article] [PubMed] [Google Scholar]
- 28. Oswald J, Boxberger S, Jørgensen B, Feldmann S, Ehninger G, Bornhäuser M, Werner C. Mesenchymal stem cells can be differentiated into endothelial cells in vitro. Stem Cells 22: 377–384, 2004. doi: 10.1634/stemcells.22-3-377. [DOI] [PubMed] [Google Scholar]
- 29. Silva GV, Litovsky S, Assad JA, Sousa AL, Martin BJ, Vela D, Coulter SC, Lin J, Ober J, Vaughn WK, Branco RV, Oliveira EM, He R, Geng YJ, Willerson JT, Perin EC. Mesenchymal stem cells differentiate into an endothelial phenotype, enhance vascular density, and improve heart function in a canine chronic ischemia model. Circulation 111: 150–156, 2005. doi: 10.1161/01.CIR.0000151812.86142.45. [DOI] [PubMed] [Google Scholar]
- 30. Khaki M, Salmanian AH, Abtahi H, Ganji A, Mosayebi G. Mesenchymal stem cells differentiate to endothelial cells using recombinant vascular endothelial growth factor-A. Rep Biochem Mol Biol 6: 144–150, 2018. [PMC free article] [PubMed] [Google Scholar]
- 31. Maleki M, Ghanbarvand F, Reza Behvarz M, Ejtemaei M., Ghadirkhomi E. . Comparison of mesenchymal stem cell markers in multiple human adult stem cells. Int J Stem Cells 7: 118–126, 2014. doi: 10.15283/ijsc.2014.7.2.118. [DOI] [PMC free article] [PubMed] [Google Scholar]
- 32. Tsuneki M, Madri JA. CD44 regulation of endothelial cell proliferation and apoptosis via modulation of CD31 and VE-cadherin expression. J Biol Chem 289: 5357–5370, 2014. doi: 10.1074/jbc.M113.529313. [DOI] [PMC free article] [PubMed] [Google Scholar]
- 33. Pusztaszeri MP, Seelentag W, Bosman FT. Immunohistochemical expression of endothelial markers CD31, CD34, von Willebrand Factor, and Fli-1 in normal human tissues. J Histochem Cytochem 54: 385–395, 2006. doi: 10.1369/jhc.4A6514.2005. [DOI] [PubMed] [Google Scholar]
- 34. Navar LG, Inscho EW, Imig JD, Mitchell KD. Heterogeneous activation mechanisms in the renal microvasculature. Kidney Int 54: S17–S21, 1998. doi: 10.1046/j.1523-1755.1998.06704.x. [DOI] [PubMed] [Google Scholar]
- 35. Januszyk M, Rennert RC, Sorkin M, Maan ZN, Wong LK, Whittam AJ, Whitmore A, Duscher D, Gurtner GC. Evaluating the effect of cell culture on gene expression in primary tissue samples using microfluidic-based single cell transcriptional analysis. Microarrays (Basel ) 4: 540–550, 2015. doi: 10.3390/microarrays4040540. [DOI] [PMC free article] [PubMed] [Google Scholar]
- 36. Neumann E, Riepl B, Knedla A, Lefèvre S, Tarner IH, Grifka J, Steinmeyer J, Schölmerich J, Gay S, Müller-Ladner U. Cell culture and passaging alters gene expression pattern and proliferation rate in rheumatoid arthritis synovial fibroblasts. Arthritis Res Ther 12: R83, 2010. doi: 10.1186/ar3010. [DOI] [PMC free article] [PubMed] [Google Scholar]
- 37. Marcu R, Choi YJ, Xue J, Fortin CL, Wang Y, Nagao RJ, Xu J, MacDonald JW, Bammler TK, Murry CE, Muczynski K, Stevens KR, Himmelfarb J, Schwartz SM, Zheng Y. Human organ-specific endothelial cell heterogeneity. iScience 4: 20–35, 2018. doi: 10.1016/j.isci.2018.05.003. [DOI] [PMC free article] [PubMed] [Google Scholar]
- 38. Chung J, Kim KH, Yu N, An SH, Lee S, Kwon K. Fluid shear stress regulates the landscape of microRNAs in endothelial cell-derived small extracellular vesicles and modulates the function of endothelial cells. Int J Mol Sci 23: 1314, 2022. doi: 10.3390/ijms23031314. [DOI] [PMC free article] [PubMed] [Google Scholar]
- 39. Hergenreider E, Heydt S, Tréguer K, Boettger T, Horrevoets AJ, Zeiher AM, Scheffer MP, Frangakis AS, Yin X, Mayr M, Braun T, Urbich C, Boon RA, Dimmeler S. Atheroprotective communication between endothelial cells and smooth muscle cells through miRNAs. Nat Cell Biol 14: 249–256, 2012. doi: 10.1038/ncb2441. [DOI] [PubMed] [Google Scholar]
- 40. Dekker RJ, van Soest S, Fontijn RD, Salamanca S, de Groot PG, VanBavel E, Pannekoek H, Horrevoets AJ. Prolonged fluid shear stress induces a distinct set of endothelial cell genes, most specifically lung Krüppel-like factor (KLF2). Blood 100: 1689–1698, 2002. doi: 10.1182/blood-2002-01-0046. [DOI] [PubMed] [Google Scholar]
- 41. Chu H-R, Sun YC, Gao Y, Guan XM, Yan H, Cui XD, Zhang XY, Li X, Li H, Cheng M. Function of Krüppel-like factor 2 in the shear stress-induced cell differentiation of endothelial progenitor cells to endothelial cells. Mol Med Rep 19: 1739–1746, 2019. doi: 10.3892/mmr.2019.9819. [DOI] [PubMed] [Google Scholar]
- 42. Givens C, Tzima E. Endothelial mechanosignaling: does one sensor fit all? Antioxid Redox Signal 25, 2016. doi: 10.1089/ars.2015.6493. [DOI] [PMC free article] [PubMed] [Google Scholar]
- 43. He L, Vanlandewijck M, Mäe MA, Andrae J, Ando K, Del Gaudio F, Nahar K, Lebouvier T, Laviña B, Gouveia L, Sun Y, Raschperger E, Segerstolpe Å, Liu J, Gustafsson S, Räsänen M, Zarb Y, Mochizuki N, Keller A, Lendahl U, Betsholtz C. Single-cell RNA sequencing of mouse brain and lung vascular and vessel-associated cell types. Sci Data 5: 180160, 2018. doi: 10.1038/sdata.2018.160. [DOI] [PMC free article] [PubMed] [Google Scholar]
- 44. Yap C, Mieremet A, de Vries CJM, Micha D, de Waard V. Six shades of vascular smooth muscle cells illuminated by KLF4 (Krüppel-Like Factor 4). Arterioscler Thromb Vasc Biol 41: 2693–2707, 2021. doi: 10.1161/ATVBAHA.121.316600. [DOI] [PMC free article] [PubMed] [Google Scholar]
- 45. Shi J, Yang Y, Cheng A, Xu G, He F. Metabolism of vascular smooth muscle cells in vascular diseases. Am J Physiol Heart Circ Physiol 319: H613–H631, 2020. doi: 10.1152/ajpheart.00220.2020. [DOI] [PubMed] [Google Scholar]
- 46. Turner EC, Huang C-L, Govindarajan K, Caplice NM. Identification of a Klf4-dependent upstream repressor region mediating transcriptional regulation of the myocardin gene in human smooth muscle cells. Biochim Biophys Acta 1829: 1191–1201, 2013. doi: 10.1016/j.bbagrm.2013.09.002. [DOI] [PubMed] [Google Scholar]
- 47. Garland CJ, McPherson GA. Evidence that nitric oxide does not mediate the hyperpolarization and relaxation to acetylcholine in the rat small mesenteric artery. Br J Pharmacol 105: 429–435, 1992. doi: 10.1111/j.1476-5381.1992.tb14270.x. [DOI] [PMC free article] [PubMed] [Google Scholar]
- 48. Lawson ND, Scheer N, Pham VN, Kim CH, Chitnis AB, Campos-Ortega JA, Weinstein BM. Notch signaling is required for arterial-venous differentiation during embryonic vascular development. Development 128: 3675–3683, 2001. doi: 10.1242/dev.128.19.3675. [DOI] [PubMed] [Google Scholar]
- 49. Lawson ND, Vogel AM, Weinstein BM. sonic hedgehog and vascular endothelial growth factor act upstream of the notch pathway during arterial endothelial differentiation. Dev Cell 3: 127–136, 2002. doi: 10.1016/s1534-5807(02)00198-3. [DOI] [PubMed] [Google Scholar]
- 50. Gerety SS, Anderson DJ. Cardiovascular ephrinB2 function is essential for embryonic angiogenesis. Development 129: 1397–1410, 2002. doi: 10.1242/dev.129.6.1397. [DOI] [PubMed] [Google Scholar]
- 51. You L-R, Lin F-J, Lee CT, DeMayo FJ, Tsai M-J, Tsai SY. Suppression of Notch signalling by the COUP-TFII transcription factor regulates vein identity. Nature 435: 98–104, 2005. doi: 10.1038/nature03511. [DOI] [PubMed] [Google Scholar]
- 52. Sissaoui S, Yu J, Yan A, Li R, Yukselen O, Kucukural A, Zhu LJ, Lawson ND. Genomic characterization of endothelial enhancers reveals a multifunctional role for NR2F2 in regulation of arteriovenous gene expression. Circ Res 126: 875–888, 2020. doi: 10.1161/CIRCRESAHA.119.316075. [DOI] [PMC free article] [PubMed] [Google Scholar]
- 53. Red-Horse K, Ueno H, Weissman IL, Krasnow MA. Coronary arteries form by developmental reprogramming of venous cells. Nature 464: 549–553, 2010. doi: 10.1038/nature08873. [DOI] [PMC free article] [PubMed] [Google Scholar]
- 54. Sacilotto N, Chouliaras KM, Nikitenko LL, Lu YW, Fritzsche M, Wallace MD, Nornes S, García-Moreno F, Payne S, Bridges E, Liu K, Biggs D, Ratnayaka I, Herbert SP, Molnár Z, Harris AL, Davies B, Bond GL, Bou-Gharios G, Schwarz JJ, De Val S. MEF2 transcription factors are key regulators of sprouting angiogenesis. Genes Dev 30: 2297–2309, 2016. doi: 10.1101/gad.290619.116. [DOI] [PMC free article] [PubMed] [Google Scholar]
- 55. Yang M, Chadwick AE, Dart C, Kamishima T, Quayle JM. Bioenergetic profile of human coronary artery smooth muscle cells and effect of metabolic intervention. PLoS One 12: e0177951, 2017. doi: 10.1371/journal.pone.0177951. [DOI] [PMC free article] [PubMed] [Google Scholar]
- 56. Paulin R, Michelakis ED. The metabolic theory of pulmonary arterial hypertension. Circ Res 115: 148–164, 2014. doi: 10.1161/CIRCRESAHA.115.301130. [DOI] [PubMed] [Google Scholar]
- 57. Fransen P, Chen J, Vangheluwe P, Guns P-J. Contractile behavior of mouse aorta depends on SERCA2 isoform distribution: effects of replacing SERCA2a by SERCA2b. Front Physiol 11: 282, 2020. doi: 10.3389/fphys.2020.00282. [DOI] [PMC free article] [PubMed] [Google Scholar]
- 58. Kim HR, Graceffa P, Ferron F, Gallant C, Boczkowska M, Dominguez R, Morgan KG. Actin polymerization in differentiated vascular smooth muscle cells requires vasodilator-stimulated phosphoprotein. Am J Physiol Cell Physiol 298: C559–C571, 2010. doi: 10.1152/ajpcell.00431.2009. [DOI] [PMC free article] [PubMed] [Google Scholar]
- 59. Wu Y, Gunst SJ. Vasodilator-stimulated phosphoprotein (VASP) regulates actin polymerization and contraction in airway smooth muscle by a vinculin-dependent mechanism.J Biol Chem 290: 11403–11416, 2015. doi: 10.1074/jbc.M115.645788. [DOI] [PMC free article] [PubMed] [Google Scholar]
- 60. Gratton J-P, Bernatchez P, Sessa WC. Caveolae and Caveolins in the Cardiovascular System. Circ Res 94: 1408–1417, 2004. doi: 10.1161/01.RES.0000129178.56294.17. [DOI] [PubMed] [Google Scholar]
- 61. Löhn M, Fürstenau M, Sagach V, Elger M, Schulze W, Luft FC, Haller H, Gollasch M. Ignition of calcium sparks in arterial and cardiac muscle through caveolae. Circ Res 87: 1034–1039, 2000. doi: 10.1161/01.res.87.11.1034. [DOI] [PubMed] [Google Scholar]
- 62. Drab M, Verkade P, Elger M, Kasper M, Lohn M, Lauterbach B, Menne J, Lindschau C, Mende F, Luft FC, Schedl A, Haller H, Kurzchalia TV. Loss of caveolae, vascular dysfunction, and pulmonary defects in caveolin-1 gene-disrupted mice. Science 293: 2449–2452, 2001. doi: 10.1126/science.1062688. [DOI] [PubMed] [Google Scholar]
- 63. Ogasawara F, Kano F, Murata M, Kimura Y, Kioka N, Ueda K. Changes in the asymmetric distribution of cholesterol in the plasma membrane influence streptolysin O pore formation. Sci Rep 9: 4548, 2019. doi: 10.1038/s41598-019-39973-x. [DOI] [PMC free article] [PubMed] [Google Scholar]
- 64. Okamoto Y, Tomioka M, Ogasawara F, Nagaiwa K, Kimura Y, Kioka N, Ueda K. C-terminal of ABCA1 separately regulates cholesterol floppase activity and cholesterol efflux activity. Biosci Biotechnol Biochem 84: 764–773, 2020. doi: 10.1080/09168451.2019.1700775. [DOI] [PubMed] [Google Scholar]
- 65. Oram JF, Wolfbauer G, Vaughan AM, Tang C, Albers JJ. Phospholipid transfer protein interacts with and stabilizes ATP-binding cassette transporter A1 and enhances cholesterol efflux from cells. J Biol Chem 278: 52379–52385, 2003. doi: 10.1074/jbc.M310695200. [DOI] [PubMed] [Google Scholar]
- 66. Riddle MA, Hughes JM, Walker BR. Role of caveolin-1 in endothelial BKCa channel regulation of vasoreactivity. Am J Physiol Cell Physiol 301: C1404–C1414, 2011. doi: 10.1152/ajpcell.00013.2011. [DOI] [PMC free article] [PubMed] [Google Scholar]
- 67. Riddle MA, Walker BR. Regulation of endothelial BK channels by heme oxygenase-derived carbon monoxide and caveolin-1. Am J Physiol Cell Physiol 303: C92–C101, 2012. doi: 10.1152/ajpcell.00356.2011. [DOI] [PMC free article] [PubMed] [Google Scholar]
- 68. Zhang B, Naik JS, Jernigan NL, Walker BR, Resta TC. Reduced membrane cholesterol after chronic hypoxia limits Orai1-mediated pulmonary endothelial Ca2+ entry. Am J Physiol Heart Circ Physiol 314: H359–H369, 2018. doi: 10.1152/ajpheart.00540.2017. [DOI] [PMC free article] [PubMed] [Google Scholar]
- 69. Morin EE, Salbato S, Walker BR, Naik JS. Endothelial cell membrane cholesterol content regulates the contribution of TRPV4 channels in ACh-induced vasodilation in rat gracilis arteries. Microcirculation 29: e12774, 2022. doi: 10.1111/micc.12774. [DOI] [PMC free article] [PubMed] [Google Scholar]
- 70. Naik JS, Walker BR. Endothelial-dependent dilation following chronic hypoxia involves TRPV4-mediated activation of endothelial BK channels. Pflugers Arch 470: 633–648, 2018. doi: 10.1007/s00424-018-2112-5. [DOI] [PMC free article] [PubMed] [Google Scholar]
- 71. Norton CE, Weise-Cross L, Ahmadian R, Yan S, Jernigan NL, Paffett ML, Naik JS, Walker BR, Resta TC. Altered lipid domains facilitate enhanced pulmonary vasoconstriction after chronic hypoxia. Am J Respir Cell Mol Biol 62: 709–718, 2020. doi: 10.1165/rcmb.2018-0318OC. [DOI] [PMC free article] [PubMed] [Google Scholar]
Associated Data
This section collects any data citations, data availability statements, or supplementary materials included in this article.
Supplementary Materials
Supplemental Fig. S1: https://doi.org/10.6084/m9.figshare.21830844.
Supplemental Fig. S2: https://doi.org/10.6084/m9.figshare.21830847.
Supplemental Fig. S3: https://doi.org/10.6084/m9.figshare.21830850.
Supplemental Fig. S4: https://doi.org/10.6084/m9.figshare.21830868.
Supplemental Fig. S5: https://doi.org/10.6084/m9.figshare.21830883.
Supplemental Fig. S6: https://doi.org/10.6084/m9.figshare.21830889.
Supplemental File S1: https://doi.org/10.6084/m9.figshare.20459127.
Supplemental File S2: https://doi.org/10.6084/m9.figshare.20459211.
Supplemental File S3: https://doi.org/10.6084/m9.figshare.21979304.
Supplemental File S3B: https://doi.org/10.6084/m9.figshare.21979643.
Supplemental File S4: https://doi.org/10.6084/m9.figshare.20459196.
Supplemental File S4B: https://doi.org/10.6084/m9.figshare.20465250.
Supplemental File S5: https://doi.org/10.6084/m9.figshare.20459184.
Supplemental File S6: https://doi.org/10.6084/m9.figshare.20459172.
Supplemental Table S1: https://doi.org/10.6084/m9.figshare.20459109.
Data Availability Statement
The data (raw and processed) generated in the current study can be found at NIH Gene Expression Omnibus (GEO accession no. GSE202244) at https://www.ncbi.nlm.nih.gov/geo/query/acc.cgi?acc=GSE202244.


