

Abstract
Background:
Coronary artery disease (CAD) is known as the most common cardiovascular disease. The development of CAD is influenced by several risk factors. Diagnostic and therapeutic methods of this disease have many and costly side effects. Therefore, researchers are looking for cost-effective and accurate methods to diagnose this disease. Machine learning algorithms can help specialists diagnose the disease early. The aim of this study is to detect CAD using machine learning algorithms.
Materials and Methods:
In this study, three data mining algorithms support vector machine (SVM), artificial neural network (ANN), and random forest were used to predict CAD using the Isfahan Cohort Study dataset of Isfahan Cardiovascular Research Center. 19 features with 11495 records from this dataset were used for this research.
Results:
All three algorithms achieved relatively close results. However, the SVM had the highest accuracy compared to the other techniques. The accuracy was calculated as 89.73% for SVM. The ANN algorithm also obtained the high area under the curve, sensitivity and accuracy and provided acceptable performance. Age, sex, Sleep satisfaction, history of stroke, history of palpitations, and history of heart disease were most correlated with target class. Eleven rules were also extracted from this dataset with high confidence and support.
Conclusion:
In this study, it was shown that machine learning algorithms can be used with high accuracy to detect CAD. Thus, it allows physicians to perform timely preventive treatment in patients with CAD.
Keywords: Algorithms, artificial intelligence, coronary artery disease, data mining, diagnosis, machine learning
INTRODUCTION
The most common cardiovascular disease (CVD) is Coronary Artery Disease (CAD).[1] This disease is known as the leading cause of death in the world. The prevalence of CAD in low- and middle-income countries has increased in recent years.[2] Thus, early detection of CAD is very important. Clinicians often use angiography to determine the amount and place of coronary artery stenosis, but this method is costly and invasive and also associated with a number of side effects.[2,3]
Today in healthcare industry, big data have produced and collected as a valuable resource for knowledge extraction.[4] Among data science technologies, data mining is recognized as one of the most effective strategies with increasing popularity in preventive healthcare.[5,6] Data mining has made it possible to predict, diagnose, prevent, and policy in the healthcare industry to a great extent.[7] Relatively low-cost computing with good performance, generalizability, and high accuracy is often associated with data mining methods.[8]
Various studies have been conducted on the application of data mining in the diagnosis of diseases, including CAD;[9,10] For example, Shahid and Singh proposed a high-accuracy machine learning model of Emotional Neural Networks (EmNNs) combined with the conventional Particle Swarm Optimization (PSO) technique for CAD detection. The suggested model was compared with PSO-based Adaptive Neuro-Fuzzy Inference System (PSO-ANFIS). The results showed that the suggested model was better than the PSO-ANFIS model. The suggested model also has 2 important benefits: (1) it learns very quickly and (2) it responds quickly. For large and accurate datasets, the significance of quick learning and the ability to respond quickly is important.[11] Jackins et al. conducted a study to find a model for the diagnosis of diabetes, coronary heart disease, and cancer among the available data sets. They used Naive Bayes classification and a random forest (RF) classification algorithm for the classification of the datasets. The results showed that the accuracy of the RF model for the three diseases was higher than the accuracy values of the Naïve Bayes classifier.[12] Das et al. using a statistical analysis system, introduced a method for diagnosing heart disease. A neural networks ensemble method is at the center of the proposed system. The classification accuracy of 89.01% was obtained from the experiments made on the data taken from the Cleveland heart disease database. Also, 80.95% and 95.91% sensitivity and specificity were obtained in the diagnosis of heart disease, respectively.[13] Olaniyi and Oyedotun proposed a three-step model based on an artificial neural network (ANN) to diagnose angina, which achieved an accuracy of 88.89%.[14] Dutta et al. Proposed an efficient neural network with convolutional layers. Their proposed model achieved 77% accuracy in predicting coronary heart disease. This model was also able to predict negative cases more accurately than traditional methods such as support vector machine (SVMs) and RFs.[15]
These studies show that data mining techniques are appropriate tools for predicting CAD and can help health policymakers develop preventive programs. It is important to note that patterns extracted from one dataset are not necessarily generalizable to other datasets and the Isfahan dataset has not been used to predict CAD so far. Therefore, the purpose of this study was to apply three data mining techniques SVM, RF, and ANN on Isfahan Cohort Study (ICS) data available at the Isfahan Cardiovascular Research Center (ICRC) to predict for CAD in patients.
MATERIALS AND METHODS
Proposed methodology
In this section, the proposed implementation method is presented by MATLAB R2020b software (9.9.0.1467703) to implement classification models. Cross-Industry Process for Data Mining (CRISP) methodology is one of the most powerful methods for implementing and executing data mining projects.[16] In this paper, the proposed model is presented based on CRISP methodology and includes six phases including Identifying the system, Preprocessing, Modeling, Rules Extracting, and Rules Selection.
Description of the dataset
In this study, the ICS dataset of the ICRC was used. This dataset includes 11495 records with 1913 features, 2819 patients with CAD, and 8676 patients with normal condition.[17]
Preprocessing the dataset
Data were preprocessed before classification techniques. The first step in data preprocessing was to select a subset of related features. Because there are many features in the dataset and many of them may not be related to the purpose of the research, the features that are most relevant to the target feature of the research should be selected. For this purpose, at first, the list of effective factors was determined using the opinion of a cardiologist. Thus, 22 features were selected as the most relevant features among the features in the dataset. The second step of data preprocessing was data cleaning. In this study, features that had many missing values were removed. The features of urinary creatinine, sodium, and potassium were removed because more than 85% of their values were null (9861 records).[18,19] Other features had no missing values and were used. Finally, 19 features were selected, including 18 independent features and 1 dependent feature (normal or prone to CAD).
Modeling for diagnosis of coronary artery disease
MATLAB R2020b software (9.9.0.1467703) was used to build ANN, RF, and SVM models.
To build the ANN model in MATLAB software, Neural Net Pattern Recognition toolbox (nprtool) was used. Pattern recognition is the process by which inputs are classified into a set of target categories. ANN is one of the techniques that can be used to perform this process. In this study, 18 selected independent variables entered the neural network. This neural network has three layers consisting of an input layer, a hidden layer, and an output layer. To classify vectors, a multilayer feed-forward back propagation network could be used with activation functions such as hyperbolic tangent sigmoid and SoftMax in the hidden and output layers. Furthermore, the number of neurons in hidden layers has a significant role in ANN classification performance. The following equations (Equations 1–3) were used to determine the number of neurons in the hidden layer in this study.
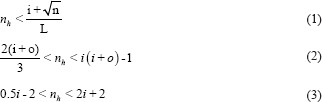
Here n is the record number of the data set, L is the number of hidden layers, nn is the number of hidden layer neurons, o is the number of output neurons, i is the number of input neurons.[20]
Then, 8047 (70%) records were used randomly to train the ANN model, 1724 records (15%) for validation and 1724 records (15%) for testing. Conjugate gradient backpropagation algorithm with Fletcher-Reeves updates (traincgf) was used to train ANN. Confusion Matrix (also called Error matrix) and Cross-Entropy loss (also called Log loss) are used to analyze the performance of classification models in machine learning. In this study, these two methods were used to measure ANN classification performance.
The classification learner toolbox was used to build the RF and SVM models in MATLAB. In this research, two algorithms consisting of SVM and Ensemble with 7 different classifiers have been selected among different classification algorithms presented in the toolbox. The performance of these classifiers was evaluated for predicting CAD.
The 7 selected classifiers are the following:
SVM algorithm: Linear SVM-Quadratic SVM-Cubic SVM-Fine Gaussian SVM-Medium Gaussian SVM-Coarse Gaussian SVM.
Ensemble algorithm: Bagged trees.
A holdout validation is performed to protect against overfitting for implementing SVM and RF Models.
For this purpose, 15% of the dataset was separated from the original dataset as a test dataset. Then, using the Holdout Validation method, 15% of the dataset was considered for validation and the rest for training. The trained classifier models were then extracted and tested by a test dataset.
Performance evaluation parameters
Based on the obtained confusion matrix, some parameters such as accuracy, sensitivity, specificity, precision, F1-Score, and the area under the curve (AUC) are calculated for evaluating the performance of ANN, SVM, and RF classification models.
Accuracy is the ratio of correct prediction instances to total prediction instances. Sensitivity (true positive rate) is the ratio of true predicted positive instances to the total of actual positive instances. Specificity (true negative rate) is the ratio of true predicted negative instances to the total of actual negative instances. Precision (positive predictive value) is the ratio of true predicted positive instances to the total of predicted positive instances. The F1-score is the harmonic mean of the two parameters sensitivity and precision. Receiver Operating Characteristics curve is a probability curve and AUC represents the degree or measure of separability. It shows how much the model is capable of distinguishing between classes.[21]
These parameters can be calculated using Equations 4–8.[22,23,24,25]
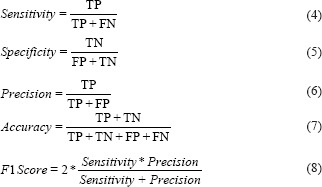
Here, TP, TN, FP, and FN are True Positive, True Negative, False Positive, and False Negative, respectively.[26]
Selection of rules based on confidence and support parameters
After that, RapidMiner Studio 9.8.001 (RapidMiner, Boston, Massachusetts, United States) data mining software was used to extract the hidden rules and patterns in the dataset. Among the obtained rules, rules with higher support and confidence were selected.
Support specifies the frequency of occurrences of an item set in the dataset. Confidence is a measure of how many times the rule has been found to be true.[27]
RESULTS
The predicting features
In this study, 11495 records with 19 selected features from the ICS dataset were considered. Selected features (demographic, symptoms, examinations, and laboratory features) are described in Table 1.
Table 1.
Description of the selected features used in Isfahan cohort study dataset of the Isfahan cardiovascular research center
| Feature type | Feature name | Description | Frequency (%) | |
|---|---|---|---|---|
| F1 | Demographic | Smoking status | 1=Current smoker | 1747 (15.2) |
| 2=Past smoker | 670 (5.8) | |||
| 3=Never smoker | 9078 (79) | |||
| F2 | Demographic | Sleep satisfaction | 1=Completely | 1167 (10.2) |
| 2=High | 1583 (13.8) | |||
| 3=Moderate | 7924 (68.9) | |||
| 4=Not satisfied | 665 (5.8) | |||
| 5=Very dissatisfied | 156 (1.4) | |||
| F3 | Demographic | Sex | 1=Female | 5857 (51) |
| 2=Male | 5638 (49) | |||
| F4 | Demographic | History of heart disease | 1=No | 9722 (84.6) |
| 2=Unknown | 348 (3) | |||
| 3=Yes | 1425 (12.4) | |||
| F5 | Demographic | History of palpitations | 1=No | 7138 (62.1) |
| 2=Yes | 3782 (32.9) | |||
| 3=No, but sometimes irregular | 575 (5) | |||
| F6 | Demographic | Obesity | 0=No | 8704 (75.7) |
| 1=Yes (if BMI=4) | 2791 (24.3) | |||
| F7 | Demographic | History of stroke | 1=No | 11058 (96.2) |
| 2=Unknown | 223 (1.9) | |||
| 3=Yes | 214 (1.9) | |||
| F8 | Demographic | Age | 1=(if 34≤age<65) | 9904 (86.2) |
| 2= (if age≥65) | 1591 (13.8) | |||
| F9 | Demographic | Family history of CVD | 0=No | 6946 (60.4) |
| 1=Yes | 4549 (39.6) | |||
| F10 | Demographic | Metabolic syndrome | 0=No | 6690 (58.2) |
| 1=Yes | 4805 (41.8) | |||
| F11 | Demographic | Diabetes | 0=No | 10047 (87.4) |
| 1=Yes | 1448 (12.6) | |||
| F12 | Demographic | HTN | 0=No | 7674 (66.8) |
| 1=Yes | 3821 (33.2) | |||
| F13 | Demographic | Systolic HTN | 0=No | 9029 (78.5) |
| 1=Yes | 2466 (21.5) | |||
| F14 | Demographic | Diastolic HTN | 0=No | 9217 (80.2) |
| 1=Yes | 2278 (19.8) | |||
| F15 | Laboratory | High triglyceride | 0=No | 4891 (42.5) |
| 1=Yes | 6604 (57.5) | |||
| F16 | Laboratory | Low HDL | 0=No | 5239 (45.6) |
| 1=Yes | 6256 (54.4) | |||
| F17 | Laboratory | High LDL | 0=No | 8316 (72.3) |
| 1=Yes | 3179 (27.7) | |||
| F18 | Laboratory | High total cholesterol | 0=No | 4334 (37.7) |
| 1=Yes | 7161 (62.3) | |||
| F19 | Categorical | Target class | 0=Normal | 8676 (75.5) |
| 1=CAD | 2819 (24.5) |
CAD: Coronary artery disease, BMI: Body mass index, HTN: Hypertension, HDL: High-density lipoprotein, LDL: Low-density lipoprotein
Figure 1 shows a Correlation Heat Map based on 19 selected features. This heat map was obtained for sensitivity analysis using Spearman correlation analysis[28] in SPSS software. The x and y axes in the map contain the selected features, which are named as shown in Table 1 from F1 to F19. Orange on the map indicates the target class (F19) feature and blue indicates other features. The “*” sign means correlation is significant at the 0.01 level (2-tailed) and the “**” sign means correlation is significant at the 0.05 level (2-tailed). The clustering process is shown in the map by two dendrogram tree diagrams for columns and rows. The six features have the highest correlation with the target class and form a cluster (red rectangle). Furthermore, other features are in another cluster (purple rectangle) and have the second-highest correlation to the target class.
Figure 1.
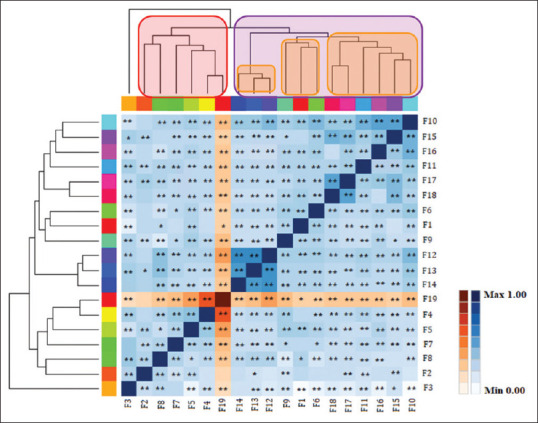
Correlation Heat Map based on the 19 selected features
Classification results
In this section, the classification results were presented. In this study, a confusion matrix was used to test the ANN, SVM, and RF classification models in CAD detection on the ICS dataset.
18 independent variables from 11495 records were used to build ANN, SVM, and RF models. Then, the accuracy, sensitivity, specificity, precision, F1-Score, and AUC of models were compared.
Table 2 shows the best SVM classifier among the 5 SVM classifiers. As shown in Table 2, the best accuracy belongs to Quadratic SVM (89.73%) and Medium Gaussian SVM is in second place (89.38%). The lowest accuracy belonged to Fine Gaussian SVM (80.39%).
Table 2.
Performance evaluation result of the support vector machine classifiers
| SVM classifier types | Accuracy (%) | Sensitivity (%) | Specificity (%) | Precision (%) | F1 score (%) | AUC |
|---|---|---|---|---|---|---|
| Quadratic SVM | 89.73 | 57.9 | 98.8 | 93.6 | 71.5 | 0.803 |
| ANN | 88.5 | 58.2 | 98.3 | 91.8 | 71.2 | 0.861 |
| RF | 87 | 53.7 | 96.9 | 83.8 | 65.7 | 0.791 |
| Linear SVM | 88.8 | 57.4 | 97.8 | 88.4 | 69.6 | 0.776 |
| Cubic SVM | 88.34 | 56.9 | 97.5 | 86.4 | 68.7 | 0.769 |
| Fine Gaussian SVM | 80.39 | 18.9 | 98 | 73 | 30 | 0.585 |
| Medium Gaussian SVM | 89.38 | 57.4 | 98.5 | 92 | 70.6 | 0.780 |
| Coarse Gaussian SVM | 88.9 | 58.1 | 97.8 | 88.5 | 70.1 | 0.780 |
SVM: Support vector machine, ANN: Artificial neural network, AUC: Area under the curve, RF: Random forest
The best ANN performance was obtained with 20 neurons in the hidden layer. The number of hidden layer neurons was obtained according to the numerical range obtained from Equations 1–3 and in a period of 15–45 min with repetition and various attempts for the ANN model. The minimum cross-entropy was obtained at epoch 20 and was 0.32874.
Table 2 also compares the performance of ANN, RF with Bagged trees classifier, and SVM with Quadratic SVM classifier. In terms of accuracy, SVM algorithm was in the first place (89.73%) and ANN and RF algorithms were in the second and third places, respectively (88.5% and 87%). In all three models of SVM, ANN, and RF, the specificity was much higher than the sensitivity. The sensitivity and AUC in the ANN model were higher than the SVM and RF models. The specificity, accuracy, precision, and F1-score in the SVM model were higher than the ANN and RF models.
Figure 2a-c also shows confusion matrices of the ANN, RF, and SVM algorithms. ANN, SVM, and RF models were assessed on the test dataset with 1724 records.
Figure 2.
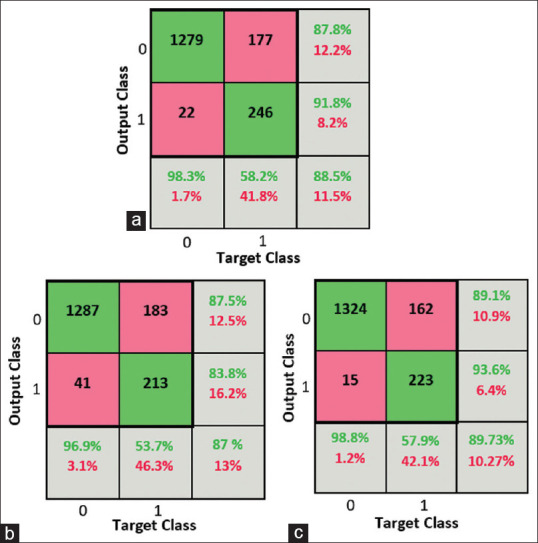
The Confusion matrix of (a) ANN, (b) RF, (c) SVM
Figure 3a-c shows the ability of all three models to detect CAD. The AUC of ANN model (0.861) was greater than AUC of SVM model (0.803) and RF model (0.791).
Figure 3.
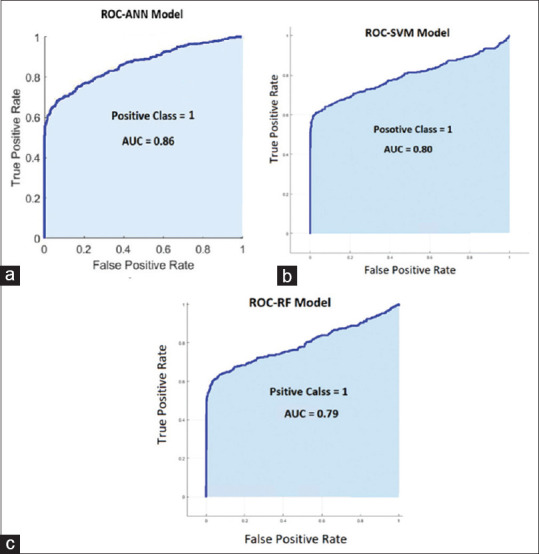
The Receiver Operating Characteristics curve curves of (a) ANN, (b) SVM, (c) RF
From the output of the RF algorithm, 404 rules were extracted from a total of 10 trees. After reviewing these rules, 11 rules that had the highest value of confidence and support compared to other rules were selected. These rules are listed in descending order of confidence and are shown in Table 3. The most confident rule had 100% confidence and the support was 735. The least confident rule had 57% confidence and the support was 63. The set of selected rules is shown in Table 3.
Table 3.
A selection of rules extracted based on the RF algorithm
| Rule | Assumptions | Result | Confidence (%) | Support |
|---|---|---|---|---|
| 1 | If “HTN=yes” And “history of heart disease=yes” | Prone to CAD | 100 | 735 |
| 2 | If “systolic HTN=yes” and “history of stroke=No” and “history of palpitations=yes” and “diabetes=No” and “history of heart disease=Yes” | Prone to CAD | 100 | 165 |
| 3 | If “HTN=No” and “history of stroke=no” and “history of palpitations=no” and “family history of CVD=yes” and “history of heart disease=yes” | Prone to CAD | 100 | 116 |
| 4 | If “systolic HTN=No” and “HTN=yes” and “family history of CVD=yes” and “high LDL=yes” and “history of heart disease=Yes” | Prone to CAD | 100 | 97 |
| 5 | If “history of palpitations=yes” And “sleep satisfaction=high” and “high triglyceride=yes” and “history of heart disease=yes” | Prone to CAD | 100 | 86 |
| 6 | If “systolic HTN=no” and “HTN=yes” and “family history of CVD=yes” and “high LDL=no” and “history of palpitations=no” and “history of heart disease=yes” | Prone to CAD | 100 | 63 |
| 7 | If “systolic HTN=yes” and “history of stroke=No” and “history of palpitations=yes” and “diabetes=yes” and “history of heart disease=yes” | Prone to CAD | 100 | 58 |
| 8 | If “history of stroke=yes” and “high LDL=yes” | Prone to CAD | 91.1 | 102 |
| 9 | If “history of palpitations=yes” and “history of heart disease=unknown” and “high triglyceride=yes” and “low HDL=yes” | Prone to CAD | 76 | 65 |
| 10 | If “diabetes=yes” and “history of stroke=no” and “HTN=yes” and “metabolic syndrome=yes” and “history of palpitations=yes” and “low HDL=yes” | Prone to CAD | 64 | 283 |
| 11 | If “history of stroke=no” and “history of heart disease=no” and “HTN=yes” and “high total cholesterol=yes” and “history of palpitations=yes” and “sleep satisfaction=not satisfied” | Prone to CAD | 57 | 63 |
CAD: Coronary artery disease, HTN: Hypertension, HDL: High-density lipoprotein, LDL: Low-density lipoprotein
DISCUSSION
Based on the results obtained from Correlation Heat Map, the most significant features in the occurrence of CAD among selected features were sex, sleep satisfaction, age, history of stroke, history of palpitations, and history of heart disease. These factors expect sleep satisfaction has been used in the studies of Alizadehsani el al.,[3,29] Shahid and Singh[11] and Joloudari et al.[7] However, other features of this study were also important due to their high correlation with the target class. Other studies show that features such as chest pain, age, family history, hypertension, diabetes, blood pressure, inversion, Q wave, ST elevation, BMI, smoking, high-density lipoprotein, and triglyceride have a significant impact on CAD identification.[3,7,29]
The Quadratic SVM classifier predicts more accurately than other classifiers. Desai et al. examined the classification of cardiac arrhythmias using SVM kernel functions including Linear, Quadratic, Polynomial and Radial Basis Function. The results showed that SVM quadratic kernel had higher accuracy than other classifiers.[30] Ekiz and Erdogmus comparing different data mining algorithms to diagnose heart disease on a dataset by MATLAB software. They compared SVM classifiers including Linear SVM, Quadratic SVM, Cubic SVM, Medium Gaussian SVM. In the study, Quadratic SVM and linear SVM were among the best classifiers and had high performance.[31] Also, according to the obtained results, all three algorithms achieved relatively close results. However, the SVM technique had the best performance compared to the ANN and RF techniques. The SVM technique has proven to be effective in many pattern recognition issues.[32] This technique has a good ability to generalize unseen test data.[33] SVM can perform well and provide high accuracy despite the limited number of examples.[34] On the other hand, in the present study, The ANN model performed better in all criteria than the RF. Also, the ANN model had higher sensitivity and AUC than both SVM and RF models. As sensitivity is diagnosing the disease correctly (true positive rate),[35] the higher level of sensitivity in the ANN indicates a higher relative ability of the ANN than the SVM to diagnose CAD susceptible individuals.[36] ANN has two main characteristics. The first characteristics is the ability to learn how to perform operations after proper training. The second characteristics are the ability to generalize and generate the appropriate solution for unobserved test data,[37] which is the common point of the ANN and SVM algorithms. Alizadehsani et al. evaluated the Optimized SVM and ANN algorithms and several other algorithms in a CAD detection study. The results showed that the Optimized SVM algorithm achieved the best accuracy.[3] In a study to predict CAD, Dipto et al. evaluated three algorithms: SVM, ANN, and Logistic Regression. The results showed that in the imbalanced dataset the SVM algorithm achieved higher accuracy. Moreover, this study showed that in the balanced dataset the ANN algorithm performed better than other algorithms.[38] Abrunhosa Collazo et al. in a study compared the performance of ANN and SVM algorithms to predict CAD. Findings in this study showed that the SVM algorithm performed better than other algorithms.[39] In a study, Akella examined six different data mining algorithms, including ANN and SVM algorithms for predicting CAD. The results showed that the ANN algorithm was better than other algorithms in all performance parameters, including accuracy, AUC, sensitivity, and F1-Score.[21] Almansour et al. conducted a study to diagnose patients with chronic kidney disease (CKD). In this study, ANN and SVM algorithms were evaluated. The results showed that the ANN algorithm achieved higher accuracy than the SVM.[40] Gudadhe et al. developed a decision support system for classifying heart disease based on SVM and ANN. The results showed that both algorithms performed well but ANN performed better than SVM.[41]
One of the advantages of the RF model is the production or extraction of rules.[3,7,29] Based on the results, high HTN and history of heart disease and family history of CVD, high triglyceride, high LDL, low HDL, having Systolic HTN, diabetes, history of stroke, metabolic syndrome, history of palpitations, dissatisfaction with sleep, can have a significant impact on CAD. High blood pressure, one of the most traditional risk factors, is consistently associated with an increased risk of developing CAD in different populations.[42] A family history of heart disease, like heart disease in a father or brother before age 55 and in a mother or sister diagnosed before age 65, is an important risk factor.[43] The prevalence of CAD is also higher in people with metabolic syndrome.[44] Increased LDL and decreased HDL and hypertriglyceridemia are also associated with increased CAD.[45] Poor quality sleep is also associated with a higher risk of CAD.[46]
To the best of our knowledge, in most studies on the diagnosis of CAD, the UCI or Z-Alizadeh Sani dataset (each with 303 records) has been used, which has a record number less than the dataset used in this study. The UCI dataset also has 13 features that are less than the dataset used in this study.[29] Considering that a lot of research has been done on the mentioned datasets, it can be said that the innovation of the existing research is that the dataset of ICRC has been used for data mining, which in addition to being a native dataset, it also has more features and records than other listed datasets and so far, this dataset has not been used for data mining.
CONCLUSION
In this study, ANN, SVM, and RF data mining algorithms were evaluated on the ICS dataset and the results were discussed. The features in this dataset are selected according to experts and reviews of related studies and possible indicators of CAD. Also, the features used in this study can be measured with cost-effectiveness and fewer side effects. In this study, it was shown that machine learning algorithms can be used with high accuracy to detect CAD. It was also shown that both SVM and ANN models perform well in CAD detection. Although CAD is widespread and can have fatal consequences, early detection of CAD allows physicians to treat the variable risk factors associated with CAD progression. The use of machine learning approach provides the ability to predict the presence of CAD with high accuracy and sensitivity. Thus, it allows physicians to perform timely preventive treatment in patients with CAD.
Financial support and sponsorship
This study is supported by Isfahan University of Medical Sciences (research project, # 399932 and ethics code IR.MUI.RESEARCH.REC.1399.785.).
Conflicts of interest
There are no conflicts of interest.
Acknowledgment
We would like thank the support and cooperation of the Health Information Technology Research Center and the Isfahan Cardiovascular Research Center.
REFERENCES
- 1.Mastoi QU, Wah TY, Gopal Raj R, Iqbal U. Automated diagnosis of coronary artery disease: A review and workflow. Cardiol Res Pract 2018. 2018 doi: 10.1155/2018/2016282. 2016282. [DOI] [PMC free article] [PubMed] [Google Scholar]
- 2.Alizadehsani R, Khosravi A, Roshanzamir M, Abdar M, Sarrafzadegan N, Shafie D, et al. Coronary artery disease detection using artificial intelligence techniques: A survey of trends, geographical differences and diagnostic features 1991-2020. Comput Biol Med. 2021;128:104095.1. doi: 10.1016/j.compbiomed.2020.104095. [DOI] [PubMed] [Google Scholar]
- 3.Alizadehsani R, Habibi J, Hosseini MJ, Mashayekhi H, Boghrati R, Ghandeharioun A, et al. A data mining approach for diagnosis of coronary artery disease. Comput Methods Programs Biomed. 2013;111:52–61. doi: 10.1016/j.cmpb.2013.03.004. [DOI] [PubMed] [Google Scholar]
- 4.Hassannataj Joloudari J, Saadatfar H, Dehzangi A, Shamshirband S. Computer-aided decision-making for predicting liver disease using PSO-based optimized SVM with feature selection. Inform Med Unlocked. 2019;17:100255. [Google Scholar]
- 5.Ajami S, Mohammadi M. Telemedicine against CoVID-19 crisis. Health Policy Technol. 2020;9:277–8. doi: 10.1016/j.hlpt.2020.05.002. [DOI] [PMC free article] [PubMed] [Google Scholar]
- 6.Amin MS, Chiam YK, Varathan KD. Identification of significant features and data mining techniques in predicting heart disease. Telemat Inform. 2019;36:82–93. [Google Scholar]
- 7.Joloudari JH, Joloudari EH, Saadatfar H, GhasemiGol M, Razavi SM, Mosavi A, et al. Coronary artery disease diagnosis; ranking the significant features using a random trees model. Int J Environ Res Public Health. 2020;17:731. doi: 10.3390/ijerph17030731. [DOI] [PMC free article] [PubMed] [Google Scholar]
- 8.Libby P, Zipes D, Bonow R, Mann D, Tomaselli G. 11th ed. Amsterdam, Netherlands: Elsevier Health Sciences; 2018. Braunwald's Heart Disease e-Book: A Textbook of Cardiovascular Medicine. [Google Scholar]
- 9.Bagherian H, Haghjooy Javanmard S, Sharifi M, Sattari M. Using data mining techniques for predicting the survival rate of breast cancer patients: A review article. Tehran Univ Med J. 2021;79:176–86. [Google Scholar]
- 10.Saeedbakhsh S, Sattari M, Mohammadi M, Najafian J. Application of data mining techniques in predicting coronary heart disease: A systematic review. [Last accessed on 2022 Jan 29];Int J Environ Health Eng. 2021 10:5. Available from: https://www.ijehe.org/article.asp?issn=2277-9183;year=2021;volume=10;issue=1;spage=5;epage=5;aulast=Saeedbakhsh . [Google Scholar]
- 11.Shahid AH, Singh MP. A novel approach for coronary artery disease diagnosis using hybrid particle swarm optimization based emotional neural network. Biocybern Biomed Eng. 2020;40:1568–85. [Google Scholar]
- 12.Jackins V, Vimal S, Kaliappan M, Lee MY. AI-based smart prediction of clinical disease using random forest classifier and Naive Bayes. [Last accessed on 2022 Jan 25];J Supercomput. 2021 77:5198–219. Available from: https://link.springer.com/article/10.1007/s11227-020-03481-x . [Google Scholar]
- 13.Das R, Turkoglu I, Sengur A. Effective diagnosis of heart disease through neural networks ensembles. Expert Syst Appl. 2009;36:7675–80. doi: 10.1016/j.cmpb.2008.09.005. [DOI] [PubMed] [Google Scholar]
- 14.Olaniyi EO, Oyedotun OK, Adnan K. Heart diseases diagnosis using neural networks arbitration. Int J Intell Syst Appl. 2015;7:72. [Google Scholar]
- 15.Dutta A, Batabyal T, Basu M, Acton ST. An efficient convolutional neural network for coronary heart disease prediction. Expert Syst Appl. 2020;159:113408. [Google Scholar]
- 16.Mazaheri S, Ashoori M, Bechari Z. A model to predict heart disease treatment using data mining. [Last accessed on 2022 Jan 26];Payavard. 2017 11:287–96. Available from: http://payavard.tums.ac.ir/article-1-6285-en.html . [Google Scholar]
- 17.Sh S, Tolooie HR. Isfahan Healthy Heart Program: A comprehensive integrated community-based program for cardiovascular disease prevention and control design, methods and initial experience, 2000-01. J Res Med Sci. 2002;1:1–8. [Google Scholar]
- 18.Al Jarullah AA. Decision tree discovery for the diagnosis of type II diabetes. In: 2011 International conference on innovations in information technology. IEEE. 2011:303–7. [Google Scholar]
- 19.Rodríguez D, Sicilia MA, García E, Harrison R. Empirical findings on team size and productivity in software development. [Last accessed on 2021 Dec 21];J Syst Softw. 2011 85:562–70. Available from: http://www.pmi.org/ [Google Scholar]
- 20.Mohammadi F, Pourzamani H, Karimi H, Mohammadi M, Mohammadi M, Ardalan N, et al. Artificial neural network and logistic regression modelling to characterize COVID-19 infected patients in local areas of Iran. Biomed J. 2021;44:304–16. doi: 10.1016/j.bj.2021.02.006. [DOI] [PMC free article] [PubMed] [Google Scholar]
- 21.Akella A, Akella S. Machine learning algorithms for predicting coronary artery disease: Efforts toward an open source solution. Future Sci OA. 2021;7:FSO698. doi: 10.2144/fsoa-2020-0206. [DOI] [PMC free article] [PubMed] [Google Scholar]
- 22.IRMA. Fuzzy Systems: Concepts, Methodologies, Tools, and Applications. Vols. 1-3. Hershey, Pennsylvania: IGI Global; 2017. pp. 1–1765. [Google Scholar]
- 23.Ali F, El-Sappagh S, Islam SM, Kwak D, Ali A, Imran M, et al. A smart healthcare monitoring system for heart disease prediction based on ensemble deep learning and feature fusion. Inf Fusion. 2020;63:208–22. [Google Scholar]
- 24.Md Idris N, Chiam YK, Varathan KD, Wan Ahmad WA, Chee KH, Liew YM. Feature selection and risk prediction for patients with coronary artery disease using data mining. Med Biol Eng Comput. 2020;58:3123–40. doi: 10.1007/s11517-020-02268-9. [DOI] [PubMed] [Google Scholar]
- 25.Galdi P, Tagliaferri R. Encyclopedia of Bioinformatics and Computational Biology: ABC of Bioinformatics. Amsterdam, Netherlands: Elsevier; 2018. Data mining: Accuracy and error measures for classification and prediction; pp. 431–6. [Google Scholar]
- 26.Tong Z, Liu Y, Ma H, Zhang J, Lin B, Bao X, et al. Development, validation and comparison of artificial neural network models and logistic regression models predicting survival of unresectable pancreatic cancer. Front Bioeng Biotechnol. 2020;8:196. doi: 10.3389/fbioe.2020.00196. [DOI] [PMC free article] [PubMed] [Google Scholar]
- 27.Hahsler M, Grün B, Hornik K. Arules – A computational environment for mining association rules and frequent item sets. J Stat Softw. 2005;14:1–25. [Google Scholar]
- 28.Saltelli A, Andres TH, Homma T. Sensitivity analysis of model output. An investigation of new techniques. Comput Stat Data Anal. 1993;15:211–38. [Google Scholar]
- 29.Alizadehsani R, Habibi J, Hosseini MJ, Boghrati R, Ghandeharioun A, Bahadorian B, et al. Diagnosis of coronary artery disease using data mining techniques based on symptoms and ECG features. Eur J Sci Res. 2012;82:542–53. [Google Scholar]
- 30.Desai U, Martis RJ, Nayak CG, Sarika K, Seshikala G. Machine Intelligent Diagnosis of ECG for Arrhythmia Classification Using DWT, ICA and SVM Techniques.12th IEEE International Conference Electronics, Energy, Environment, Communication, Computer, Control: (E3-C3), INDICON 2015. 2016:2–5. [Google Scholar]
- 31.Ekiz S, Erdogmus P. Comparative Study of Heart Disease Classification. 2017 Electric Electronics. Computer Science, Biomedical Engineerings’ Meeting, EBBT 2017. 2017:1–4. [Google Scholar]
- 32.Byun H, Lee SW. A survey on pattern recognition applications of support vector machines. Int J Pattern Recognit Artif Intell. 2003;17:459–86. [Google Scholar]
- 33.Huang MW, Chen CW, Lin WC, Ke SW, Tsai CF. SVM and SVM ensembles in breast cancer prediction. PLoS One. 2017;12:e0161501. doi: 10.1371/journal.pone.0161501. [DOI] [PMC free article] [PubMed] [Google Scholar]
- 34.Adewumi AA, Owolabi TO, Alade IO, Olatunji SO. Estimation of physical, mechanical and hydrological properties of permeable concrete using computational intelligence approach. Appl Soft Comput. 2016;42:342–50. [Google Scholar]
- 35.Yerushalmy J. Statistical problems in assessing methods of medical diagnosis, with special reference to X-ray techniques. Public Health Rep. 1947;62:1432–49. [PubMed] [Google Scholar]
- 36.Brereton RG, Lloyd GR. Support vector machines for classification and regression. Analyst. 2010;135:230–67. doi: 10.1039/b918972f. [DOI] [PubMed] [Google Scholar]
- 37.Prasad A, Edward JB. Importance of Artificial Neural Networks for Location of Faults in Transmission Systems: A Survey. In: 2017 11th International Conference on Intelligent Systems and Control (ISCO) IEEE. 2017:357–62. [Google Scholar]
- 38.Dipto IC, Islam T, Rahman HM, Rahman MA, Dipto IC, Islam T, et al. Comparison of different machine learning algorithms for the prediction of coronary artery disease. [Last accessed on 2021 Sep 07];J Data Anal Inf Process. 2020 8:41–68. Available from: http://www.scirp.org/journal/PaperInformation.aspx?PaperID=99402 . [Google Scholar]
- 39.Abrunhosa Collazo R, Antonio Monteiro Pessôa L, Bahiense L, de Bragança Pereira B, Faria dos Reis A, Souza Silva N. A comparative study between artificial neural network and support vector machine for acute coronary syndrome prognosis. [Last accessed on 2021 Sep 07];Pesqui Oper. 2016 36:321–43. Available from: http://www.scielo.br/pope . [Google Scholar]
- 40.Almansour NA, Syed HF, Khayat NR, Altheeb RK, Juri RE, Alhiyafi J, et al. Neural network and support vector machine for the prediction of chronic kidney disease: A comparative study. Comput Biol Med. 2019;109:101–11. doi: 10.1016/j.compbiomed.2019.04.017. [DOI] [PubMed] [Google Scholar]
- 41.Gudadhe M, Wankhade K, Dongre S. Decision Support System for Heart Disease Based on Support Vector Machine and Artificial Neural Network. 2010 International Conference on Computer and Communication Technology ICCCT-2010. 2010:741–5. [Google Scholar]
- 42.Arnaout MS, Almahmeed W, Ibrahim M, Ker J, Khalil MT, Van Wyk CT, et al. Hypertension and its management in countries in Africa and the Middle East, with special reference to the place of β-blockade. Curr Med Res Opin. 2011;27:1223–36. doi: 10.1185/03007995.2011.576239. [DOI] [PubMed] [Google Scholar]
- 43.Hajar R. Risk factors for coronary artery disease: Historical perspectives. [Last accessed on 2021 Sep 05];Heart Views. 2017 18:109. doi: 10.4103/HEARTVIEWS.HEARTVIEWS_106_17. Available from: http://pmc/articles/PMC5686931/ [DOI] [PMC free article] [PubMed] [Google Scholar]
- 44.Al-Nozha M, Al-Khadra A, Arafah MR, Al-Maatouq MA, Khalil MZ, Khan NB, et al. Metabolic syndrome in Saudi Arabia. [Last accessed on 2021 Sep 05];Saudi Med J. 2005 26:1918–25. Available from: https://europepmc.org/article/med/16380773 . [PubMed] [Google Scholar]
- 45.Gotto AM., Jr Triglyceride as a risk factor for coronary artery disease. Am J Cardiol. 1998;82:22Q–5Q. doi: 10.1016/s0002-9149(98)00770-x. [DOI] [PubMed] [Google Scholar]
- 46.Lao XQ, Liu X, Deng HB, Chan TC, Ho KF, Wang F, et al. Sleep quality, sleep duration, and the risk of coronary heart disease: A prospective cohort study with 60,586 adults. J Clin Sleep Med. 2018;14:109–17. doi: 10.5664/jcsm.6894. [DOI] [PMC free article] [PubMed] [Google Scholar]