Abstract
Introduction
Dyspnea is a common symptom in survivors of severe COVID-19 pneumonia. While frequently employed in hospital settings, the use of point-of-care ultrasound in ambulatory clinics for dyspnea evaluation has rarely been explored. We aimed to determine how lung ultrasound score (LUS) and inspiratory diaphragm excursion (DE) correlate with patient-reported dyspnea during a 6-min walk test (6MWT) in survivors of COVID-19 acute respiratory distress syndrome (ARDS). We hypothesize higher LUS and lower DE will correlate with dyspnea severity.
Study Design and Methods
Single-center cross-sectional study of survivors of critically ill COVID-19 pneumonia (requiring high-flow nasal cannula, invasive, or non-invasive mechanical ventilation) seen in our Post-ICU clinic. All patients underwent standardized scanning protocols to compute LUS and DE. Pearson correlations were performed to detect an association between LUS and DE with dyspnea at rest and exertion during 6MWT.
Results
We enrolled 45 patients. Average age was 61.5 years (57.7% male), with average BMI of 32.3 Higher LUS correlated significantly with dyspnea, at rest (r = + 0.41, p = < 0.01) and at exertion (r = + 0.40, p = < 0.01). Higher LUS correlated significantly with lower oxygen saturation during 6MWT (r = -0.55, p = < 0.01) and lower 6MWT distance (r = -0.44, p = < 0.01). DE correlated significantly with 6MWT distance but did not correlate with dyspnea at rest or exertion.
Conclusion
Higher LUS correlated significantly with patient-reported dyspnea at rest and exertion. Higher LUS significantly correlated with more exertional oxygen desaturation during 6MWT and lower 6MWT distance. DE did not correlate with dyspnea.
Supplementary Information
The online version contains supplementary material available at 10.1007/s00408-023-00614-w.
Keywords: COVID-19, Diaphragm Excursion, Dyspnea, Lung Ultrasound Score, Post-ICU clinic, Thoracic Lung Ultrasound
Background
Acute respiratory distress syndrome (ARDS), the most severe form of viral pneumonia caused by COVID-19, has strained healthcare systems worldwide [1]. While improvements in critical care led to better survival from COVID-19 ARDS, health care systems were required to confront a new and complex population of ICU survivors [2].
Survivors of critically ill COVID-19 experience symptoms overlapping with the post-intensive care syndrome, in which patients experience long-term physical, neurocognitive, and mental health debility related to their critical illness [3]. Dyspnea is one of the most common persistent symptoms following COVID-19 [4, 5], especially in the post-critically ill; severe lung injury, prolonged advanced respiratory support and high-dose corticosteroids may all be contributory. Indeed, clinicians treating survivors of COVID-19 ARDS with dyspnea must consider multiple potential contributors to this symptom complex including the coexistence of systemic and neuromuscular debility secondary to critical illness neuromyopathy, pre-existing cardiopulmonary comorbidities along with any potential specific post-viral consequences [6, 7].
Thoracic ultrasound (TUS) has become an indispensable tool for the rapid diagnosis and therapeutic management of acute respiratory failure in critically ill patients [8–10]. In addition to the acute evaluation, there is growing literature in lung ultrasound’s capability in profiling distinct diseases of respiratory failure, such as characterizing pleural abnormalities in ARDS, identifying B-lines and pleural irregularity in interstitial lung disease, and measuring diaphragm thickening or excursion as assessments for neuromuscular weakness in respiratory failure commonly seen in mechanically ventilated patients [11, 12]. Despite the extensive literature describing the use of ultrasound in hospital settings, employment and utility in ambulatory settings have seldom been reported. Integrating thoracic ultrasound during evaluation may allow clinicians to identify the etiology of dyspnea in this complex population. We report on our experience of employing thoracic ultrasound to investigate post-acute lung injury with lung ultrasound, and respiratory muscle strength with diaphragm excursion measurement in a post-ICU population recovering from COVID-19 ARDS. We hypothesize that higher lung ultrasound score (LUS) and lower inspiratory diaphragm excursion (DE) will predict a higher severity of patient-reported dyspnea in this population.
Study Design and Methods
Data Source and Study Cohort
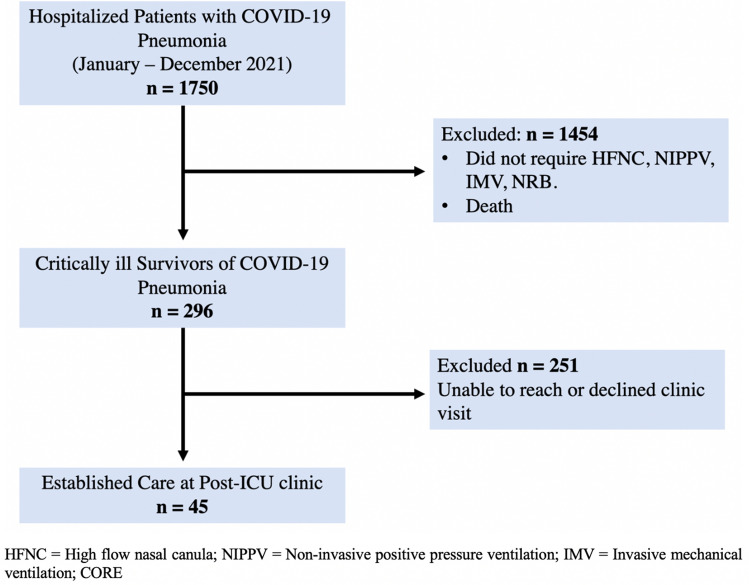
This is a single-center, prospective, cross-sectional study, conducted in an academic medical center in the Bronx, New York. The study population included adults ≥ 18 years old who survived critical illness from COVID-19 pneumonia, survived to hospital discharge and established care at our post-ICU clinic between January 2021 and January 2022 (Fig. 1).
Fig. 1.
Consort diagram showing patient enrollment and Post-ICU clinic follow-up
Critically ill COVID-19 pneumonia was defined as acute hypoxemic respiratory failure with ARDS (per the Berlin definition [13]) requiring invasive or non-invasive mechanical ventilation (IMV, NIPPV), and/or high-flow nasal cannula (HFNC). The study was conducted following the Declaration of Helsinki and was approved by our Institutional Review Board (IRB# 2020–11869).
The primary outcome of the study investigated a correlation between lung ultrasound score and diaphragm excursion with patient-reported dyspnea (e-Fig. 1. Per the Modified Borg Dyspnea Scale, mMBD [14]) at rest and at end-exertion during 6-min walk test (6MWT). Secondary endpoints investigated correlations between lung ultrasound score or diaphragm excursion and 6-min walk test distance and exertional oxygen desaturation.
Equipment and Personnel
We used a Sonosite™ PX (FUJIFILM Sonosite Inc., Bothell, WA, USA) ultrasound machine equipped with a phased array transducer (frequency 5–3 MHz) and a linear array transducer (frequency 15–4 MHz). All patients underwent evaluation by an experienced pulmonary and critical care attending. Ultrasound recordings were stored in Q-Path (Telexy Healthcare Inc., Everett, WA, USA) and lung ultrasound scoring was reviewed for interpretation by a blinded independent reviewer trained in thoracic ultrasound.
Lung Ultrasound Protocol
For lung ultrasound scoring, subjects were scanned in the upright position. Twelve fields were assessed (six zones per hemithorax). Each zone was scanned based on predetermined anatomical landmarks to assess anterior, medial, and posterior lung areas per published protocols [15, 16] (e-Fig. 2).
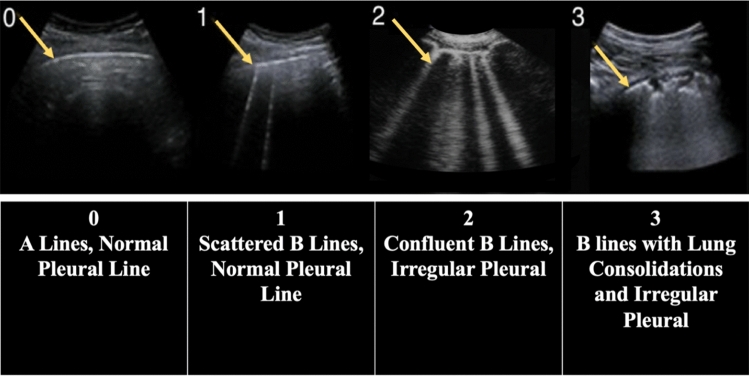
Lung ultrasound score consisted in the identification of four sonographic patterns of lung ultrasound: normal lung by the presence of lung sliding with A-lines (score 0); presence of significant B-lines (score 1); confluent B-lines with or without small lung consolidations (score 2); and extensive lung consolidations with B-lines (score 3) (Fig. 2). The total lung ultrasound score was calculated by a composite of the sum of all individual zone scores, ranging between 0 and 36 [17].
Fig. 2.
Lung ultrasound score system, based on the identification of four sonographic patterns
Diaphragm Ultrasound Protocol
Subjects underwent scanning in a supine position of the right hemidiaphragm via a subcostal approach, using two-dimensional B-mode and M-mode ultrasound views [18]. Diaphragm excursion was measured during resting respiration (quiet breathing) and deep inspiration (deep breathing) [19, 20] (e-Fig. 3). We obtained three (3) consecutive measurements which were averaged into a final composite distance recorded in centimeters (cm).
Statistical Analysis
Baseline characteristics were expressed as means, standard deviations (SD), and interquartile ranges (IQR) for continuous variables. Categorical variables were summarized as counts and percentages. We used Pearson correlation coefficient (r) to estimate the linear unadjusted association between lung ultrasound scores or diaphragmatic excursion as the main predictor variables and the degree of dyspnea reported per the mBorg scale as the main dependent variable [21]. Using the Kolmogorov–Smirnov Test of Normality, we found to have a standard data distribution. We used multivariable linear regression models to assess for potential correlates between baseline characteristics, hospital treatment, and ambulatory visit variables versus dyspnea as the outcome variable. A sample size of 50 patients was determined to achieve 80% power and detect a minimum correlation of 0.3 and 0.4 between lung ultrasound score or diaphragm excursion distance and dyspnea using a two-sided hypothesis test. A p-value < 0.05 was considered statistically significant and mean values were reported along with a 95% confidence interval. Stata version 17 (StataCorp., College Station, TX, USA) was used for all the statistical analyses.
Results
Baseline Characteristics
Between January and December 2021, we screened n = 1750 patients hospitalized with severe COVID-19 pneumonia. N = 296 patients were identified as critically ill with COVID-19 ARDS and survived to hospital discharge, and n = 45 patients established care in clinic and completed all study procedures (Fig. 1).
The mean (Standard Deviation: SD) age was 61.5 (13.9) years, consisting of 57.7% males, with a mean (SD) Body Mass Index (BMI) of 32.3 (7.2). The most common comorbidities were obesity (57.7%), hypertension (51.1%), and diabetes (28.8%). All patients required advanced respiratory support for hypoxemic respiratory failure due to COVID-19 pneumonia, with 86.6% (n = 39) requiring HFNC, 15.5% (n = 7) requiring NIPPV and 15.5% (n = 7) requiring IMV. The median (Inter Quartile Ratio: IQR) Fraction of inspired oxygen (FiO2) level required was 90% (75–100). The mean (SD) Sequential Organ Failure Assessment (SOFA) score was 3 (0.8) consisting with low probability of inpatient mortality. Table 1 shows detailed baseline characteristic and hospitalization treatment variables.
Table 1.
Baseline Patient Characteristics and Hospitalization Variables
| Hospitalization Characteristics | |||
|---|---|---|---|
| Total Subjects, n | 45 | ||
| Male Gender, n (%) | 26 (57.7) | ||
| Age in years, mean (SD) | 61.5 (13.9) | Age in years, median (IQR) | 60 (55–71) |
| Race, n (%) | Hispanic 25 (55.6) | White 9 (20) | Black 6 (13.33) |
| Other 3 (7.3) | Asian 2 (4.4) | ||
| Hospitalization Length of Stay (days) | |||
| LOS, mean (SD) | 22.3 (16.9) | LOS, median (IQR) | 18 (10–29) |
| Past Medical History | |||
| BMI, mean (SD) | 32.3 (7.2) | COPD, n (%) | 8 (17.7) |
| Obesity, n (%) | 26 (57.7) | Asthma, n (%) | 7 (15.5) |
| Hypertension, n (%) | 23 (51.1) | OSA, n (%) | 6 (13.3) |
| Diabetes, n (%) | 13 (28.8) | ILD, n (%) | 2 (4.4) |
| CKD, n (%) | 3 (6.6) | Pulmonary HTN, n (%) | 1 (2.2) |
| Cancer, n (%) | 2 (4.4) | Home O2, n (%) | 7 (15.5) |
| Heart Failure, n (%) | 7 (15.5) | Immunocompromise, n (%) | 4 (8.8) |
| Hospitalization Therapies | |||
| Shock, n (%) | 5 (11.1) | Positive BCx, n (%) | 3 (6.6) |
| Paralyzed, n (%) | 3 (6.6) | Positive RCx, n (%) | 3 (6.6) |
| VTE, n (%) | 9 (20) | Received Antibiotics, n (%) | 26 (57.7) |
| Received Anticoagulant, n (%) | 23 (51.1) | Received Dexamethasone, n (%) | 37 (82.2) |
| Received Tocilizumab, n (%) | 17 (37.7) | Received Plasma Trial, n (%) | 6 (13.3) |
| Received Remdisivir, n (%) | 36 (80) | ||
| Oxygen Requirements | |||
| HFNC, n (%) | 39 (86.6) | Placed NRB, n (%) | 34 (75.5) |
| NIV (BiPAP), n (%) | 7 (15.5) | Placed NRB only, n (%) | 3 (6.6) |
| IMV, n (%) | 7 (15.5) | ||
| Highest Fi02%, mean (SD) | 84.7 (15.1) | Highest FiO2%, median (IQR) | 90 (75–100) |
CKD Chronic kidney disease, COPD Chronic obstructive pulmonary disease, OSA Obstructive sleep apnea; ILD Interstitial lung disease; HTN Hypertension; VTE Venous thromboembolism, BCx Blood culture, RCx Respiratory culture, HFNC High-flow nasal canula, NIV Non-invasive ventilation, IMV Invasive mechanical ventilation, FiO2 Fraction of inspired oxygen, NRB Non-rebreather mask
Post-ICU Clinic Visit Results
The median (IQR) interval of days between hospital discharge and ambulatory clinic assessment was 70 days (41–106). Within the first 6 months following hospital discharge, 86% of subjects were evaluated.
We performed thoracic ultrasound in all 45 patients. The mean (SD) lung ultrasound score composite was 8.3 (6.6) with a median (IQR) 8 (3–12). Diaphragm excursion assessment was performed in n = 38 patients during quiet breathing and n = 37 patients with deep inspiration. The mean (SD) diaphragm excursion distance during quiet breathing was 1.9 cm (0.6), and 4.8 cm (2.2) with deep inspiration.
The mean (SD) rated perception of dyspnea per mBorg scale was 1.17 (1.36) at rest signifying “very slight” breathlessness, and 2.98 (2.2) at end-exertion signifying “moderate” breathlessness. The mean (SD) 6-min walk test distance was 949 feet (402), which was 58.2 of percent predicted. During 6-min walk test, the mean (SD) nadir room air of saturation of arterial oxygen (SaO2) was 88% (8.3) and zenith heart rate was 115 beats per minute (13.5) (Table 2).
Table 2.
Post-ICU Clinic Visit Characteristics and Results
| Post-ICU clinic visit Characteristics | |||
|---|---|---|---|
| Interval of days between hospital discharge and clinic visit. N = 45 | |||
| Interval days, mean (SD) | 97 (80.4) | Interval days, median (IQR) | 70 (41–106) |
| Seen within 30 days of hospital discharge, n (%) | 6 (13.3) | Seen within 90 days of hospital discharge, n (%) | 25 (55.5) |
| Seen within 180 days of hospital discharge, n (%) | 39 (86.6) | Seen after 180 days of hospital discharge, n (%) | 6 (13.3) |
| 6-Minute Walk Test Assessment | |||
| Borg Dyspnea Scale (0–10) | |||
| Rest. N = 45 | Exertion. N = 42 | ||
| Borg Rest, mean (SD) | 1.17 (1.36) | Borg Exertion, mean (SD) | 2.98 (2.2) |
| Borg Rest, median, (IQR) | 1 (0–2) | Borg Exertion median (IQR) | 3 (1–4) |
| 6-Minute Walk Test distance (feet). N = 40 | |||
| 6MWT, mean (SD) | 949 (402) | 6MWT, median (IQR) | 937 (577–1,215) |
| %Predicted 6-Minute Walk Test. N = 40 | |||
| %6MWT | 58.2 | ||
| Lowest 6-Minute Walk Test SaO2 (nadir, %). N = 39 | |||
| SpO2, mean (SD) | 88.7 (8.3) | SpO2, median (IQR) | 92 (85–95) |
| 6-Minute Walk Test Max HR (zenith, beats per minute). N = 38 | |||
| 6MWT HR, mean (SD) | 115 (13.5) | 6MWT HR, median (IQR) | 115 (106–124) |
| Thoracic Ultrasound Assessment | |||
| Lung Ultrasound Score (0–36). N = 45 | |||
| LUS, mean (SD) | 8.3 (6.6) | LUS, median (IQR) | 8 (3–12) |
| Diaphragm Excursion—Quiet Breathing (cm). N = 38 | |||
| Quiet breathing, mean (SD) | 1.9 (0.6) | Quiet breathing median (IQR) | 1.9 (1.5–2.3) |
| Diaphragm Excursion—Deep Inspiration (cm). N = 37 | |||
| Deep inspiration, mean (SD) | 4.8 (2.2) | Deep inspiration, median (IQR) | 4.5 (3.3–6) |
6MWT 6-Minute Walk Test, SaO2 Saturation of arterial oxygen, HR Heart rate, LUS Lung ultrasound score
We found that higher lung ultrasound score correlated positively and significantly with the severity of reported dyspnea, both at rest (r = + 0.41, p < 0.01) and at end-exertion (r = + 0.40, p < 0.01) (Table 3; Fig. 3 and 4).
Table 3.
Thoracic Ultrasound, Dyspnea Score, and 6-min Walk Test Correlation Results
| Thoracic Ultrasound and Borg Dyspnea Scale | Pearson Correlation Coefficient (r) | p-value |
|---|---|---|
| Lung Ultrasound Score vs Borg Dyspnea Scale (Rest). N = 45 | + 0.4051 | 0.0058* |
| Lung Ultrasound Score vs Borg Dyspnea Scale (Exertion). N = 42 | + 0.3969 | 0.0093* |
| Diaphragm Excursion, quiet breathing vs Borg Dyspnea Scale (Rest). N = 38 | − 0.0631 | 0.7065 |
| Diaphragm Excursion, deep inspiration vs Borg Dyspnea Scale (Rest). N = 37 | + 0.0258 | 0.8794 |
| Diaphragm Excursion, quiet breathing vs Borg Dyspnea Scale (Exertion) N = 36 | + 0.0081 | 0.9628 |
| Diaphragm Excursion, deep inspiration vs Borg Dyspnea Scale (Exertion) N = 35 | + 0.0858 | 0.6240 |
| Thoracic Ultrasound and 6-Minute Walk | Pearson Correlation Coefficient (r) | p-value |
|---|---|---|
| Lung Ultrasound Score vs. 6-Minute Walk Distance (feet) N = 40 | − 0.4380 | 0.0047* |
| Lung Ultrasound Score vs. 6-Minute Walk Distance (% Predicted). N = 40 | − 0.2689 | 0.0934 |
| Lung Ultrasound Score vs. 6-Minute Walk SaO2 (nadir). N = 39 | − 0.5506 | 0.0003* |
| Lung Ultrasound Score vs. 6-Minute Walk Distance Max HR | + 0.0044 | 0.9792 |
| Diaphragm Excursion, quiet breathing vs 6-Minute Walk Distance (feet). N = 35 | + 0.3255 | 0.0564** |
| Diaphragm Excursion, quiet breathing vs. 6-Minute Walk Distance (% Predicted). N = 35 | + 0.3425 | 0.0440* |
| Diaphragm Excursion, quiet breathing vs. 6-Minute Walk SaO2 (nadir). N = 34 | + 0.1173 | 0.5089 |
| Diaphragm Excursion, quiet breathing vs. 6-Minute Walk Distance Max HR (bpm). N = 33 | + 0.0394 | 0.8277 |
| Diaphragm Excursion, deep inspiration vs 6-Minute Walk Distance (feet). N = 34 | + 0.3676 | 0.0325* |
| Diaphragm Excursion, deep inspiration vs. 6-Minute Walk Distance (% Predicted). N = 34 | + 0.2656 | 0.1290 |
| Diaphragm Excursion, deep inspiration vs. 6-Minute Walk SaO2 (nadir). N = 33 | + 0.2529 | 0.1557 |
| Diaphragm Excursion, deep inspiration vs. 6-Minute Walk Distance Max HR | + 0.0256 | 0.8874 |
Bold and asterisks are represents statistically significant p < 0.05
HR Heart rate
Fig. 3.
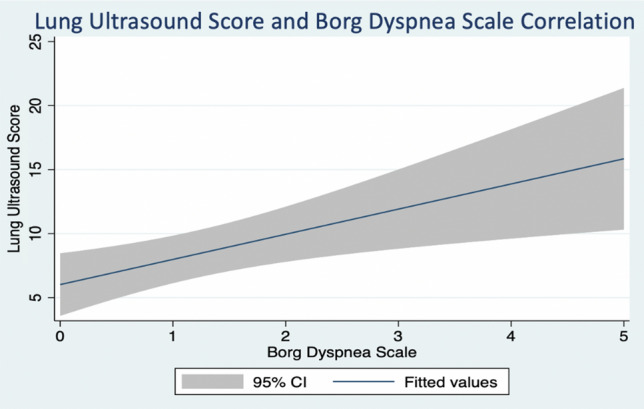
Lung ultrasound score and Borg dyspnea scale correlation at rest. Results from Pearson coefficient calculation
Fig. 4.
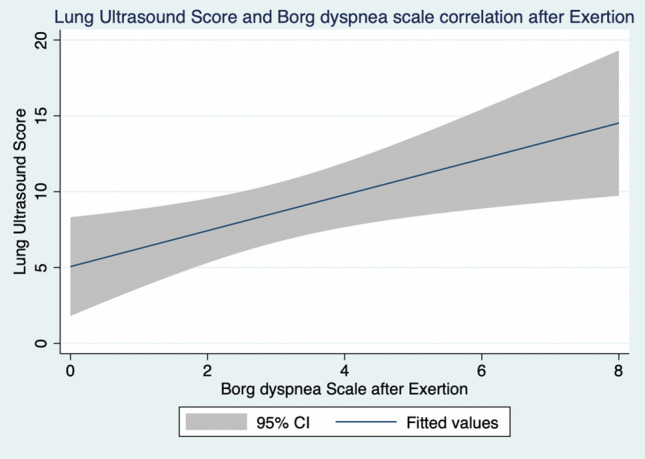
Lung ultrasound score and Borg dyspnea scale correlation after Exertion. Results from Pearson coefficient calculation
Of n = 40 patients who completed the 6-min walk test, higher lung ultrasound score correlated negatively and significantly with lower oxygen saturation during the 6-min walk test (r = − 0.55, p < 0.01) and lower 6-min walk test distance (r = − 0.44, p < 0.01) (Table 3; Fig. 5). Diaphragm excursion, during both quiet and deep inspiration, correlated significantly with the 6-min walk test distance (r = + 0.33, p = 0.05; r = + 0.37, p = 0.03), but did not correlate with dyspnea at rest or during exertion.
Fig. 5.
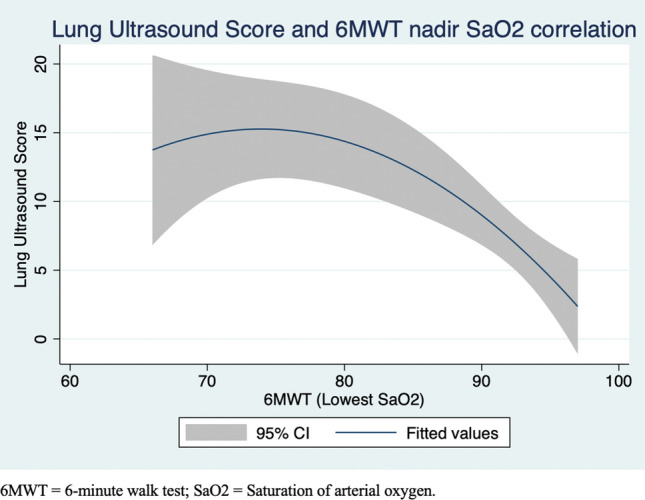
Lung ultrasound score and saturation of arterial oxygen correlation after 6-min walk test. Results from Pearson coefficient calculation. 6MWT 6-min walk test; SaO2 Saturation of arterial oxygen
Discussion
In the current study using thoracic ultrasound to evaluate dyspnea in adult survivors of COVID-19 ARDS, we found higher lung ultrasound score to significantly correlate with patient-reported dyspnea both at rest and with exertion. Higher lung ultrasound score also significantly correlated with the severity of exertional oxygen desaturation, and exercise tolerance as reflected by lower 6-min walk test. While diaphragm excursion did not correlate with dyspnea, higher degree of diaphragm excursion did correlate with the 6-min walk test distance.
Lung ultrasound score has been employed in ICU settings to evaluate the degree of loss of aeration of the lungs in patients with acute respiratory failure secondary to ARDS [22]. We used the lung ultrasound score to quantify the degree of lung injury in patients recovering from ARDS. In early ARDS, the B-lines identified represent widening of interlobular septa from fluid accumulation from non-cardiogenic pulmonary edema [23]. In this post-acute phase, B-lines identified in our patient population likely signify widening of interlobular septa from inflammation and/or deposition of fibrotic material [24]. Indeed, B-lines, pleural line irregularities, and subpleural consolidations have all been characterized as notable lung ultrasound findings present in interstitial lung disease [25].
In dyspnea evaluation, our findings suggest lung ultrasound can quantify the degree of post-ARDS injury within the lungs, which impacts the severity of dyspnea and exercise limitation. Interstitial lung disease can reduce diffusion capacity [26], thus high lung ultrasound score and its correlated exertional hypoxemia likely denote a degree of interstitial lung disease following COVID-19 ARDS in this patient population. While we identified an inverse correlation between lung ultrasound score and diffusion capacity of carbon monoxide (DLCO), this finding was not statistically significant likely due to low power with a low number of completed DLCO studies (n = 15). Clinically, lung ultrasound score can predict which patients may desaturate with exertion and guide requirements for prolonged oxygen support during recovery.
We found diaphragm excursion to correlate significantly with exercise capacity as determined by the 6-min walk test distance. Additionally, thoracic ultrasound with diaphragm excursion may provide a measure of neuromuscular strength and respiratory fitness as it relates to patient exercise tolerance. Poor diaphragm excursion, along with high lung ultrasound score, may both be markers of greater physical impairment in the continuum of post-intensive care syndrome, and thus may guide clinicians to advocate for physical and pulmonary rehabilitation as therapies to support recovery.
Our study is not without limitations. While the study cohort is multiracial and reflects that of an urban academic medical center, it is a single-center analysis. Although we identified statistically significant findings, our patient population was small. In addition, there was heterogeneity in interval times between hospital discharge and follow-up in the Post-ICU clinic. However, given that dyspnea and lung ultrasound evaluations were performed concurrently, the non-uniformity in follow-up times did not affect the primary outcome of our study. Finally, while complete pulmonary function testing with lung volumes and DLCO measurements would allow for further correlation analyses with thoracic ultrasound, given the limited number of patients who completed this assessment, this could not be evaluated.
Conclusion and Implications for Clinical Practice
Our investigation shows that point-of-care ultrasound in the ambulatory setting is feasible and can provide meaningful information when evaluating dyspnea in a complex patient population, where the etiology of breathlessness can be challenging to elucidate. While dyspnea may be multifactorial, higher lung ultrasound scores when present likely denote a more severe post-viral lung injury and are likely to be contributory. Given the complex nature of dyspnea in the post-COVID-19 population, further studies investigating changes in lung ultrasound score longitudinally and this relationship with pulmonary function testing may allow for better characterization of post-ARDS recovery trajectory in survivors of critically ill COVID-19.
Supplementary Information
Below is the link to the electronic supplementary material.
Acknowledgements
We would like to express our gratitude to the Chest foundation for providing us with a Sonosite™ PX (FUJIFILM Sonosite Inc., Bothell, WA, USA) ultrasound machine.
Abbreviations
- ARDS
Acute respiratory distress syndrome
- BMI
Body Mass Index
- Cm
Centimeters
- COVID-19
Coronavirus Disease 2019
- DE
Diaphragm Excursion
- DLCO
Diffusion capacity of carbon monoxide
- FiO2
Fraction of inspired oxygen
- HFNC
High-flow nasal cannula
- IQR
Inter Quartile Ratio
- LUS
Lung ultrasound score
- MHz
Megahertz
- mMBD
Modified Borg Dyspnea Scale
- (n)
Number
- NRB
Non-rebreather mask
- (p)
P value
- (r)
Pearson correlation coefficient
- SOFA
Sequential Organ Failure Assessment
- SD
Standard deviation
- TUS
Thoracic ultrasound score
- 6MWT
6-minute walk test
Author Contributions
GE is the first author. All authors had full access to the data and are responsible for the integrity of the data and statistical analysis. All authors participated in the elaboration and critical revision of this manuscript. MI performed all ultrasound scans. B.G performed the blinded review and scoring of lung ultrasound scores.
Funding
This work was supported by the CHEST Foundation Research Grant in Ultrasonography and COVID-19. M.I received a 2020 CHEST FOUNDATION GRANTS—Application # 7252. CHEST Foundation Research Grant in Ultrasonography and COVID-19.
Declarations
Conflict of interest
Any conflict of interest has been disclosed as required by the editorial panel.
Guarantor Statement
G.E. and M.I. are the authors responsible for all content of this manuscript.
Role of Sponsors
The CHEST foundation had no role in the design of the study, collection, analysis of the data, or elaboration of the manuscript.
Footnotes
Publisher's Note
Springer Nature remains neutral with regard to jurisdictional claims in published maps and institutional affiliations.
References
- 1.Holshue ML, DeBolt C, Lindquist S, et al. First case of 2019 Novel Coronavirus in the United States. N Engl J Med. 2020;382(10):929–936. doi: 10.1056/NEJMoa2001191. [DOI] [PMC free article] [PubMed] [Google Scholar]
- 2.Jaffri A, Jaffri UA. Post-intensive care syndrome and COVID-19: crisis after a crisis? Heart Lung. 2020;49(6):883–884. doi: 10.1016/j.hrtlng.2020.06.006. [DOI] [PMC free article] [PubMed] [Google Scholar]
- 3.Heesakkers H, van der Hoeven JG, Corsten S, et al. Clinical Outcomes among patients with 1-year survival following intensive care unit treatment for COVID-19. JAMA. 2022;327(6):559. doi: 10.1001/jama.2022.0040. [DOI] [PMC free article] [PubMed] [Google Scholar]
- 4.Carfì A, Bernabei R, Landi F, for the Gemelli Against COVID-19 Post-Acute Care Study Group Persistent symptoms in patients after acute COVID-19. JAMA. 2020;324(6):603. doi: 10.1001/jama.2020.12603. [DOI] [PMC free article] [PubMed] [Google Scholar]
- 5.Lam GY, Befus AD, Damant RW, et al. Exertional intolerance and dyspnea with preserved lung function: an emerging long COVID phenotype? Respir Res. 2021;22(1):222. doi: 10.1186/s12931-021-01814-9. [DOI] [PMC free article] [PubMed] [Google Scholar]
- 6.Patel P, DeCuir J, Abrams J, Campbell AP, Godfred-Cato S, Belay ED. Clinical characteristics of multisystem inflammatory syndrome in adults: a systematic review. JAMA Netw Open. 2021;4(9):e2126456. doi: 10.1001/jamanetworkopen.2021.26456. [DOI] [PMC free article] [PubMed] [Google Scholar]
- 7.Shepherd S, Batra A, Lerner DP. Review of critical illness myopathy and neuropathy. The Neurohospitalist. 2017;7(1):41–48. doi: 10.1177/1941874416663279. [DOI] [PMC free article] [PubMed] [Google Scholar]
- 8.Spruit MA, Holland AE, Singh SJ, Tonia T, Wilson KC, Troosters T. COVID-19: interim guidance on rehabilitation in the hospital and post-hospital phase from a European Respiratory Society- and American Thoracic Society-coordinated international task force. Eur Respir J. 2020;56(6):2002197. doi: 10.1183/13993003.02197-2020. [DOI] [PMC free article] [PubMed] [Google Scholar]
- 9.Islam M, Levitus M, Eisen L, Shiloh AL, Fein D. Lung ultrasound for the diagnosis and management of acute respiratory failure. Lung. 2020;198(1):1–11. doi: 10.1007/s00408-019-00309-1. [DOI] [PubMed] [Google Scholar]
- 10.Lichtenstein DA. Lung ultrasound in the critically ill. Ann Intensive Care. 2014;4(1):1. doi: 10.1186/2110-5820-4-1. [DOI] [PMC free article] [PubMed] [Google Scholar]
- 11.Singh AK, Mayo PH, Koenig S, Talwar A, Narasimhan M. The use of M-mode ultrasonography to differentiate the causes of B lines. Chest. 2018;153(3):689–696. doi: 10.1016/j.chest.2017.10.019. [DOI] [PubMed] [Google Scholar]
- 12.Gerscovich EO, Cronan M, McGahan JP, Jain K, Jones CD, McDonald C. Ultrasonographic evaluation of diaphragmatic motion. J Ultrasound Med. 2001;20(6):597–604. doi: 10.7863/jum.2001.20.6.597. [DOI] [PubMed] [Google Scholar]
- 13.Definition Task Force ARDS, Ranieri VM, Rubenfeld GD, et al. Acute respiratory distress syndrome: the Berlin definition. JAMA. 2012;307(23):2526–2533. doi: 10.1001/jama.2012.5669. [DOI] [PubMed] [Google Scholar]
- 14.Borg E, Kaijser L. A comparison between three rating scales for perceived exertion and two different work tests. Scand J Med Sci Sports. 2006;16(1):57–69. doi: 10.1111/j.1600-0838.2005.00448.x. [DOI] [PubMed] [Google Scholar]
- 15.Speidel V, Conen A, Gisler V, Fux CA, Haubitz S. Lung assessment with point-of-care ultrasound in respiratory Coronavirus disease (COVID-19): a prospective cohort study. Ultrasound Med Biol. 2021;47(4):896–901. doi: 10.1016/j.ultrasmedbio.2020.12.021. [DOI] [PMC free article] [PubMed] [Google Scholar]
- 16.Dargent A, Chatelain E, Kreitmann L, et al. Lung ultrasound score to monitor COVID-19 pneumonia progression in patients with ARDS. PLoS One. 2020;15(7):e0236312. doi: 10.1371/journal.pone.0236312. [DOI] [PMC free article] [PubMed] [Google Scholar]
- 17.Soldati G, Smargiassi A, Inchingolo R, et al. Proposal for international standardization of the use of lung ultrasound for patients With COVID-19: a simple, quantitative. Reproducible Method J Ultrasound Med. 2020;39(7):1413–1419. doi: 10.1002/jum.15285. [DOI] [PMC free article] [PubMed] [Google Scholar]
- 18.Boussuges A, Rives S, Finance J, Brégeon F. Assessment of diaphragmatic function by ultrasonography: current approach and perspectives. WJCC. 2020;8(12):2408–2424. doi: 10.12998/wjcc.v8.i12.2408. [DOI] [PMC free article] [PubMed] [Google Scholar]
- 19.Boussuges A, Gole Y, Blanc P. Diaphragmatic motion studied by M-mode ultrasonography. Chest. 2009;135(2):391–400. doi: 10.1378/chest.08-1541. [DOI] [PubMed] [Google Scholar]
- 20.Muza SR, Silverman MT, Gilmore GC, Hellerstein HK, Kelsen SG. Comparison of scales used to quantitate the sense of effort to breathe in patients with chronic obstructive pulmonary disease. Am Rev Respir Dis. 1990;141(4 Pt 1):909–913. doi: 10.1164/ajrccm/141.4_Pt_1.909. [DOI] [PubMed] [Google Scholar]
- 21.Johnson MJ, Close L, Gillon SC, et al. Use of the modified Borg scale and numerical rating scale to measure chronic breathlessness: a pooled data analysis. Eur Respir J. 2016;47(6):1861–1864. doi: 10.1183/13993003.02089-2015. [DOI] [PubMed] [Google Scholar]
- 22.Mojoli F, Bouhemad B, Mongodi S, Lichtenstein D. Lung ultrasound for critically Ill patients. Am J Respir Crit Care Med. 2019;199(6):701–714. doi: 10.1164/rccm.201802-0236CI. [DOI] [PubMed] [Google Scholar]
- 23.Soldati G, Demi M, Demi L. Ultrasound patterns of pulmonary edema. Ann Transl Med. 2019;7(Suppl 1):S16. doi: 10.21037/atm.2019.01.49. [DOI] [PMC free article] [PubMed] [Google Scholar]
- 24.Hasan AA, Makhlouf HA. B-lines: Transthoracic chest ultrasound signs useful in assessment of interstitial lung diseases. Ann Thorac Med. 2014;9(2):99–103. doi: 10.4103/1817-1737.128856. [DOI] [PMC free article] [PubMed] [Google Scholar]
- 25.Wang Y, Gargani L, Barskova T, Furst DE, Cerinic MM. Usefulness of lung ultrasound B-lines in connective tissue disease-associated interstitial lung disease: a literature review. Arthritis Res Ther. 2017;19(1):206. doi: 10.1186/s13075-017-1409-7. [DOI] [PMC free article] [PubMed] [Google Scholar]
- 26.Kameneva MY, Trofimov V, Tishkov A, Speranskaya A, Dvorakovskaya I, Baranova O. Pattern of diffusion disturbance in patients with interstitial lung diseases (ILDs). In: 9.1 Respiratory Function Technologists/Scientists. European Respiratory Society; 2016:PA4407. doi:10.1183/13993003.congress-2016.PA4407
Associated Data
This section collects any data citations, data availability statements, or supplementary materials included in this article.


