

Abstract
Introduction
Associations between bullying perpetration and social status vary, not only between different facets of social status but also between bullying in primary versus secondary school. The main aim of the present study was to meta‐analyse existing evidence regarding the prospective associations between bullying perpetration and various facets of social status, that is, popularity, peer acceptance, peer rejection, and social preference.
Methods
Electronic databases were searched to identify studies on bullying perpetration and later social status published up to January 17, 2022. Multilevel random effects models were performed using Metafor and differences in effect sizes as a function of substantive and methodological moderators were tested.
Results
In total, 116 effects were included from 18 publications, reporting on 17 different samples and more than 15,000 participants (mean age bullying assessment = 11.57 years, on average 51% female participants). Most samples were from the United States (7) or Europe (7). Overall, bullies were more popular, but also more rejected and scored lower on social preference compared with non‐bullies. These associations remained when effects were adjusted for previous social status and other confounders. No link between bullying perpetration and acceptance was found. There was little evidence that effect sizes differed as a function of moderators.
Conclusions
Bullies become more popular over time, but also have a higher risk of being rejected and being less socially preferred. Bullying perpetrators are more popular but also more rejected by their peers. There is no evidence that these links differ depending on sex or age at which perpetrators bully, reporter or type of bullying.
Keywords: bullying perpetration, meta‐analysis, peer acceptance, peer rejection, popularity, social preference
1. INTRODUCTION
Bullying perpetration is intentionally and repeated negative behavior against a victim who finds it difficult to defend him‐ or herself (Olweus, 1993) and can be physical, relational, verbal, or happen via electronic means. Bullying is often considered to be maladaptive, not only for the victims but can also have negative outcomes for the perpetrators such as later substance use (e.g., Guy et al., 2017; Vrijen et al., 2021). However, bullying one's peers can also have positive correlates. From an evolutionary perspective, bullying has been proposed as a potentially effective way to obtain high social status (e.g., Volk et al., 2015). High social status in the peer group, in turn, is beneficial for access to material and social resources (Volk et al., 2012).
Social status has various facets (Lease et al., 2002) including perceived popularity, peer acceptance and rejection, and social preference. Perceived popularity, “popularity” in the following, refers to being seen as popular and influential and is usually assessed by asking peers whom they see as most and least popular. As such, it is a measure of impact, visibility, and reputation within the peer group (van den Berg et al., 2020). Bullying perpetration can contribute to visibility and admiration (e.g., Salmivalli & Peets, 2008) and bullies are often perceived as cool (e.g., Salmivalli, 2010). Yet, empirical evidence for a positive effect of bullying on popularity is mixed: In some studies, bullying peers was found to be an effective strategy to achieve popularity (e.g., van der Ploeg et al., 2020), while others found no association (Wegge et al., 2016), or came to the opposite conclusion – the latter only for boys (Badaly et al., 2013).
Even if bullying peers is beneficial for obtaining popularity, bullies are often not well‐liked or accepted by peers (e.g., Pouwels et al., 2016) and some bullies are even disliked and rejected (e.g., Orue & Calvete, 2011). Peer acceptance and peer rejection – respectively being liked and being disliked – represent affection and belongingness (Sentse et al., 2015), and as such indicate preferences in the peer group (van den Berg et al., 2020). Social preference reflects the relative extent to which children are being liked and disliked by their peers, that is, includes both concepts. Social preference is usually assessed by measuring the difference between nominations for being liked and being disliked (van den Berg et al., 2020). Evidence for the association between bullying perpetration and acceptance is mixed: Whereas some studies found that bullies were less‐liked compared to their non‐bullying peers (e.g., Sentse et al., 2015), others found no association (e.g., Orue & Calvete, 2011), or reported that bullies were actually both disliked and accepted by their peers (e.g., de Vries et al., 2021). The association between bullying perpetration and rejection is also not universal: Some found that bullies were only rejected by those peers by whom they were seen as a threat, such that boys who bullied girls were only rejected by other girls (Veenstra et al., 2010), while others found no association (e.g., Sentse et al., 2015).
To date, no meta‐analysis exists on bullying perpetration and social status. A recent meta‐analysis on concurrent associations between relational aggression and several facets of social status reported that relational aggression was positively correlated with popularity and rejection, but not with acceptance (Casper et al., 2020). The findings of this meta‐analysis cannot be directly applied to bullying behavior, because some conceptualizations of peer aggression do not meet the definitional criteria of bullying as proposed by Olweus (1993) and, as such, bullying is often seen as an unique peer phenomenon (Volk et al., 2017). However, the findings by Casper and colleagues (2020) suggest that aggressive behavior in the peer context is differentially associated with different facets of social status. Here, we meta‐analyse specifically the literature on bullying perpetration and social status to arrive at a more systematic understanding of the heterogeneity of effects and possible origins thereof.
Such a review is particularly timely as several longitudinal studies are now available on links between bullying perpetration and social status. If we know the long‐term effects of bullying perpetration on social status, we understand better whether this behavior “only” affects group dynamics temporarily or whether bullying perpetration is linked to the bully's reputation more broadly and enduringly. By examining longitudinal associations, while controlling for baseline social status, we shed light whether engaging in bullying perpetration changes social status, for instance increases popularity. This is especially important given the assumption that bullying perpetration is an effective long‐term strategy to reach one's status goals by applying aggression without punishments in return (e.g., Volk et al., 2012).
1.1. Which moderators affect associations between bullying perpetration and social status?
There are theoretical reasons to consider a range of moderators that affect the strength and direction of the associations between bullying perpetration and social status outcomes. To start, status outcomes could vary based on the educational context in which the bullying takes place. In primary education, children tend to be more conscious about their likeability within the peer group compared to their popularity (e.g., van den Berg et al., 2014), whereas in secondary education the importance of visibility and admiration increases (e.g., Salmivalli, 2010) and being popular might be prioritized over being liked (e.g., van den Berg et al., 2014). Bullying peers to obtain a high social status requires a combination of social‐emotional skills such as emotional control and social manipulation (e.g., Ferguson & Ryan, 2019). These skills develop over time which suggests that perpetrators in secondary education might be more capable of effectively bullying their peers to gain popularity compared to perpetrators in primary education.
It is also possible that associations between bullying perpetration and social status differ between ‘pure’ bullies and bully‐victims, the latter referring to those who bully others and are being victimized at the same time. Bully‐victims represent a high‐risk group, as they are the most disliked among their peers (Schwartz, 2000), regarded as more impulsive, and show more reactive aggression compared to ‘pure’ bullies. Bully‐victims are less socially skilled and might therefore not be successful in acquiring popularity through bullying (Guy et al., 2017). Whereas the popularity of ‘pure’ bullies might help them avoid the negative consequences of their behavior (e.g., Wolke et al., 2013), bully‐victims likely do not have this high social standing that might benefit them. Indeed, some studies show that compared to ‘pure’ bullies, bully‐victims are likely more rejected and less accepted (e.g., Veenstra et al., 2005) and less popular (Guy et al., 2019). Bully‐victims are less well‐adjusted than ‘pure’ bullies over time (e.g., Veenstra et al., 2005), as they might face both the negative consequences of being victimized and being a perpetrator. In short, different forms of bullying ‐ isolated versus in conjunction with victimization ‐ likely relate differently to social status.
The link between bullying perpetration and social status might also differ for boys and girls. Boys might be more motivated to bully for popularity than girls (Caravita & Cillessen, 2012), whereas girls might strive for being liked and accepted by the group more than boys do and therefore refrain from bullying others (Sandstrom & Cillessen, 2006).
Specific types of bullying perpetration might also affect social status. Indirect forms of bullying, such as repeatedly spreading rumors, seem to be more strongly associated with popularity than direct forms of bullying, such as hitting (Prinstein & Cillessen, 2003). Direct forms of bullying are also associated with lower social preference, while no association was found between indirect forms of bullying and social preference (Prinstein & Cillessen, 2003).
Further moderators could also affect the strength and direction of the associations between bullying perpetration and social status, but are in the present study tested more in exploratory fashion. First, year of publication might moderate the association between bullying perpetration and social status. Bullying has gained a lot of attention over the last decade both within the educational context and within the research context (Volk et al., 2017). It is possible that peers and teachers now better understand and adequately assess bullying perpetration due to its increased attention. Outcomes of bullying perpetration and social status might also differ depending on whether bullying is self‐ or other‐reported because different reporters tend to identify different types of bullies (Casper et al., 2015). The link between bullying perpetration and social status might also differ for short‐ and long‐term effects. Short‐term effects are expected to be stronger than long‐term effects, i.e., stronger effects for studies with a short time period between the bullying perpetration and social status assessments compared to studies with a long time period between the assessments. Effects are potentially also different for studies with a low likelihood of bias compared to studies with high likelihood of bias. Various factors might thus influence the strength and directions of associations and need therefore to be considered as potential moderators.
1.2. Current study
The number of longitudinal studies on the association between bullying perpetration and social status has substantially increased in recent years, which makes a meta‐analysis on this literature a timely and relevant endeavor. A recent meta‐analysis on relational aggression suggests that aggressive behavior in the peer context is correlated with social status in different ways (Casper et al., 2020). Yet, to date no systematic review or meta‐analysis has been performed on longitudinal links between bullying perpetration and various facets of social status. We sought to contribute to the bullying research field by specifically focusing on longitudinal associations between bullying perpetration and social status and by including various forms of peer bullying perpetration. We focussed on studies in which social status outcomes were assessed from peers and/or teachers, but excluded studies that were purely based on self‐perceptions of status. The reason for this is that social status is a reputation measure in the peer context – thus can most validly be reported by peers (e.g., Huitsing et al., 2012). Teachers’ perspectives are broad and might capture group dynamics holistically, which is why their reports might explain unique variance (Ladd & Kochenderfer‐Ladd, 2002). We tested whether associations varied by substantive (e.g., primary vs. secondary school, sex, reporter and type of bullying) and methodological (e.g., time lag between assessments of bullying and status) moderators.
2. METHODS
2.1. Background and larger project
The current study is part of a larger project investigating the consequences of bullying perpetration in childhood and adolescence on mental health, somatic health, academic functioning, and social functioning. This project started in 2019 with a large search and screening that serves as the basis for multiple meta‐analyses. The larger project has been preregistered on the Open Science Framework (https://osf.io/tu5vd/) and PROSPERO (https://www.crd.york.ac.uk/prospero/; identifier CRD42019127712). Details on the initial search and screening process have been reported elsewhere (Vrijen et al., 2021). Briefly, the initial search resulted in 1,934 articles on outcomes of bullying perpetration. Of those, 120 studies were initially included in the current meta‐analysis given their relevance in terms of outcomes after title, abstract, and full‐text screening. For the current study on bullying perpetration and social status, these 120 studies on social functioning were screened again with the inclusion and exclusion criteria as specified below in mind. The initial search was expanded with an updated search. Search terms are detailed in Supplemental Material A. The first author searched the electronic databases PsycINFO, Web of Science, Medline, ERIC, and SocINDEX to identify studies published up to January 17, 2022. The current study was preregistered with PROSPERO (https://www.crd.york.ac.uk/prospero/; identifier CRD42021231218) and on OSF (https://osf.io/z9hf4/; also for deviations from the preregistration).
2.2. Inclusion and exclusion criteria
We included studies if they specifically focused on ‘pure’ bullies or bully‐victims and social status outcomes. Studies that assessed other types of bullying perpetration, such as workplace bullying or sibling bullying, or bullying directed at a specific target group, e.g., homophobic bullying, were excluded. Eligible studies had to use the term “bullying” or “bullying‐victimization” to describe their concept of interest. This meant that we also included studies that used the Crick and Grotpeter (1996) scales which originally, and in other studies, refer to relational and overt peer aggression, a somewhat different concept than bullying perpetration. Only studies in which bullying perpetration was assessed during childhood or adolescence (before age 18) in the general ‐ non‐clinical ‐ population were included. We did not exclude studies a priori based on the reporter of the bullying behavior, meaning that we included studies in which bullying assessments were based on peer nominations or teacher‐reports, but also on self‐reports or observations. Studies with samples that exclusively consisted of bullies were excluded, as were intervention studies that did not report results separately for the control group.
Only longitudinal studies in which social status was assessed at a later point than bullying perpetration were included in the present study, regardless of the time lag between assessments. Social status outcomes, i.e., popularity, acceptance, rejection, and social preference, had to be measured by means of peer‐ or teacher‐assessments. Additionally, studies had to be original empirical work, written in English, peer‐reviewed articles or PhD dissertations, available in a full‐text version, and contain sufficient methodological information to compute effect sizes on the level of the individuals. In case of unavailability of full texts or insufficient information, authors were asked to provide the full text or additional information, with a reminder sent 2 weeks later.
2.3. Eligibility assessment
All records were assessed for eligibility independently by two authors. The first author assessed all studies and three co‐authors were each randomly assigned 33.3% of the studies. Interrater reliabilities for title and abstract screening were 80%–89% and for the full‐text screening 78%‐88%. During the screening, the authors independently selected the primary reason for exclusion. Disagreements between authors were resolved by discussion.
The search and selection process is presented in Figure 1. From the larger project, 120 studies were included in the full‐text screening (Figure 1; Part A); from the expanded search, 45 additional publications were included in the full‐text screening (Figure 1; Part B). In total, we screened 165 full texts publications. After the full text screening, 19 publications were eligible for inclusion. One study (Scholte et al., 2007) was ultimately excluded from the meta‐analysis because categorical outcome measures were used in this study, which were incomparable with the continuous outcome measures of the other eligible studies, resulting in a total of 18 included publications. A reference check of the 18 included studies revealed no new studies that were in line with our predefined inclusion criteria and original search.
Figure 1.
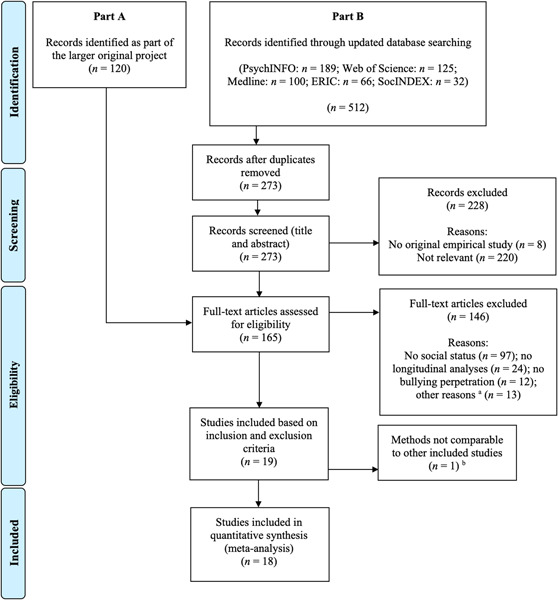
Flow diagram of included and excluded studies. aOther reasons for exclusion included the following: social status not assessed by means of peer‐ or teacher‐reports (n = 3); social status as predictor (n = 3); duplicates discovered during full‐text screening (n = 2); unavailability of full‐text or unavailability of necessary additional information (n = 2); no control group or comparison with uninvolved children (n = 2); bullying perpetration as covariate and no information about outcomes of bullying itself (n = 1). bIn this study, categorical outcome measures were used, which were incomparable with the continuous outcome measures of the other eligible studies. [Color figure can be viewed at wileyonlinelibrary.com]
2.4. Data extraction and risk of bias assessment
The first author performed the data extraction and quality assessments, based on a detailed manual. For each included effect, a quality assessment was performed using an adapted version of the Newcastle Ottawa Scale (Wells et al., 2011). See the manual for more detail (https://osf.io/z9hf4/). The maximum score for the adapted Newcastle Ottawa Scale was 10, with higher scores representing less bias. One of the co‐authors checked the data extraction and quality assessment for each included study and disagreements were resolved by discussion.
2.5. Analyses
2.5.1. Effect sizes
Studies reported correlations or standardized estimates, which we converted to Fisher's Z correlations using R package Metafor version 3.1‐36 (Viechtbauer, 2010). Standardized estimates (β) from multivariate analyses were first transformed to correlations using the following formula: , where = 0 for a negative β and = 1 for a nonnegative β as recommended by Peterson and Brown (2005) and in line with other recent meta‐analyses (e.g., Compas et al., 2017). The resulting correlations were subsequently transformed to Fisher's Z. Raw and transformed estimates can be found in the data extraction file (https://osf.io/zbqa5/) and R scripts are available on OSF (https://osf.io/xfuap/).
2.5.2. Main analyses
We computed multilevel random effects models, because studies commonly reported multiple effects, for instance results based on different operationalizations of bullying perpetration (e.g., Gower et al., 2014). Traditional univariate meta‐analytic methods assume independence of effect sizes and therefore often select only one effect per study or sample, which leads to loss of information (e.g., van den Noortgate et al., 2013). We used three‐level multilevel random effects models, accounting for sampling variance at level 1, within‐sample variance at level 2, and between‐sample variance at level 3. This allowed us to include multiple effects from the same sample by modeling the dependence between effects from the same sample (Assink & Wibbelink, 2016).
Meta‐analyses were performed with R package Metafor version 3.1‐36 (Viechtbauer, 2010), R version 4.0.2 (R Core Team, 2013), RStudio version 1.3.1093 (RStudio Team, 2015). We estimated separate models for the different social status outcomes, i.e., popularity, acceptance, rejection, and social preference, as well as for effects unadjusted for possible confounders and effects adjusted for possible confounders such as age and gender. For each model, forest plots and heterogeneity indices Q and I 2 are reported.
2.5.3. Moderator analyses
Multiple moderator analyses, based on substantive reasoning, were performed subsequently to calculating the overall effect size. We tested educational context of bullying perpetration (primary vs. secondary school), excluding effects for which bullying perpetration was assessed in kindergarten (n = 2 in analyses with acceptance and rejection as outcome). Additionally, we tested sex ratio in the sample, and the type of bullying (direct vs. indirect). Direct bullying perpetration included bullying forms such as hitting and kicking, whereas indirect bullying perpetration included bullying forms such as spreading rumors or excluding peers from the group. We excluded effects that did not specify whether bullying was indirect or direct from this moderator analysis (n = 11 effects in analyses with popularity as outcome, n = 9 effects in analyses with acceptance as outcome, n = 8 effects in analyses with rejection as outcome). We performed an extra moderator analysis based on the developmental period of bullying perpetration, for which we tested the difference between childhood (age ≤ 9) and early adolescence (age 10‐13), and the difference between early adolescence (age 10–13) and mid‐late adolescence (age ≥ 14) in two separate analyses. Originally, we planned to perform a moderator analysis for type of bully (‘pure’ bully vs. bully‐victim) but this was not feasible because none of the included studies reported estimates for bully‐victims.
The following moderators were also performed subsequently to calculating the overall effect size, but these were tested more in exploratory fashion: year of publication, self‐reported bullying perpetration versus others’ reports, short‐term versus long‐term effects (<1 year vs. ≥1 year) between bullying assessment and social status assessment, and study bias (sum score of the adapted Newcastle Ottawa Scale).
As recommended (Assink & Wibbelink, 2016), we only performed moderator analyses for adjusted effects models, including outliers, on the basis of at least 10 effects and with sufficient within‐sample and between‐sample heterogeneity, that is, if <75% of the total amount of the variance could be attributed to sampling variance (Hunter & Schmidt, 2004). Performing moderator analyses is meaningful only if there is substantial variation between effect sizes. Additionally, we only performed moderator analyses with categorical moderators if there was a sufficient number of effects per category. That is, we did not perform moderation analyses if only one or two effects exist for a specific category. Not only would the variance and therefore the power be very low in these cases, but the moderation effect would also be biased by a very small number of effects. We only reported results of moderation analyses that were based on at least three effects per category because these results are likely more meaningful than those based on fewer effects per category.
2.5.4. Sensitivity analyses and publication and reporting bias
To check for extreme outliers, we computed standardized Z values with Z values more extreme than −3.29 or 3.29 being considered an outlier (Tabachnick et al., 2019). Influential outliers were identified by computing Cook's distances. For models including outliers, we performed sensitivity analyses without these outliers. Additionally, for adjusted effects models including outliers, we repeated meta‐analyses with the inclusion of null‐effects to see how this would influence the results. These null‐effects were nonsignificant effects for which estimates were not reported in the publication and were also not provided on request. We took a conservative approach by adding a correlation of zero for each of these nonsignificant effects.
To assess the likelihood of publication and reporting bias, we performed Egger tests for funnel plot asymmetry if for each model at least 10 effects were available, following Cochrane recommendations (Higgins & Thomas, 2020).
3. RESULTS
3.1. Description of the included studies
In total, 116 effects from 18 publications were included, published between 1999 and 2021, reporting on 17 samples (k) and a total of 15,274 participants (Table 1). Most of the samples (k = 14) were from European or North American countries: seven from the United States, two from Finland, one from Belgium, one from Italy, one from the Netherlands, one from Spain, and one from the United Kingdom. Other samples (k = 3) were based in Chile, China, and Taiwan. The majority of the samples were population‐based (k = 16); and one was a high‐risk sample (Pouwels & Cillesen, 2013). All samples included both male and female participants with, on average, 51% female participants.
Table 1.
Description of included effects
| Effect no. | Study | Year | Country | N | % Girls | BP assessment | Age at BP | Status assessment | Age at status | Time between BP and statusa | Reported r or β b |
|---|---|---|---|---|---|---|---|---|---|---|---|
| Unadjusted effect popularity | |||||||||||
| 1 | Wegge et al. | 2016 | Belgium | 154 | 55 | PR | 13 | PR | 13 | 8 | 0.18 |
| 2 | Wegge et al. | 2016 | Belgium | 154 | 55 | PR | 13 | PR | 13 | 8 | 0.26 |
| 3 | Sentse et al. | 2015 | Finland | 1,007 | 0 | PR | 11 | PR | 11 | 7 | 0.20 |
| 4 | Sentse et al. | 2015 | Finland | 1044 | 100 | PR | 11 | PR | 11 | 7 | 0.09 |
| 5 | Sentse et al. | 2014 | Finland | 3,586 | 51 | PR | 13 | PR | 14 | 7 | 0.26 |
| 6 | Prinstein & Cillessen | 2003 | United States | 159 | 61 | PR | 16 | PR | 17 | 17 | 0.54 |
| 7 | Prinstein & Cillessen | 2003 | United States | 159 | 61 | PR | 16 | PR | 17 | 17 | 0.39 |
| 8 | Prinstein & Cillessen | 2003 | United States | 159 | 61 | PR | 16 | PR | 17 | 17 | 0.18 |
| 9 | Pozzoli & Gini | 2021 | Italy | 432 | 52 | PR | 11 | PR | 12 | 11.5 | 0.38 |
| 10 | Berger & Caravita | 2016 | Chile | 510 | 0 | SR | 11 | PR | 12 | 6 | 0.22 |
| 11 | Berger & Caravita | 2016 | Chile | 468 | 100 | SR | 11 | PR | 12 | 6 | 0.14 |
| 12 | Badaly et al. | 2013 | United States | 415 | 53 | PR | 14 | PR | 15 | 12 | 0.37 |
| 13 | Badaly et al. | 2013 | United States | 415 | 53 | PR | 14 | PR | 15 | 12 | 0.43 |
| 14 | Badaly et al. | 2013 | United States | 415 | 53 | PR | 14 | PR | 15 | 12 | 0.37 |
| 15 | Tseng et al. | 2013 | Taiwan | 198 | 47 | PR | 10 | PR | 11 | 12 | −0.17 |
| 16 | Tseng et al. | 2013 | Taiwan | 198 | 47 | PR | 10 | PR | 11 | 12 | −0.21 |
| Unadjusted effect acceptance | |||||||||||
| 17 | Wegge et al. | 2016 | Belgium | 154 | 55 | PR | 13 | PR | 13 | 8 | 0.06 |
| 18 | Wegge et al. | 2016 | Belgium | 154 | 55 | PR | 13 | PR | 13 | 8 | 0.10 |
| 19 | Orue & Calvete | 2011 | Spain | 777 | 47 | PR | 9 | PR | 10 | 6 | −0.18 |
| 20 | Orue & Calvete | 2011 | Spain | 777 | 47 | PR | 9 | PR | 10 | 6 | −0.21 |
| 21 | Sentse et al. | 2014 | Finland | 3586 | 51 | PR | 13 | PR | 14 | 7 | −0.04 |
| 22 | Sentse et al. | 2015 | Finland | 1,007 | 0 | PR | 11 | PR | 11 | 7 | −0.06 |
| 23 | Sentse et al. | 2015 | Finland | 1,044 | 100 | PR | 11 | PR | 11 | 7 | −0.13 |
| 24 | Troop‐Gordon & Kopp | 2011 | United States | 410 | 53 | PR | 10 | PR | 10 | 6 | −0.23 |
| 25 | Troop‐Gordon & Kopp | 2011 | United States | 410 | 53 | PR | 10 | PR | 10 | 6 | −0.28 |
| 26 | Gower et al. | 2014 | United States | 190 | 48 | TR & Obs. | 4 | TR | 6 | 12 | −0.18 |
| 27 | Gower et al. | 2014 | United States | 190 | 48 | TR & Obs. | 4 | TR | 6 | 12 | 0.02 |
| 28 | Badaly et al. | 2013 | United States | 415 | 53 | PR | 14 | PR | 15 | 12 | 0.20 |
| 29 | Badaly et al. | 2013 | United States | 415 | 53 | PR | 14 | PR | 15 | 12 | 0.30 |
| 30 | Badaly et al. | 2013 | United States | 415 | 53 | PR | 14 | PR | 15 | 12 | 0.19 |
| 31 | Tseng et al. | 2013 | Taiwan | 198 | 47 | PR | 10 | PR | 11 | 12 | −0.29 |
| 32 | Tseng et al. | 2013 | Taiwan | 198 | 47 | PR | 10 | PR | 11 | 12 | −0.33 |
| Unadjusted effect rejection | |||||||||||
| 33 | Orue & Calvete | 2011 | Spain | 777 | 47 | PR | 9 | PR | 10 | 6 | 0.54 |
| 34 | Orue & Calvete | 2011 | Spain | 777 | 47 | PR | 9 | PR | 10 | 6 | 0.43 |
| 35 | Wang et al. | 2014 | China | 1,058 | 53 | PR | 9 | PR | 12 | 36 | 0.47 |
| 36 | Sentse et al. | 2015 | Finland | 1,044 | 100 | PR | 11 | PR | 11 | 7 | 0.29 |
| 37 | Sentse et al. | 2015 | Finland | 1,007 | 0 | PR | 11 | PR | 11 | 7 | 0.38 |
| 38 | Godleski et al. | 2015 | United States | 82 | 43 | Obs. | 3 | TR | 4 | 3.5 | 0.23 |
| 39 | Godleski et al. | 2015 | United States | 82 | 43 | Obs. | 3 | TR | 4 | 3.5 | 0.22 |
| 40 | Tseng et al. | 2013 | Taiwan | 198 | 47 | PR | 10 | PR | 11 | 12 | 0.55 |
| 41 | Tseng et al. | 2013 | Taiwan | 198 | 47 | PR | 10 | PR | 11 | 12 | 0.47 |
| 42 | Kochel et al. | 2012 | United States | 2,076 | 51 | PR | 10 | PR | 10 | 6 | 0.38 |
| Unadjusted effect social preference | |||||||||||
| 43 | Orue & Calvete | 2011 | Spain | 777 | 47 | PR | 9 | PR | 10 | 6 | −0.36 |
| 44 | Orue & Calvete | 2011 | Spain | 777 | 47 | PR | 9 | PR | 10 | 6 | −0.44 |
| 45 | Prinstein & Cillessen | 2003 | United States | 159 | 61 | PR | 16 | PR | 17 | 17 | 0.13 |
| 46 | Prinstein & Cillessen | 2003 | United States | 159 | 61 | PR | 16 | PR | 17 | 17 | −0.01 |
| 47 | Prinstein & Cillessen | 2003 | United States | 159 | 61 | PR | 16 | PR | 17 | 17 | −0.13 |
| 48 | Pozzoli & Gini | 2021 | Italy | 432 | 52 | PR | 11 | PR | 12 | 11.5 | −0.25 |
| 49 | Pouwels & Cillessen | 2013 | United States | 106 | 50 | PR | 6 | PR | 8 | 24 | −0.25 |
| 50 | Boulton | 1999 | United Kingdom | 44 | 0 | PR | 9 | PR | 9 | 6 | −0.37 |
| 51 | Boulton | 1999 | United Kingdom | 45 | 100 | PR | 9 | PR | 9 | 6 | −0.59 |
| Adjusted effect popularity | |||||||||||
| 52 | Wegge et al. | 2016 | Belgium | 154 | 55 | PR | 13 | PR | 13 | 8 | −0.05 |
| 53 | Wegge et al. | 2016 | Belgium | 154 | 55 | PR | 13 | PR | 13 | 8 | 0.10 |
| 54 | Sentse et al. | 2015 | Finland | 1,942 | 100 | SR | 11 | PR | 11 | 7 | 0.04 |
| 55 | Sentse et al. | 2015 | Finland | 1,962 | 0 | SR | 11 | PR | 11 | 7 | −0.04 |
| 56 | Sentse et al. | 2015 | Finland | 1,942 | 100 | SR | 11 | PR | 12 | 5 | 0.01 |
| 57 | Sentse et al. | 2015 | Finland | 1,962 | 0 | SR | 11 | PR | 12 | 5 | −0.05 |
| 58 | Sentse et al. | 2015 | Finland | 2,300 | 100 | SR | 14 | PR | 14 | 7 | 0.00 |
| 59 | Sentse et al. | 2015 | Finland | 2,192 | 0 | SR | 14 | PR | 14 | 7 | 0.02 |
| 60 | Sentse et al. | 2015 | Finland | 2,300 | 100 | SR | 14 | PR | 15 | 5 | 0.00 |
| 61 | Sentse et al. | 2015 | Finland | 2,192 | 0 | SR | 14 | PR | 15 | 5 | 0.02 |
| 62 | van der Ploeg et al. | 2020 | The Netherlands | 2,055 | 50 | PR | 9 | PR | 10 | 5.5 | 0.09 |
| 63 | Pozzoli & Gini | 2021 | Italy | 432 | 52 | PR | 11 | PR | 12 | 11.5 | 0.06 |
| 64 | Badaly et al. | 2013 | United States | 193 | 0 | PR | 14 | PR | 15 | 12 | −0.09 |
| 65 | Badaly et al. | 2013 | United States | 222 | 100 | PR | 14 | PR | 15 | 12 | 0.10 |
| 66 | Tseng et al. | 2013 | Taiwan | 198 | 47 | PR | 10 | PR | 10 | 6 | −0.13 |
| 67 | Tseng et al. | 2013 | Taiwan | 198 | 47 | PR | 10 | PR | 11 | 6 | −0.02 |
| 68 | Tseng et al. | 2013 | Taiwan | 198 | 47 | PR | 10 | PR | 10 | 6 | 0.03 |
| 69 | Tseng et al. | 2013 | Taiwan | 198 | 47 | PR | 10 | PR | 11 | 6 | 0.02 |
| Adjusted effect acceptance | |||||||||||
| 70 | Wegge et al. | 2016 | Belgium | 154 | 55 | PR | 13 | PR | 13 | 8 | 0.02 |
| 71 | Wegge et al. | 2016 | Belgium | 154 | 55 | PR | 13 | PR | 13 | 8 | −0.08 |
| 72 | Orue & Calvete | 2011 | Spain | 411 | 0 | PR | 9 | PR | 10 | 6 | −0.16 |
| 73 | Orue & Calvete | 2011 | Spain | 366 | 100 | PR | 9 | PR | 10 | 6 | 0.01 |
| 74 | Orue & Calvete | 2011 | Spain | 411 | 0 | PR | 9 | PR | 10 | 6 | 0.02 |
| 75 | Orue & Calvete | 2011 | Spain | 366 | 100 | PR | 9 | PR | 10 | 6 | −0.05 |
| 76 | Sentse et al. | 2015 | Finland | 1,942 | 100 | SR | 11 | PR | 11 | 7 | 0.02 |
| 77 | Sentse et al. | 2015 | Finland | 1,962 | 0 | SR | 11 | PR | 11 | 7 | −0.03 |
| 78 | Sentse et al. | 2015 | Finland | 1,942 | 100 | SR | 11 | PR | 12 | 5 | −0.02 |
| 79 | Sentse et al. | 2015 | Finland | 1,962 | 0 | SR | 11 | PR | 12 | 5 | −0.06 |
| 80 | Sentse et al. | 2015 | Finland | 2,300 | 100 | SR | 14 | PR | 14 | 7 | 0.02 |
| 81 | Sentse et al. | 2015 | Finland | 2,192 | 0 | SR | 14 | PR | 14 | 7 | 0.01 |
| 82 | Sentse et al. | 2015 | Finland | 2300 | 100 | SR | 14 | PR | 15 | 5 | −0.01 |
| 83 | Sentse et al. | 2015 | Finland | 2,192 | 0 | SR | 14 | PR | 15 | 5 | 0.02 |
| 84 | Gower et al. | 2014 | United States | 190 | 48 | TR & Obs. | 4 | TR | 6 | 12 | 0.20 |
| 85 | Gower et al. | 2014 | United States | 190 | 48 | TR & Obs. | 4 | TR | 6 | 12 | −0.22 |
| 86 | Badaly et al. | 2013 | United States | 193 | 0 | PR | 14 | PR | 15 | 12 | −0.08 |
| 87 | Badaly et al. | 2013 | United States | 222 | 100 | PR | 14 | PR | 15 | 12 | −0.04 |
| 88 | Tseng et al. | 2013 | Taiwan | 198 | 47 | PR | 10 | PR | 10 | 6 | −0.10 |
| 89 | Tseng et al. | 2013 | Taiwan | 198 | 47 | PR | 10 | PR | 11 | 6 | −0.08 |
| 90 | Tseng et al. | 2013 | Taiwan | 198 | 47 | PR | 10 | PR | 10 | 6 | −0.08 |
| 91 | Tseng et al. | 2013 | Taiwan | 198 | 47 | PR | 10 | PR | 11 | 6 | −0.01 |
| Adjusted effect rejection | |||||||||||
| 92 | Orue & Calvete | 2011 | Spain | 411 | 0 | PR | 9 | PR | 10 | 6 | 0.17 |
| 93 | Orue & Calvete | 2011 | Spain | 366 | 100 | PR | 9 | PR | 10 | 6 | 0.19 |
| 94 | Orue & Calvete | 2011 | Spain | 411 | 0 | PR | 9 | PR | 10 | 6 | 0.02 |
| 95 | Orue & Calvete | 2011 | Spain | 366 | 100 | PR | 9 | PR | 10 | 6 | 0.05 |
| 96 | Sentse et al. | 2015 | Finland | 1,942 | 100 | SR | 11 | PR | 11 | 7 | 0.00 |
| 97 | Sentse et al. | 2015 | Finland | 1,962 | 0 | SR | 11 | PR | 11 | 7 | −0.01 |
| 98 | Sentse et al. | 2015 | Finland | 1,942 | 100 | SR | 11 | PR | 12 | 5 | −0.03 |
| 99 | Sentse et al. | 2015 | Finland | 1,962 | 0 | SR | 11 | PR | 12 | 5 | 0.00 |
| 100 | Sentse et al. | 2015 | Finland | 2,300 | 100 | SR | 14 | PR | 14 | 7 | −0.02 |
| 101 | Sentse et al. | 2015 | Finland | 2,192 | 0 | SR | 14 | PR | 14 | 7 | 0.04 |
| 102 | Sentse et al. | 2015 | Finland | 2,300 | 100 | SR | 14 | PR | 15 | 5 | 0.02 |
| 103 | Sentse et al. | 2015 | Finland | 2,192 | 0 | SR | 14 | PR | 15 | 5 | 0.02 |
| 104 | Godleski et al. | 2015 | United States | 97 | 43 | Obs. | 3 | TR | 4 | 3.5 | 0.26 |
| 105 | Godleski et al. | 2015 | United States | 97 | 43 | Obs. | 3 | TR | 4 | 3.5 | 0.12 |
| 106 | Tseng et al. | 2013 | Taiwan | 198 | 47 | PR | 10 | PR | 10 | 6 | 0.17 |
| 107 | Tseng et al. | 2013 | Taiwan | 198 | 47 | PR | 10 | PR | 11 | 6 | −0.06 |
| 108 | Tseng et al. | 2013 | Taiwan | 198 | 47 | PR | 10 | PR | 10 | 6 | −0.11 |
| 109 | Tseng et al. | 2013 | Taiwan | 198 | 47 | PR | 10 | PR | 11 | 6 | 0.10 |
| Adjusted effect social preference | |||||||||||
| 110 | Orue & Calvete | 2011 | Spain | 411 | 0 | PR | 9 | PR | 10 | 6 | −0.10 |
| 111 | Orue & Calvete | 2011 | Spain | 366 | 100 | PR | 9 | PR | 10 | 6 | −0.08 |
| 112 | Orue & Calvete | 2011 | Spain | 411 | 0 | PR | 9 | PR | 10 | 6 | −0.03 |
| 113 | Orue & Calvete | 2011 | Spain | 366 | 100 | PR | 9 | PR | 10 | 6 | −0.02 |
| 114 | Prinstein & Cillessen | 2003 | United States | 159 | 61 | PR | 16 | PR | 17 | 17 | −0.04 |
| 115 | Prinstein & Cillessen | 2003 | United States | 159 | 61 | PR | 16 | PR | 17 | 17 | −0.05 |
| 116 | Prinstein & Cillessen | 2003 | United States | 159 | 61 | PR | 16 | PR | 17 | 17 | −0.15 |
Abbreviations: BP, bullying perpetration; Obs., observations; PR, peer report; SR, self‐report; TR, teacher report.
Time in months.
R for the reported unadjusted effect sizes and β for the reported adjusted effect sizes.
All effect sizes included in the present meta‐analysis reflected on the association between bullying perpetration and later social status. We found no studies that included later social status outcomes of the combined bullying‐victimization profile. The reported effects were mainly based on peer reported bullying (n = 82 [70.69%]), followed by self‐reported bullying (n = 26 [22.41%]), and observations (n = 4 [3.45%]). Four effects (3.45%) were based on combined teacher reported bullying and observations. With regard to social status, most effects concerned acceptance (n = 38 [32.76%]), followed by popularity (n = 34 [29.31%]), rejection (n = 28 [24.14%]), and social preference (n = 16 [13.79%]). Those effects were mostly based on peer reports (n = 108 [93.10%]); 8 effects (6.90%) concerned teacher reported social status. Most included effects for bullying perpetration were assessed in primary school (n = 56 [48.28%], mean age = 10.35, whereas most included effects for social status were assessed in secondary school (n = 71 [61.21%], mean age = 14.89). The time between the bullying and social status assessment was, on average, 8.65 months, ranging from 3 to 36 months. Most of the included effects (n = 65 [56.03%]) were adjusted for likely cofounders and 51 effects (43.97%) were unadjusted. Adjusted effects were always adjusted for previous/baseline social status, and frequently for age and sex. The risk of bias of the included effects was generally low. The mean sum score, based on the adapted bias assessment tool, was 7.37 (ranging between 4 and 9), with lower scores indicating higher risk for bias.
3.2. Longitudinal associations between bullying perpetration and social status
Bullying perpetration in childhood and adolescence was positively associated with later popularity, that is, bullies were more popular later on (Table 2, Figure 2). This positive association decreased by approximately 75% but remained statistically significant in the adjusted effects model (Figure 3). No significant associations were found between bullying perpetration and later peer acceptance, neither in unadjusted analyses (Figure 4), nor in adjusted analyses (Figure 5). Bullying perpetration was associated with peer rejection, that is, bullies were more rejected by peers later on (Figure 6). This association remained significant in the adjusted effects model, but the effect size decreased by approximately 75% (Figure 7). Lastly, bullying perpetration was negatively associated with later social preference, that is, higher levels of bullying predicted lower levels of social preference (Figure 8). This association decreased by approximately 75%, but remained statistically significant in the adjusted effects model (Figure 9).
Table 2.
Effects of child and adolescence bullying perpetration on later social status
| Model | Effect | Effect after removal of influential outliers | ||||||||
|---|---|---|---|---|---|---|---|---|---|---|
| Outcome | Adjusted or unadjusted effects | n Samples/publications | n Effects/total no. participantsa | Fisher's Z | 95% CI | p | Outliersb | Fisher's Z | 95% CI | p |
| Popularity | Unadjusted | 8/8 | 16/7,973 | 0.23 | 0.09–0.37 | .001 | ||||
| Adjustedc | 7/6 | 18/11,650 | 0.04 | 0.01–0.08 | .009 | 57 | 0.05 | 0.02, 0.09 | <.001 | |
| Acceptance | Unadjusted | 8/8 | 16/7,781 | −0.09 | −0.23 0.06 | .236 | ||||
| Adjusted | 7/6 | 22/10,130 | −0.01 | −0.05 to 0.03 | .580 | 84; 85 | −0.01 | −0.06, 0.03 | .499 | |
| Rejection | Unadjusted | 6/6 | 10/6,242 | 0.44 | 0.34–0.53 | <.001 | ||||
| Adjusted | 5/4 | 18/9,468 | 0.09 | 0.02–0.16 | .012 | |||||
| Social Preference | Unadjusted | 5/5 | 9/1,563 | −0.29 | −0.47 to −0.10 | .002 | ||||
| Adjustedd | 2/2 | 7/936 | −0.06 | −0.11 to −0.02 | .005 | |||||
Note: Values in bold are statistically significant.
For each specific social status outcome, participants were counted only once per sample (if multiple effects based on the same sample were included, only the largest n was used).
Effect numbers of the outliers.
Effects remained highly similar after including 3 null‐effects as part of the sensitivity analyses; Fisher's Z = 0.04; 95% confidence interval (CI) = 0.01, 0.07; p = .009.
Effects remained highly similar after including 1 null‐effect as part of the sensitivity analyses; Fisher's Z = −0.05; 95% CI = −0.09, −0.01; p = .010.
Figure 2.
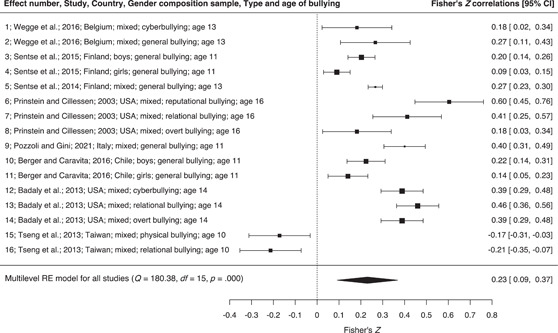
Forest plot unadjusted effect of bullying perpetration in childhood and adolescence on later popularity. CI, confidence interval.
Figure 3.
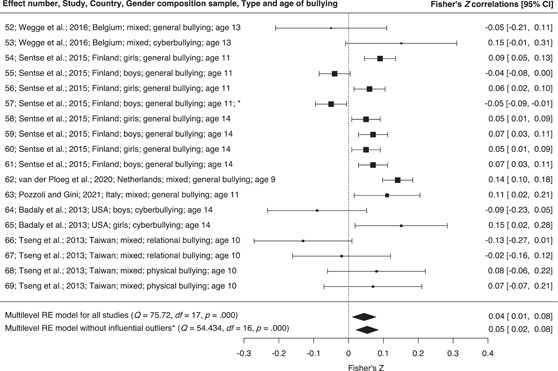
Forest plot adjusted effect of bullying perpetration in childhood and adolescence on later popularity. CI, confidence interval.
Figure 4.
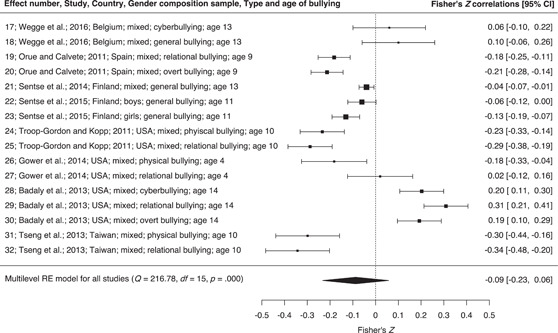
Forest plot unadjusted effect of bullying perpetration in childhood and adolescence on later acceptance. CI, confidence interval.
Figure 5.
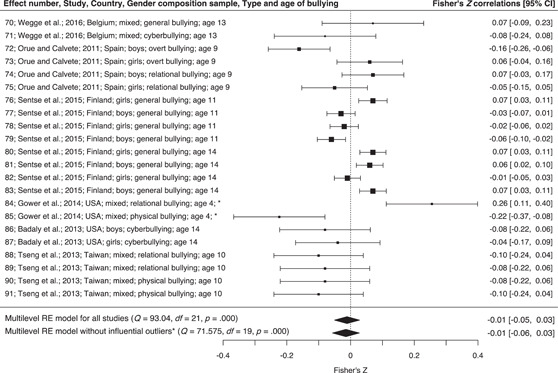
Forest plot adjusted effect of bullying perpetration in childhood and adolescence on later acceptance. CI, confidence interval.
Figure 6.
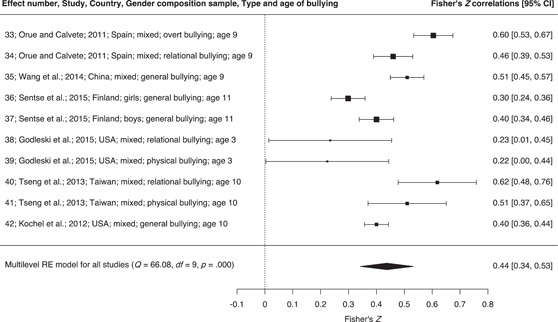
Forest plot unadjusted effect of bullying perpetration in childhood and adolescence on later rejection. CI, confidence interval.
Figure 7.
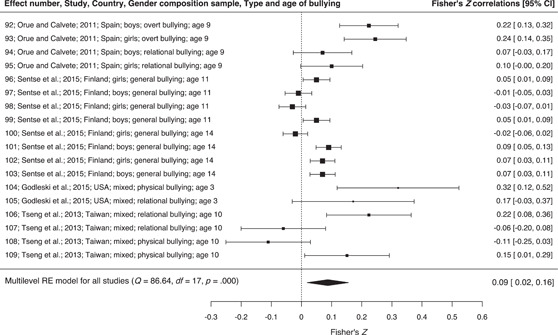
Forest plot adjusted effect of bullying perpetration in childhood and adolescence on later rejection. CI, confidence interval.
Figure 8.
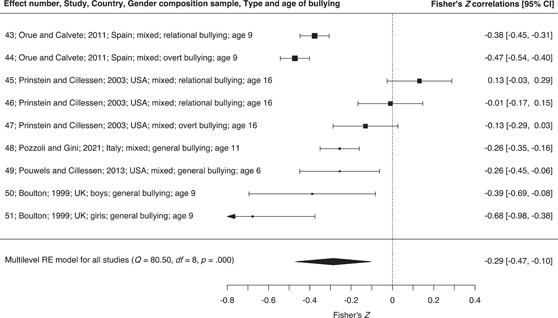
Forest plot unadjusted effect of bullying perpetration in childhood and adolescence on later social preference. CI, confidence interval.
Figure 9.
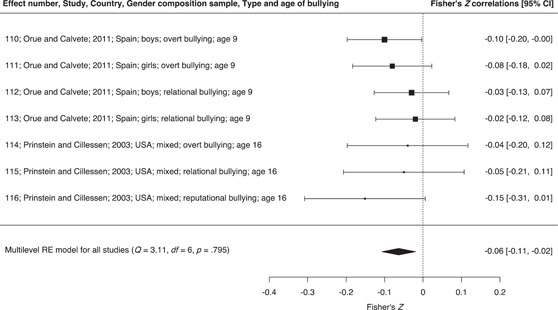
Forest plot adjusted effect of bullying perpetration in childhood and adolescence on later social preference. CI, confidence interval.
3.3. Heterogeneity
Heterogeneity indices for each model are reported in Table 3. For most adjusted models, I 2 indices for the sampling variance were an indication of sufficient within‐ and between‐sample heterogeneity to perform moderator analyses because less than 75% of the total amount of variance could be attributed to the sampling variance, that is, at level 1. For the adjusted effect model of social preference, the I 2 index for the sampling variance indicated insufficient within‐ and between‐sample heterogeneity. Hence, we performed no moderator analyses for this model.
Table 3.
Heterogeneity indices
| Model | Heterogeneity | ||||||||
|---|---|---|---|---|---|---|---|---|---|
| Outcome | Adjusted or unadjusted effects | Q | p | I 2 Sampling variance, % | I 2 Within‐Sample variance, % | I 2 Between‐sample variance, % | p Within sample | p Between samples | Moderator analyses performeda |
| Popularity | Unadjusted | 180.38 | <.001 | 4.59 | 13.89 | 81.52 | .011 | .006 | No |
| Adjusted | 75.72 | <.001 | 21.12 | 78.88 | 0.00 | <.001 | 1.000 | Yes | |
| Acceptance | Unadjusted | 216.78 | <.001 | 4.45 | 2.75 | 92.80 | .145 | <.001 | No |
| Adjusted | 93.04 | <.001 | 16.79 | 79.35 | 3.86 | <.001 | .863 | Yes | |
| Rejection | Unadjusted | 66.08 | <.001 | 9.63 | 28.37 | 61.99 | .009 | .164 | No |
| Adjusted | 86.65 | <.001 | 11.01 | 44.05 | 44.93 | <.001 | .173 | Yes | |
| Social Preference | Unadjusted | 80.50 | <.001 | 8.65 | 13.48 | 77.87 | .120 | .037 | No |
| Adjusted | 3.111 | .795 | 100 | 0 | 0 | 1.000 | 1.000 | No | |
Moderator analyses were performed on the adjusted effects, but only if at least 10 studies per outcome were included and if <75% of the total amount of the variance could be attributed to sampling variance, i.e., at level 1 (I 2 sampling variance).
3.4. Moderator analyses
The results of the moderator analyses were based on the adjusted effects models and are reported in Table 4. Only two out of 23 performed moderator analyses showed significant effects but these were not consistent across social status outcomes and analyses are based on a small number of effects, which precludes confident interpretation of the results.
Table 4.
Moderator analyses results for the adjusted effects models
| Outcome | Moderator | QM | df | β | 95% CI | p |
|---|---|---|---|---|---|---|
| Popularity | Primary‐ vs. secondary schoola | 0.81 | 1 | .03 | −0.04 to 0.10 | .368 |
| Sex (proportion female) | 3.13 | 1 | .07 | −0.01 to 0.15 | .077 | |
| Short‐ vs. long‐termb, c | ||||||
| Year of publication | 4.91 | 1 | .02 | 0.00–0.03 | .027 | |
| Self‐reported vs. other bullying reports | 0.27 | 1 | .02 | −0.05 to 0.09 | .607 | |
| Study bias sum score | 0.17 | 1 | .02 | −0.05 to 0.09 | .607 | |
| Type of bullying EXPb, d | ||||||
| Childhood vs early adolescence EXPb, e | ||||||
| Early adolescence vs. mid‐late adolescence EXPf | 1.16 | 1 | .04 | −0.03 to 0.10 | .281 | |
| Acceptance | Primary‐ vs. secondary schoola | 1.77 | 1 | .05 | −0.02 to 0.13 | .183 |
| Sex (proportion female) | 0.40 | 1 | .03 | −0.06 to 0.12 | .525 | |
| Short‐ vs. long‐termc | 0.05 | 1 | −.01 | −0.13 to 0.10 | .829 | |
| Year of publication | 1.26 | 1 | .01 | −0.01 to 0.04 | .262 | |
| Self‐reported vs. other bullying reports | 2.93 | 2 | .231 | |||
| Study bias sum score | 2.47 | 1 | −.05 | −0.12 to −0.1 | .116 | |
| Type of bullying EXPd | 1.75 | 1 | .09 | −0.04 to 0.21 | .186 | |
| Childhood vs early adolescence EXPe | 0.29 | 1 | −.03 | −0.15 to 0.09 | .588 | |
| Early adolescence vs mid‐late adolescence EXPf | 1.01 | 1 | .05 | −0.05 to 0.15 | .316 | |
| Rejection | Primary‐ vs. secondary school a | 0.06 | 1 | −.02 | −0.19 to 0.15 | .803 |
| Sex (proportion female) | 0.20 | 1 | −.02 | −0.10 to 0.07 | .655 | |
| Short‐ vs. long‐terma, c | ||||||
| Year of publication | 1.01 | 1 | −.02 | −0.06 to 0.02 | .315 | |
| Self‐reported vs. other bullying reports | 5.90 | 2 | .052 | |||
| Study bias sum score | 2.47 | 1 | −.07 | −0.15 to 0.02 | .116 | |
| Type of bullying EXPd | 3.12 | 1 | .13 | −0.01 to 0.28 | .077 | |
| Childhood vs. early adolescence EXPe | 9.37 | 1 | −.15 | −0.24 to −0.05 | .002 | |
| Early adolescence vs. mid‐late adolescence EXPf | 0.47 | 1 | .03 | −0.05 to 0.10 | .494 |
Note: values in bold are statistically significant.
Abbreviations: df, degree(s) of freedom; EXP, exploratory analysis; QM, statistic of moderator analysis.
Primary school is reference category.
This moderator analysis was not feasible due to no or insufficient variance.
Short‐term studies have less than 12 months between the bullying perpetration assessment and social status assessment and long‐term studies have 12 months or more between the two assessments.
Direct bullying (reference) versus indirect bullying.
Childhood (age < 10) versus early adolescence (age 10–13).
Early adolescence (age 10–13) versus mid‐late adolescence (age ≥ 14).
Developmental period only moderated the association between bullying and social status in one model: Bullying perpetration in childhood (age ≤ 9) more strongly predicted rejection than bullying perpetration in early adolescence (age 10–13). There was no significant difference for rejection between early adolescent and mid‐late adolescent bullies. There was not enough variance to test whether developmental period moderated the association between bullying perpetration and popularity for child bullies versus early adolescent bullies. Year of publication moderated the association between bullying perpetration and popularity: Bullying more strongly predicted popularity in recent publications compared to older publications.
3.5. Sensitivity analyses and publication bias check
For two models, influential outliers were identified (Table 2, right panel). For both the adjusted effects of bullying perpetration on popularity and bullying perpetration on acceptance, removal of influential outliers did not change the direction and statistical significance of effects. As part of the sensitivity analyses, two adjusted models were computed again with null‐effects included (Table 2). For popularity, three additional null‐effects were included in the reanalysis (Prinstein & Cillessen, 2003). Compared to results before inclusion of null‐effects, the effect size only slightly decreased, from Z = 0.05 to Z = 0.04, and remained statistically significant. For social preference, one null‐effect was included in the reanalysis (Pozzoli & Gini, 2021). The effect size decreased only slightly after including the null‐effect, from Z = −0.06 to Z = −0.05, and remained statistically significant.
Most unadjusted and adjusted effects models were based on 10 or more effects and had sufficient variation in study sizes, which allowed us to perform Egger's tests (Higgins & Thomas, 2020; Rothstein et al., 2005). The results showed no indication that publication bias significantly impacted the meta‐analyses (Table 5). Egger's tests could not be performed for the unadjusted and adjusted effect models of social preference, because these were based on fewer than 10 effects.
Table 5.
Egger tests to assess publication and reporting bias
| Model | Egger testa | ||||
|---|---|---|---|---|---|
| Outcome | Unadjusted or adjusted effects | QM | β b | p | 95% CI |
| Popularity | Unadjusted | 0.02 | .01 | .875 | −0.06 to 0.07 |
| Adjusted | 0.28 | .01 | .596 | −0.01 to 0.02 | |
| Acceptance | Unadjusted | 1.51 | .01 | .218 | −0.01 to 0.03 |
| Adjusted | 2.79 | .02 | .095 | −0.00 to 0.04 | |
| Rejection | Unadjusted | 0.00 | −.00 | .955 | −0.09 to 0.08 |
| Adjusted | 2.86 | −.03 | .091 | −0.06 to 0.00 | |
| Social preference | Unadjusted | ||||
| Adjusted | |||||
Abbreviations: CI, confidence interval; QM, statistic of Egger test.
Egger's tests were performed for models based on ≥ 10 effects.
All ns were divided by 500 for the Egger's tests because the estimates and CIs for an increase with 1 participant would be 0 after rounding off.
4. DISCUSSION
The aim of this meta‐analysis was to synthesize the available literature on prospective associations between bullying perpetration and different facets of social status. We extended previous work by not only including different forms of bullying, but also by focussing on longitudinal studies in which adjusted effects were controlled for previous social status. We found evidence that bullies become more popular over time, even when earlier popularity and other confounders were taken into account, suggesting a modest but robust prospective association between bullying perpetration and popularity. Bullies were, however, also more likely to be rejected and scored lower on social preference, even when earlier rejection and social preference were taken into account. Even though some individual studies included in this meta‐analysis reported a significant association between bullying perpetration and lower acceptance, we did not find meta‐analytic evidence for this relationship. That is, bullying did not seem to affect whether someone was increasingly or decreasingly liked by others.
Our findings are largely in line with earlier systematic reviews on bullying perpetration (Álvarez‐García et al., 2015; Salmivalli, 2010; Thomas et al., 2018) and with meta‐analytic evidence on relational aggression (Casper et al., 2020), and indicate that being a bully can be beneficial for obtaining popularity in the peer group. Yet, findings from the present meta‐analysis and from previous research on bullying perpetration also show that bullies are being more rejected (Álvarez‐García et al., 2015; Salmivalli, 2010). Bullying perpetration was not linked to acceptance in the present meta‐analysis, which is in line with a recent meta‐analysis on relational aggression (Casper et al., 2020), but different to another review on bullying (Álvarez‐García et al., 2015). This mixed evidence might be reflective of the ambiguous nature of the relationship between bullying perpetration and acceptance. It has been suggested that bullies might be well‐liked by their friends while not being accepted and liked by their victims and other peers (e.g., Pozzoli & Gini, 2021).
Our findings contribute to a better understanding of why bullies keep bullying: Bullies are apparently rewarded for victimizing others. This might be problematic for at least two reasons: First, not only do bullies increase their popularity with their negative behavior, this popular status can also lead to many other benefits (Volk et al., 2014) which would make continuation of bullying perpetration likely. Because bullies gain advantages, they might be less inclined to modify their behavior and, more so, they might internalize that bullying helps them achieve their needs. This means that future partners, colleagues, or offspring might bear the brunt of their behavior. Second, popular children might have more influence on behavioural norms in the peer group. Popular bullies might, for example, set the norm that bullying perpetration is acceptable (e.g., Dijkstra & Gest, 2015), which might evoke even more bullying behavior. Two studies in the present meta‐analysis included classroom norms (Berger & Caravita, 2016; Sentse et al., 2015) but focused on the influence of these norms on persistence of bullying behavior. Based on previous cross‐sectional research, bullies might score, for instance, higher on social preference in classrooms with higher levels of bullying (Sentse et al., 2007), thus popularity might not be the only status facet that is affected. Thus far, we do not know, however, whether bullying perpetration is an incentive for or a consequence of popularity in classes where bullying is accepted and whether classroom norms are still beneficial for bullies over a longer period of time.
Bullies are not only more popular, but also more rejected. This finding is in line with the idea that bullies often have a controversial status – popular but rejected – in the peer group as they engage in both antisocial and prosocial behavior (Salmivalli, 2010). This controversial status makes bullies at risk for negative social and emotional outcomes, as peer rejection is, for instance, associated with conduct problems (Chen et al., 2015) and later depression (Platt et al., 2013). More so, rejected children do not always receive social support or engage in positive peer relations, which are key for social well‐being and development (Rubin et al., 2005).
4.1. Limitations of the field
During extraction of relevant information from the studies, we noticed some areas for improvement with respect to measurement issues and reporting issues. To start, studies used different measures of bullying perpetration and social status. In one study, for example, students had to assess acceptance by nominating peers they “like to hang out the most with” (Tseng et al., 2013), whereas in another study students assessed acceptance by indicating who their friends were (Wegge et al., 2016). “Hanging out with” might be viewed as a measure of popularity or friendship by other researchers. We stuck to the definitions applied by the original authors but this issue illustrates the tension between original studies and a meta‐analysis.
Likewise, some studies defined bullying perpetration before asking questions about it but not all studies. In some cases, measures referred to either general bullying perpetration (e.g., “who are the classmates who engage in hurtful and intentional behavior against a peer who cannot easily defend themselves”) or specific forms of bullying (e.g., “who are the classmates who more often spread rumors about others”). The effects included in the present meta‐analysis are thus based on a wide range of instruments to assess bullying perpetration and social status outcomes. Our results do therefore not reflect simple similar effects. It also means, however, that if an effect is found based on different conceptualizations and instruments, the finding is robust to heterogeneity in assessments.
Next, some studies relied on a single, global measure of bullying perpetration which does not inform about the severity of the behavior or the existence of an imbalance in power between the bully and victim. These are, together with stability and goal‐directedness, key characteristics to differentiate bullying perpetration from other forms of aggression (e.g., Volk et al., 2014). It has been suggested to expand bullying perpetration measure instruments by explicitly addressing these four characteristics of bullying (Kaufman et al., 2020). This can help to adequately distinguish bullying perpetration from other forms of peer aggression, can reduce the limitation of bullying information, and might add to the consistency of instruments and conceptualizations of bullying perpetration measurements.
Further, only one study (Gower et al., 2014) relied on multiple reporters to assess bullying perpetration. However, social behavior varies across situational contexts (Achenbach, 2011; de Los Reyes, 2011), which might not be adequately captured by using only one reporter. Peers, teachers, parents, and young people themselves all have different perspectives of the bullying behavior and can therefore complement each other. The use of multiple reporters to assess bullying might avoid single reporter bias, give a more complete picture of the bullying behavior, and add to the consistency of the use of bullying assessment reporters. What is more, the use of multiple‐informant data could reduce shared method variance, i.e., the same person reporting on bullying behavior as well as social status, which now might have confounded the link between bullying perpetration and social status in the included studies.
Additionally, some studies lacked information about attrition rates or could not adequately show that attrition rates did not vary by bullying perpetration or social status. This increases the risks of biased results. One could thus wonder about the generalizability of these results. Additionally, reporting needs to be standardized with respect to the descriptive statistics of the study variables, correlations between all study variables, and nonsignificant results. Descriptive statistics and correlations are essential to interpret the reported data and effects sizes of nonsignificant results should be reported to avoid biased effect size estimations in meta‐analyses.
Finally, only few studies examined bullying and social status outcomes in childhood (Boulton, 1999; Godleski et al., 2015; Gower et al., 2014; Orue & Calvete, 2011; Pouwels & Cillessen, 2013; van der Ploeg et al., 2020). Even though strategic bullying – bullying as a way to gain popularity – mostly occurs during adolescence (Salmivalli, 2010), many primary schools and middle schools already apply this notion in their interventions. Future research could focus on the function of bullying perpetration in primary and secondary school and whether bullying behavior is already motivated by status goals in primary school, especially considering that our findings tentatively suggests that associations between bullying perpetration and social status outcomes are not different depending on educational context. Such research would not only increase our knowledge about bullying but might also lead to better implementation of interventions.
4.2. Limitations of the present meta‐analysis
Although findings of this meta‐analysis strengthen our knowledge about the associations between bullying perpetration and the various facets of social status, several limitations should be noted. To start, we have focussed on summarizing the literature on the narrow concept of bullying perpetration rather than including all forms of aggression and social status as outcome. The bullying literature has defined a number of features of bullying perpetration that are not needed to define to other forms of aggression such as a power imbalance between the bully and the victim (Volk et al., 2017), the presence of a consistent target (Olweus, 2013), and goal‐directed, strategic use of aggression (e.g., Reijntjes et al., 2013; Volk et al., 2017). We were particularly interested in the association between bullying perpetration and later social status ‐ an association often discussed due to the assumption that strategic bullying is motivated by status goals (e.g., Salmivalli, 2010). We positioned this study thus firmly within the bullying literature and sought to contribute to this study field by providing a summary of the available evidence on bullying perpetration and later status.
Further, due to the low variation in studies that examined childhood bullying perpetration and popularity, we were not able to perform a moderator analysis on whether the developmental period in which the bullying behavior took place influences the association between bullying and popularity. Likewise, it is unclear whether the fact that we did not find evidence that developmental period moderated the association between bullying perpetration and acceptance was due to the absence of this effect or due to the low number of included studies that examined childhood bullying and acceptance.
Finally, because we meta‐analyzed the effect of bullying perpetration on later social status, we can conclude that bullying is beneficial for obtaining a popular status while at the same time a risk factor for rejection and a lower score on social preference. However, we cannot infer causal claims or whether within‐person change in bullying perpetration is associated with within‐person change in social status with the included studies in the present meta‐analysis. This requires at least three study waves to investigate whether changes in bullying perpetration lead to changes in social status and also requires studies to report analyses on within‐subject change scores.
5. CONCLUSION
We sought to contribute to the bullying research filed by summarizing the available evidence on bullying perpetration and later social status. Overall, we found some support for small prospective links between bullying perpetration and popularity, rejection, and social preference: While bullies become more popular over time, bullies also have a higher risk of being rejected and being less socially preferred. It is problematic that bullies are rewarded for their behavior in terms of popularity, as this might turn into continuation of bullying behaviors across social contexts. Equally problematic might be that high levels of rejection and low levels of social preference could ultimately lead to social and mental health problems later in life. The research field could benefit from well‐designed longitudinal studies which include contextual factors such as classroom norms.
CONFLICTS OF INTEREST
Four of the included articles in the present meta‐analysis were co‐authored by Dr. Kretschmer, Dr. Sentse and/or Dr. Van der Ploeg. To avoid bias toward own papers as much as possible, a third screener was involved if these co‐authors had been assigned to screen their own papers and they were not involved in the data extraction or risk of bias assessment. None of the authors have other conflicts of interest to report.
ETHICAL APPROVAL
Exempt for review because no human subjects data were collected.
Supporting information
Supplementary information.
ACKNOWLEDGEMENTS
Preparation of this manuscript has been supported by a European Research Council (ERC) Starting Grant awarded to Tina Kretschmer under the Horizon 2020 Research and Innovation program (Grant Agreement Number 757364, Title: Ghosts from the Past ‐ Consequences of Adolescent Peer Relations Across Contexts and Generations).
Wiertsema, M. , Vrijen, C. , Ploeg, R. , Sentse, M. , & Kretschmer, T. (2023). Bullying perpetration and social status in the peer group: A meta‐analysis. Journal of Adolescence, 95, 34–55. 10.1002/jad.12109
DATA AVAILABILITY STATEMENT
All data files and syntaxes are openly available on the Open Science Framework at https://osf.io/z9hf4/.
REFERENCES
- *Indicates that the study was included in the meta‐analysis.
- Achenbach, T. M. (2011). Commentary: definitely more than measurement error: but how should we understand and deal with informant discrepancies? Journal of Clinical Child and Adolescent Psychology, 40(1), 80–86. 10.1080/15374416.2011.533416 [DOI] [PubMed] [Google Scholar]
- Álvarez‐García, D. , García, T. , & Núñez, J. C. (2015). Predictors of school bullying perpetration in adolescence: A systematic review. Aggression and Violent Behavior, 23, 126–136. 10.1016/j.avb.2015.05.007 [DOI] [Google Scholar]
- Assink, M. , & Wibbelink, C. J. M. (2016). Fitting three‐level meta‐analytic models in R: A step‐by‐step tutorial. The Quantitative Methods for Psychology, 12(3), 154–174. 10.20982/tqmp.12.3.p154 [DOI] [Google Scholar]
- * Badaly, D. , Kelly, B. M. , Schwartz, D. , & Dabney‐Lieras, K. (2013). Longitudinal associations of electronic aggression and victimization with social standing during adolescence. Journal of Youth and Adolescence, 42(6), 891–904. 10.1007/s10964-012-9787-2 [DOI] [PubMed] [Google Scholar]
- van den Berg, Y. H. M. , Burk, W. J. , & Cillessen, A. H. N. (2014). Identifying subtypes of peer status by combining popularity and preference: A cohort‐sequential approach. The Journal of Early Adolescence, 35(8), 1108–1137. 10.1177/0272431614554704 [DOI] [Google Scholar]
- van den Berg, Y. H. M. , Lansu, T. A. M. , & Cillessen, A. H. N. (2020). Preference and popularity as distinct forms of status: A metaanalytic review of 20 years of research. Journal of Adolescence, 84, 78–95. 10.1016/j.adolescence.2020.07.010 [DOI] [PubMed] [Google Scholar]
- * Berger, C. , & Caravita, S. C. S. (2016). Why do early adolescents bully? exploring the influence of prestige norms on social and psychological motives to bully. Journal of Adolescence, 46, 45–56. 10.1016/j.adolescence.2015.10.020 [DOI] [PubMed] [Google Scholar]
- * Boulton, M. J. (1999). Concurrent and longitudinal relations between children's playground behavior and social preference, victimization, and bullying. Child Development, 70(4), 944–954. 10.1111/1467-8624.00068 [DOI] [PubMed] [Google Scholar]
- Caravita, S. C. S. , & Cillessen, A. H. N. (2012). Agentic or communal? associations between interpersonal goals, popularity, and bullying in middle childhood and early adolescence: Goals, popularity, and bullying. Social Development, 21(2), 376–395. 10.1111/j.1467-9507.2011.00632.x [DOI] [Google Scholar]
- Casper, D. M. , Card, N. A. , & Barlow, C. (2020). Relational aggression and victimization during adolescence: A meta‐analytic review of unique associations with popularity, peer acceptance, rejection, and friendship characteristics. Journal of Adolescence, 80, 41–52. 10.1016/j.adolescence.2019.12.012 [DOI] [PubMed] [Google Scholar]
- Casper, D. M. , Meter, D. J. , & Card, N. A. (2015). Addressing measurement issues related to bullying involvement. School Psychology Review, 44, 353–371. 10.17105/spr-15-0036.1 [DOI] [Google Scholar]
- Chen, D. , Drabick, D. A. , & Burgers, D. E. (2015). A developmental perspective on peer rejection, deviant peer affiliation, and conduct problems among youth. Child Psychiatry and Human Development, 46(6), 823–838. 10.1007/s10578-014-0522-y [DOI] [PMC free article] [PubMed] [Google Scholar]
- Compas, B. E. , Jaser, S. S. , Bettis, A. H. , Watson, K. H. , Gruhn, M. A. , Dunbar, J. P. , Williams, E. , & Thigpen, J. C. (2017). Coping, emotion regulation, and psychopathology in childhood and adolescence: A meta‐analysis and narrative review. Psychological Bulletin, 143(9), 939–991. 10.1037/bul0000110 [DOI] [PMC free article] [PubMed] [Google Scholar]
- Crick, N. R. , & Grotpeter, J. K. (1996). Children's treatment by peers: victims of relational and overt aggression. Development and Psychopathology, 8(2), 367–380. 10.1017/S0954579400007148 [DOI] [Google Scholar]
- Dijkstra, J. K. , & Gest, S. D. (2015). Peer norm salience for academic achievement, prosocial behavior, and bullying: Implications for adolescent school experiences. The Journal of Early Adolescence, 35(1), 79–96. 10.1177/0272431614524303 [DOI] [Google Scholar]
- Ferguson, S. M. , & Ryan, A. M. (2019). It's lonely at the top: Adolescent students’ peer‐perceived popularity and self‐perceived social contentment. Journal of Youth and Adolescence, 48(2), 341–358. 10.1007/s10964-018-0970-y [DOI] [PubMed] [Google Scholar]
- * Godleski, S. A. , Kamper, K. E. , Ostrov, J. M. , Hart, E. J. , & Blakely‐McClure, S. J. (2015). Peer victimization and peer rejection during early childhood. Journal of Clinical Child & Adolescent Psychology, 44(3), 380–392. 10.1080/15374416.2014.940622 [DOI] [PMC free article] [PubMed] [Google Scholar]
- * Gower, A. L. , Lingras, K. A. , Mathieson, L. C. , Kawabata, Y. , & Crick, N. R. (2014). The role of preschool relational and physical aggression in the transition to kindergarten: Links with social‐psychological adjustment. Early Education and Development, 25(5), 619–640. [DOI] [PMC free article] [PubMed] [Google Scholar]
- Guy, A. , Lee, K. , & Wolke, D. (2017). Differences in the early stages of social information processing for adolescents involved in bullying. Aggressive Behavior, 43, 578–587. 10.1002/ab.21716 [DOI] [PubMed] [Google Scholar]
- Guy, A. , Lee, K. , & Wolke, D. (2019). Comparisons between adolescent bullies, victims, and bully‐victims on perceived popularity, social impact, and social preference. Frontiers in Psychiatry, 10. 10.3389/fpsyt.2019.00868 [DOI] [PMC free article] [PubMed] [Google Scholar]
- Higgins, J. , & Thomas, J. (2020). Cochrane handbook for systematic reviews of interventions. Version 6.1 [updated 2020]. https://training.cochrane.org/handbook/current
- Huitsing, G. , Veenstra, R. , Sainio, M. , & Salmivalli, C. (2012). “It must be me” or “it could be them?”: the impact of the social network position of bullies and victims on victims’ adjustment. Social Networks, 34(4), 379–386. 10.1016/j.socnet.2010.07.002 [DOI] [Google Scholar]
- Hunter, J. E. , & Schmidt, F. L. (2004). Methods of Meta‐Analysis: Correcting Error and Bias in Research Findings. SAGE. [Google Scholar]
- Kaufman, T. M. L. , Huitsing, G. , & Veenstra, R. (2020). Refining victims’ self‐reports on bullying: Assessing frequency, intensity, power imbalance, and goal‐directedness. Social Development, 29(2), 375–390. 10.1111/sode.12441 [DOI] [Google Scholar]
- * Kochel, K. P. , Miller, C. F. , Updegraff, K. A. , Ladd, G. W. , & Kochenderfer‐Ladd, B. (2012). Associations between fifth graders’ gender atypical problem behavior and peer relationships: A short‐term longitudinal study. Journal of Youth and Adolescence, 41(8), 1022–1034. 10.1007/s10964-011-9733-8 [DOI] [PubMed] [Google Scholar]
- Ladd, G. W. , & Kochenderfer‐Ladd, B. (2002). Identifying victims of peer aggression from early to middle childhood: Analysis of cross‐informant data for concordance, estimation of relational adjustment, prevalence of victimization, and characteristics of identified victims. Psychological Assessment, 14(1), 74–96. 10.1037/1040-3590.14.1.74 [DOI] [PubMed] [Google Scholar]
- Lease, A. M. , Musgrove, K. T. , & Axelrod, J. L. (2002). Dimensions of social status in preadolescent peer groups: Likability, perceived popularity, and social dominance. Social Development, 11(4), 508–533. 10.1111/1467-9507.00213 [DOI] [Google Scholar]
- de Los Reyes, A. (2011). Introduction to the special section: More than measurement error: Discovering meaning behind informant discrepancies in clinical assessments of children and adolescents. Journal of Clinical Child and Adolescent Psychology, 40(1), 1–9. 10.1080/15374416.2011.533405 [DOI] [PubMed] [Google Scholar]
- van den Noortgate, W. , López‐López, J. A. , Marín‐Martínez, F. , & Sánchez‐Meca, J. (2013). Three‐level meta‐analysis of dependent effect sizes. Behavior Research Methods, 45(2), 576–594. 10.3758/s13428-012-0261-6 [DOI] [PubMed] [Google Scholar]
- Olweus, D. (1993). Bullying at school: What we know and what we can do. Blackwell Publishing. [Google Scholar]
- Olweus, D. (2013). School bullying: Development and some important challenges. Annual review of clinical psychology, 9(1), 751–780. 10.1146/annurev-clinpsy-050212-185516 [DOI] [PubMed] [Google Scholar]
- * Orue, I. , & Calvete, E. (2011). Reciprocal relationships between sociometric indices of social status and aggressive behavior in children: Gender differences. Journal of Social and Personal Relationships, 28(7), 963–982. 10.1177/0265407510397982 [DOI] [Google Scholar]
- Peterson, R. A. , & Brown, S. P. (2005). On the use of beta coefficients in meta‐analysis. Journal of Applied Psychology, 90(1), 175–181. 10.1037/0021-9010.90.1.175 [DOI] [PubMed] [Google Scholar]
- Platt, B. , Kadosh, K. C. , & Lau, J. Y. F. (2013). The role of peer rejection in adolescent depression. Depression and Anxiety, 30(9), 809–821. 10.1002/da.22120 [DOI] [PubMed] [Google Scholar]
- * van der Ploeg, R. , Steglich, C. , & Veenstra, R. (2020). The way bullying works: How new ties facilitate the mutual reinforcement of status and bullying in elementary schools. Social Networks, 60, 71–82. 10.1016/j.socnet.2018.12.006 [DOI] [Google Scholar]
- * Pouwels, J. L. , & Cillessen, A. H. N. (2013). Correlates and outcomes associated with aggression and victimization among elementary‐school children in a low‐income urban context. Journal of Youth and Adolescence, 42(2), 190–205. 10.1007/s10964-012-9875-3 [DOI] [PubMed] [Google Scholar]
- Pouwels, J. L. , Lansu, T. A. M. , & Cillessen, A. H. N. (2016). Participant roles of bullying in adolescence: status characteristics, social behavior, and assignment criteria. Aggressive Behavior, 42(3), 239–253. 10.1002/ab.21614 [DOI] [PubMed] [Google Scholar]
- * Pozzoli, T. , & Gini, G. (2021). Longitudinal relations between students' social status and their roles in bullying: The mediating role of self‐perceived social status. Journal of School Violence, 20, 76–88. 10.1080/15388220.2020.1850462 [DOI] [Google Scholar]
- * Prinstein, M. J. , & Cillessen, A. H. (2003). Forms and functions of adolescent peer aggression associated with high levels of peer status. Merrill‐Palmer Quarterly, 49(3), 310–342. 10.1353/mpq.2003.0015 [DOI] [Google Scholar]
- R Core Team . (2013). R: A langauge and environment for staistical computing. R Foundation for Statistical Computing. http://www.R-project.org/ [Google Scholar]
- Reijntjes, A. , Vermande, M. , Goossens, F. A. , Olthof, T. , van de Schoot, R. , Aleva, L. , & van der Meulen, M. (2013). Developmental trajectories of bullying and social dominance in youth. Child Abuse & Neglect, 37(4), 224–234. 10.1016/j.chiabu.2012.12.004 [DOI] [PubMed] [Google Scholar]
- Rothstein, H. R. , Sutton, A. J. , & Borenstein, M. (2005). Publication bias in meta‐analysis: Prevention, assessment and adjustments. John Wiley & Sons. [Google Scholar]
- RStudio Team . (2015). RStudio: Integrated development for R. RStudio, Inc. http://www.rstudio.com/
- Rubin, K. H. , Coplan, R. , Chen, X. , Buskirk, A. A. , & Wojslawowicz, J. C. (2005). Peer relations in childhood. In Bornstein M. H., & Lamb M. E. (Eds.), Developmental science: An advanced textbook (pp. 469–512). Lawrence Erlbaum Associates. 10.1007/978-1-4615-0195-4_117 [DOI] [Google Scholar]
- Salmivalli, C. (2010). Bullying and the peer group: A review. Aggression and Violent Behavior, 15, 112–120. 10.1016/j.avb.2009.08.007 [DOI] [Google Scholar]
- Salmivalli, C. , & Peets, K. (2008). Bullies, victims, and bully–victim relationships. In Rubin K. H., Bukowski W. M., & Laursen B. (Eds.), Handbook of peer interactions, relationships, and groups (pp. 322–340). The Guilford Press. [Google Scholar]
- Sandstrom, M. J. , & Cillessen, A. H. N. (2006). Likeable versus popular: Distinct implications for adolescent adjustment. International Journal of Behavioral Development, 30(4), 305–314. 10.1177/0165025406072789 [DOI] [Google Scholar]
- Scholte, R. H. J. , Engels, R. C. M. E. , Overbeek, G. , de Kemp, R. A. T. , & Haselager, G. J. T. (2007). Stability in bullying and victimization and its association with social adjustment in childhood and adolescence. Journal of Abnormal Child Psychology, 35(2), 217–228. 10.1007/s10802-006-9074-3 [DOI] [PMC free article] [PubMed] [Google Scholar]
- Schwartz, D. (2000). Subtypes of victims and aggressors in children's peer groups. Journal of Abnormal Child Psychology, 12. [DOI] [PubMed] [Google Scholar]
- * Sentse, M. , Kiuru, N. , Veenstra, R. , & Salmivalli, C. (2014). A social network approach to the interplay between adolescents’ bullying and likeability over time. Journal of Youth and Adolescence, 43(9), 1409–1420. 10.1007/s10964-014-0129-4 [DOI] [PubMed] [Google Scholar]
- * Sentse, M. , Kretschmer, T. , & Salmivalli, C. (2015). The longitudinal interplay between bullying, victimization, and social status: Age‐related and gender differences. Social Development, 24(3), 659–677. 10.1111/sode.12115 [DOI] [Google Scholar]
- Sentse, M. , Scholte, R. , Salmivalli, C. , & Voeten, M. (2007). Person–Group dissimilarity in involvement in bullying and its relation with social status. Journal of Abnormal Child Psychology, 35(6), 1009–1019. 10.1007/s10802-007-9150-3 [DOI] [PubMed] [Google Scholar]
- * Sentse, M. , Veenstra, R. , Kiuru, N. , & Salmivalli, C. (2015). A longitudinal multilevel study of individual characteristics and classroom norms in explaining bullying behaviors. Journal of Abnormal Child Psychology, 43(5), 943–955. 10.1007/s10802-014-9949-7 [DOI] [PubMed] [Google Scholar]
- Tabachnick, B. G. , Fidell, L. S. , & Ullman, J. B. (2019). Using multivariate statistics (Seventh edition). Pearson. [Google Scholar]
- Thomas, H. J. , Connor, J. P. , & Scott, J. G. (2018). Why do children and adolescents bully their peers? A critical review of key theoretical frameworks. Social Psychiatry and Psychiatric Epidemiology, 53(5), 437–451. 10.1007/s00127-017-1462-1 [DOI] [PubMed] [Google Scholar]
- * Troop‐Gordon, W. , & Kopp, J. (2011). Teacher‐Child relationship quality and children's peer victimization and aggressive behavior in late childhood: Teacher‐Child relationships and peer victimization. Social Development, 20(3), 536–561. 10.1111/j.1467-9507.2011.00604.x [DOI] [Google Scholar]
- * Tseng, W. L. , Banny, A. M. , Kawabata, Y. , Crick, N. R. , & Gau, S. S. F. (2013). A cross‐lagged structural equation model of relational aggression, physical aggression, and peer status in a Chinese culture. Aggressive Behavior, 39(4), 301–315. 10.1002/ab.21480 [DOI] [PubMed] [Google Scholar]
- Veenstra, R. , Lindenberg, S. , Munniksma, A. , & Dijkstra, J. K. (2010). The complex relation between bullying, victimization, acceptance, and rejection: Giving special attention to status, affection, and sex differences. Child Development, 81(2), 480–486. 10.1111/j.1467-8624.2009.01411.x [DOI] [PubMed] [Google Scholar]
- Veenstra, R. , Lindenberg, S. , Oldehinkel, A. J. , De Winter, A. F. , Verhulst, F. C. , & Ormel, J. (2005). Bullying and victimization in elementary schools: A comparison of bullies, victims, bully/victims, and uninvolved preadolescents. Developmental Psychology, 41(4), 672–682. 10.1037/0012-1649.41.4.672 [DOI] [PubMed] [Google Scholar]
- Viechtbauer, W. (2010). Conducting meta‐analyses in R with the metafor package. Journal of Statistical Software, 36(3), 1–48. 10.18637/jss.v036.i03 [DOI] [Google Scholar]
- Volk, A. A. , Camilleri, J. A. , Dane, A. V. , & Marini, Z. A. (2012). Is adolescent bullying an evolutionary adaptation? Aggressive Behavior, 38(3), 222–238. 10.1002/ab.21418 [DOI] [PubMed] [Google Scholar]
- Volk, A. A. , Dane, A. V. , & Marini, Z. A. (2014). What is bullying? A theoretical redefinition. Developmental Review, 34, 327–343. 10.1016/j.dr.2014.09.001 [DOI] [Google Scholar]
- Volk, A. A. , Dane, A. V. , Marini, Z. A. , & Vaillancourt, T. (2015). Adolescent bullying, dating, and mating: Testing an evolutionary hypothesis. Evolutionary Psychology, 13(4), 1474704915613909. 10.1177/1474704915613909 [DOI] [PMC free article] [PubMed] [Google Scholar]
- Volk, A. A. , Veenstra, R. , & Espelage, D. L. (2017). So you want to study bullying? Recommendations to enhance the validity, transparency, and compatibility of bullying research. Aggression and Violent Behavior, 36, 34–43. 10.1016/j.avb.2017.07.003 [DOI] [Google Scholar]
- de Vries, E. , Kaufman, T. M. L. , Veenstra, R. , Laninga‐Wijnen, L. , & Huitsing, G. (2021). Bullying and victimization trajectories in the first years of secondary education: Implications for status and affection. Journal of Youth and Adolescence, 50(10), 1995–2006. 10.1007/s10964-020-01385-w [DOI] [PMC free article] [PubMed] [Google Scholar]
- Vrijen, C. , Wiertsema, M. , Ackermans, M. A. , van der Ploeg, R. , & Kretschmer, T. (2021). Childhood and adolescent bullying perpetration and later substance use: A meta‐analysis. Pediatrics, 147, e2020034751. 10.1542/peds.2020-034751 [DOI] [PubMed] [Google Scholar]
- * Wang, J. M. , Duong, M. , Schwartz, D. , Chang, L. , & Luo, T. (2014). Interpersonal and personal antecedents and consequences of peer victimization across middle childhood in Hong Kong. Journal of Youth and Adolescence, 43(11), 1934–1945. 10.1007/s10964-013-0050-2 [DOI] [PubMed] [Google Scholar]
- * Wegge, D. , Vandebosch, H. , Eggermont, S. , & Pabian, S. (2016). Popularity through online harm: The longitudinal associations between cyberbullying and sociometric status in early adolescence. The Journal of Early Adolescence, 36(1), 86–107. 10.1177/0272431614556351 [DOI] [Google Scholar]
- Wells, G. , Shea, B. , O'Connell, D. , Robertson, J. , Peterson, J. , Welch, V. , Losos, M. , & Tugwell, P. (2011). The Newcastle‐Ottawa Scale (NOS) for assessing the quality of nonrandomized studies in meta‐analysis. http://www.evidencebasedpublichealth.de/download/Newcastle_Ottowa_Scale_Pope_Bruce.pdf
- Wolke, D. , Copeland, W. E. , Angold, A. , & Costello, E. J. (2013). Impact of bullying in childhood on adult health, wealth, crime, and social outcomes. Psychological Science, 24(10), 1958–1970. 10.1177/0956797613481608 [DOI] [PMC free article] [PubMed] [Google Scholar]
Associated Data
This section collects any data citations, data availability statements, or supplementary materials included in this article.
Supplementary Materials
Supplementary information.
Data Availability Statement
All data files and syntaxes are openly available on the Open Science Framework at https://osf.io/z9hf4/.