

Abstract
Purpose
Ultralow‐field (ULF) point‐of‐care MRI systems allow image acquisition without interrupting medical provision, with neonatal clinical care being an important potential application. The ability to measure neonatal brain tissue T1 is a key enabling technology for subsequent structural image contrast optimization, as well as being a potential biomarker for brain development. Here we describe an optimized strategy for neonatal T1 mapping at ULF.
Methods
Examinations were performed on a 64‐mT portable MRI system. A phantom validation experiment was performed, and a total of 33 in vivo exams were acquired from 28 neonates with postmenstrual age ranging from 31+4 to 49+0 weeks. Multiple inversion‐recovery turbo spin‐echo sequences were acquired with differing inversion and repetition times. An analysis pipeline incorporating inter‐sequence motion correction generated proton density and T1 maps. Regions of interest were placed in the cerebral deep gray matter, frontal white matter, and cerebellum. Weighted linear regression was used to predict T1 as a function of postmenstrual age.
Results
Reduction of T1 with postmenstrual age is observed in all measured brain tissue; the change in T1 per week and 95% confidence intervals is given by dT1 = −21 ms/week [−25, −16] (cerebellum), dT1 = −14 ms/week [−18, −10] (deep gray matter), and dT1 = −35 ms/week [−45, −25] (white matter).
Conclusion
Neonatal T1 values at ULF are shorter than those previously described at standard clinical field strengths, but longer than those of adults at ULF. T1 reduces with postmenstrual age and is therefore a candidate biomarker for perinatal brain development.
Keywords: gray matter, neonatal, relaxometry, ultralow‐field MRI, white matter
1. INTRODUCTION
Recent years have seen increased popularity of MRI systems using magnetic field strengths far below those of traditional clinical systems with superconducting magnets. These systems have been engineered to optimize alternative design criteria (such as increased portability and lowered cost) in contrast to high‐field systems, which generally aim to maximize image quality. Crucially, these low‐field systems can also have reduced infrastructure needs, promising to expand the use of MRI beyond radiology departments in high‐income countries.
Ultralow‐field (ULF) point‐of‐care MRI systems 1 , 2 , 3 , 4 , 5 are a category of device designed to allow image acquisition without interrupting a patient′s medical provision. Neonatal clinical care is an important potential application, as portable systems would allow imaging on neonatal intensive care units in both high and lower‐resourced settings and where rapid diagnostic information could have large implications for clinical decision making. Key examples include neonates suffering from neurological pathologies such as hypoxic ischemic injury, hydrocephalus, stroke, as well as other conditions elsewhere in the body.
Although neonatal brain MRI has been performed at a variety of field strengths, 6 , 7 , 8 , 9 , 10 there is limited work in this cohort at ULF. While ULF adult imaging has been successfully demonstrated, 11 initial local experience demonstrates that sequences and acquisition parameters optimized for adults do not necessarily provide optimal image contrast in younger cohorts. This phenomenon is likely due to marked relaxation rate differences between adult and neonatal brain tissues, demonstrated at both high‐field in vivo 12 , 13 , 14 , 15 , 16 , 17 and at ULF in ex vivo tissue samples. 18
The ability to measure neonatal brain tissue T1 is a key enabling technology for further ULF neonatal imaging. It will allow image‐contrast optimization for structural imaging, as well as having the potential to be a biomarker for neonatal brain development. However, there has been no in vivo ULF neonatal T1 mapping to date, motivating this work using a 64‐mT portable MRI system. Here we describe an optimized strategy for T1 mapping using an inversion‐recovery turbo spin‐echo sequence and report values in 28 neonates.
2. METHODS
We designed a combined acquisition and analysis strategy to allow T1 mapping in the presence of participant motion, typical in neonates and infants. Multiple T1‐weighted volumes are first acquired, with each acquisition designed to have short duration to minimize the chance of intravolume motion corruption.
The reconstruction pipeline then takes an iterative two‐step approach. First, data fitting is performed without any correction for intersequence motion. The resulting proton density (M0) and T1 maps are then used to synthesize new images with the same T1 weighting as the acquired data, to which the original images are registered. These registered images are then used for data fitting, with this process repeated for a fixed number of iterations.
2.1. Acquisition
Two phantom experiments were performed to validate the acquisition and analysis pipeline used for our in vivo neonatal studies. A contrast phantom consisted of six 50‐ml falcon tubes containing distilled water and MnCl2 at concentrations of 0, 0.01, 0.05, 0.1, 0.15, and 0.2 mM, placed in a custom‐built holder so that the long axes of the vials were aligned with the main magnetic field. The second, a homogeneity phantom, was a spherical flask of 144‐mm diameter containing a solution of saline and gadolinium doped to achieve a T1 in the range of neonatal white matter at 64 mT.
A total of 33 exams were acquired from 28 neonates (mean gestation at birth: 36+3 weeks+days, range: [27+0, 40+4]; mean age at first scan: 13 days, range: [1, 94]; mean postmenstrual age at scan: 39+2 weeks+days, range: [31+4, 49+0]) as part of two National Health Service UK Research Ethics Committee approved studies (12/LO/1247 and 19/LO/1384). Recruitment to these studies included healthy controls and clinically referred neonates. Infants referred for clinical scans were eligible for chloral hydrate sedation. All medical support requirements, such as ventilation, intravenous infusions and/or thermoregulation, were continued throughout scanning, alongside continuous oxygen saturation and heart‐rate monitoring. Subjects were swaddled and immobilized using a vacuum‐evacuated bag containing polystyrene beads and placed in a neonatal imaging cradle designed to position the neonate′s head at the magnet isocenter. Imaging was performed with a 64‐mT Swoop portable MRI system (Hyperfine, Guilford, CT), using the built‐in RF interference rejection method 19 and single‐channel transmit/eight‐channel receive coil.
The scanning protocol consisted of a prescan calibration, localizer, and several acquisitions of the Hyperfine product inversion‐recovery 3D turbo spin‐echo acquisition (Figure 1), each modified using the sequence development interface to have differing TRs and TIs (TRn and TIn, with the subscript indexing the multiple acquisitions). The base sequence contained an adiabatic inversion pulse, a T1 recovery period (TIn), a nonselective turbo spin‐echo readout of NTF echoes using low‐high phase‐encode ordering, a delay period TD1 between the readout and a center‐frequency navigator echo generated by a nonselective excitation of flip angle , followed by a recovery time TD2n. The signal Sn at the first echo for a given choice (TRn, TIn) is given by Equation 1; note that the contribution from nonzero TE is subsumed into the M0 term.
FIGURE 1.
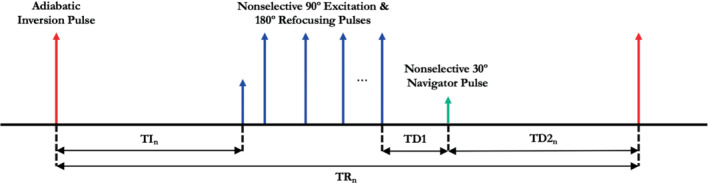
Pulse‐sequence diagram of inversion‐recovery 3D turbo spin echo. The sequence consists of an adiabatic inversion pulse, a turbo spin echo readout train, and a center‐frequency navigator
| (1) |
The following base sequence parameters were used for all acquisitions: FOV = 180 × 220 × 180 mm (right–left × anterior–posterior × feet–head), resolution = 2.8 × 2.8 × 2.8 mm, turbo factor (NTF) = 48, echo spacing () = 4.62 ms, bandwidth = 64 kHz, excitation flip angle = 90°, refocusing flip angle = 180°, TE = 4.62 ms, = 30°, TD1 = 239 ms, and TD2n = TRn‐TIn‐NTF ‐TD1. Preliminary experiments confirmed insensitivity to transmitter voltage miscalibration.
The comprehensive mapping protocol is given by row 0 in Table 1. This was used exclusively for the phantom acquisitions, with the protocol acquired at lower resolution (5 × 5 × 5 mm) for the homogeneity phantom to increase measurement SNR. Additionally, the homogeneity phantom experiment included the acquisition of a B1 + map using actual flip‐angle imaging 20 with the following sequence parameters: TR1 = 20 ms, TR2 = 100 ms, TE = 2.56 ms, flip angle = 90°, bandwidth = 20 kHz, FOV = 210 × 210 × 210 mm, and resolution = 5 × 5 × 5 mm.
TABLE 1.
Imaging parameters of the protocols used within the presented study and number of acquisitions that each protocol used
| Protocol # | Acquisition protocol | In vivo acquisitions (N) |
|---|---|---|
| 0 |
TI = [100, 200, 300, 400, 500, 600, 700, 800, 1010, 900] TR = [1500, 1500, 1500, 1500, 1500, 1500, 1500, 1500, 1500, 3000] |
0 |
| 1 |
TI = [100, 300, 400, 500, 600, 800, 1010, 900] TR = [1500, 1500, 1500, 1500, 1500, 1500, 1500, 3000] |
12 |
| 2 |
TI = [100, 300, 500, 600, 800, 1010, 900] TR = [1500, 1500, 1500, 1500, 1500, 1500, 3000] |
8 |
| 3 |
TI = [100, 300, 400, 500, 600, 800, 1010] TR = [1500, 1500, 1500, 1500, 1500, 1500, 1500] |
1 |
| 4 |
TI = [400, 500, 600, 800, 1010, 900] TR = [1500, 1500, 1500, 1500, 1500, 3000] |
1 |
| 5 |
TI = [100, 200, 300, 400, 500, 600, 700, 800, 1010] TR = [1500, 1500, 1500, 1500, 1500, 1500, 1500, 1500, 1500] |
2 |
| 6 |
TI = [100, 200, 300, 400, 500, 600, 700, 800] TR = [1500, 1500, 1500, 1500, 1500, 1500, 1500, 1500] |
4 |
| 7 |
TI = [100, 200, 300, 400, 500, 600] TR = [1500, 1500, 1500, 1500, 1500, 1500] |
5 |
Other variants were also used (rows 1–7), reflecting the need to limit total acquisition time for neonatal scanning as per study protocol (protocol 1), abbreviated scanning sessions due to other clinical priorities and neonates awaking from sleep (protocols 2–4), or initial trial versions of the protocol before modification to improve performance for longer relaxation times (protocols 5–7). All data are included to maximize the number of subjects included in the study. Additionally, note that the listed inversion times are those entered on the system′s user interface; the physical inversion times are 5.75 ms longer. Sequences using TR = 1500 ms had a total duration of 3 min 32 s; sequences using TR = 3000 ms had a total duration of 7 min 4 s.
2.2. Reconstruction—data fitting
Magnitude images were exported from the scanner in DICOM format, with the following steps performed for each participant. An initial brain and scalp mask was generated using FSL BET 21 with fractional threshold set to 0.1. This mask was manually edited to exclude the face, mouth, and all anatomy inferior to the brain to allow use of rigid‐body registration in subsequent processing steps. Phantom images were masked by image thresholding using MATLAB (The MathWorks, Natick, MA, USA).
Fitting was performed using MATLAB. The low SNR of ULF MRI and the magnitude‐only image intensities available through data export results in a Rician distribution of image noise. 22 It is appropriate to use statistical parameter‐estimation methods designed for the statistical noise distribution present in the data. In this case, the optimization problem is obtained by maximizing the log‐likelihood function given Rician‐distributed noise, 23 as follows:
| (2) |
where is the cost function; n is an index over the N acquisitions; is the SD of the underlying Gaussian‐distributed noise; I0 is the zeroth‐order modified Bessel function; and dn is the measured signal of the nth acquisition. An estimate of is obtained by finding the mean signal in a region of interest (ROI), manually placed in a region avoiding signal and artifacts, and using the relation . The cost function was minimized for each voxel in the mask using a two‐step procedure. A coarse search was first performed (160000 M0 and T1 combinations, range: [0, 1000] and [50 ms, 4000 ms], respectively) to obtain an estimate of the solution. This was used as the initial point when minimizing the cost function using the fmincon routine, with the solutions constrained to lie in the ranges used in the coarse search. This process yielded M0 and T1 maps.
2.3. Reconstruction—motion compensation
These initial M0 and T1 maps were then used in conjunction with Equation 1 to generate synthetic images for each acquired sequence. These synthetic images were used as registration targets to which the acquired images were registered. The registration is performed with FSL FLIRT 24 , 25 using a rigid‐body transformation and sinc interpolation, with the previously defined mask used to exclude areas that may have undergone nonrigid motion. These registered acquired images were then again used for data fitting. The whole process was repeated until convergence, with local experience indicating that three iterations were sufficient.
2.4. Phantom data analysis
Both phantom data sets (acquired as per protocol 0 in Table 1) were reconstructed with the pipeline outlined previously. However, the contrast phantom data were reconstructed eight times in total, each using the appropriate set of source images as prescribed by protocols 0–7 in Table 1. The T1 of all voxels within each vial were extracted, and the mean and SD calculated. To assess the validity of the acquisition, each protocol and the reconstruction pipeline, a linear weighted least‐squares fit was performed for each protocol and results plotted against concentration (c) of MnCl2 to confirm consistency with the known relationship given by Equation 3, where T1(c = 0) is the unknown relaxation time of the distilled water at 64 mT, and R is the concentration of added salt (in mM). The r 2 for each fit was used to evaluate data to model consistency.
| (3) |
2.5. In vivo ROI analysis
The final set of synthesized in vivo neonatal images were visually examined by a single reader (FP) to place ROIs in the deep gray matter (putamen/caudate), frontal white matter, and cerebellum. For each anatomical location, ROIs of size 2 × 2 × 2 voxels were placed on both the left and right of the brain. The mean and SD T1 values were calculated for each anatomical location to obtain per subject values. A group analysis was performed by calculating a weighted linear regression to predict T1 as a function of postmenstrual age; the weights were taken as the inverse square of the SDs.
3. RESULTS
Figure 2 shows the results of the contrast phantom validation experiment. Figure 2A shows the measured T1 versus concentration for protocol 0, with datapoints and error bars indicating the mean and SDs of all voxels within each vial. The dashed black lines indicate the fit to Equation 3. The r 2 values of the fits to Equation 3 were greater than 0.997 for all protocols, indicating that the pulse sequence, protocols, and reconstruction pipeline are valid.
FIGURE 2.
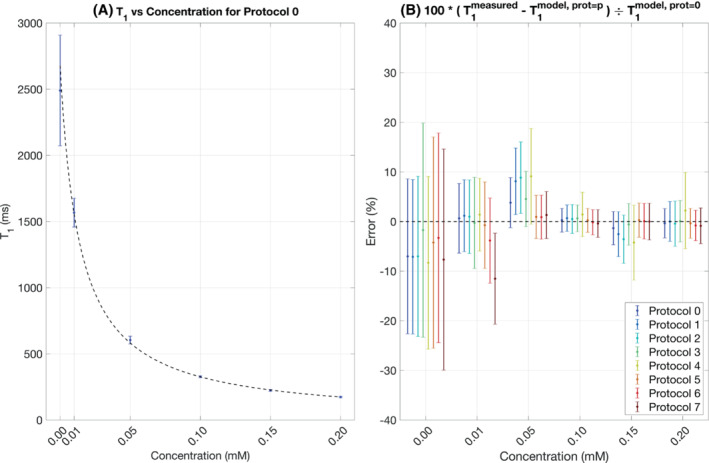
Results of the contrast phantom validation experiment.
Figure 2B shows the results of reconstructing the contrast phantom data presuming the acquisition protocols outlined in Table 1. The vertical axes show the fractional difference between the measured T1s versus those predicted via the model fit for protocol 0. All but three measurements (protocol 7, 0.01 mM; protocols 1 and 2, 0.05 mM) are within 1 SD of the model. Different protocols show different degrees of bias and variance as compared with protocol 0, and differences are seen as a function of T1.
The results of the homogeneity phantom experiment are shown in Figure 3. Figure 3A shows the B1 + of three orthogonal slices through the phantom. Although there is little appreciable inhomogeneity in the transverse plane (top row), there is a 15%–20% variation in the superior–inferior direction. This is shown further by the black line profiles in the second and third rows of Figure 3B. Despite the B1 + inhomogeneity present, Figure 3C,D demonstrates that this does not introduce spatial variation in the T1 measurements.
FIGURE 3.
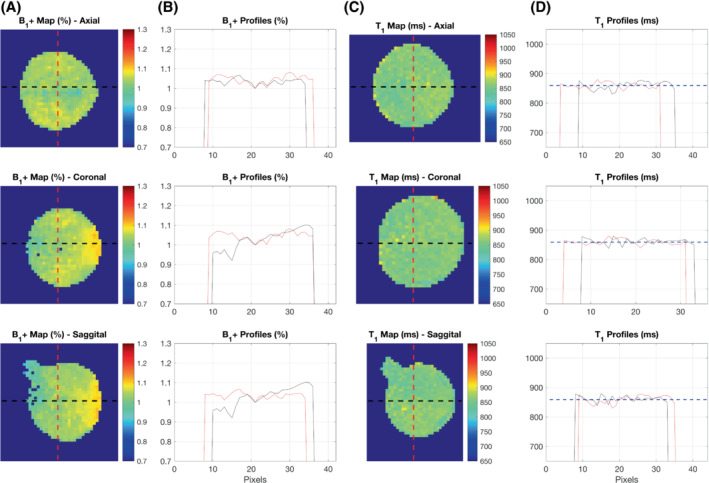
Results of the homogeneity phantom validation experiment
Supporting Information Videos S1 and S2 show the effect of the intersequence motion‐correction pipeline for 3 participants with varying degrees of motion. In each case, the top row shows the source data before intersequence motion correction, and the bottom row shows the source data after three iterations of the proposed reconstruction pipeline. Although there is still motion present in the images after correction, motion is only present outside of the brain parenchyma; the brain after correction is static.
Example data from 1 subject (gestation 33+2, postmenstrual age 34+0) are shown in Figure 4. Figure 4A shows the three axial slices containing the selected ROIs for all acquired sequences, with the center of each ROI in a single hemisphere marked. Figure 4B,C shows M0 and T1 maps for the same slices. Figure 4D–F shows the intensity of the center pixel of each selected ROI (blue points). To allow visual evaluation of the fitting procedure, the measured M0 and T1 were used in conjunction with Equation 1 to predict the signal as a function of TI assuming TR = 1500 ms (red line) and for TI = 900 ms and TR = 3000 ms (red cross).
FIGURE 4.
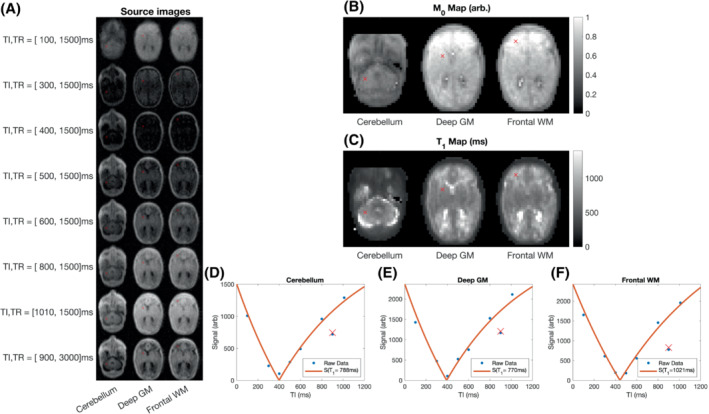
Three slices from a single neonate (gestation 33+2, postmenstrual age 34+0). A, Source images for each T1‐weighted acquisition. B,C, M0 and T1 maps. D–F, Raw datapoints (blue dots) and predicted signals (red lines/cross) based on measured T1 and M0. The blue datapoint/red cross away from the curve corresponds to the TR = 3000 ms datapoint, and therefore belongs to a separate inversion‐recovery curve.
The impact of image registration on T1 map quality is shown in Figure 5. Figure 5A,B shows coronal and axial T1 maps for the three iterations of the reconstruction pipeline. Later iterations of the T1 maps have fewer spurious individual pixels intensities, as for example in the deep gray matter that has a more uniform appearance. Figure 5C,D shows RMS error maps (between the input images and the predicted images) as a fraction of the average input image pixel intensity across acquisitions at each iteration. The relative RMS error decreases for increasing number of iterations.
FIGURE 5.
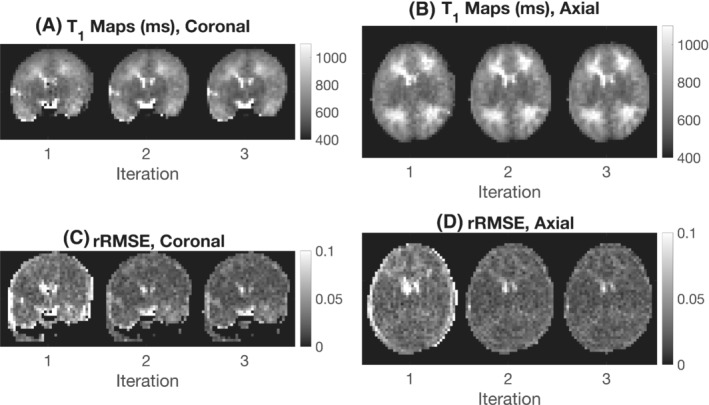
The effect of motion correction on T1 maps of a neonate born at 38+3 gestation and imaged at 41+0 postmenstrual age. A,B, Coronal and axial T1 maps for three iterations of the reconstruction pipeline. C,D, Coronal and axial relative RMS error maps between the input images and predicted output images at each iteration
Example T1 maps for 8 subjects ordered by postmenstrual age at scan in weeks 31–49 are shown in Figure 6. Maps have isotropic voxel size and demonstrate the ability to differentiate white matter, gray matter, and CSF spaces.
FIGURE 6.
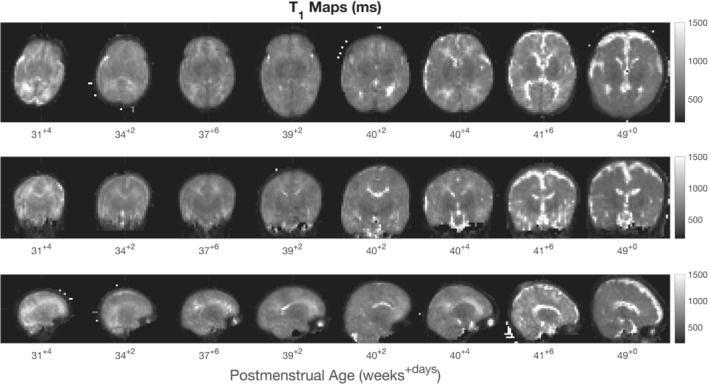
T1 maps of 8 subjects over the full age range of neonates scanned in this study
The T1 values plotted against postmenstrual age are shown in Figure 7. Reduction of T1 with postmenstrual age is observed in all three brain regions, with the change in T1 per week and 95% confidence intervals given by dT1 = −21 ms/week [−25, −16] (cerebellum), dT1 = −14 ms/week [−18, −10] (deep gray matter), and dT1 = −35 ms/week [−45, −25] (white matter).
FIGURE 7.
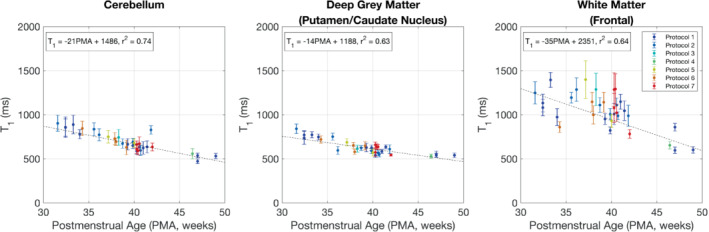
T1 versus postmenstrual age. The color of each datapoint indicates the acquisition protocol from Table 1
4. DISCUSSION
This study presents the first results from an acquisition method and novel reconstruction pipeline to achieve motion‐compensated T1 relaxation rate mapping in the neonatal brain at 64 mT.
The proposed methodology used an inversion‐recovery turbo spin echo for image acquisition. This sequence was chosen due to its widespread use in prior T1 mapping publications, including at ULF. 26 While individual sequence acquisition times were short (3 min 32 s or 7 min 4 s, depending on TR), the overall protocols ranged from 21 to 32 min. Although this extended protocol duration is viable for a research study, future work could use methods that acquire data in a shorter amount of time, allowing for clinical use when time is more limited. 27
The present study used a varying protocol across our cohort. This reflected the practicalities of imaging neonates in a neonatal unit where a scan may be terminated early to prioritize other clinical work, as well as intentional modifications to the protocol to improve accuracy for longer relaxation times. Future work will use a protocol that is optimized using the appropriate efficiency metric 28 for the range of T1s we have observed in neonates, accounting for a desired protocol duration as well as the possibility of individual sequence failures due to motion, and the fact that any protocol may be truncated due to competing clinical pressures.
The results show that measured neonatal brain T1 values at ULF are shorter than those at standard clinical field strengths, 12 , 13 , 14 , 29 but longer than those of adults at ULF. 26 The results also show that T1 reduces with postmenstrual age, which is thought to reflect an interplay between maturation and key facets of brain‐tissue composition including water content and myelination. Although this trend is consistent with literature obtained at higher fields, 13 , 29 at ULF we observe larger fractional reductions in T1 than at higher field. Schneider et al 13 found that normative T1 values at 3 T in the thalamus and frontal white matter dropped 11% and 4%, respectively, between approximately 30 and 40 weeks′ gestation, whereas at 64 mT the measured T1 reduces in the deep gray matter and frontal white matter by 18% and 26%, respectively.
While this study performed T1 mapping in vivo, the paper by Koenig 18 presented values from unfixed samples excised from a 4‐day‐old neonate who had died due to meconium aspiration. Ex vivo samples from the cortical gray matter and subcortical white matter of the subject′s left parietal lobe had T1 values at 64 mT of 494 ms and 655 ms, respectively. Although the gray‐matter sample is consistent with our results (529–841 ms), the white‐matter sample (taken 4 days after delivery) is considerably lower than our measurements at that age range (781–1292 ms).
Future work will use the presented methodology to explore T1 variation in more extremely premature infants, in addition to investigating the impact of mode of delivery, age of infant from birth, and pathology. Furthermore, we hope to use these methods to optimize T1‐weighted structural imaging in this population, as well as to validate measures of brain development that can be used wherever ULF point‐of‐care MRI can be deployed.
FUNDING INFORMATION
The Bill and Melinda Gates Foundation; the Medical Research Council (MRC; MR/V036874/1); the Wellcome/EPSRC Center for Medical Engineering (WT 203148/Z/16/Z); a Medical Research Council Center for Neurodevelopmental Disorders grant (MR/N026063/1); an MRC Clinician Scientist Fellowship (MR/P008712/1); an MRC Translation Support Award (MR/V036874/1); and a Sir Henry Dale Fellowship jointly funded by the Wellcome Trust and the Royal Society (206675/Z/17/Z)
CONFLICT OF INTEREST
Francesco Padormo was employed by the Guy′s & St. Thomas′ NHS Foundation Trust during experimental design, recruitment, all infant data collection, and before submission of the manuscript, but is now an employee of Hyperfine Inc. Lori Arlinghaus, John Pitts, Tianrui Luo, and Dingtian Zhang are employed by Hyperfine Inc.
Supporting information
Video S1 Top row: Coronal images before motion compensation. Contrast changes across the volume are seen due to varying sequence parameters, and interimage motion is observed. Bottom row: After intervolume motion compensation, the brain remains static in the frame. Nonlinear motion is still observed outside of the head but is not relevant for T1 mapping in the brain
Video S2 Top row: Sagittal images before motion compensation. Contrast changes across the volume are seen due to varying sequence parameters, and interimage motion is observed. Bottom row: After intervolume motion compensation, the brain remains static in the frame. Nonlinear motion is still observed outside of the head, but is not relevant for T1 mapping in the brain
ACKNOWLEDGMENT
The authors thank Dr Nathan Artz for his input during the initial stages of this project. They also thank Christopher Bunton and Raminta Kniuraite for their assistance with the phantom construction.
Padormo F, Cawley P, Dillon L, et al. In vivo T1 mapping of neonatal brain tissue at 64 mT . Magn Reson Med. 2023;89:1016–1025. doi: 10.1002/mrm.29509
Funding information Bill and Melinda Gates Foundation, Engineering and Physical Sciences Research Council, Grant/Award Number: WT 203148/Z/16/Z; Medical Research Council, Grant/Award Numbers: MR/P008712/1; MR/V036874/1; Royal Society, Grant/Award Number: 206675/Z/17/Z; Wellcome Trust, Grant/Award Number: WT 203148/Z/16/Z
REFERENCES
- 1. Turpin J, Unadkat P, Thomas J, et al. Portable magnetic resonance imaging for ICU patients. Crit Care Explor. 2020;2:e0306. [DOI] [PMC free article] [PubMed] [Google Scholar]
- 2. Sheth KN, Mazurek MH, Yuen MM, et al. Assessment of brain injury using portable, low‐field magnetic resonance imaging at the bedside of critically ill patients. JAMA Neurol. 2021;78:41‐47. [DOI] [PMC free article] [PubMed] [Google Scholar]
- 3. Mazurek MH, Cahn BA, Yuen MM, et al. Portable, bedside, low‐field magnetic resonance imaging for evaluation of intracerebral hemorrhage. Nat Commun. 2021;12:5119. [DOI] [PMC free article] [PubMed] [Google Scholar]
- 4. Marques JP, Simonis FFJ, Webb AG. Low‐field MRI: an MR physics perspective. J Magn Reson Imaging. 2019;49:1528‐1542. [DOI] [PMC free article] [PubMed] [Google Scholar]
- 5. Wald LL, McDaniel PC, Witzel T, Stockmann JP, Cooley CZ. Low‐cost and portable MRI. J Magn Reson Imaging. 2020;52:686‐696. [DOI] [PMC free article] [PubMed] [Google Scholar]
- 6. Holland BA, Haas DK, Norman D, Brant‐Zawadzki M, Newton TH. MRI of normal brain maturation. Am J Neuroradiol. 1986;7:201‐208. [PMC free article] [PubMed] [Google Scholar]
- 7. Rutherford MA, Pennock JM, Murdoch‐Eaton DM, Cowan FM, Dubowitz LM. Athetoid cerebral palsy with cysts in the putamen after hypoxic‐ischaemic encephalopathy. Arch Dis Child. 1992;67:846‐850. [DOI] [PMC free article] [PubMed] [Google Scholar]
- 8. Barkovich AJ, Kjos BO, Jackson DE, Norman D. Normal maturation of the neonatal and infant brain: MR imaging at 1.5 T. Radiology. 1988;166:173‐180. [DOI] [PubMed] [Google Scholar]
- 9. Zhai G, Lin W, Wilber KP, Gerig G, Gilmore JH. Comparisons of regional white matter diffusion in healthy neonates and adults performed with a 3.0‐T head‐only MR imaging unit. Radiology. 2003;229:673‐681. [DOI] [PubMed] [Google Scholar]
- 10. Annink KV, van der Aa NE, Dudink J, et al. Introduction of ultra‐high‐field MR imaging in infants: preparations and feasibility. Am J Neuroradiol. 2020;41:1532‐1537. [DOI] [PMC free article] [PubMed] [Google Scholar]
- 11. O′Reilly T, Teeuwisse WM, de Gans D, Koolstra K, Webb AG. In vivo 3D brain and extremity MRI at 50 mT using a permanent magnet Halbach array. Magn Reson Med. 2021;85:495‐505. [DOI] [PMC free article] [PubMed] [Google Scholar]
- 12. Williams L‐A, Gelman N, Picot PA, et al. Neonatal brain: regional variability of in vivo MR imaging relaxation rates at 3.0 T—initial experience. Radiology. 2005;235:595‐603. [DOI] [PubMed] [Google Scholar]
- 13. Schneider J, Kober T, Bickle Graz M, et al. Evolution of T1 relaxation, ADC, and fractional anisotropy during early brain maturation: a serial imaging study on preterm infants. Am J Neuroradiol. 2016;37:155‐162. [DOI] [PMC free article] [PubMed] [Google Scholar]
- 14. Kulikova S, Hertz‐Pannier L, Dehaene‐Lambertz G, Buzmakov A, Poupon C, Dubois J. Multi‐parametric evaluation of the white matter maturation. Brain Struct Funct. 2015;220:3657‐3672. [DOI] [PMC free article] [PubMed] [Google Scholar]
- 15. Eminian S, Hajdu SD, Meuli RA, Maeder P, Hagmann P. Rapid high resolution T1 mapping as a marker of brain development: normative ranges in key regions of interest. PLOS One. 2018;13:e0198250. [DOI] [PMC free article] [PubMed] [Google Scholar]
- 16. Kühne F, Neumann W‐J, Hofmann P, Marques J, Kaindl AM, Tietze A. Assessment of myelination in infants and young children by T1 relaxation time measurements using the magnetization‐prepared 2 rapid acquisition gradient echoes sequence. Pediatr Radiol. 2021;51:2058‐2068. [DOI] [PMC free article] [PubMed] [Google Scholar]
- 17. Grotheer M, Rosenke M, Wu H, et al. White matter myelination during early infancy is linked to spatial gradients and myelin content at birth. Nat Commun. 2022;13:997. [DOI] [PMC free article] [PubMed] [Google Scholar]
- 18. Koenig SH, Brown RD, Spiller M, Lundbom N. Relaxometry of brain: why white matter appears bright in MRI. Magn Reson Med. 1990;14:482‐495. [DOI] [PubMed] [Google Scholar]
- 19. Rearick T, Charvat GL, Rosen MS, Rothberg JM, inventors; Hyperfine Research, Inc. assignee. Noise suppression methods and apparatus. US Patent 9,547,057. January 17th 2017.
- 20. Yarnykh VL. Actual flip‐angle imaging in the pulsed steady state: a method for rapid three‐dimensional mapping of the transmitted radiofrequency field. Magn Reson Med. 2007;57:192‐200. [DOI] [PubMed] [Google Scholar]
- 21. Smith SM. Fast robust automated brain extraction. Hum Brain Mapp. 2002;17:143‐155. [DOI] [PMC free article] [PubMed] [Google Scholar]
- 22. Gudbjartsson H, Patz S. The rician distribution of noisy mri data. Magn Reson Med. 1995;34:910‐914. [DOI] [PMC free article] [PubMed] [Google Scholar]
- 23. Karlsen OT, Verhagen R, Bovée WMMJ. Parameter estimation from Rician‐distributed data sets using a maximum likelihood estimator: application to T1 and perfusion measurements. Magn Reson Med. 1999;41:614‐623. [DOI] [PubMed] [Google Scholar]
- 24. Jenkinson M, Smith S. A global optimisation method for robust affine registration of brain images. Med Image Anal. 2001;5:143‐156. [DOI] [PubMed] [Google Scholar]
- 25. Jenkinson M, Bannister P, Brady M, Smith S. Improved optimization for the robust and accurate linear registration and motion correction of brain images. Neuroimage. 2002;17:825‐841. [DOI] [PubMed] [Google Scholar]
- 26. O′Reilly T, Webb AG. In vivo T1 and T2 relaxation time maps of brain tissue, skeletal muscle, and lipid measured in healthy volunteers at 50 mT. Magn Reson Med. 2022;87:884‐895. [DOI] [PMC free article] [PubMed] [Google Scholar]
- 27. Ma D, Gulani V, Seiberlich N, et al. Magnetic resonance fingerprinting. Nature. 2013;495:187‐192. [DOI] [PMC free article] [PubMed] [Google Scholar]
- 28. Leitão D, Teixeira RPAG, Price A, Uus A, Hajnal JV, Malik SJ. Efficiency analysis for quantitative MRI of T1 and T2 relaxometry methods. Phys Med Ampmathsemicolon Biol. 2021;66:15NT02. [DOI] [PMC free article] [PubMed] [Google Scholar]
- 29. Maitre NL, Slaughter JC, Stark AR, Aschner JL, Anderson AW. Validation of a brain MRI relaxometry protocol to measure effects of preterm birth at a flexible postnatal age. BMC Pediatr. 2014;14:84. [DOI] [PMC free article] [PubMed] [Google Scholar]
Associated Data
This section collects any data citations, data availability statements, or supplementary materials included in this article.
Supplementary Materials
Video S1 Top row: Coronal images before motion compensation. Contrast changes across the volume are seen due to varying sequence parameters, and interimage motion is observed. Bottom row: After intervolume motion compensation, the brain remains static in the frame. Nonlinear motion is still observed outside of the head but is not relevant for T1 mapping in the brain
Video S2 Top row: Sagittal images before motion compensation. Contrast changes across the volume are seen due to varying sequence parameters, and interimage motion is observed. Bottom row: After intervolume motion compensation, the brain remains static in the frame. Nonlinear motion is still observed outside of the head, but is not relevant for T1 mapping in the brain