

Abstract
Noting that some theropod dinosaurs had large brains, large grasping hands, and likely binocular vision, paleontologist Dale Russell suggested that a branch of these dinosaurs might have evolved to a human intelligence level, had dinosaurs not become extinct. I offer reasons why the likely pallial organization in dinosaurs would have made this improbable, based on four assumptions. First, it is assumed that achieving human intelligence requires evolving an equivalent of the about 200 functionally specialized cortical areas characteristic of humans. Secondly, it is assumed that dinosaurs had an avian nuclear type of pallial organization, in contrast to the mammalian cortical organization. Thirdly, it is assumed that the interactions between the different neuron types making up an information processing unit within pallium are critical to its role in analyzing information. Finally, it is assumed that increasing axonal length between the neuron sets carrying out this operation impairs its efficacy. Based on these assumptions, I present two main reasons why dinosaur pallium might have been unable to add the equivalent of 200 efficiently functioning cortical areas. First, a nuclear pattern of pallial organization would require increasing distances between the neuron groups corresponding to the separate layers of any given mammalian cortical area, as more sets of nuclei equivalent to a cortical area are interposed between the existing sets, increasing axon length and thereby impairing processing efficiency. Secondly, because of its nuclear organization, dinosaur pallium could not reduce axon length by folding to bring adjacent areas closer together, as occurs in cerebral cortex.
Keywords: Avian Brain, Dinosaur Evolution, Connectivity, Axonal Length, Troodon, Humans, Intelligence
Graphical Abstract

Images showing models of the theropod dinosaur Troodon formosus and the dinosaur humanoid proposed by Russell and Seguin (1982). Noting that theropod dinosaurs such as troodon had large brains, large grasping hands, and likely binocular vision, Russell and Seguin suggested that a branch of these dinosaurs might have evolved to a human intelligence level, had dinosaurs not become extinct. I offer reasons why the likely avian-type pallial organization in dinosaurs would have made this improbable, based on the axonal inefficiencies inherent to the avian pallial design. These inefficiencies do not hinder high level cognitive functioning in living birds, but they might have become problematic with an expansion to the equivalent of the approximately 200 functionally specialized cortical areas characteristic of humans.
Current Views of Dinosaur Behavioral Sophistication
Over the past fifty years, the scientific view and public image of the intelligence and behavioral sophistication of dinosaurs has undergone considerable transformation. While dinosaurs were once considered to be slow-witted, slow-moving reptiles whose very lack of behavioral flexibility and learning skills might have contributed to their demise, the members of many dinosaur species are now recognized to have functioned at an avian level of behavioral complexity (Hopson, 1977; Erickson, 1999; Horner, 1982, 1987; Meng et al., 2004; Varricchio et al., 2008; Pol et al., 2021). This notion is supported by paleontological evidence regarding dinosaur social behavior and by data on dinosaur brain size - body size relationships. With regard to the former, studies of dinosaur trackways indicate herding behavior and adult care of juvenile members of the species among various theropod, sauropod and ornithopod dinosaurs (see Figure 1 for an evolutionary tree showing dinosaur classification and relationships) (Hopson, 1977; Ostrom, 1986; Pol et al., 2021). The discovery and study of dinosaur nesting sites has indicated that theropod, sauropod and ornithopod dinosaur species also nested in groups and engaged in maternal care of hatchling dinosaurs, with some evidence suggesting bi-parental care (Hopson, 1977; Horner, 1982, 1987; Meng et al., 2004; Varricchio et al., 2008; Grellet-Tinner and Fiorelli, 2010; Pol et al., 2021). Studies of trackways of carnivorous theropod dinosaurs, such as the dromaeosaurid deinonychus, has provided evidence that they hunted in packs (Erickson, 1999; Li et al., 2008). Such social and parental behaviors are largely uncharacteristic of extant reptiles, other than some maternal behavior in crocodilians (Hopson, 1977; Tullberg et al., 2002), and are more reminiscent of the flocking/herding, hunting and parental behaviors shown by birds and mammals.
Figure 1.

Dendrogram showing the evolutionary relationships among the major groups of dinosaurs, and the relationship of dinosaurs to the extinct flying reptiles known as pterosaurs and the still extant crocodilians. Note the node showing that pterosaurs, crocodilians and dinosaurs all have a common origin and are collectively referred to as archosaurs. Similarly, all dinosaurs have a common nodal origin, and are divided into two groups based on their hip structure, the bird-hipped ornithischians (red) and the lizard-hipped saurischians (blue). The ornithischians, despite their name, did not give rise to birds, and include several groups, including the armored dinosaurs (stegosaurs and ankylosaurs), the herbivorous ornithopods (which were facultative bipeds and included the iguanodontids, the duckbilled hadrosaurs, and the crested lambeosaurs), the horned ceratopsians, and the dome-headed pachycephalosaurs. Saurischian dinosaurs are divided into two major groups, the long-necked, herbivorous sauropods (which included the massive, four-legged neosauropods such as diplodocus, apatosaurus and brachiosaurus), and the bipedal, typically carnivorous theropods. The theropods did give rise to birds, and include various subgroups. Among these, the maniraptorans include small to medium-sized bipedal dinosaurs with relatively large grasping hands, such as the oviraptorids, the dromaeosaurids (which include velociraptor and deinonychus, notably), and the troodontids. Although archaeopteryx and extant birds were also in the maniraptoran group, their forelimbs obviously became specialized for flight. The dromaeosaurids, the troodontids, archaeopteryx, and extant birds were or are feathered, and make up the paraves.
Analysis of brain size relative to body size reinforces the conclusion from paleontological behavioral data that at least some dinosaur species rivaled living birds and mammals in behavioral sophistication (Hopson, 1977; Jerison, 1973; Ksepa et al., 2020; Knoll et al., 2021; Russell and Seguin, 1982; Balanoff et al., 2013). For example, although brain size - body size ratios for many dinosaur species tend to be within the range of extant reptiles, many of the theropod dinosaurs show ratios greater than those for living reptiles (for example, allosaurids and tyrannosaurids), and maniraptorid theropod dinosaurs show brain - body ratios that approach those of birds (Fig. 2) (Hopson, 1977; Jerison, 1973; Ksepa et al., 2020). One dinosaur currently known as troodon (Troodon formosus), but once known as Stenonychosaurus inequalis, in particular, shows a brain - body size ratio falling within the lower edge of the largely superimposed avian and mammalian ranges (Figs. 2, 3) (Jerison, 1973; Hopson, 1977; Russell and Seguin, 1982). Based on the similar brain size – body size scaling exhibited by living basal birds and theropod dinosaurs, Herculano-Houzel (2022) has, in fact, suggested that telencephalic neuron abundance may also scale similarly for these two groups, with larger theropods thus potentially having rivaled some extant non-simian primate species such as baboons and capuchin monkeys in total telencephalic neuron abundance (Olkowicz et al., 2016). Thus, the notion that dinosaurs were unsophisticated in their behavioral repertoires and that they dominated the land for over 150 million years because evolution had not yet brought forth a better alternative is untenable. The apparently avian level of behavioral and neural sophistication of many dinosaurs, particularly theropod dinosaurs, readily explains their long reign as dominant land vertebrates, until their extinction due to the cataclysmic asteroid strike at the end of Cretaceous period, 65 million years ago (Alvarez et al., 1980, 1984; Alvarez, 1987).
Figure 2.

This image shows a graph redrawn and modified from Figure 1 of Hopson (1977), which presents a comparison of brain-body size relationships, expressed on a log-log scale, for living reptiles, birds, and mammals in comparison to dinosaurs, with the range of variation for each group enclosed in a minimum convex polygon. Each polygon is color-coded to the named vertebrate group it represents. For purposes of comparisons of interest here, dots are shown for the brain – body ratio for the paravian theropod dinosaur troodon, for the ornithomimid theropod dinosaur ornithomimus, for the large carnivorous theropod dinosaurs allosaurus and tyrannosaurus, for the neosauropod dinosaurs diplodocus and brachiosaurus, for the ornithopod dinosaur iguanodon, for the horned dinosaur triceratops, for the armored stegosaurid dinosaur kentrosaurus, for the extant archosaurian reptile the alligator, and for the mammals, mole, opossum, gorilla, human and blue whale. Note troodon falls at the lower edge of the overlapping bird-mammal range. Saurischian dinosaurs are indicated by blue dots and ornithischian dinosaurs by red dots. Mammals and non-dinosaur reptiles are shown with black dots.
Figure 3.

Image A shows endocasts of ostrich, wandering albatross, and troodon from the dorsal view. The troodon endocast shows lengthy olfactory bulbs, differing from the birds in this regard, but otherwise showing a similarly shaped telencephalon and cerebellum. The image is a modified version of Figure 3 from Dinosaur Brains by Harry Jerison in the 3rd edition of the Encyclopedia of Neuroscience (Adelman G, Smith BH, eds) (2004), which was provided Dr. Harry Jerison. The image has been modified by removing the background, adding a scale bar, and trimming non-neural fringe from the troodon endocast. Image B was also provided by Harry Jerison and shows a perspective view of the troodon endocast.
Could a Dinosaur Have Evolved to a Human Level of Intelligence?
Dinosaurs were a varied group, and consisted of two major subgroups that were defined by the differences in their pelvic bone structure – the ornithischians and the saurischians (Fig. 1). The former included the four-legged armored dinosaurs, such as the ceratopsians, the stegosaurids and the ankylosaurids, as well as the bipedal duck-billed ornithopod dinosaurs, while saurischians included the four-legged herbivorous sauropods and the two-legged generally carnivorous theropods (Sereno, 1998; Benton, 2004). Although evidence for complex behaviors such as herding and nesting has been found for both ornithischians and saurischians, not all dinosaurs possessed high brain - body size ratios (Fig. 2) (Jerison, 1973; Hopson, 1977). In particular, theropods tended to show the highest brain - body size ratios among dinosaurs, and likely also the highest telencephalic neuron abundances, as noted above. Some theropods, such as troodon and other troodontid and maniraptoran theropod dinosaurs (for example, the dromaeosaurids velociraptor and deinonychus), have been documented as having especially large brains for their body size, based on endocast data and skeletal reconstructions, respectively (Figs. 2, 3) (Jerison, 1973; Hopson, 1977; Russell and Seguin, 1982; Witmer and Ridgely, 2009; Balanoff et al., 2013; King et al., 2020). As noted above, troodon was found to conservatively have a brain size - body size ratio at the lower edge of the superimposed avian and mammalian ranges (Fig. 2). Based on eye position and size, troodon and other dromaeosaurid dinosaurs must have also had keen stereoscopic vision (Fig. 4A, B) (Hopson, 1977; Russell and Seguin, 1982). Additionally, these dinosaurs had long arms and large hands with fingers that appear to have been capable of grasping objects (Fig. 4A, B). This set of traits in troodon and other maniraptorans is reminiscent of the set of traits that are thought to have pre-adapted simians to undergo selection for increases in the cognitive and motor capacity that allowed more complex manipulations of objects and the planning abilities to facilitate those manipulations (resulting in complex tool making and use), and ultimately the cognitive complexity to allow the syntactically ordered symbolic communication system called language (Lovejoy, 1981; Russell and Seguin, 1982; Sherwood et al., 2012; Wilson, 2012; Herculano-Houzel, 2018; Dehaene et al., 2022). The intellectual gap between humans and all other species is emphasized by even just a few of the uniquely human achievements, such as the harnessing of fire and the invention of the wheel. No other animal species has accomplished these, or anything close. Humans have then used their unique cognitive and linguistic abilities to transmit and accumulate innovation across generations, leading to such exclusively human attainments as agriculture, dwellings, cities, technology, science, mathematics, art and music (Boyd, 2017). Note that many authors have addressed the use of the term “intelligence” in an ethological context, describing criteria and tests for comparing among species (Hodos, 1988; Reader et al., 2011; Roth, 2015).
Figure 4.

Images of Troodon formosus (formerly named Stenonychosaurus inequalis) and the dinosaur humanoid proposed by Russell and Seguin (1982). Image A shows an artist recreation of troodon with a natural habitat as background, while image B shows a model of troodon next to a model of the dinosaur humanoid proposed by Russell and Seguin (1982). Note these depictions predate findings indicating that troodon was feathered, but the absence of feathers in these depictions aids in showing the large hand and eye size of troodon. Image C shows a drawing of the dinosaur humanoid to more clearly show its human-like features. Note the plantigrade feet in the dinosaur humanoid, as contrasted to the typical theropod/avian digigrade feet. Image D shows the commander of a fictional extraterrestrial race of humanoid reptiles called the Gorn, from the original Star Trek television series, to indicate the intrigue that humanoid reptiles hold in popular culture. Image A is by John Sibbick from David Norman: The Illustrated Encyclopedia of Dinosaurs, Salamander Books Limited, New York (1985), and is used with his permission. Image B is widespread on the internet, and was originally created by the Canadian Museum of Nature. Image C is Dale Russell’s dinosaur humanoid as drawn by John Sibbick, from David Norman: The Illustrated Encyclopedia of Dinosaurs, Salamander Books Limited, New York (1985), and is used with his permission. Image D is downloaded from the Wikipedia site devoted to the fictional Gorn species, and is widespread on the internet.
Why then did troodon or some similar dinosaur not evolve in the direction taken by primates during human evolution? Troodon evolved late in dinosaur evolution, 77 million years ago (Russell and Seguin, 1982), and the catastrophic extinction of dinosaurs 12 million years later may not have allowed sufficient time for such evolution, since it required about 50 million years for modern humans to evolve from early simians (Martin, 1993). But if the catastrophic extinction had not occurred, could troodon have evolved along a simian - like path? Could a human level of intelligence have been reached? At least one paleontologist has speculated that, in fact, dinosaur humanoids1 could have evolved from a troodon-type beginning, possibly even reaching a modern human level of intelligence, if given that time (Fig. 4B, C) (Russell and Seguin, 1982).
Although other authors have questioned the speculation of Russell and Sequin (1982) based on consideration of the pelvic and hindlimb transformations required to reach the humanoid shape proposed by Russell and Sequin (Paul, 1988; Naish and Tattersdill, 2021), my goal here is to evaluate this speculation from the point of view of the likely brain anatomy of troodon, and dinosaurs in general. Note that consideration of whether dinosaurs could have evolved to a human level of intelligence is of interest for several reasons. First, it addresses the issue of equipotentiality in evolution. Can a similar end point be reached from different starting points? While it is clear that some structures such as wings can evolve from different tissues, the starting point nonetheless constrains the outcome (Alberch, 1982; Gould, 2002; Gerber, 2014; Alexander, 2015). It is of interest to know if evolution of intelligence is a trait that is constrained by the features of brain organization in the early members of a line. Secondly and relatedly, it is of interest to know, or at least consider, if the evolution of the human brain and the cognitive capacity that goes along with it was a unique event that was made possible by features of telencephalic organization incidentally present in ancestral mammals, but not present in the ancestors of dinosaurs and birds. Note also, that the issue of whether dinosaurs could have evolved into humanoids is of interest for popular culture reasons, as well, given the many science fiction books, television shows, and movies that include reptilian humanoids as a plot premise, for example the Gorn commander that did combat with Captain Kirk in the 18th episode of the first season of the original Star Trek television series (the Gorn commander losing, of course) (Fig. 4D). Similarly, in the 65th episode of the Star Trek: Voyager television series, the crew of the starship Voyager encountered a sentient reptilian species called the Voth that was revealed to be the descendants of a highly advanced race of ornithpod dinosaurs from earth that had colonized deep space. While the what-if type of speculation offered by Russell and Sequin (1982) is problematic to evaluate definitively, given that we cannot re-run earth history without the asteroid strike that killed dinosaurs, there are lines of reasoning that can be applied that have as their underpinning a series of credible assumptions, based on existing data or lines of thought. These assumptions are discussed below.
Assumptions for Evaluating the Possibility of Evolution of a Dinosaur to a Human Level
Four assumptions are made here in evaluating this issue. These assumptions have to do with the necessary organizational features of a brain if it is to support a human level of intelligence and with the likely organization of the brains of dinosaurs.
1. About 200 Cortical Areas as a Prerequisite for a Human Intelligence Level.
Jerison developed a concept called the encephalization quotient (EQ) by which to use brain – body ratios to assess intelligence (Jerison, 1973). The EQ essentially measures the extent to which a brain exceeds the size needed to operate the sensory and motor functions of a body of a given size, with that extra brain matter then presumptively related to higher order perception, cognition, and motor planning. In this regard then, the uniquely high intelligence level of humans is associated with an EQ much higher than that of any other species (Jerison, 1973). Taking a different approach, several research groups have noted that brain size alone can be misleading because neuron density can vary from species to species for a given brain size, with total neuron abundance then being a more likely predictor of computational power than brain size alone (Herculano-Houzel, 2009, 2017; Olkowicz et al., 2016; Kverková et al., 2022; Sol et al., 2022). In this regard then, neuron abundance in the cerebral cortex (also commonly called neocortex) in humans (16.3 billion) has been reported to greatly exceed that in any other vertebrate group, including gorillas (9 billion) and chimpanzees (6–7 million) (Azevado et al., 2009; Herculano-Houzel, 2009, 2017; Olkowicz et al., 2016). This is true as well for species with larger brains than in humans but much lower neuron density, such as African elephants with 11 billion by histology-based estimates (Roth and Dicke) but 5.6 billion by more recent isotropic fractionator-based estimates (Herculano-Houzel et al., 2014), and false killer whales with 10.5 billion by histology-based estimates (Roth and Dicke, 2005) but predicted to be more in the 3–4 billion range by more recent isotropic fractionator-based considerations (Kazu et al., 2014). Underlying both the high EQ and the high cortical neuron abundance of humans is the great expansion of the cerebral cortex, not just in total areal extent or weight, but also in the number of separate functionally distinguishable units of which it consists, which are called cortical areas and which are in many but not all cases also cytologically distinct from one another. Cortical areas tend to be modality-specific, for example visual areas, and cortical areas within a given modality tend to be near one another, organized hierarchically and engage in increasingly higher-order and more abstract information processing (Fellemen and Van Essen, 1991; Young et al., 1994; Van Essen, 2013). Many cortical areas in humans, additionally, seem to integrate information across modalities, and are thus considered associative areas, and thought to be a major substrate for higher-order cognition and intelligence (Kaas and Preuss, 2014; Ströckens et al., 2022).
As the first assumption for my argument about the evolution of a dinosaur to a human intelligence level, it is assumed here that a human level of intelligence would require a number of cortical areas, or the equivalent of cortical areas in the case of birds, reptiles and dinosaurs (as will be discussed below), comparable to that found in humans. An increase in functionally and/or cytologically distinct cortical areas rather than the increase in brain size or neuron abundance per se is here considered to be required to achieve a human level of intelligence (Rakic, 2009; Dicke and Roth, 2016). As noted above, the increase in brain size in humans is assumed, in large part, to be the manifestation of the increase in the number of cortical areas, as well as the increase in the size of the various subcortical areas related to the new cortical areas. This first assumption is based on empirical observations of the abundance of cortical areas in diverse mammalian species and their scoring on various indices of intelligence (Fig. 5A). Basal mammals, such as insectivores, opossums and monotremes tend to have a small cerebral cortex that possesses few distinct cortical regions, estimated to be about 20 (Northcutt and Kaas, 1995; Kaas, 2000, 2011, 2012, 2019, 2020; Kaas and Preuss, 2014; Hofman, 2014; Molnar et al., 2014), and possess low EQs and low cortical neuron abundance (Jerison, 1973; Roth and Dicke, 2005; Herculano-Houzel, 2009, 2017; Olkowicz et al., 2016). Primates typically tend to have many more cortical areas, higher EQs, and a greater cortical neuron abundance, with the abundance of cortical areas increasing from prosimians to monkeys to great apes to humans (Fig. 5A–C) (Jerison, 1973; Kaas, 2019, 2020; Kaas and Preuss, 2014; Preuss, 2007; Molnar et al., 2014; Herculano-Houzel, 2009, 2017; Olkowicz et al., 2016). Humans, for example, have cortical areas devoted to language comprehension and production that appear to be lacking in most other primates, but present in rudimentary form in great apes (Sherwood et al., 2003; 2012), and additionally have a greater number of higher-order cortical association areas (Van Essen and Dierker, 2007; Glasser et al., 2013; Hofman, 2014; Kaas, 2019, 2020; Kaas and Preuss, 2014).
Figure 5.

Image A shows a tree depicting the phylogeny of the cerebral cortex in placental mammals, focusing on the relative size, foliation and the location of the major cortical areas that are conserved among mammals. Note that as frontal and parietal cortex expands in the line leading to humans, cortical folding increases. The insets at the top depict the hypothetical cortical organization of the mammalian common ancestor (left) and the primate common ancestor (right). Color coding for cortical areas: Dark blue, primary visual area (V1); light blue, secondary visual area (V2); green, middle temporal (MT) visual area; yellow, primary auditory area (A1); red, primary somatosensory area (S1); orange, secondary somatosensory area (S2). This image is Figure 1 in Buckner and Krienen (2013), and is used with publisher permission. Images B and C show Brodmann’s illustrations of the cortical areas in macaque and human, respectively, with humans possessing many more areas than macaque (Brodmann, 1909). Note that the macaque and human brains are not depicted to the same scale. The monkey image is widely available on the internet and widely used by other authors (e.g. Figure 2A from Petrides et al., 2012). The human image was downloaded from the internet, where it is widely available (e.g. http://www.systems.neurosci.info/Cortex/brodman).
The number of distinct cortical areas present in humans is, however, not entirely certain. Brodmann recognized about 50 separate cytologically distinct areas in humans (Fig. 5C) (Brodmann, 1909), but recent multi-method mapping studies in human and higher primates recognize as many as 30 separate visual areas alone (Orban et al., 2004; Van Essen, 2004). Primary and higher-order auditory, somatosensory and motor areas also each appear to be multitudinous in humans, with the added areas performing increasingly higher-order information processing and motor planning (Glasser et al., 2016). A most recent estimate based on MRI analysis suggests that humans possess at least 180 separate, functionally distinct cortical areas in a single hemisphere (Glasser et al., 2016), with there being yet even more possible subdivisions of some of these. Prior histological analyses had reached a similar conclusion (Van Essen et al., 2012b). By contrast, the small amount of neocortex in the prosimian galago is divided into roughly 50 areas (Kaas, 2020), more than twice the number thought to be present in early mammals, and neocortex in marmosets has approximately 100 areas, and that in macaques about 150 areas (Van Essen et al., 2012a, 2019). It might therefore require evolution of about 200 separate areas for some other lineage to evolve to a human level of intelligence (Kaas, 2020). The reasoning is that increasing the number of cortical areas to 200 (as defined by current methods) appears to be required for the qualitative advance in cortical processing needed to increase intelligence to a human level, with the newer areas beyond those in other primates needed as the substrate to allow higher order information to be abstracted by the new functional cortical areas from the pure sensory input at a human cognitive level. Irrespective of whether future more fine-grained analysis revises the human neocortical area count upward, by phrasing the issue of evolution to a human level in terms of the requisite number of cortical areas (or their equivalents), it makes it possible to evaluate the issue of dinosaur evolution to a human level of intelligence in terms of whether the dinosaur brain design had any built-in features that would have limited this possibility, as discussed in the next section.
2. Avian Type Telencephalic Organization in Dinosaurs.
Secondly, and importantly for the present argument, it is assumed that dinosaurs must have had an avian type of telencephalic organization. In this regard, it is important to note, as will be further detailed in a later section, that the cytoarchitectonic organization of the pallium in living birds differs from that in mammals, owing to the divergence of the mammalian lineage and the sauropsid lineage (i.e. reptile and bird) from the stem amniotes about 320 million years ago (Kemp, 1982; Benton and Donoghue, 2007; Reiner et al., 2014, 2015; Dugas-Ford and Ragsdale, 2015; Güntürkün and Bugnyar, 2016). In brief, the mammalian telencephalon consists of an outer pallial rind, and a rounded more centrally and basally located subpallial region (i.e. the basal ganglia), with the pallium surrounding the basal ganglia dorsally and laterally. The pallium in mammals includes the typically dorsomedially situated hippocampus, and the more ventrolaterally situated olfactory cortex and amygdala, but the present focus is on the part of mammalian pallium called the cerebral cortex, which makes up the bulk of the pallium that surrounds basal ganglia (Fig. 6). Cerebral cortex has a unique architecture, with its neurons arrayed in six layers that are spanned by the ascending apical dendrites of the pyramidal neurons predominantly making up the layers (Fig. 7) (Lund et al., 1979; Shepherd et al., 2017), in contrast to neurons of the striatal part of the basal ganglia just deep to cerebral cortex, which are more uniformly distributed and possess radially symmetrical multipolar dendritic trees confined to the resident nuclear territory of the neuron cell body (Wilson and Groves, 1980; Kreitzer, 2009). The cerebral cortex is also commonly called the neocortex, because it is a new type of cortex only found in mammals, or isocortex due to its relative regional uniformity in cytoarchitecture.
Figure 6.

Images A and B show schematic line drawings of mid-telencephalic transverse brain sections of rat and pigeon, respectively. Image A shows the basic features of mammalian telencephalic organization and image B shows the organization of avian telencephalon. In each schematic, the speckled region represents pallium, the striped region represents striatum, and the checked region represents globus pallidus. The pallium in mammals largely consists of neocortex. The pallium in birds at the level shown mainly consists of the Wulst (hyperpallium) and DVR (mesopallium and nidopallium). These images are Figures 1B and 1D from Reiner et al. (2004). Hp = hippocampus. Images C-F present a series of low-power images of transverse sections through the telencephalon of adult rat (C, E) and adult pigeon (D, F). Images C and D of Nissl-stained sections for rat and pigeon show that the bird telencephalon conspicuously lacks a laminated pallial structure resembling the mammalian neocortex along its outer surface. Instead, the pallial part of the telencephalon of birds resembles the striatal part of the mammalian basal ganglia in its histological appearance. Image E shows that the striatum in mammals is characterized by enrichment in dopaminergic terminals, as immunolabeled for tyrosine hydroxylase (TH). Image F shows that only the basal part of the telencephalon in birds immunolabels intensely for TH and is therefore the only part of the telencephalon in birds that is striatal in nature. Scale bar = 2 mm in B (applies to C–F). Images C-F are Figure 2A–D from Reiner et al. (2004).
Figure 7.

Illustration showing the dendritic morphology of the main neuron types of cerebral cortex (A,B), the fiber organization of cerebral cortex (C), and dendritic morphology of the main neuron type of avian pallium (D, E). Image A shows a schematic of pyramidal neurons and their ascending apical dendrites traversing overlying layers, as redrawn from Purves, D., Augustine, G. J., Fitzpatrick, D., Hall, W. C., LaMantia, A.-S., McNamara, J. O., & White, L. E. (Eds.). (2008). Neuroscience (4th ed.). Sinauer Associates. Image B shows a Golgi-labeled pyramidal neuron of layer 5 and a Golgi-labeled stellate neuron of layer 4 from cat, using Figure 5A and Figure 2A, respectively from Lund et al. (1979). Image C shows a schematic of fiber labeling in cerebral cortex, using an image widely available in the internet. Images D and E show the location and projections (D) and dendritic morphology (E) of a biocytinfilled IT-type pallial neuron in pigeon from Figure 5 of Reiner et al. (2001). This morphology is typical of pallial projection neurons, as also noted in publications cited in the text, meaning that the dendrites of individual pallial projection neurons, except potentially at the borders between regions, are confined to the resident territory of the perikaryon.
The organization of the avian telencephalon is, however, quite different (Fig. 6). In particular, although a pallium and a basal ganglia can be identified in birds by multiple neurochemical and hodological criteria (Reiner et al., 2004, 2005), the neurons of the pallium are not laminar in their perikaryal distribution or columnar in their dendritic orientation, but rather are relatively uniformly distributed, possess radially symmetric multipolar dendritic trees (Fig. 7) (DeVoogd et al., 1981; Watanabe et al., 1983; Tombol et al., 1988; Fortune and Margoliash, 1992; Durstewitz et al., 1999; Reiner et al., 2001; Ahumada-Galleguillos et al., 2015), and are organized into many separate nuclei of specific connectivity and function (Reiner et al., 2004, 2005). As a result, the pallium and basal ganglia are both nuclear in their organization in birds, a feature that misled earlier comparative neuroanatomists to conclude that the telencephalon in birds was largely a hypertrophied basal ganglia, as has been discussed at length elsewhere (Reiner et al., 2004, 2005; Reiner, 2005, 2009; Jarvis et al., 2005). In addition to a small dorsomedial hippocampal region and a small ventrolateral amygdaloid and olfactory region, the nuclear pallium in birds consists of two major territories, a dorsomedial region called the Wulst and a more ventrolateral region called the dorsal ventricular ridge (DVR), the latter of which in birds consists of two major subregions called the mesopallium and nidopallium that together jut into the lateral ventricle and largely obscure it (Fig. 6) (Reiner et al., 2014, 2015; Dugas-Ford and Ragsdale, 2015). The nidopallium is separated from the underlying striatum by a thin cell-free glial lamina, as is the mesopallium from the underlying nidopallium, and the Wulst from the underlying mesopallium.2 Thus, the pallium in birds consists of cytoarchitectonically distinct, separate slabs of tissue that are stacked upon one another, with the multipolar dendrites of neurons in each slab confined to that slab, except to some extent at their adjoining borders (Fig. 7). Within each slab are separate nuclear groups, of varying distinctness. This organization differs from that of mammalian cerebral cortex, the functional equivalent of Wulst and DVR, which consists of a single slab (i.e. the neocortex) that surrounds the basal ganglia, and that is organized into layers of like-type neurons whose dendrites cross layers, most commonly the radially disposed dendrites of the pyramidal neurons of layers 2/3 and 5/6 (Fig. 7). As will be detailed in a latter section, despite these differences between neocortex and avian palllium in their cytoarchitectonic configurations, they do resemble each other showing in showing a radial organization in fiber networks that span and interconnect across layers in mammals (Fig. 7) and across pallial regions/slabs in birds (Stacho et al., 2020). It should also be added, that like in mammals, pallial projection neurons are excitatory and use glutamate as their neurotransmitter, while basal ganglia projection neurons are inhibitory and use GABA as their neurotransmitter (Reiner, 2002; Reiner et al., 2004).
Note that the pallium in birds also possesses a cytoarchitectonically distinct caudobasal region termed the arcopallium, which for presentation purposes will be treated as part of the DVR, as others have done (Iwaniuk and Hurd, 2005; Dugas-Ford and Ragsdale, 2015). The telencephalon in all living reptiles, as well, possesses a DVR, but one that tends to be smaller than in birds (Reiner, 1991, 1993; Bruce, 2007). Extant reptiles also possess a pallial region comparable to Wulst, but unlike in birds it lies above a pronounced lateral ventricle and it is thus relatively more distinctly differentiated from DVR than is Wulst in birds (Reiner, 1991, 1993; Medina and Reiner, 2000; Bruce, 2007). Moreover, the reptilian Wulst equivalent is laminated and the apical dendrites of its neurons, which resemble pyramidal neurons of mammalian neocortex in their morphology, traverse its layers radially. Thus, it is cortical in structure, and accordingly, it is called the dorsal cortex (Reiner, 1991, 1993; Bruce, 2007).
Because all members of living reptile groups and all birds possess a DVR, and because dinosaurs were reptiles and theropod dinosaurs were the forerunners of birds (Chiappe, 1995; Chen et al., 1998; Xu et al., 2003), it is an inescapable conclusion that a DVR is a defining feature of the reptilian-avian clade (i.e. sauropsids), including dinosaurs (Fig. 8). Consistent with this, the brain shape in troodon endocasts and that of other similar theropods such as velociraptor resembles that in birds, with the paired telencephala viewed from above having a characteristic triangular shape, as compared to the more elongate shape of the paired mammalian telencephala (Fig. 3) (Hopson, 1977; Russell and Seguin, 1982). DVR cytoarchitectonic organization varies among sauropsids, however, from a simple laminar organization in the primitive lizard-like reptile Sphenodon to a more complex cellular organization in crocodilians and birds (Northcutt, 1978, 1981; Reiner and Northcutt, 2000). As birds are now regarded as descended from small maniraptoran theropod dinosaurs, the same group to which troodon belonged, maniraptoran theropod dinosaurs (if not all dinosaurs) must have also possessed a complex cellular DVR within the telencephalon, and a Wulst or dorsal cortex as well. Note that a Wulst is not unambiguously evident in the troodon endocast (Fig. 3), but nonetheless may be present in some incipient form not evident from the gross shape of the dorsal endocast surface. Consistent with this inferred bird-like pallial organization, maniraptoran dinosaurs seem to have shown an avian level of behavioral sophistication (Hopson, 1977; Erickson, 1999; Horner, 1982, 1987; Meng et al., 2004; Varricchio et al., 2008; Pol et al., 20218). Moreover, telencephalic regional organization in the only living member of the archosaur reptilian group to which dinosaurs belong, namely crocodilians, shows a very high similarity to that in birds, based on molecular markers, immunomarkers, and connectivity, with crocodilian DVR showing clear evidence of containing a mesopallium and nidopallium (Pritz, 1975; Pritz and Northcutt, 1977; Pritz, 1980; Brauth, 1984; Briscoe and Ragsdale, 2018; Briscoe et al., 2018). Thus, it is highly likely that troodon and related theropods possessed a DVR with a mesopallium and nidopallium that was divided into a large number of separate cell groups specialized for various sensory and motor functions, as well as a Wulst (or dorsal cortex) that was devoted to additional sensory and motor functions. Note that Briscoe and Ragsdale (2018) did not detect unambiguous molecular evidence of an arcopallium in alligator, nor is there hodological evidence. Nonetheless, given the close phyletic relationship of birds and maniraptoran dinosaurs, and their behavioral similarities, it seems likely that an arcopallium had evolved in this theropod dinosaur group, if not earlier. Finally, the basal ganglia in dinosaurs was also likely to have been at an avian grade of organization (Reiner et al., 1998; Reiner, 2002; Bruce et al., 2016), but the basal ganglia is not especially germane to the arguments presented here, and so it will not be considered further.
Figure 8.

Cladogram illustrating the evolutionary relationships among mammals, birds and reptiles, focusing on the relationships among birds, living reptiles and dinosaurs. Note that birds and dinosaurs are phylogenetically grouped among reptiles. Given that the cladogram branching pattern for birds, extant reptiles, and dinosaurs shows that a DVR must have been already present in the common ancestor of birds, living reptiles and dinosaurs, it is inescapable that the dinosaur telencephalon must also have possessed a DVR. It is more difficult to know whether dinosaurs also possessed a Wulst. Archeopteryx but troodontid endocasts provide suggestive evidence that early avians but not the immediate theropod forerunners of birds such as troodon possessed a Wulst (Jerison, 2004; Balanoff et al., 2013). Thus, troodon may have possessed a structure more resembling reptilian dorsal cortex than avian Wulst, or been intermediate. Note that contemporary analysis indicates turtles to be a sister group of archosaurs (Rieppel, 1999; Chiari et al., 2012; Crawford et al., 2012; Wang et al., 2013).
3. Importance of Information Processing by the Different Neuron Types in a Cortical Column.
Thirdly, it is assumed that the interactions between neurons within different layers of neocortex are critical to its function. The neocortex is a specialized set of 6 cytoarchitectonically distinct layers, with each layer containing functionally and hodologically distinct neuron types (except layer 1, which is largely cell free), with the entire ensemble designed to perform a set of computational operations that enable information processing and motor planning (Harris and Mrsic-Flogel, 2013; Markum et al., 2018; Bennett, 2020; Hanganu-Opatz et al., 2021). Irrespective of the precise algorithms for these operations, the processing power of neocortex is typically assumed to derive from a major feature of its organization - the interactions of the functionally distinct neuronal elements within columns that span the depth of neocortex (Harris and Mrsic-Flogel, 2013; Markum et al., 2018). The neuronal elements in a column form the fundamental processing units of neocortex, with layer 4 neurons receiving thalamic input and typically possessing a multipolar dendritic shape, with layer 2/3 neurons with pyramidal neuron dendritic morphology receiving input from the thalamorecipient layer 4 neurons, with the layer 2/3 neurons projecting to the layer 5/6 neurons with pyramidal neuron dendritic morphology, and with the layer 5/6 neurons typically projecting out of the neocortex (Figs. 7, 9) (Mountcastle, 1997; Kaneko et al., 2000; Da Costa and Martin, 2010; Rockland, 2010; Shepherd, 2013). The cortical columns are arrayed next to one another, and each cortical area consists of many such columns. For any given cortical area, each column is devoted to a particular part of sensory, motor, or cognitive space for the functional modality of that area. Note that columns are real morphological entities in some demonstrable sense for some sensory systems (such as primary visual cortex in primates or the barrel fields of rodent somatosensory cortex) (Woolsey and van der Loos, 1970; Hubel and Wiesel, 1968), but to a large extent they are theoretical constructs used to characterize the processing mechanisms of neocortex (Da Costa and Martin, 2010; Rockland, 2010), with no firm boundaries between adjacent columns.
Figure 9.

Images and schematics illustrating the location and connectivity of hodologically similar neuron types in primary auditory cortex (A1) of adult mouse and the primary pallial thalamorecipient auditory area of the adult chicken nidopallium (Field L). Images A and B show the locations of A1 and Field L, respectively. Image B is image 49 from the coronal series of sections from Brainmaps.org. Image C shows that auditory thalamic input to A1 ends on layer 4 thalamorecipient neurons (color coded green and shown as multipolar), which project to layers 2/3 intracortically projecting neurons (color coded purple and depicted as pyramidal), which themselves project to extracortically projecting neurons of layers 5/6 (color coded red and depicted as pyramidal), which project to striatum, thalamus and brainstem. Note by the scale bar, that the axonal pathways between these cortical neuron types are less than a millimeter. Image D shows that auditory thalamic input to Field L ends in layer 4-type thalamorecipient neurons of subfield L2 (color coded green and shown as multipolar), which project to nearby layers 2/3-type “intracortically” projecting neurons of subfields L1 and L3 (color coded purple and shown as multipolar), which themselves project to another set of layers 2/3-type “intracortically” projecting neurons (color coded purple and shown as multipolar) located at the lateral edge of the caudal nidopallium, which then project to layers 5/6-type “extracortically” projecting neurons of medial arcopallium (color coded red and shown as multipolar), which project to striatum, thalamus and brainstem. These illustrations show, by the scale bars, that the axonal pathways between these cortical neuron types in chicken are substantially more than a millimeter. Note that image D is not meant to be a comprehensive diagram of Field L circuitry, but rather is intended to show how some of the key layer-equivalent elements are located in different pallial regions at some distance from one another. A more comprehensive Field L circuit diagram would also include mesopallial elements (see text), but these are not included for sake of simplicity. Including mesopallial elements to the circuit, however, would reinforce the point that layer-equivalent elements are located in different pallial regions at some distance from one another in the avian pallial design. The schematic plan for C and D is adapted from Figure 3 of Dugas-Ford and Ragsdale (2015).
It is important to note that each neocortical layer interfaces seamlessly with its adjacent layers and there are no glial barriers separating layers, with dendrites of any given layer extending into other layers, and the ascending apical dendrites of the pyramidal neurons in layer 2/3 and 5/6 traversing the layers above them (Fig. 7). The neocortex is, thus, a single cytoarchitectonic entity. In any case, because the neocortex is organized into sets of neurons layered parallel to the pial surface, the functionally distinct neurons of neocortex within each column are placed at close distance to one another - within 1–3 mm, depending upon the mammalian species and cortical region (Hofman, 1989; Preuss et al., 1999; Laughlin and Sejnowski, 2003; Amunts et al., 2012; Balaram and Kaas, 2014; Dicke and Roth, 2016). This and the entry of the dendrites of the dendrites of layer 5/6 neurons into the territory of layer 2/3 neurons shortens axonal conduction times between the neuronal elements making up a column, and keeps them relatively invariant across mammalian species, with human neocortex being thickest among primates at about 3.5 mm. The short conductions times presumably benefit the speed, efficiency and effectiveness of the processing carried out within a cortical column. Note that an increase in the number of columns making up a single cortical area would increase the grain with which information from a periphery of constant size could be analyzed. This might improve sensory discrimination, but it would not yield a qualitative change in information processing. Increasing the number of cortical areas is presumed to be required to yield the qualitative change needed to increase “intelligence”, in which higher order information is abstracted by the new functional cortical areas from the pure sensory input. Note that each layer of neocortex for each of the major basic cortical areas has a correspondent in a particular nuclear cell group in the avian pallium, as discussed in more detail in a later section (Fig. 9), and presumably this was true of the dinosaur pallium as well (Reiner, 2000; Reiner et al., 2015; Dugas-Ford and Ragsdale, 2015).
4. Long Axon Lengths Hinder Information Processing.
Finally, it is assumed that increasing axonal length between neurons carrying out a critical processing operation is harmful to the effective execution of this operation, due to increasing delays in transmission because of greater axon length (Cherniak, 1995; Hofman, 2014; Dicke and Roth, 2016). This assumption, which has empirical and theoretical support, is partly the basis of the view that the close spacing of the disparate neurons within cerebral cortex furthers its ability to process information (Hofman, 2014). This rule, however, is thought to apply for all neural circuits. Note, however, that the proximity of the cortical layer neuron types to one another does not invariably favor mammalian cortical over avian nuclear pallial organization as a substrate for intelligence, since many large-brained, pallial neuron-rich avian species such as crows and parrots show complex problem-solving ability that rivals that of monkeys and/or apes, and clearly exceeds that of many mammals, including for example rodents, rabbits, insectivores and opossums (Emery and Clayton, 2004a,b; Emery, 2006; Cnotka et al., 2008; Olkowicz et al., 2016; Balakhonov and Rose, 2017; Herculano-Houzel, 2017; Kabadayi and Osvath, 2017; Auersperg and von Bayern, 2019; Pika et al., 2020; Bobrowicz et al., 2021; Ströckens et al., 2022). The studies of Pepperberg (1999) with African grey parrots, in particular, show they can meaningfully use human words, and grasp simple numerical and relational concepts. Similarly, New Caledonian crows can make tools out of twigs to retrieve inaccessible food, and pass this skill to other crows (Hunt, 2000; Weir et al., 2002), and ravens show domain-flexible future planning (Kabadayi and Osvath, 2017) and socially instructed learning (Pika et al., 2020).
Still, there may be some differences in cognitive ability between these avian groups and the more cognitively capable mammalian species. For example, mirror-guided self-recognition is a sophisticated cognitive trait seen consistently in humans, even as early as 18 months of age, that is thought to indicate an awareness of self, but only in a limited number of other mammalian species (Emery and Clayton, 2004b; Ristau, 2013). Among nonhuman mammals, it has been consistently seen in individual chimpanzees, orangutans and dolphins, and in Asian elephants, gorillas and gibbons mirror-guided self-recognition was seen in some studies and individuals but not others (Emery and Clayton, 2004b; Prior et al., 2008; Ristau, 2013). By contrast, among avian species thought to parallel apes in their intelligence, common ravens, azure-winged magpies, carrion crows, jungle crows and African grey parrots have not shown mirror-guided self-recognition (Emery and Clayton, 2004b; Wang et al., 2020; Vanhooland et al., 2022), although such self-recognition was reported in Indian crows (Parishar et al., 2021) and in 3 of 5 Eurasian magpies (a corvid) tested (Prior et al., 2008), but not in another study of a larger magpie cohort (Soler et al., 2020). Moreover, although crows mimic chimpanzees in tool use, some authors have shown that chimpanzees can be taught to communicate using human sign language (Gardner and Gardner, 1980), but there is no such evidence for language use by corvids, suggesting that while corvids may cognitively match chimpanzees in some regards, they do not do so in all regards. Of course, at least one African gray parrot has shown ability to communicate using human words (Pepperberg, 1999), but as noted above they have not shown mirror-guided self-recognition. Thus, while the proximity of the cortical layer neuron types to one another (and thus the short axons distances between neuron types within a layer) may not invariably favor mammalian cortical over avian nuclear pallial organization as a substrate for intelligence in living birds, as will be discussed in more detail in later section, the axon distance problem may become more constraining as more cortical areas (and more pallial neurons) are added in the avian nuclear design.
Lines of Reasoning - Constraints on Cortical Expansion
Based on these 4 assumptions, I argue that the brain of troodon or any other dinosaur would have been limited in its ability to add the number of efficiently functioning cortical areas (or their equivalent in a nuclear pallium) requisite to achieve a human level of intelligence. This conclusion is based on three lines of argument. These arguments are based on considerations of increased axonal lengths that would have been required by a dinosaur (i.e. avian) type of pallial organization, on the inability of a dinosaur telencephalon to fold to achieve reduction in the length of axon paths between adjacent sets of neurons equivalent to those in a given layer of adjacent cortical areas in a mammal, and because the three-dimensional nuclear plan to the architecture of the dinosaur pallium may not have readily lent itself to a precise point-to-point topographic mapping between regions, as possible in the case of the sheet-like cerebral cortex in mammals, which possibly would hinder the efficiency of information processing. The case for each of these three major conclusions is detailed below.
Avian Pallial Organization versus Mammalian Cortical Organization.
Before detailing the reasoning behind the conclusion that axonal length considerations argue against the notion that troodon would have been able to give rise to a lineage that evolved to a human level of “intelligence”, it is necessary to review the major features of pallial organization in birds and contrast them to those in mammals in more detail than above, because pallial organization in theropods such as troodon was highly likely to be very similar to that in extant birds. In mammals, the cerebral cortex is the pallial structure that covers most of the outer surface of the telencephalon (Fig. 6). As noted, the cerebral cortex consists of a series of functionally distinct layers of neurons layered on top of one another within a depth of 1–3 mm of one another, depending on cortical region and species (Figs. 6, 7, 9) (Karten and Shimizu, 1989; Dicke and Roth, 2016). Within each layer, neurons are more or less functionally alike, while across layers they are functionally distinct (Reiner et al., 2004, 2005; Dugas-Ford and Ragsdale, 2015; Dicke and Roth, 2016; Güntürkün and Bugnyar, 2016). One of the manifestations of this within-layer functional uniqueness is laminar specialization in receiving or transferring information to other brain areas (Fig. 9A,C). Layer 4 of neocortex (also called the granule cell layer because of the typically small size of its neuronal perikarya) in all parts of neocortex receives the sensory or sensory-motor information from the dorsal thalamus, or other neocortical areas (Figs. 7, 9A,C) (Reiner et al., 2005; Dugas-Ford and Ragsdale, 2015). The layers above layer 4, namely layers 2–3 (also called the supragranular layers), are specialized to communicate from one cortical area to another, as well as to deeper layer neurons (Reiner et al., 2005; Dugas-Ford and Ragsdale, 2015). Finally, layers 5 and 6 (the infragranular layers) are specialized for communication with the basal ganglia, the thalamus, the hindbrain, and spinal cord, as well as other cortical areas (Reiner et al., 2005; Dugas-Ford and Ragsdale, 2015). These layer 5/6 outputs provide information to motor structures or feedback to brainstem sensory structures. Note that within layer 5, pyramidal neurons concentrated in upper layer 5 (called 5a) project to basal ganglia and other neocortical areas, but not outside the telencephalon, while those in lower layer 5 do project outside of telencephalon (Reiner et al., 2003; Shepherd, 2013). The layer 5a neurons are commonly referred to as intratelencephalically projecting neurons (IT-type) because of their connectivity, while those of 5b have been termed pyramidal tract neurons (PT-type) because they give rise to the pyramidal tract (Reiner et al., 2003).
The organization of the avian equivalent of cerebral cortex is different in many important regards, and cladistic considerations suggest that it seems likely that the equivalent of cerebral cortex in dinosaurs shared these avian features (Fig. 7). In birds, the equivalent of the cerebral cortex comprises two major structures, the Wulst and DVR, as noted above (Fig. 6) (Reiner et a., 2004, 2005; Dugas-Ford and Ragsdale, 2015; Güntürkün and Bugnyar, 2016). The Wulst makes up about 20% of the cerebral cortex-equivalent, and the DVR makes up the remainder, though this varies among avian groups (Iwaniuk and Hurd, 2005; Iwaniuk et al., 2008; Sayol et al., 2016; Hamaide et al., 2018). While the Wulst has been referred to as quasi-laminar, it is important to note that the neurons of Wulst do not possess the architecture of cerebral cortex neurons in terms of the dendrites spanning across the Wulst quasi-lamina (Watanabe et al., 1983; Medina and Reiner, 2000; Dugas-Ford and Ragsdale, 2015; Briscoe et al., 2018b). Moreover, some Wulst divisions are separated by neuron-free glial zones, unlike the layers of cerebral cortex (Reiner et al., 2004). Thus, both Wulst and DVR consist of numerous separate territories that are nuclear in nature, with the main territories for Wulst being the apical hyperpallium (HA), the intercalated nucleus of the apical hyperpallium (IHA) and the densocellulare hyperpallial nucleus (HD), and for DVR being the nidopallium, mesopallium and arcopallium (Reiner et a., 2004, 2005; Dugas-Ford and Ragsdale, 2015; Güntürkün and Bugnyar, 2016; Briscoe et al., 2018b). Within Wulst, the IHA is the main recipient of sensory thalamic input, the HD gives rise to outputs to other parts of Wulst or DVR, and the HA gives rise to outputs to DVR, basal ganglia and/or brain stem from Wulst (Karten et al., 1973; Reiner and Karten, 1983; Shimizu et al., 1995; Veenman et al., 1995; Reiner et al., 2001, 2005; Nakamori et al., 2010; Dugas-Ford and Ragsdale, 2015; Briscoe et al., 2018b; Güntürkün and Bugnyar, 2016). Both HA and HD receive input from IHA, and HD projects to HA as well. In the case of DVR, some subdivisions within the nidopallium receive sensory thalamic input, other parts of the nidopallium and all of mesopallium give rise to input to other parts of DVR, and arcopallium gives rise to outputs to basal ganglia and/or brain stem (Reiner et al., 2005; Dugas-Ford and Ragsdale, 2015; Briscoe et al., 2018). As detailed below, thalamorecipient nidopallium projects to nearby non-thalamorecipient nidopallium. Thus, the avian equivalent of mammalian cerebral cortex contains the three major neuron types found in cerebral cortex, namely the thalamorecipient, the intracortically projecting, and the extracortically projecting types (Shanahan et al., 2013; Güntürkün et al., 2021 Reiner et al., 2001, 2005; Dugas-Ford and Ragsdale, 2015; Briscoe et al., 2018), but they are not arrayed in sheets of like-type neurons layered at specific depths from the pial surface within a single architectonic entity, as in the case of cerebral cortex (Reiner et al., 2004, 2005; Dugas-Ford and Ragsdale, 2015). Focusing then on what this means for the information processing unit of neocortex called the cortical column, the neuronal cell groups in birds that together make up the equivalent of the set of neurons in a cortical column for a given area of neocortex are found in separate cell clusters (or nuclei), that in some cases are juxtaposed but in most cases are distant from one another (Figs. 7, 9D).
To make this clearer, it is useful to go into more detail on specific sensory circuits. Each major sensory thalamic input to the avian DVR ends within a specific cell group within the nidopallium (Figs. 9B,D, 10). For example, visual input from nucleus rotundus of the thalamus (which itself receives tectal input) ends in the so-called entopallium within the nidopallial region of the DVR (Fig. 10) (Karten and Revzin, 1966, 1967; Karten and Hodos, 1970; Hunt et al., 1976; Fernández et al., 2019a), while auditory input from nucleus ovoidalis of the thalamus (which itself receives input from the inferior colliculus) ends within L2 of the so-called field L of the nidopallium (Figs. 9D, 10) (Karten, 1967, 1968; Wild et al., 1993). Each of these thalamorecipient cell groups projects to a shell of neurons that surround the thalamorecipient cell group (Figs. 9D, 11) (Wild et al., 1993; Wang et al., 2010; Calabrese and Woolley, 2015; Ahumada-Galleguillos et al., 2015; Fernández et al., 2019a). The shell around the entopallium is called the peri-entopallial belt, while that around field L is called L1 and L3. The shell of neurons projects in each case to other pallial regions, making the neurons of the shell around L2 therefore resemble layer 2/3 type neurons in mammals (Wild et al., 1993; Calabrese and Woolley, 2015; Ahumada-Galleguillos et al., 2015; Fernández et al., 2019a). In the case of Field L, Calabrese and Woolley (2015) have confirmed that the hierarchical organization of the auditory receptive field density and sound-selectivity in Field L2 relative to Fields L1/3 resembled that for layers 4 and 2/3, respectively in A1 auditory cortex. Among the targets of the peri-entopallial belt and L1/L3 are within-modality IT-type neurons at the dorsolateral margin of the pallium (Figs. 9D, 11B,C). These regions in turn project to striatum (Wild et al., 1993; Veenman et al., 1995; Reiner et al., 2001), as well as to specific within-modality parts of the arcopallium (Figs. 9D, 11B,C) (Wild et al., 1993; Dugas-Ford and Ragsdale, 2015; Fernández et al., 2019b). Note that the neurons at the dorsolateral margin of the pallium that project to striatum and arcopallium may correspond to layer 5a IT-type pyramidal neurons in mammals that only have projections within telencephalon (Reiner et al., 2003; Briscoe et al., 2018). Bolstering this possibility is the finding that both the IT-type neurons of layer 5a and the PT-type neurons of layer 5b in mammals receive layer 2/3 input, with the IT-type projecting to the PT-type, in addition to striatum (Shepherd, 2013). Note that the neurons at the dorsolateral margin of the avian pallium (a territory in which regional distinctions among pallial zones can be uncertain) might also correspond to a class of layer 2/3 neurons in mammals that receive input from other layer 2/3 neurons, but for the purposes of developing the reasoning in this paper, I will consider them to be like layer 5a IT-type neurons in mammals.
Figure 10.

Panels showing schematic diagrams of frontal views through the cerebrum, diencephalon, midbrain, and/or hindbrain of the pigeon depicting the cell groups that make up the ascending components of the major trigeminal somatosensory circuit to the DVR, the tectofugal visual pathway to the DVR, and the major auditory circuit to the DVR. Abbreviations: Bas, nucleus basalis; BG, basal ganglia; Ento, entopallium; EW, nucleus of Edinger-Westphal; FLM, fasciculus longitudinalis medialis; Hp, hippocampus; Hy, hypothalamus; IC, inferior colliculus; LP, lateral pontine nucleus; M, mesopallium; M5, motor nucleus of the trigeminus; MP, medial pontine nucleus; N, nidopallium; Ov, nucleus ovoidalis; Pr5, principal nucleus of the trigeminus; Rt, nucleus rotundus; SN, substantia nigra.
Figure 11.

Schematics depicting the higher order pallial components of the trigeminal somatosensory (A), tectofugal visual (B), and primary auditory (C) inputs to the DVR, shown in sagittal view with medial to the left. The schematic for each sensory input illustrates the projection of the thalamorecipient layer 4-like neuronal population (color coded green) to the layers 2/3-like belt surrounding the thalamorecipient population (color-coded purple), which in turn projects to the layers 2/3-like external nidopallium (also color-coded purple), with the external nidopallium then projecting to the layers 5/6-like arcopallium (color-coded red). Note that the L1/3 Fields are shown as closer to their target nidopallial field than they actually are (for sake of schematic convenience), and their actual proximity is better illustrated in Figure 8D. The schematic illustration of these sensory circuits makes the point that the cortical layer equivalents in the avian pallium tend to be at some distance from one another. Note that although the arcopallium is the output region of the DVR, HA (not shown in this illustration) is the output region of Wulst. Abbreviations: A, arcopallium; BG, basal ganglia; Cb, cerebellum DVR, dorsal ventricular ridge; OT, optic tract; Ov, nucleus ovoidalis; Pr5, principal nucleus of the trigeminus; Rt, nucleus rotundus.
In any case, the visual and auditory regions within the arcopallium receiving dorsolateral pallial input project to brainstem and basal ganglia (Zeier and Karten, 1971; Fernández et al., 2019b), and thus seem akin to layer 5b/6 neurons of mammalian cerebral cortex (Reiner et al., 2003, 2010). This interpretation of arcopallial neuron identity has been confirmed using molecular markers of layer 5b/6 neurons (Dugas-Ford et al., 2012; Dugas-Ford and Ragsdale, 2015; Briscoe et al., 2018), as has the identification of the avian pallial territories resembling thalamorecipient, cortical layer 2/3, and layer 5a neurons. The pallial components of the entopallial circuit appear in particular comparable to a visual area in postrhinal temporal cortex in mouse (Beltramo and Scanziani, 2019), while those of Field L are comparable to primary auditory cortex (Calabrese and Woolley, 2015), based on the similarities between mammals and birds in the thalamic inputs (Yamamoto and Reiner, 2007). Of note, the cell groups that are akin to the different layers of postrhinal temporal cortex and to the different layers of primary auditory cortex are typically separated by many millimeters in the avian telencephalon, but in mammals the comparable neurons are much nearer to one another since they reside in cortical columns (Figs. 9, 11B,C). The distributed feature of the visual and auditory nuclei of the pallium in birds that collectively correspond to specific cortical visual and auditory areas in mammals also is the case for the input of trigeminal somatosensory information into the avian telencephalon (Figs. 10A, 11A) (Zeigler and Karten, 1973; Wild and Farabaugh, 1996; Fernández et al., 2021), with separate interconnected pallial cell groups akin to those of the different cortical layers in mammals. Thus, considering the avian pallial circuit for a given modality to consist of one thalamorecipient area, one layer 2/3-like area (with possibly at least one more in mesopallium, as will be discussed in the next paragraph) (Atoji and Wild, 2011; Atoji and Karim, 2014; Ahumada-Galleguillos et al., 2015; Fernández et al., 2019a), another area that may correspond to layer 5b (or an additional 2/3-like area), and an area with layer 5b/6 neuron types, to derive the number of interconnected neuronal sets equivalent to a cortical area in avian pallium, one needs to divide the total number of functional areas in avian pallium by at least 5. Thus, taking the Shanahan et al. (2013) estimate of 48 separate pallial regions in pigeons, this would represent the equivalent of no more than 10 cortical areas in a mammal, putting pigeons in the range of primitive living mammals such as insectivores.
The above description of DVR circuitry highlights circuits within nidopallium and connecting to arcopallium, but the mesopallium is also a major DVR territory that is interconnected with the nidopallium and arcopallium. For example, the thalamorecipient entopallium projects radially to overlying mesopallium, which in turn projects radially back to entopallium and its nidopallial belt (Kreutzfeld and Wild, 2005; Ahumada-Galleguillos et al., 2015; Fernández et al., 2019a). Auditory nidopallium and trigeminal nidopallium are similarly connected radially to overlying mesopallium (Atoji and Wild, 2011; Stacho et al., 2020; Fernández et al., 2021). Mesopallium, in turn, projects to dorsolateral nidopallium and arcopallium (Wild and Farabaugh, 1996; Atoji and Wild, 2009, 2011). Mesopallium also receives input from Wulst (Shimizu et al., 1995; Atoji and Wild, 2012), and thus appears to integrate information from DVR and Wulst and operate as a pallial association territory. This interpretation is consistent with evidence from molecular markers and by its connectivity that it principally contains IT-type neurons (Atoji and Karim, 2014; Briscoe et al., 2018), and from the evidence that its relative size seems to correlate with indicators of cognitive complexity in birds (Timmermans et al., 2000; Mehlhorn et al., 2010; Ströckens et al., 2022). It is uncertain how to draw parallels between mammalian cortical circuitry and the interconnections of mesopallium with nidopallium and arcopallium, but my goal here is neither to exhaustively detail avian pallial circuitry nor to identify one-to-one correspondents in mammals for all aspects of avian pallial circuitry. Regardless of whether the IT-type neurons of mesopallium are compared to layer 2/3 or layer 5a IT-type cortical neurons, the distances in birds between mesopallium and its input sources and its output targets are greater than for either of these two possible mammalian correspondents. Because this point can be made without the added complexity of including mesopallial circuitry in Figure 9D, that particular illustration focuses only on nidopallial circuitry. Note that the Shanahan et al. (2013) estimate of 48 separate pallial regions in pigeons includes mesopallial areas. Since mesopallium, by the above considerations, should be regarded as containing part of the circuit equivalent to a cortical column, this would mean that at least 5 separate pallial regions in birds contain the correspondent of a cortical column in mammals. Thus, the 48 separate pallial regions in pigeon of Shanahan et al. (2013) would represent the equivalent of 10 or fewer cortical areas in a mammal, depending on how many mesopallial areas are to be regarded as part of the equivalent of a cortical layer constituent for a given cortical area.
Turning to the Wulst, it too, like the DVR, shows an organization into separate regions with thalamorecipient type neurons (IHA), intratelencephalically projecting type neurons (HD), and extratelencephalically projecting type neurons (HA), as noted above (Karten et al., 1973; Shimizu et al., 1995; Dugas-Ford and Ragsdale, 2015; Reiner et al., 2015; Atoji and Wild, 2018a, 2018b, 2019), with topographically different Wulst sectors spanning the Wulst quasi-layers definable by their physiology and connectivity as primary visual cortex, primary somatosensory cortex, and primary motor cortex, the latter two of which may overlap (Wild, 1992, 1997; Medina and Reiner, 2000; Wild and Williams, 2000; Wild et al., 2008; Dugas-Ford et al., 2012; Dugas-Ford and Ragsdale, 2015; Atoji et al., 2018a, 2018b). These neuron types in Wulst have an organization in which the layer 4, layer 2/3 and layer 5/6 cell types are somewhat stacked upon one another, and somewhat within register within modality, giving it an organization that has been called quasi-laminar (Pettigrew and Konishi, 1976; Reiner and Karten, 1983; Wild, 1987; Shimizu et al., 1995; Medina and Reiner, 2000; Manger et al., 2002: Atoji et al., 2018a, 2018b). The layer-equivalents of Wulst are connected within modality by axons that traverse the distance between the quasi-layers, but for Wulst (as for DVR) the distances are greater than for the comparable neuron types in cerebral cortex, as especially notable in species with a well-developed (i.e. thick and wide) Wulst such as a barn owl (Karten et al., 1973; Pettigrew, 1978; Medina and Reiner, 2000; Dugas-Ford and Ragsdale, 2015).
Thus, the neuronal elements making up the functional equivalent of a cortical column are typically spread more than 2 mm apart in the cerebral cortex-equivalent pallium of living birds (Wulst and DVR both), and in the case of some they are separated by even more. For example, in Figure 9D showing chicken DVR, the layer 2/3 neurons surrounding Field L2 are about 4.5 mm distant from the layer 5a-like neurons of dorsolateral pallium, which in turn are about 2 mm distant from the layer 5b/6-like neurons of arcopallium. By contrast, the distances between comparable cell types in mouse A1 (Fig. 9C) are less than half a millimeter. The above noted distances in birds increase several fold in more large-brained birds such as carrion crow and jungle crow, based on images shown in brain atlases for these species (Izawa et al., 2007; Kersten et al., 2021). Similarly, the Wulst in barn owl is 5–6 mm thick (Pettigrew, 1978), and images of barn owl brain available online at www.brainmaps.org show the distance between the centerpoint of the thalamorecipient layer 4-like neurons of IHA and the centerpoint of the layer 2/3-like neurons of HD to be about a millimeter, and as well as for the distance from HD centerpoint to the centerpoint of the layer 5/6-like neurons of HA. By contrast, in mammals the distances for comparable cell types is much less to begin with in the neocortex of mammals with small to moderately sized brains (a fraction of a millimeter), and does not increase greatly in larger-brained species, since neocortex does not thicken substantially from small-brained to large-brained mammals (Hofman, 1989; Preuss et al., 1999; Laughlin and Sejnowski, 2003; Amunts et al., 2012; Balaram and Kaas, 2014; Dicke and Roth, 2016).
At this point in my presentation, it would be useful to comment on the issue of the mammalian homologues of the avian Wulst and DVR, an issue that has been debated for about 100 years (Reiner et al., 2004, 2005). The primary visual region, primary somatosensory region, and primary motor region in Wulst in birds and in dorsal cortex in reptiles are widely regarded as homologous to the comparable territories in the dorsalmost sector of neocortex in mammals (Medina and Reiner, 2000; Butler et al., 2011; Dugas-Ford and Ragsdale, 2015), but the mammalian homologues of the visual and auditory territories in the DVR are not firmly established, with some suggesting they reside in temporal neocortex (Shimizu and Karten, 1990; Butler et al., 1994, 2011; Karten, 1997, 2015; Reiner, 1993, 2000; Reiner et al., 2005; Yamamoto and Reiner, 2007) and others suggesting they reside in the claustro-amygdaloid territory (Bruce & Neary, 1995; Striedter, 1997; Puelles et al., 2000, 2016; Abellán et al., 2009; Puelles, 2022). For purposes of the present consideration of the evolution of a dinosaur humanoid, the mammalian homologues of Wulst/dorsal cortex and DVR are not truly germane, since the relevant issue is their functional equivalence, and it is widely agreed that the Wulst and DVR function like cerebral cortex (Wang et al., 2010; Calabrese and Woolley, 2015; Dugas-Ford and Ragsdale, 2015; Reiner et al., 2015; Herculano-Houzel, 2020; Stacho et al., 2020).
Finally, on the topic of avian pallial organization, Stacho et al. (2020) recently reported using high-resolution polarized light microscopy that the primary sensory areas in DVR possess a radial, column-like organization in the connections between the thalamorecipient zones and their surrounding shells, and across the thalamorecipient zones, layer 2/3-like and layer 5/6-like territories in the case of Wulst (Fig. 12). A similar point has previously been made for DVR visual, auditory and trigeminal circuitry and Wulst visual and somatosensory circuitry based on connectivity studies and recording studies by other authors (Reiner and Karten, 1993; Wang et al., 2010; Calabrese and Woolley, 2015; Ahumada-Galleguillos et al., 2015; Atoji et al., 2018a, 2018b; Fernandez et al., 2019a, 2021). The common presence of radial organization in avian pallium and mammalian cerebral cortex has been used to explain why avian pallium can support a level of behavioral sophistication on a par with that supported by mammalian cerebral cortex (Herculano-Houzel, 2020; Stacho et al., 2020; Rose, 2022). It is important to note, however, that the radial pallial organization in birds differs in four important respects from the radial organization of mammalian cerebral cortex. First, the radial organization of DVR in birds does not include the layer 5a-like neurons of dorsolateral pallium or the layer 5b/6-like arcopallium of birds, while layers 5/6 neurons are included as a radial component of the cortical column in mammals (Figs. 7C, 12). Secondly, the radial organization of the avian thalamorecipient territories and their belts in DVR differs from the organization of the thalamorecipient layer 4 of mammalian cerebral cortex and the layer 2/3 cortical neurons to which they project, because the dendrites of layer 4 and layer 2/3 cortical neurons extend into each others’ territories, but this is not the case for DVR thalamorecipient neurons in birds in relation to their layer 2/3-like belt neurons, except at borders between regions (Fig. 7C). Note that although Stacho et al. (2020) refer to this organization across nidopallium and mesopallium as columnar, the organization differs from I have defined as columnar in the present paper. Moreover, as we had already noted, the Wulst organization for its visual and somatosensory zones is radial, but again it is not columnar as that term is used for mammalian neocortex and as I have used it here, and in the case of Wulst as well the dendrites of the multipolar neuron types in each pseudo-layer do not extend into the territory of another, except potentially at borders between regions (Watanabe et al., 1983). The columnar organization of neocortex, as well as its compactness, yields short axonal distances for communication between neuron types (Fig 7C, 9C). Thirdly, despite the finding that the radial organization of the connectivity for thalamorecipient and layer 2/3-like neuronal populations in bird DVR resembles that for mammalian neocortex, the thalamorecipient and layer 2/3-like neuronal populations remain more distant from one another in birds than is the case for mammalian neocortex (Fig. 9). This is also true for the pseudo-layers of the Wulst, especially in larger-brained birds such as owls and corvids (Izawa et al., 2007; Kersten et al., 2021). Fourthly, Stacho et al. point out that the radial organization of DVR and Wulst only pertains to the aforementioned sensory circuits. It does not pertain to non-sensory associative circuits. By contrast, associative cortical areas in mammals have radial columnar organization just like sensory and motor cortical areas do, and it has been suggested that associative areas are especially critical for intelligence (Kaas and Preuss, 2014; Ströckens et al., 2022). So, while it is valuable to note the similarity between neocortex on one hand and DVR/Wulst on the other in radial organization of connectivity between layers or their equivalents, and how this may help explain the remarkable behavioral abilities of birds, there are still noteworthy organizational differences, and the crux of my paper has to do with these differences.
Figure 12.
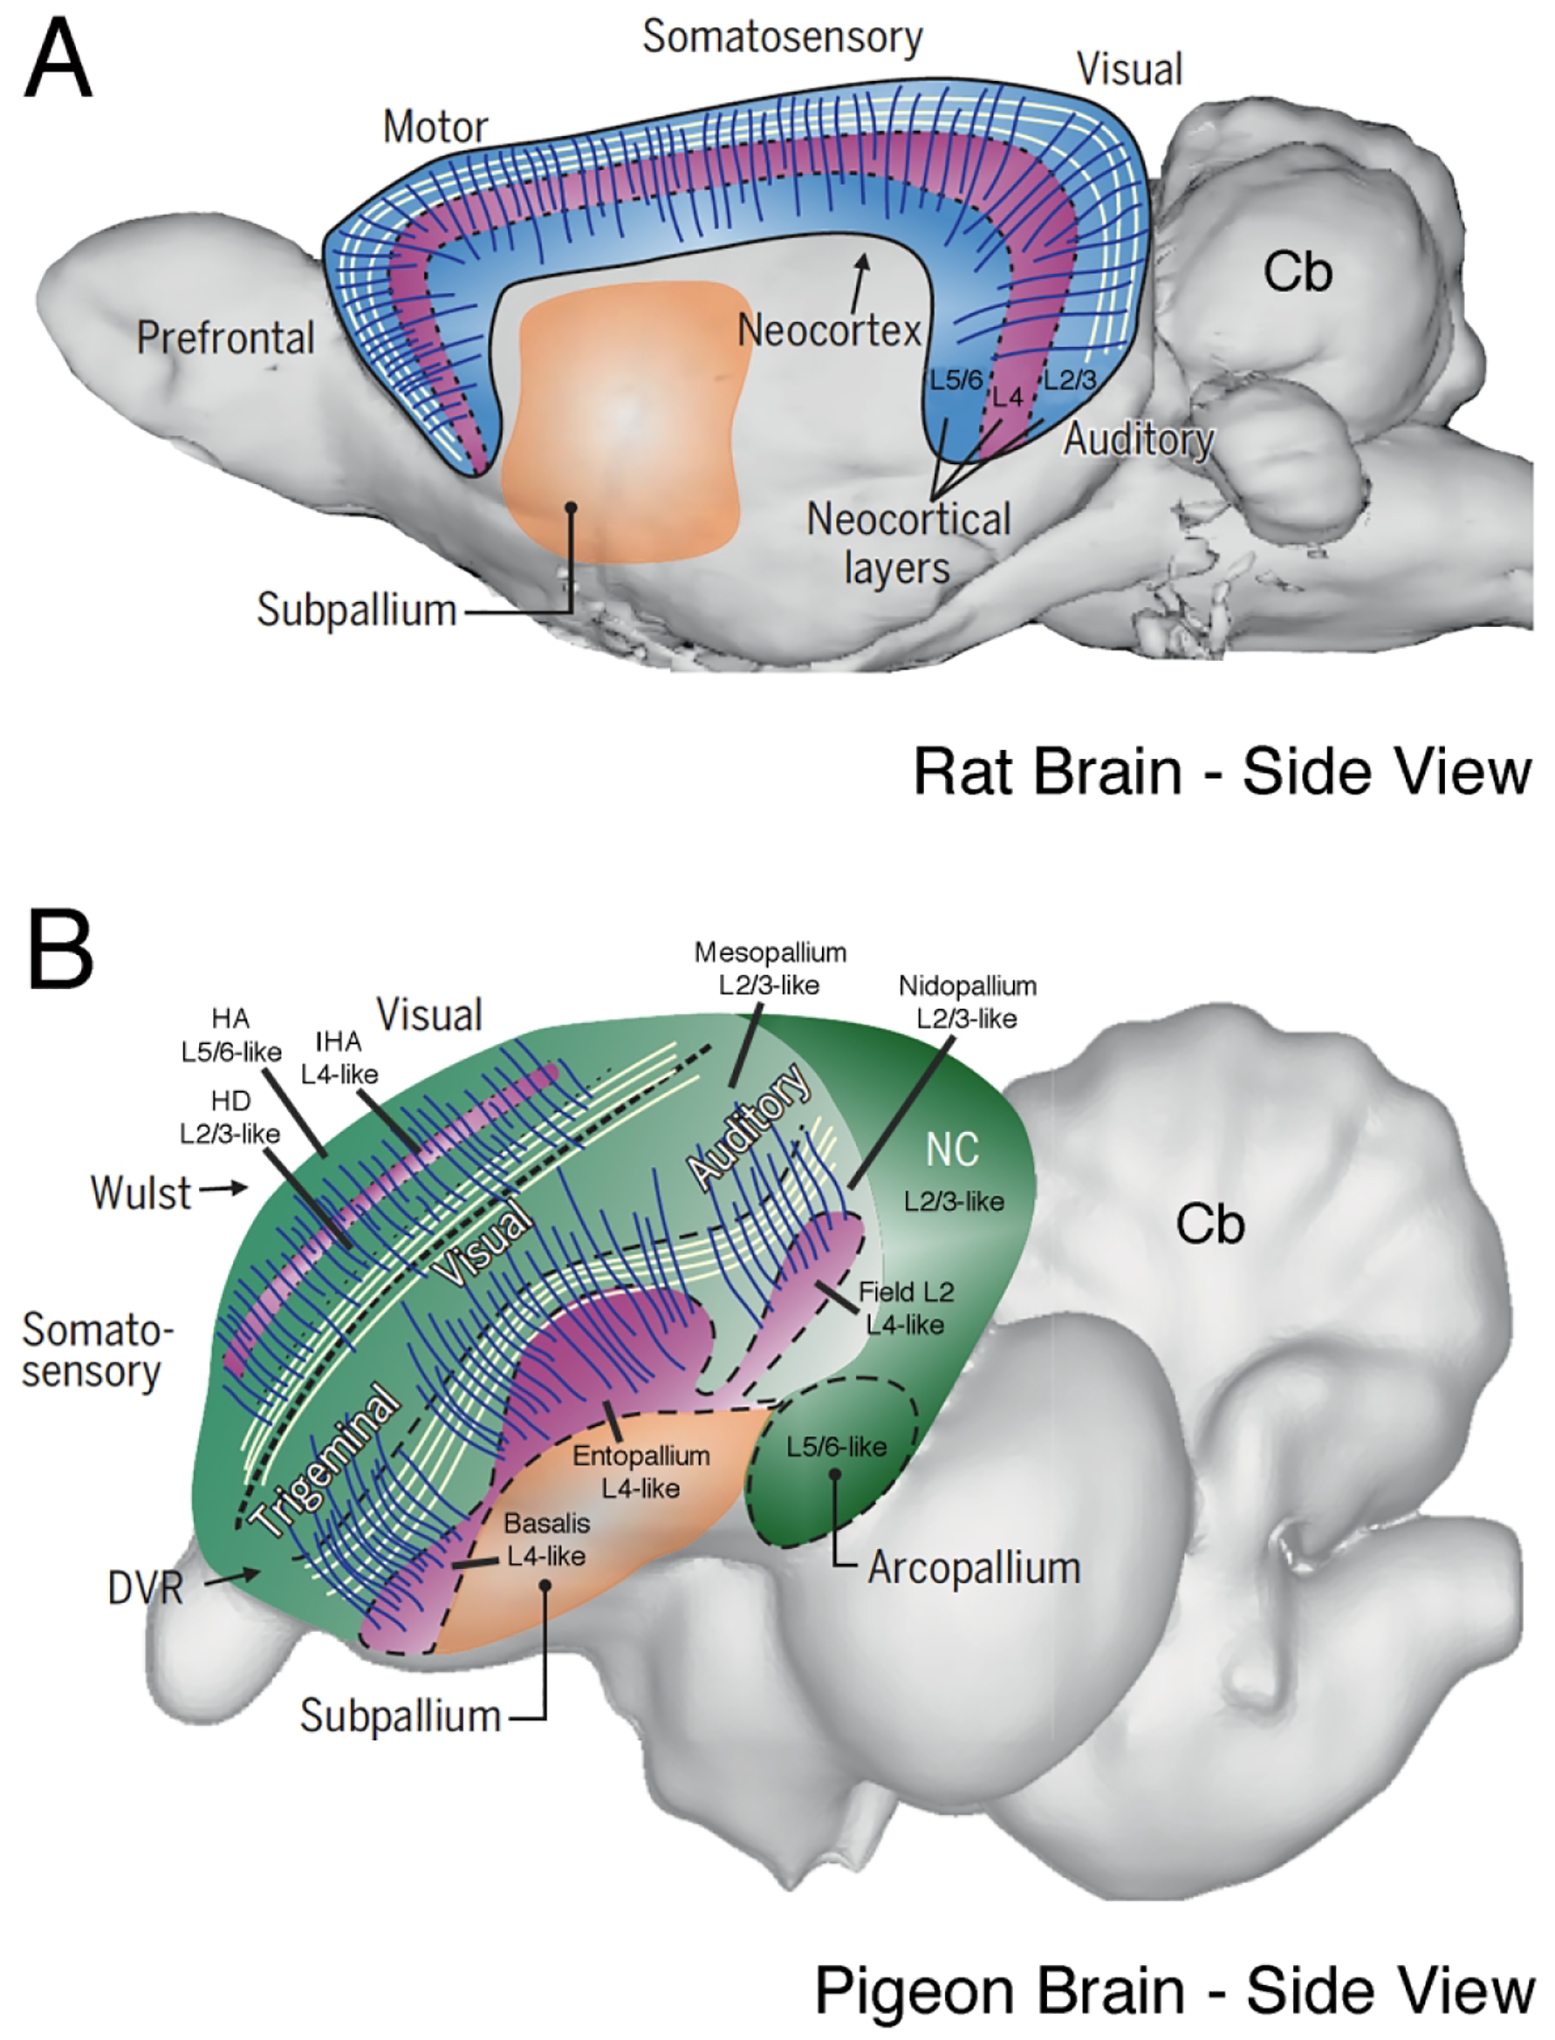
Schematic illustrations showing rat brain (A) and a pigeon brain (B) in side view, depicting the radial pallial organization described in Stacho et al., (2020). Image A of rat brain shows the radial organization of six-layered mammalian neocortex, with thalamorecipient layer 4 color coded purple and the supragranular layers 2/3 and the infragranular layers 5/6 color coded blue. The dark blue strands passing through the cortical layers indicate the radial, columnar organization of its processes (dendrites and axons), while the white strands orthogonal to the dark blue strands indicate the horizontal connections among cortical columns. Image B shows the Wulst and DVR of the avian pallium. The primary sensory input layer 4-like thalamorecipient zone of the Wulst, namely the intercalated nucleus of the hyperpallium apicale (IHA), is coded in purple, as are the primary sensory input layer 4-like thalamorecipient zones of the DVR, namely the trigeminal sensory nucleus basalis, the tectofugal visual entopallium, and the auditory Field L2. Note that the thalamorecipient zones of the DVR reside in the deeper part of the nidopallium, and each is surrounded by the layer 2/3-like neurons of their nidopallial belts. The layer 2/3-like neurons of mesopallium reside above the nidopallium. The dark blue strands passing through the Wulst pseudo-layers and from thalamorecipient nidopallium through nidopallium belt and into mesopallium indicate the radial, columnar organization of the axonal connections among these regions. As for mammals, the white strands orthogonal to the dark blue strands indicate the horizontal connections among pallial regions. Note that, although not indicated in image B, the layer 2/3-like neurons of the nidopallium caudale (NC) receive input from nidopallium belt and mesopallium, with the NC then projecting to the layer 5/6-like neurons of arcopallium. The inputs to NC and arcopallium, which complete the neocortex-like circuitry of the DVR, are not radially organized. Moreover, nonsensory parts of DVR are also not radially organized. Thus, the radial organization of avian pallium only partly mimics that of mammalian neocortex. Abbreviations: Cb, cerebellum; DVR, dorsal ventricular ridge; HA, hyperpallium apicale of the Wulst; HD, hyperpallium densocellulare of the Wulst; IHA, intercalated nucleus of HA; NC, caudal nidopallium. The schematic is adapted from Figure 8C of Stacho et al (2020), and is used with permission of author and publisher.
Axon Length Consideration and the Cortical Column Equivalent in Sauropsids.
Thus, separate nuclear cell groups in the avian Wulst and DVR that are interconnected and carry out a single modality-specific function represent the equivalent of a cortical area. For example, Figure 11B shows that the entopallium, its belt, the dorsolateral belt target, and part of the arcopallium (four separate pallial territories in bird) are the equivalent of a single cortical area, specifically, postrhinal temporal visual cortex in mouse (Beltramo and Scanziani, 2019), and the individual sets of neurons in each that are connected across the separate nuclear groups are the equivalent of cortical columns. Importantly, as noted in the prior section, the neurons making up the equivalents of a cortical column in birds are on the whole more distant from one another than the neuronal elements in a mammalian cortical column (Figs. 9, 11). Clearly, however, the avian pallium, even with its greater axonal length between the layer-equivalent populations of a specific cortical area-equivalent, can subserve sophisticated behaviors such as flocking, tool making, vocalization, and parental care (Pepperberg, 1999; Emery and Clayton, 2004a,b; Emery, 2006; Balakhonov and Rose, 2017; Auersperg and von Bayern, 2019; Pika et al., 2020). It may be that the very high neuronal density in the avian pallium serves to reduce the axonal distances between layer-type groupings that would otherwise occur (Olkowicz et al., 2016; Herculano-Houzel, 2017). It also may be that the surprising switch from use of VGLUT1 as in mammals and non-archosaur reptiles to VGLUT2 as the vesicular transporter used by glutamatergic pallial neurons to load glutamate into synaptic vesicles may have facilitated synaptic transmission between interconnected parts of a “cortical” column in avian pallium, and thereby compensated for the synaptic delays caused by axon lengthening associated with the avian type pallial organization (Fremeau et al., 2004; Islam and Atoji, 2008; Briscoe et al., 2018; Sarkar and Atoji, 2018; Zhang et al., 2018). Moreover, it may that the mesopallium is an avian innovation that serves as an association area to subserve complex cognition. It may also be that the distances between the layers of neocortex, or their equivalents in bird pallium, are not as critical to the functioning of the cortical column (or its equivalent in birds) as widely supposed, at least at the distances exhibited in extant avians.
Living birds, however, have only a limited number of interconnected pallial regions that form the equivalent of cortical areas. Although the precise number is unknown, in birds with simpler pallia, such as pigeons or chickens, it is likely to be comparable to that in a rodent - insectivore grade of mammal, based on behavioral considerations, and this is consistent with the number of separate pallial areas reported by Shanahan et al. (2013) for pigeons, as noted above. An avian pattern of telencephalic organization in dinosaurs could have proven a limiting factor in the ability of troodon descendants to acquire the neural substrate needed for language and complex planning and tool use (i.e. attaining a human intelligence level), due to the information processing inefficiencies introduced by adding additional areas to an avian-type pallium, causing ever increasing axonal length between them. Increases in the number of pallial areas in either a mammalian pallium or an avian-type pallium are thought to occur by parcellation from existing areas, with the new pallial areas receiving input from new thalamic nuclei parcellated from existing thalamic sensory nuclei and/or from the pre-existing pallial sensory areas (Ebbesson, 1980; Rakic, 2009). This seems to be the case for cortical areas that have been added during the evolution of various mammalian lineages from a more basal condition (Kaas, 2011, 2019; Kaas and Preuss, 2014). In birds, the individual layer-equivalents of any such new areas would have to be spatially separated from one another, since this is characteristic of an avian-type pallial organization. The various cell groups that would have to be added to achieve the equivalent of adding new cortical areas within an avian-type pallial plan would need to be interpolated among existing areas, presumably near the same layer equivalent-type neurons of the same modality (Fig. 13). Note, however, that this would require increasing distances between neurons corresponding to the various layer-equivalents of pre-existing areas. This would be especially true in the case of projections from the sensory belt regions (layer 2/3-equivalents) to the layer 5a equivalents at the dorsolateral telencephalic surface and from this latter population to the layer 5b/6 equivalents in the arcopallium (Fig. 13) (Veenman et al., 1995). This increase in axon length between the cell fields making up the scattered cell types constituting the equivalent of a single cortical area would become especially problematic as the number of cortical area equivalents approached a human ~200 cortical areas (with its attendant 16.3 billion neurons). Measurements of the approximate interlaminar distances in a variety of mammalian and avian species with known neocortical/pallial neuron abundances or known numbers of cortical areas (or their avian equivalents) would be needed to scale the magnitude of the distance increases with increasing abundance of neocortical/pallial neurons or cortical areas approaching a human level. Nonetheless, as a rough approximation, one can conjecture that to go from the presumptive 10 cortical area-equivalents in a chicken to a human 200 (and thus at least a 20-fold larger pallium), the distance between the field L belt layer 2/3-like neurons to the dorsolateral pallial layer 5a-like neurons would roughly increase to about 90 millimeters, compared to the approximately 1.5 mm seen in human A1 (Hackett et al., 2001). With dinosaur humanoid body size comparable to that in a human, this distance would increase yet more, because larger bodies yield larger brains to support and manage the sensory and motor needs of the body. Similarly, the distance between the dorsolateral pallial layer 5a-like neurons to the layer 5b/6-like neurons of arcopallium would become about 40 mm in an avian pallial design with a human-matching 200 cortical areas, compared to the approximately 0.2 mm distance seen between the midpoints of upper and lower layer 5 in human A1 (Hackett et al., 2001).
Figure 13.

Panel A shows a schematic summary diagram in sagittal view of the higher order pallial components of the trigeminal input (T) to the DVR, the tectofugal visual input (V) to the DVR, and the auditory input (L) to the DVR, in each case with the thalamorecipient layer 4-like territory color coded green, the nearby layers 2/3-type territories and the more remote layer 2/3-like territories of the external nidopallium color coded purple, and the layer 5/6-like arcopallial regions color coded red. Arrows indicate the interconnected regions. Panel B shows the consequences of a hypothetical pallial expansion, with 4 new sets of interconnected pallial territories added. In this instance as well, the input recipient territories (either from thalamus or another pallial area) are color coded green, the layer 2/3 territories are color-coded purple, and the output territories of the arcopallium color coded red. Arrows are shown interconnecting the input, layer 2/3 territories and arcopallial output territories, with arrows color coded by the type of neuronal population from which they originate. Note that with the interpolation of new areas in B, path lengths between pre-existing interconnected regions are increased. The problem would be yet more exacerbated with the addition of even more new regions. As for Figure 11, I should note that although the arcopallium is the output region of the DVR, HA (not shown in this illustration) is the output region of Wulst.
Such an increase in axon length between layer-equivalent neurons expected for a dinosaur humanoid would predict a greater and greater loss in processing efficiency due to increasing axon length as more and more of the new separate cell populations representing the separate layer-equivalents of the new cortical area equivalents are interposed between the separate neuronal populations representing the pre-existing cell groups making up functionally distinct areas. Additionally, the need for increasing axon length to interconnect the layer equivalents of a cortical area would itself cause an increase in the volume of pallium in an avian type organization, and exacerbate the problem of lengthening of interlaminar axonal connections by being an additional factor that causes axons to need to be longer. Any thickening of axons or increases in myelination to increase conduction velocity would exacerbate the volumetric expansion problems caused by cortical enlargement. In contrast, the need to lengthen axons between neurons in different layers does not occur in the mammalian lineage because cortical expansion in mammals occurs by adding new cortical areas, which will consist of an array of columns with intracolumnar translaminar connections of relatively invariant short distances, like any other cortical area. Under these circumstances, there would be only minimal increase in axon length between the various laminar constituents of new cortical areas due to the slight increase in cortical thickness in higher primates, since the distance between the neurons of each layer remains relatively constant across neocortex otherwise.
Thus, increasing the number of pallial regions in a dinosaur that together are equivalent to a cortical area in mammals to a total of 200 areas would likely lower the efficiency of information processing because of the distributed nature of the elements of a pallial information processing unit (i.e. the neuron types equivalent to those in a cortical column) in dinosaurs. This inefficiency may not have been so great or insuperable that it prevented the dinosaurs that did live from displaying complex behaviors on a par with living birds. Nor does this inefficiency hinder those extant avians with large neuron-enriched pallia from showing sophisticated behaviors. The inefficiency may, however, have created a ceiling, such that increasing interconnected pallial areas in a dinosaur to the equivalent of 200 efficiently functioning cortical areas in a human could not be achieved. Note also that, the cerebral volume required for a human type of cerebral organization would be greater with an avian-type cerebral organization because increasing the number of areas requires an additional increase in the axon volume needed to interconnect the distributed elements of a cortical information processing unit. For example, going from 100 to 200 cortical areas in a primate of given size would require a doubling of neocortical neuronal volume, but no separate major increase in volume of the processes interconnecting layers within any given area. By contrast, going from 100 to 200 cortical areas in a primate-like theropod of given size would require a doubling of overall pallial neuronal volume, but more than a doubling of the axonal volume interconnecting the layer-like units of all 200 cortical area equivalent. Assuming axon length between all layer-equivalents neuronal populations at 200 cortical areas in a primate-like theropod is twice what it is with 100 areas, the volume of axons interconnecting the layer-like units of all 200 cortical area-equivalent would increase disproportionately with the dinosaur/avian design. Although the relative gray versus white matter volume of avian pallium has not been quantified (and it is certainly unknown for dinosaurs), as an example, if the gray matter – white matter volume ratio for a sauropsid pallium with 100 cortical area-equivalents is 80:20, assuming a doubling of axon distances for all areas, for a sauropsid pallium with 200 area-equivalents the ratio would be 80:40 for the pre-existing areas and 80:40 for the new areas, and thus 80–40 for the two combined, meaning a 20% larger dinosaur humanoid pallium than human neocortex, of similar neuron density.
The greater size and axon length requirement than with a mammalian type of cortical organization might also have introduced problems of metabolic and thermoregulatory support of such an expanded brain (Laughlin and Sejnowski, 2003; Sherwood et al., 2012; Hofman, 2014; Karbowski, 2014; Pontzer et al., 2016; Heldstab et al., 2022), and thereby additionally limited the extent of expansion possible. Note that although an increase in pallial neuron density in a primate-like theropod lineage could theoretically have compensated for the problems described above, there is likely to be a limit on neuron cell body packing density, due to the need for space for blood vessels for metabolic support (Kaas and Preuss, 2014; Kumar et al., 2022; Ventura-Antunes and Herculano-Houzel, 2022), dendrites for the plasticity underlying learning and cognition (Harris, 1999; Chklovskii et al., 2002; Spires-Jones and Knafo, 2012; Segal, 2017), and glia for neuronal and axonal support (Wilson, 1997; Newman, 2003; Hughes et al., 2012; Sierra et al., 2014; Simons and Nave, 2016; Lenz and Nelson, 2018).
Finally, it should be noted that the argument presented above posits that the anatomy of the DVR would lead to axon length problems as cortical areas were added to the DVR. It could be argued that the Wulst might not be plagued by such problems because it is quasi-laminar. It might be further argued that evolution in a primate-like theropod might have favored increasing the number of areas in the Wulst rather than the DVR, and thereby mitigated the axon length problem attending DVR expansion. While this is certainly true, it remains the case that dinosaurs must have already possessed a substantial DVR that they could not readily transform to being more Wulst-like or do away with. Thus, while preferential expansion of the Wulst might have been a more efficient path (one that is chosen in owls at least for vision and somatosensory systems, but not in other birds such as ravens, crows and parrots) (Iwaniuk and Hurd, 2005), the very presence of a DVR limits the efficient expansion possible because it would not be trivial to “undo” the DVR. This is especially the case when it is considered that much addition of areas has occurred in the mammalian functional correspondent of DVR, namely the temporal neocortex (Shimizu and Karten, 1990; Butler et al., 1994, 2011; Karten, 1997, 2015; Reiner, 1993, 2000; Yamamoto and Reiner, 2007). Moreover, the Wulst is only quasi-laminar, and thus beset by the same axon length problems as in the case of the DVR, though to a considerably lesser degree.
Folding Consideration.
Cortical areas in mammals are interconnected with one another in a hierarchical fashion within modality and across modalities (Fellemen and Van Essen, 1991; Young et al., 1994; Van Essen, 2013; Wang and Clandinin, 2016). This interaction seems to be one of the underpinnings of the higher order processing ability of primates and humans. Increasing axon length requirements, however, would certainly be a potential problem in the case of the addition of new cortical areas, since they would need to be interconnected, at increasingly remote distances, and this could constrain the benefits of such interareal connections. Consistent with the premise that an increase in cortical areas leads to a disproportionate increase in interareal cortical connections, cortical white matter volume increases more greatly with brain size increase than does cortical gray matter volume in primates, and in humans represents about 50% of cortical volume (Frahm et al., 1982; Hofman, 2014; Kaas and Preuss, 2014; Van Essen et al., 2019). One major way in which the architecture of cerebral cortex as a surface structure has made it possible to reduce this difficulty, to a large extent, is by its ability to fold into gyri and sulci (Wang and Clandinin, 2016), as typically occurs in species with a large cortical surface area, with only a few exceptions such as manatees (Welker, 1990). Van Essen has shown, in fact, that two adjacent cortical areas that are interconnected typically are often on the opposite sides of a gyrus (Van Essen, 1997). By becoming apposed at their deep surfaces, such cortical areas greatly reduce the length of axon required to interconnect them (Fig. 14). In general, such folding allows an increase in the cortical surface area and the number of cortical areas relative to the rest of the brain, without a net gain in the length of axon required to interconnect any set of related adjacent cortical areas, thereby combatting the axon length problem otherwise created by an increase in cortical areas (Cherniak et al., 2004; Bayly et al., 2014; Hofman, 2014). By contrast, the nonlaminar structure of a DVR makes it virtually impossible for folding at the surface of the pallium to reduce axon length by bringing adjacent, functionally related areas closer together, in the hypothetical circumstance of the addition of the equivalents of new cortical areas summing to the total of 200 putatively needed for a human level. Note that for DVR, the neuronal groups comparable to layers 4, 2/3, 5a, and 5b/6 for each neocortex area-equivalent are separate, so any folding to bring related area-equivalents together to reduce axon length between them would need to occur separately for each. For example, if a second auditory area equivalent were to be added to the DVR design (calling Field L Aud1 in this example and the new auditory field Aud2), the layers 2/3/4-like medial nidopallial parts of Aud1 and Aud2 would need to fold so their tonotopic maps are aligned, the layer 5a-like lateral nidopallial parts of Aud1 and Aud2 would need to fold to align them topographically, and the layers 5b/6-like arcopallial parts of Aud1 and Aud2 would need to fold to align them topographically. While the quasi-laminar structure of Wulst and its location at the dorsomedial surface of the telencephalon might lend the Wulst to such folding, no examples of such folding are seen in any living birds with a large Wulst (Iwaniuk and Hurd, 2005). Even if the Wulst did fold, say to juxtapose the existing V1 of Wulst to a newly evolved V2, the DVR would still have the problem that it could not fold to solve the problem of the need for increased axon length to interconnect functionally related adjacent pallial regions comparable to different cortical areas in mammals.
Figure 14.

Schematic illustration showing that in a cortical organization, adjacent interconnected areas can be brought into juxtaposition at their bases by inward folding at their border, resulting in mirror image representations and a conservation of axon length between them.
In the case of mammalian cerebral cortex, only adjacent areas can fold to reduce the distance between them. Thus, with an increase in cortical areas, the problem of connecting increasingly distant areas, and thereby increasing axon length, is not entirely eliminated. A way in which this problem seems to have been addressed is for local sets of cortical areas to be highly interconnected (referred to as a small world network), with more sparse connections between small world sets of cortical areas (Wang and Clandinin, 2016). In this light, it is of interest that avian pallial areas seem to use the same strategy in their functioning, since Shanahan et al. (2013) report that pigeon pallium is organized into small-world networks with a connective core of hub nodes. Thus, avian pallium uses at least one of the strategies for reducing axon length and volume burden with increasing pallial volume that is also used in the case of mammalian neocortex. It seems likely that any primate-like evolution of theropod dinosaurs might also have employed this partial solution to the problem of increasing axon length between area-equivalents with increased number of cortical area equivalents. Note also, that the nuclear configuration of the avian pallium may itself be an adaptation that serves to reduce distances between pallial regions corresponding to layer-equivalents of different neocortical areas, distances that would be greater in the case of a more linear arrangement of side-by-side pallial regions (Fig. 15). It may be that this feature of a nuclear pallial plan for reducing the distances for horizontal connectivity in the absence of folding, together with the small world network plan and the high neuron densities, helps explain why the avian pallial design, despite its issues with axon length between cortical layer equivalents, is able to support the sophisticated behaviors seen in crows and parrots.
Figure 15.

Schematic illustration showing that in a nuclear organization such as in the avian pallium adjacent interconnected areas representing the same point in sensory space are brought about 30% closer together than they would be in a cortical design with no folding. This feature may reduce axon length in the nuclear design of the avian pallium for connections between regions, but not totally overcome the limitations of the inability to fold and thereby bring adjacent areas into juxtaposition, and the limitations of the great distances between the dispersed correspondents of neuron types found in different cortical layers in mammals.
Mapping of Two-Dimensional Space Consideration.
Many types of sensory space, such as visual and somatosensory, lend themselves to being mapped in a two-dimension X-Y layout. This makes two-dimensional sheets of neurons such as characterize mammalian cerebral cortex ideal for mapping and processing information of this type (Kaas, 1997). Orderly projections between cortical areas are also facilitated by the two-dimensional architecture of mammalian cerebral cortex, since this makes topographically ordered fine detail point to point transmission of information possible (Kaas, 1997). This is even true if the information transmitted does not involve a map of sensory space. The sheet-like architecture of mammalian cerebral cortex may further its ability to efficiently process information because of precise point-to-point topographic mapping considerations or because of a greater efficiency of lateral inhibition with two-dimensional neuroarchitecture (Knudsen et al., 1987; Kaas, 1997; Helmstaedter et al., 2009; Wilimzig et al., 2012; Biswas et al., 2022). By contrast, the three-dimensional architecture of the nuclear DVR and to a lesser extent the Wulst may pose problems for mapping of sensory space, the efficiency of lateral inhibition, and/or the fine-grained point-to-point projections between different pallial regions (Wild, 1987; Reiner and Karten, 1983; Pettigrew and Konishi, 1976; Shimizu et al., 1995; Manger et al., 2002: Atoji et al., 2018a, 2018b; Stacho et al., 2020). Possible examples reflecting this design constraint of avian pallium are that: 1) receptive fields in owl visual Wulst are no smaller than 2°, while in mammals they can be as small as 1° in V1 (Smith et al., 2001; Clark and Columbo, 2020) ; and 2) the size of the iso-orientation domains in barn owl visual Wulst is larger than those found in area V1 of cat and monkey (Liu and Pettigrew, 2003). Further studies that detail topographic precision in avian pallial circuits throughout their key steps are needed to address these possibilities (Witkovsky et al., 1973; Hellmann and Güntürkün, 2001; Fredes et al., 2010). At least one sensory area of DVR in birds, the auditory area (Field L) has evolved to be a flat sheet within the DVR, thereby facilitating the precise mapping of a tonotopic map along its extent (Calabrese and Woolley, 2015; Ahumada-Galleguillos et al., 2015; Fernandez et al., 2019a). In principle, other parts of DVR could also evolve to be flat sheets to aid point-to-point precision in projections within and between areas. To do this for all functionally distinct regions in an avian type pallium, however, would require that existing areas be transformed into flat sheets, and that any new areas be intercalated among the existing areas to efficiently use space without requiring a taxing expansion of telencephalic volume. Fitting so many flat sheets within a three-dimension space would require an Escher-like degree of tesselation that does not seem simple to evolve or to control developmentally. While the failure to consistently map information on a two-dimension space has not been a critical problem for living avians, this factor could have imposed a further limit on the efficacy of information processing as the pallium expanded and been an additional factor that constrained the ability of troodon, or a similar dinosaur, to evolve to a human cognitive state.
Conclusions and Approaches for Falsifying Current Conclusion
In summary, then, I have offered several lines of reasoning for the conclusion that neither troodon nor any other dinosaur could have begun a primate-like lineage that evolved to a human level of intelligence. The argument is based on some important fundamental differences in organization between an avian type nuclear pallium and mammalian sheet-like cerebral cortex. Although these differences do not preclude the evolution of comparable cognitive abilities in birds and nonhuman mammals, the idea presented here is that the differences may be important for the evolution of a human level of intelligence. Thus, while the advantages of arraying neurons into layered sheets at the surface as opposed to cell groups scattered throughout a large three-dimensional mass might not have been evident in early members of the mammalian and reptilian lineages (were there any person present at the time to assess their relative advantages) when these patterns first emerged, my suggestion is that this arrangement in mammals possessed a greater potential for efficient expansion than did the sauropsid arrangement. In this regard, it is of interest to consider the possibility therefore that the two starting points (the reptilian and the mammalian) may have seemed trivially different at the outset (Reiner, 1993, 2000; Reiner et al., 2005), yet the differences may have constrained the limit of what could be evolved from them.
Clearly, it is highly speculative to consider whether dinosaurs in general or any given dinosaur, for example theropods such as troodon, could have evolved to a human intelligence level. One difficulty inherent to such an endeavor is that the conclusions reached are in the end immune to both direct experimental scrutiny, and thus empirical validation or falsification, by seeing the alternative outcome of natural history. Nonetheless, there are two points to be made in favor of such an effort in speculation. First, the conclusions reached derive from a set of assumptions. The merits then of the conclusions can be assessed by evaluating the merits of the assumptions. Does the avian (and presumptive dinosaur) pallial design, for example, become increasingly inefficient with the addition of pallial areas beyond that seen in crows or parrots? Are there examples of such inefficiency? Certainly, there are examples of neocortex-like coding in DVR, such as the study of visual feature extraction in DVR by Azizi et al. (2019), and the studies showing resemblance of neuronal coding in the caudolateral nidopallium (NCL) to that in mammalian prefrontal cortex (Nieder, 2017; Nieder et al., 2020; Hahn et al., 2021; Wagener & Nieder, 2020), but most studies that have been done have emphasized similarities rather than differences between birds and mammals. The inefficiency should be most manifest for the projections from the layer 2/3-like sensory belt regions of DVR to the layer 5a-like neurons of dorsolateral pallium, and the projection from these layer 5a-like neurons to the layer 5b/6 neurons of arcopallium. Is any such inefficiency manifest in living birds, or do the axon distances only become a problem with expansion to a humanoid 200 cortical areas and/or 16.3 billion pallial neurons? Secondly and relatedly, assessing the merits of these assumptions encourages us to consider the functional consequences of the differences in “cerebral” architecture between birds and mammals. This issue may have implications for intelligent computer design, particularly if the avian design involves some unique solutions to the axon length problem. I believe thus that the merits of the notions presented here can be assessed further and doing so will provide benefit by deepening understanding of the computational power attainable with different types of forebrain organization.
The approach I have taken in concluding that it might not have been possible for a dinosaur humanoid to evolve from troodon involves speculating about the axon length problem created by the expansion of the avian/dinosaur pallial design to the correspondent of a human level of 200 cortical areas, with an attendant 16.3 human level pallial neuron abundance. As noted previously in this paper, numerous studies have reported that corvids and parrots parallel primates in their intelligence, even in some regards paralleling some ape species (including chimpanzee), despite their much smaller brain size. As noted previously, the Shanahan et al. (2013) estimate of 48 separate pallial regions in pigeons leads to the conclusion that pigeons have the equivalent of about 10 cortical areas in a mammal, putting pigeons in the range of primitive living mammals such as insectivores. Since pigeon pallium has 50–70 million pallial neurons (Olkowicz et al., 2016; Ströckens et al., 2022), does this mean that a pigeon-size corvid such as the rook with about ten times as many pallial neurons (Ströckens et al., 2022) has the equivalent of 100 or so cortical areas in its pallium? If so, does it perform the same in cognitive tasks as primates possessing 100 cortical areas and around 500 million cortical neurons, such as marmosets (Olkowicz et al., 2016). Taking this approach in evaluating the ideas presented here requires mapping of pallial areas in birds using criteria similar to those used in mammals, but it does get at the issue of the whether an avian design with a particular number of cortical areas performs less well than the mammalian design with the same number of cortical areas, and whether any such disparity grows greater with increasing numbers of “cortical” areas.
Finally, I want to again emphasize that the ideas presented here should not be construed as promoting a return to the outdated notion that mammals are inherently more intelligent than birds because they possess a laminar pallium (the neocortex) and birds possess a nuclear pallium (the Wulst and DVR). Rather, I am suggesting that a laminar pallium may be more expansible to a human level without a significant loss of processing power than is a nuclear pallium. Clearly, however, the avian-style pallium can be expanded in size, complexity and neuron abundance to allow the impressive, adaptive behavior and cognitive achievements seen in crows and parrots, for example (Emery and Clayton, 2004a,b; Emery, 2006; Balakhonov and Rose, 2017; Cabadayi and Osvath, 2017; Auersperg and von Bayern, 2019; Pika et al., 2020; Sol et al., 2022). Such behaviors and cognitive achievements rival those seen in nonhuman primates, and are not seen in most mammalian species, and establish that a neocortical pallial organization is not needed for high-level behavioral sophistication (Shimizu and Karten, 1991; Reiner et al., 2001; Jarvis et al., 2005; Reiner, 2005, 2009; Güntürkün and Bugnyar, 2016; Guy and Staiger, 2017). I am, however, suggesting that the nuclear avian pallium sets a limit on the intelligence level that can be achieved, a limit that can be surpassed by a neocortical pallium – precluding a dinosaur humanoid in the sauropsid lineage, but enabling humans in the mammalian lineage.
Acknowledgements
I gratefully thank Drs. Steven E. Brauth, Laura Bruce, Ann Butler, Tom Finger, Bill Hodos, Harvey J. Karten, Loreta Medina, Zoltan Molnar, R. Glenn Northcutt, Alice Powers, Luis Puelles, Cliff Ragsdale, Georg Striedter, and Kei Yamamoto for their provocative discussions with me on the topic of forebrain evolution over the years. In particular, the notions presented here are an outgrowth of discussions that Steve Brauth and I had a number of years ago, and Tom Finger, in particular, provided constructive input and encouragement on the manuscript. The published research from my laboratory presented here has been supported by NS-19620, NS-28721, EY-05298, and The Methodist Hospitals Endowed Professorship in Neuroscience.
Footnotes
Conflict of Interest Statement: The author has no interest or relationship that might be perceived as influencing his objectivity.
Ethics Approval Statement: This is a review paper and no original, unpublished research involving animal use is presented here.
Permission to Reproduce Material from Other Sources: Has been obtained.
The human-like troodon descendant proposed by Russell and Seguin is often referred to as a dinosauroid, but this is a misuse of the suffix -oid, which means -like. Thus, a dinosauroid is a creature that is like a dinosaur rather than like a human. For this reason, I use the term dinosaur humanoid.
I use the Nomenclature Forum definition of the mesopallium and hyperpallium boundaries (Reiner et al., 2004) for the reasons laid out by Montiel and Molnar (2013), Puelles et al. (2016, 2022) and Ströckens et al. (2022).
Data Availability Statement:
This is a review paper and all data used have already been published by diverse authors, and the cited papers are publicly available.
References
- Abellán A, Legaz I, Vernier B, Rétaux S, & Medina L (2009). Olfactory and amygdalar structures of the chicken ventral pallium based on the combinatorial expression patterns of LIM and other developmental regulatory genes. Journal of Comparative Neurology, 516, 166–186. [DOI] [PubMed] [Google Scholar]
- Alberch P (1982). Developmental constraints in evolutionary processes. In Bonner JT, & Dawid IB (Eds.), Evolution and Development, Dahlem Konferenzen (pp. 313–332). Berlin, Heidelberg, New York: Springer-Verlag. [Google Scholar]
- Alexander DE (2015). On the Wing: Insects, Pterosaurs, Birds, Bats and the Evolution of Animal Flight. New York, NY: Oxford University Press. [Google Scholar]
- Alvarez LW (1987). Mass extinctions caused by large bolide impacts. Physiology Today, 40, 24–33. [DOI] [PubMed] [Google Scholar]
- Alvarez LW, Alvarez W, Asaro F, & Michel HV (1980). Extraterrestrial cause for the cretaceous-tertiary extinction. Science, 208, 1095–1108. [DOI] [PubMed] [Google Scholar]
- Alvarez W, Kauffman EG, Surlyk F, Alvarez LW, Asaro F, & Michel HV (1984). Impact theory of mass extinctions and the invertebrate fossil record. Science, 223, 1135–1186. [DOI] [PubMed] [Google Scholar]
- Amunts K, Morosan P, Hilbig H, & Zilles K (2012). Auditory System. In Mai JK, & Paxinos G (Eds.), The Human Nervous System, Third Edition (pp. 1270–1300). Amsterdam: Elsevier. [Google Scholar]
- Atoji Y, & Wild JM (2009). Afferent and Efferent Projections of the Central Caudal Nidopallium in the Pigeon (Columba livia). Journal of Comparative Neurology, 517, 350–370. [DOI] [PubMed] [Google Scholar]
- Atoji Y, & Wild JM (2011). Afferent and efferent projections of the mesopallium in the pigeon (Columba livia). Journal of Comparative Neurology, 520, 717–741. [DOI] [PubMed] [Google Scholar]
- Atoji Y, & Wild JM (2012). Afferent and efferent projections of the mesopallium in the pigeon (Columba livia). Journal of Comparative Neurology, 520, 717–741. [DOI] [PubMed] [Google Scholar]
- Atoji Y, & Karim MR (2014). Homology of the mesopallium in the adult chicken identified by gene expression of the neocortical marker cholecystokinin. Neuroscience Letters, 562, 85–89. [DOI] [PubMed] [Google Scholar]
- Atoji Y, Sarkar S, & Wild JM (2018a). Differential projections of the densocellular and intermediate parts of the hyperpallium in the pigeon (Columba livia). Journal of Comparative Neurology, 526, 146–165. [DOI] [PubMed] [Google Scholar]
- Atoji Y, Sarkar S, & Wild JM (2018b). Projections of the densocellular part of the hyperpallium in the rostral Wulst of pigeon (Columba livia). Brain Research, 1711, 130–139. [DOI] [PubMed] [Google Scholar]
- Auersperg AMI, & von Bayern AMP (2019). Who’s a clever bird — now? A brief history of parrot cognition. Behaviour, 156, 391–407. [Google Scholar]
- Azevedo FA, Carvalho LR, Grinberg LT, Farfel JM, Ferretti RE, Leite RE, Jacob Filho W, Lent R, & Herculano-Houzel S (2009). Equal numbers of neuronal and nonneuronal cells make the human brain an isometrically scaled-up primate brain. Journal of Comparative Neurology, 513, 532–541. [DOI] [PubMed] [Google Scholar]
- Azizi AH, Pusch R, Koenen C, Klatt S, Bröker F, Thiele S, Kellermann J, Güntürkün O, & Cheng S (2019). Emerging category representation in the visual forebrain hierarchy of pigeons (Columba livia). Behavioral Brain Research, 356, 423–434. [DOI] [PubMed] [Google Scholar]
- Balakhonov D, & Rose J (2017). Crows rival monkeys in cognitive capacity. Scientific Reports, 7, 8809. [DOI] [PMC free article] [PubMed] [Google Scholar]
- Balanoff AM, Bever GS, Rowe TB, & Norell MA (2013). Evolutionary origins of the avian brain. Nature, 501, 93–96. [DOI] [PubMed] [Google Scholar]
- Balaram P, & Kaas JH (2014). Towards a unified scheme of cortical lamination for primary visual cortex across primates: insights from NeuN and VGLUT2 immunoreactivity. Frontiers in Neuroanatomy, 8, 81. [DOI] [PMC free article] [PubMed] [Google Scholar]
- Bayly PV, Taber LA, & Kroenke CD (2014). Mechanical forces in cerebral cortical folding: A review of measurements and models. Journal of the Mechanical Behavior of Biomedical Materials, 29, 568–581. [DOI] [PMC free article] [PubMed] [Google Scholar]
- Beltramo R, & Scanziani M (2019). A collicular visual cortex, neocortical space for an ancient midbrain visual structure. Science, 363, 64–69. [DOI] [PubMed] [Google Scholar]
- Bennett M (2020). An attempt at a unified theory of the neocortical microcircuit in sensory cortex. Frontiers in Neural Circuits, 14, 40. [DOI] [PMC free article] [PubMed] [Google Scholar]
- Benton MJ (2004). Vertebrate Palaeontology, Third Edition. Hoboken, NJ: Wiley-Blackwell Publishing. [Google Scholar]
- Benton MJ, & Donoghue PCJ (2007). Paleontological evidence to date the tree of life. Molecular Biology and Evolution, 24, 26–53. [DOI] [PubMed] [Google Scholar]
- Biswas D, Chakravarthy VS, & Tarsode A (2022). Modeling the tonotopic map using a 2-dimensional array of neural oscillators. Frontiers in Computational Neuroscience, 16, 909058. [DOI] [PMC free article] [PubMed] [Google Scholar]
- Bobrowicz K, O’Hara M, Carminito C, Auersperg AMI, & Osvath M (2012). Goffin’s Cockatoos (Cacatua goffiniana) can solve a novel problem after conflicting past experiences. Frontiers in Psychology, 12, 694–719. [DOI] [PMC free article] [PubMed] [Google Scholar]
- Boyd R, (2017). The evolution of human uniqueness. Spanish Journal of Psychology, 19:E97. [DOI] [PubMed] [Google Scholar]
- Brauth SE (1984). Enkephalin-like immunoreactivity within the telencephalon of the reptile Caiman crocodilus. Neuroscience, 11, 345–358. [DOI] [PubMed] [Google Scholar]
- Briscoe SD, & Ragsdale CW (2018). Molecular anatomy of the crocodile dorsal telencephalon. Journal of Comparative Neurology, 526, 1613–1646. [DOI] [PMC free article] [PubMed] [Google Scholar]
- Briscoe SD, Albert CB, Rowell JJ, & Ragsdale CW (2018). Neocortical association cell types in the forebrain of birds and alligators. Current Biology, 28, 686–696. [DOI] [PMC free article] [PubMed] [Google Scholar]
- Brodmann K (1909). Vergleichende Lokalisationslehre der Grosshirnrinde in ihren Prinzipien dargestellt auf Grund des Zellenbaues. Leipzig: J.A. Barth. [Google Scholar]
- Bruce LL (2007). Evolution of the nervous system in reptiles. In Kaas JH JH (Ed.), Evolution of Nervous Systems (Volume 2, pp. 125–156). Amsterdam: Elsevier. [Google Scholar]
- Bruce LL, Erichsen JT, & Reiner A (2016). Neurochemical compartmentalization within the pigeon basal ganglia. Journal of Chemical Neuroanatomy, 78, 65–86. [DOI] [PMC free article] [PubMed] [Google Scholar]
- Bruce LL, & Neary TJ (1995). The limbic system of tetrapods: a comparative analysis of cortical and amygdalar populations. Brain, Behavior and Evolution, 46, 224–234. [DOI] [PubMed] [Google Scholar]
- Buckner RL, & Krienen FM (2013). The evolution of distributed association networks in the human brain. Trends in Cognitive Sciences, 17, 12. [DOI] [PubMed] [Google Scholar]
- Butler AB (1994). The evolution of the dorsal pallium in the telencephalon of amniotes: cladistic analysis and a new hypothesis. Brain Research Reviews, 19, 66–101. [DOI] [PubMed] [Google Scholar]
- Butler AB, Reiner A, & Karten HJ (2011). Evolution of the amniote pallium and the origins of mammalian neocortex. Annals of the New York Academy of Sciences, 1225, 14–27. [DOI] [PMC free article] [PubMed] [Google Scholar]
- Calabrese A, & Woolley SMN (2015). Coding principles of the canonical cortical microcircuit in the avian brain. Proceedings of the National Academy of Sciences (U.S.A.), 112, 3517–3522. [DOI] [PMC free article] [PubMed] [Google Scholar]
- Chen PJ, Dong ZM, & Zhen SN (1998). An exceptionally well-preserved theropod dinosaur from the Yixuan formation of China. Nature, 391, 147–152. [Google Scholar]
- Cherniak C (1995). Neural component placement. Trends in Neurosciences, 18, 522–527. [DOI] [PubMed] [Google Scholar]
- Chiappe LM (1995). The first 85 million years of avian evolution. Nature, 378, 349–355. [Google Scholar]
- Cherniak C, Mokhtarzada Z, Rodriguez-Esteban P, & Changizi K (2004). Global optimization of cerebral cortex layout. Proceedings of the National Academy of Sciences (U.S.A.), 101, 1081–1086. [DOI] [PMC free article] [PubMed] [Google Scholar]
- Chiari Y, Cahais V, Galtier N, & Delsuc F (2012). Phylogenomic analyses support the position of turtles as the sister group of birds and crocodiles (Archosauria). BMC Biology, 10, 65. [DOI] [PMC free article] [PubMed] [Google Scholar]
- Chklovskii DB, Schikorski T, & Stevens CF (2002). Wiring optimization in cortical circuits. Neuron, 34, 341–347. [DOI] [PubMed] [Google Scholar]
- Clark WJ, & Columbo M (2020). The functional architecture, receptive field characteristics, and representation of objects in the visual network of the pigeon brain. Progress in Neurobiology, 195, 101781. [DOI] [PubMed] [Google Scholar]
- Cnotka K, Güntürkün O, Rehkamper G, Gray RD, & Hunt GR (2008). Extraordinary large brains in tool-using New Caledonian crows (Corvus moneduloides). Neuroscience Letter, 433, 241–245. [DOI] [PubMed] [Google Scholar]
- Crawford NG, Faircloth BC, McCormack JE, Brumfield RT, Winker K, & Glen TC (2012). More than 1000 ultraconserved elements provide evidence that turtles are the sister group to archosaurs. Biology Letters, 8, 783–786. [DOI] [PMC free article] [PubMed] [Google Scholar]
- Da Costa NM, & Martin KAC (2010). Whose cortical column would that be? Frontiers in Neuroanatomy, 4, 16. [DOI] [PMC free article] [PubMed] [Google Scholar]
- Dehaene S, Al Roumi F, Lakretz Y, Planton S, Sablé-Meyer M. (2022). Symbols and mental programs: A hypothesis about human singularity. Trends in Cognitive Neurosciences, 26, 751–766. [DOI] [PubMed] [Google Scholar]
- DeVoogd TJ, & Nottebohm F (1981). Sex differences in dendritic morphology of a song control nucleus in the canary: A quantitative Golgi study. Journal of Comparative Neurology, 196, 309–316. [DOI] [PubMed] [Google Scholar]
- Dicke U, & Roth G (2016). Neuronal factors determining high intelligence. Philosophical Transactions of the Royal Society B, 371, 20150180. [DOI] [PMC free article] [PubMed] [Google Scholar]
- Dugas-Ford J, Rowell JJ, & Ragsdale CW (2012). Cell-type homologies and the origins of the neocortex. Proceedings of the National Academy of Sciences (U.S.A.), 109, 16974–16979. [DOI] [PMC free article] [PubMed] [Google Scholar]
- Dugas-Ford J, & Ragsdale CW (2015). Levels of homology and the problem of neocortex. Annual Review of Neuroscience, 38, 351–368. [DOI] [PubMed] [Google Scholar]
- Durstewitz D, Kröner S, & Güntürkün O (1999). The dopaminergic innervation of the avian telencephalon. Neuroscience, 59, 161–195. [DOI] [PubMed] [Google Scholar]
- Ebbesson SO (1980). The parcellation theory and its relation to interspecific variability in brain organization, evolutionary and ontogenetic development, and neuronal plasticity. Cell and Tissue Research, 213, 179–212. [DOI] [PubMed] [Google Scholar]
- Emery NJ (2006). Cognitive ornithology: The evolution of avian intelligence. Philosophical Transactions of the Royal Society B, 361, 23–43. [DOI] [PMC free article] [PubMed] [Google Scholar]
- Emery NJ, & Clayton NS (2004a). The mentality of crows: convergent evolution of intelligence in corvids and apes. Science, 306, 1903–1907. [DOI] [PubMed] [Google Scholar]
- Emery NJ, & Clayton NS (2004b). Comparing the complex cognition of birds and primates. In Rogers LJ, & Kaplan G (Eds.) Comparative Vertebrate Cognition (pp. 3–55). Amsterdam: Kluwer Academic/Plenum Publishers. [Google Scholar]
- Erickson GM (1999). Breathing life into Tyrannosaurus rex. Scientific American, 281, 42–49. [Google Scholar]
- Fellemen DJ, & Van Essen DC (2013). Distributed hierarchical processing in the primate cerebral cortex. Cerebral Cortex, 1, 1–47. [DOI] [PubMed] [Google Scholar]
- Fernández M, Ahumada-Galleguillos P, Sentis E, Marín G, & Mpodozis J (2019a). Intratelencephalic projections of the avian visual dorsal ventricular ridge: Laminarly segregated, reciprocally and topographically organized. Journal of Comparative Neurology, 528, 321–359. [DOI] [PubMed] [Google Scholar]
- Fernández M, Morales C, Durán E, Fernández-Colleman S, Sentis E, Mpodozis J, Karten HJ, & Marín GJ (2019b). Parallel organization of the avian sensorimotor arcopallium: Tectofugal visual pathway in the pigeon (Columba livia). Journal of Comparative Neurology, 528, 597–623. [DOI] [PubMed] [Google Scholar]
- Fernández M, Reyes-Pinto R, Norambuena C, Sentis E, & Mpodozis J (2021). A canonical interlaminar circuit in the sensory dorsal ventricular ridge of birds: The anatomical organization of the trigeminal pallium. Journal of Comparative Neurology, 529, 3410–3428. [DOI] [PubMed] [Google Scholar]
- Fortune ES, & Margoliash D (1992). Cytoarchitectonic organization and morphology of cells of the field L complex in male zebra finches (Taenopygia guttata). Journal of Comparative Neurology, 325, 388–404. [DOI] [PubMed] [Google Scholar]
- Frahm HD, Stephan H, & Stephan M (1982). Comparison of brain structure volumes in Insectivora and Primates. I. Neocortex. Journal für Hirnforschung, 23, 375–389. [PubMed] [Google Scholar]
- Fredes F, Tapia S, Letelier JC, Marín G, & Mpodozis J (2010). Topographic arrangement of the rotundo-entopallial projection in the pigeon (Columba livia). Journal of Comparative Neurology, 518, 4342–4361. [DOI] [PubMed] [Google Scholar]
- Fremeau RT, Voglmaier S, Seal RP, & Edwards RH (2004). VGLUTs define subsets of excitatory neurons and suggest novel roles for glutamate. Trends in Neurosciences, 27, 98–103. [DOI] [PubMed] [Google Scholar]
- Gardner RA, Gardner BT (1980). Comparative psychology and language acquisition. In Sebeok TA, & Umiker-Sebeok J (Eds.), Speaking of Apes: A Critical Anthology of Two-Way Communication with Man (pp. 287–330). New York: Plenum Press. [Google Scholar]
- Gerber S (2014). Not all roads can be taken: development induces anistropic accessibility in morphospace. Evolution and Development, 16, 373–381. [DOI] [PubMed] [Google Scholar]
- Glasser MF, Goyal MS, Preuss TM, Raichle ME, & Van Essen DC (2013). Trends and properties of human cerebral cortex: correlations with cortical myelin content. Neuroimage, 93, 165–175. [DOI] [PMC free article] [PubMed] [Google Scholar]
- Glasser MF, Coalson TS, Robinson EC, Hacker CD, Harwell J, Yacoub E, Ugurbil K, Andersson J, Beckmann CF, Jenkinson M, Smith SM, & Van Essen DC (2016). A multimodal parcellation of human cerebral cortex. Nature, 536, 171–178. [DOI] [PMC free article] [PubMed] [Google Scholar]
- Gould SJ (2002). The Structure of Evolutionary Theory. Cambridge, MA: Harvard University Press. [Google Scholar]
- Grellet-Tinner G, & Fiorelli LE (2010). A new Argentinean nesting site showing neosauropod dinosaur reproduction in a Cretaceous hydrothermal environment. Nature Communications, 1, 32. [DOI] [PubMed] [Google Scholar]
- Güntürkün O, & Bugnyar T (2016). Cognition without cortex. Trends in Cognitive Sciences, 20, 4. [DOI] [PubMed] [Google Scholar]
- Güntürkün O, von Eugen K, Packheiser J, & Pusch R (2021). Avian pallial circuits and cognition: A comparison to Mammals. Current Opinion in Neurobiology, 71, 29–36. [DOI] [PubMed] [Google Scholar]
- Guy J, Staiger JF (2017). The functioning of a cortex without layers. Frontiers in Neuroanatomy, 11, 54. [DOI] [PMC free article] [PubMed] [Google Scholar]
- Hackett TA, Preuss TM, & Kaas JH (2001). Architectonic identification of the core region in auditory cortex of macaques, chimpanzees, and humans. Journal of Comparative Neurology, 441, 197–222. [DOI] [PubMed] [Google Scholar]
- Hahn LA, Balakhonov D, Fongaro E, Nieder A, & Rose J (2021). Working memory capacity of crows and monkeys arises from similar neuronal computations. eLife, 10, e72783. [DOI] [PMC free article] [PubMed] [Google Scholar]
- Hamaide J, De Groof G, Van Ruijssevelt L, Lukacova K, Van Audekerke J, Verhoye M, & Van der Linden A (2018). Volumetric development of the zebra finch brain throughout the first 200 days of post-hatch life traced by in vivo MRI. Neuroimage, 183, 227–238. [DOI] [PubMed] [Google Scholar]
- Hanganu-Opatz IL, Butt SJB, Hippenmeyer S, De Marco García NV, Cardin JA, Voytek B, & Muotri AR (2021). The logic of developing neocortical circuits in health and disease. Journal of Neuroscience, 41, 813–822. [DOI] [PMC free article] [PubMed] [Google Scholar]
- Harris KD, & Mrsic-Flogel TD (2013). Cortical connectivity and sensory coding. Nature, 503, 51–58. [DOI] [PubMed] [Google Scholar]
- Harris KM (1999). Structure, development, and plasticity of dendritic spines. Current Opinion in Neurobiology, 9, 343–348. [DOI] [PubMed] [Google Scholar]
- Heldstab SA, Isler K, Graber SM, Schuppli C, & van Schaik CP (2022). The economics of brain seize evolution in vertebrates. Current Biology, 32, R697–R708. [DOI] [PubMed] [Google Scholar]
- Helmstaedter M, Sakmann B, & Feldmeyer D (2009). Neuronal correlates of local, lateral, and translaminar inhibition with reference to cortical columns. Cerebral Cortex, 19, 926–937. [DOI] [PubMed] [Google Scholar]
- Hellmann B, & Güntürkün O (2001). Structural organization of parallel information processing within the tectofugal visual system of the pigeon. Journal of Comparative Neurology, 429, 94–112. [DOI] [PubMed] [Google Scholar]
- Herculano-Houzel S, (2009). The human brain in numbers: a linearly scaled-up primate brain. Frontiers in Human Neuroscience, 3, 31. [DOI] [PMC free article] [PubMed] [Google Scholar]
- Herculano-Houzel S, Avelino-de-Souza K, Neves K, Porfírio J, Messeder D, Mattos-Feijó L, Maldonado J, & Manger PR (2014). The elephant brain in numbers. Frontiers in Neuroanatomy, 8, 46. [DOI] [PMC free article] [PubMed] [Google Scholar]
- Herculano-Houzel S, (2017). Numbers of neurons as biological correlates of cognitive capability. Current Opinion in Behavioral Sciences, 16, 1–7. [Google Scholar]
- Herculano-Houzel S, (2018). The evolution of human capabilities and abilities. Cerebrum, cer-05–18. [PMC free article] [PubMed] [Google Scholar]
- Herculano-Houzel S, (2020). Birds do have a brain cortex-and think. Science, 369, 567–568. [DOI] [PubMed] [Google Scholar]
- Herculano-Houzel S, (2022). Theropod dinosaurs had primate-like numbers of telencephalic neurons. bioRxiv, preprint doi: 10.1101/2022.06.20.496834. [DOI] [PubMed] [Google Scholar]
- Hodos W (1988). Comparative neuroanatomy and the evolution of intelligence. In Jerison HJ, & Jerison I (Eds), Intelligence and Evolutionary Biology. NATO ASI Series (Volume G17, pp. 93–107). Berlin, Heidelberg, New York: Springer-Verlag. [Google Scholar]
- Hofman MA (1989). On the evolution and geometry of the brain in mammals. Progress in Neurobiology, 32, 137–158. [DOI] [PubMed] [Google Scholar]
- Hofman MA (2014). The evolution of the human brain: When bigger is better. Frontiers in Neuroanatomy, 8, 15. [DOI] [PMC free article] [PubMed] [Google Scholar]
- Horner JR (1982). Evidence of colonial nesting and “site fidelity” among ornithischian dinosaurs. Nature, 297, 675–676. [Google Scholar]
- Horner JR (1987). Ecological and behavioral derived from a dinosaur nesting site. In Czerkas SJ, & Olson EC (Eds.), Dinosaurs Past and Present (Volume II, pp. 51–63). Seattle: University of Washington Press. [Google Scholar]
- Hubel DH, & Wiesel TN (1968). Receptive fields and functional architecture of monkey striate cortex. Journal of Physiology, 195, 215–243. [DOI] [PMC free article] [PubMed] [Google Scholar]
- Hughes V (2012). The constant gardeners. Nature, 485, 570–572. [DOI] [PubMed] [Google Scholar]
- Hunt GR (2000). Human-like, population-level specialization in the manufacture of pandanus tools by New Caledonian crows Corvus moneduloides. Proceedings of the Royal Society of London B: Biological Sciences, 267, 403–413. [DOI] [PMC free article] [PubMed] [Google Scholar]
- Hunt SP, & Künzle H, H. (1976). Observations on the projections and intrinsic organization of the pigeon optic tectum: An autoradiographic study based on anterograde and retrograde, axonal and dendritic flow. Journal of Comparative Neurology, 170, 153–172. [DOI] [PubMed] [Google Scholar]
- Islam MR, & Atoji Y (2008). Distribution of vesicular glutamate transporter 2 and glutamate receptor 1 mRNA in the central nervous system of the pigeon (Columba livia). Journal of Comparative Neurology, 511, 658–677. [DOI] [PubMed] [Google Scholar]
- Iwaniuk AN, & Hurd PL (2005). The evolution of cerebrotypes in birds. Brain, Behavior and Evolution, 65, 215–230. [DOI] [PubMed] [Google Scholar]
- Iwaniuk AN, Heesy CP, Hall MI, & Wylie DRW (2008). Relative Wulst volume is correlated with orbit orientation and binocular visual field in birds. Journal of Comparative Physiology A, 194, 267–282. [DOI] [PubMed] [Google Scholar]
- Izawa EI, & Watanabe S (2007). A stereotaxic atlas of the brain of the jungle crow (Corvus macrorhynchos). In Watanabe S, & Hofman MA (Eds.), Integration of Comparative Neuroanatomy and Cognition (pp. 215–237). Tokyo: Keio University Press. [Google Scholar]
- Jarvis ED, Güntürkün O, Bruce L, Csillag A, Karten H, Kuenzel W, Medina L, Paxinos G, Perkel DJ, Shimizu T, Striedter G, Wild M, Ball GF, Dugas-Ford J, Durand S, Hough G, Husband S, Kubikova L, Lee DW, Mello CV, Powers A, Siang C, Smulders TV, Wada K, White SA, Yamamoto K, Yu J, Reiner A, & Butler AB (2005). Avian brains and a new understanding of vertebrate brain evolution. Nature Reviews Neuroscience, 6, 1–9. [DOI] [PMC free article] [PubMed] [Google Scholar]
- Jerison HJ (1973). Evolution of the Brain and Intelligence. New York, NY: Academic Press. [Google Scholar]
- Jerison HJ (2004). Dinosaur Brains. In Adelman G, & Smith BH (Eds.) The Encyclopedia of Neuroscience, 3rd edition. [Google Scholar]
- Jin X, Prince DA, & Huguenard JR (2006). Enhanced excitatory synaptic connectivity in layer v pyramidal neurons of chronically injured epileptogenic neocortex in rats. Journal of Neuroscience, 26, 4891–900. [DOI] [PMC free article] [PubMed] [Google Scholar]
- Kaas JH (1997). Topographic maps are fundamental to sensory processing. Brain Research Bulletin, 44, 107–112. [DOI] [PubMed] [Google Scholar]
- Kaas JH (2000). Why is brain size so important: design problems and solutions as neocortex gets bigger or smaller. Brain and Mind, 1, 7–23. [Google Scholar]
- Kaas JH (2011). Reconstructing the areal organization of the first neocortex of first mammals. Brain, Behavior and Evolution, 78, 7–21 [DOI] [PMC free article] [PubMed] [Google Scholar]
- Kaas JH (2012). The evolution of neocortex in primates. Progress in Brain Research, 195, 91–102. [DOI] [PMC free article] [PubMed] [Google Scholar]
- Kaas JH, & Preuss TM (2014). Chapter 42. Human brain evolution. In Squire LR, Berg D, Bloom FE, du Lac S, Ghosh A, & Spitzer NC (Eds.), Fundamental Neuroscience (Fourth Edition, pp. 901–918). Cambridge, MA: Academic Press. [Google Scholar]
- Kaas JH (2019). The origin and evolution of neocortex: From early mammals to modern humans. Progress in Brain Research, 250, 61–81. [DOI] [PubMed] [Google Scholar]
- Kaas JH (2020). The organization of neocortex in early mammals. In Kaas J (Ed.), Evolutionary Neuroscience, Second Edition (Volume II, pp. 51–63). Amsterdam: Elsevier. [Google Scholar]
- Kabadayi C, & Osvath M (2017). Ravens parallel great apes in flexible planning for tool use and bartering. Science, 357, 202–204. [DOI] [PubMed] [Google Scholar]
- Kaneko T, Cho RH, Li YG, Nomura S, & Mizuno N (2000). Predominant information transfer from layer III pyramidal neurons to corticospinal neurons. Journal of Comparative Neurology, 423, 52–65. [DOI] [PubMed] [Google Scholar]
- Karbowski J (2014). Constancy and trade-offs in the neuroanatomical and metabolic design of the cerebral cortex. Frontiers in Neural Circuits, 8, 9. [DOI] [PMC free article] [PubMed] [Google Scholar]
- Karten HJ, & Revzin AM (1966). The afferent connections of the nucleus rotundus in the pigeon. Brain Research, 2, 368–377. [DOI] [PubMed] [Google Scholar]
- Karten HJ (1967). The organization of the ascending auditory pathway in the pigeon (Columba livia). I. Diencephalic projections of the inferior colliculus (nucleus mesencephali lateralis, pars dorsalis). Brain Research, 6, 409–427. [DOI] [PubMed] [Google Scholar]
- Karten HJ (1968). The ascending auditory pathway in the pigeon (Columba livia). II. Telencephalic projections of the nucleus ovoidalis thalami. Brain Research, 11, 134–153. [DOI] [PubMed] [Google Scholar]
- Karten HJ, & Hodos W (1970). Telencephalic projections of the nucleus rotundus in the pigeon (Columba livia). Journal of Comparative Neurology, 140, 35–52. [DOI] [PubMed] [Google Scholar]
- Karten HJ, Hodos W, Nauta WJH, & Revzin AM (1973). Neural connections of the “visual wulst” of the avian telencephalon. Experimental studies in the pigeon (Columba livia) and owl (Speotyto cunicularia). Journal of Comparative Neurology, 150, 253–278. [DOI] [PubMed] [Google Scholar]
- Karten HJ, & Shimizu T (1989). The origins of neocortex: Connections and lamination as distinct events in evolution. Journal of Cognitive Neuroscience, 1, 291–301. [DOI] [PubMed] [Google Scholar]
- Karten HJ (1991). Homology and evolutionary origins of the ‘Neocortex’. Brain, Behavior and Evolution, 38, 264–272. [DOI] [PubMed] [Google Scholar]
- Karten HJ (1997). Evolutionary developmental biology meets the brain: The origins of mammalian cortex. Proceedings of the National Academy of Sciences (U.S.A.), 94, 2800–2804. [DOI] [PMC free article] [PubMed] [Google Scholar]
- Karten HJ (2015). Vertebrate brains and evolutionary connectomics: On the origins of the mammalian “neocortex”. Philosophical Transactions of the Royal Society of London B: Biological Sciences, 370, 20150060. [DOI] [PMC free article] [PubMed] [Google Scholar]
- Kazu RS, Maldonado J, Mota B, Manger PR, & Herculano-Houzel S (2014). Cellular scaling rules for the brain of Artiodactyla include a highly folded cortex with few neurons. Frontiers in Neuroanatomy, 8:128. [DOI] [PMC free article] [PubMed] [Google Scholar]
- Kemp TS (1982). Mammal-like Reptiles and the Origin of Mammals. New York, NY: Academic Press. [Google Scholar]
- Kersten Y, Friedrich-Müller B, & Nieder A (2021). A histological study of the song system of the carrion crow (Corvus corone). Journal of Comparative Neurology, 529: 2576–2595. [DOI] [PubMed] [Google Scholar]
- King JL, Sipla JS, Georgi JA, Balanoff AM, & Neenan JM (2020). The endocranium and trophic ecology of Velociraptor mongoliensis. Journal of Anatomy, 237, 861–869. [DOI] [PMC free article] [PubMed] [Google Scholar]
- Knoll F, Lautenschlager S, Kawabe S, Martinez G, Espilez E, Mampel L, & Alcala L (2021). Palaeoneurology of the early cretaceous iguanodont Proa valdearinnoensis and its bearing on the parallel developments of cognitive abilities in theropod and ornithopod dinosaurs. Journal of Comparative Neurology, 529, 1922–1945. [DOI] [PubMed] [Google Scholar]
- Knudsen EI, du Lac S, & Esterly SD (1987). Computational maps in the brain. Annual Review of Neuroscience, 10, 41–65. [DOI] [PubMed] [Google Scholar]
- Kreitzer AC (2009). Physiology and pharmacology of striatal neurons. Annual Review Neuroscience, 32:127–147. [DOI] [PubMed] [Google Scholar]
- Kreutzfeld NOE, & Wild JM (2005). Definition and novel connections of the entopallium in the pigeon (Columba livia). Journal of Comparative Neurology, 490, 40–56. [DOI] [PubMed] [Google Scholar]
- Ksepka DT, Balanoff AM, Smith NA, Bever GS, Bhullar BS, Bourdon E, Braun EL, Burleigh JG, Clarke JA, Colbert MW, Corfield JR, Degrange FJ, De Pietri VL, Early CM, Field DJ, Gignac PM, Gold MEL, Kimball RT, Kawabe S, Lefebvre L, Marugán-Lobón J, Mongle CS, Morhardt A, Norell MA, Ridgely RC, Rothman RS, Scofield RP, Tambussi CP, Torres CR, van Tuinen M, Walsh SA, Watanabe A, Witmer LM, Wright AK, Zanno LE, Jarvis ED, & Smaers JB (2020). Tempo and pattern of avian brain size evolution. Current Biology, 30, 1–11. [DOI] [PubMed] [Google Scholar]
- Kumar BS, Sarath CM, Gayathri SR, & Chakravarthy VS (2022). The influence of neural activity and neural cytoarchitecture on cerebrovascular arborization: A computational model. Frontiers in Neuroscience, 16, 917196. [DOI] [PMC free article] [PubMed] [Google Scholar]
- Kverková K, Marhounová L, Polonyiová A, Kocourek M, Zhang Y, Olkowicz S, Straková B, Pavelková Z, Vodička R, Frynta D, & Němec P (2022). The evolution of brain neuron numbers in amniotes. Proceedings of the National Academy of Sciences (U.S.A.), 119, e2121624119. [DOI] [PMC free article] [PubMed] [Google Scholar]
- Larkum ME, Petro LS, Sachdev RNS, & Muckli L (2018). A Perspective on Cortical Layering and Layer-Spanning Neuronal Elements. Frontiers in Neuroanatomy, 12, 56. [DOI] [PMC free article] [PubMed] [Google Scholar]
- Laughlin SB, & Sejnowski TJ (2003). Communication in neuronal networks. Science, 301, 1870–1874. [DOI] [PMC free article] [PubMed] [Google Scholar]
- Lenz KM, & Nelson LH (2020). Microglia and beyond: innate immune cells as regulators of brain development and behavioral function. Frontiers in Immunology, 9, 698. [DOI] [PMC free article] [PubMed] [Google Scholar]
- Li R, Lockley MG, Makovicky PJ, Matsukawa M, Norell MA, Harris JD, & Liu M (2008). Behavioral and faunal implications of Early Cretaceous deinonychosaur trackways from China. Naturwissenschaften, 95, 185–191. [DOI] [PubMed] [Google Scholar]
- Liu GB, & Pettigrew JD (2003). Orientation mosaic in barn owl’s visual Wulst revealed by optical imaging: comparison with cat and monkey striate and extra-striate Areas. Brain Research, 9612, 153–158. [DOI] [PubMed] [Google Scholar]
- Lovejoy O (1981). The origin of man. Science, 211, 341–350. [DOI] [PubMed] [Google Scholar]
- Lund JS, Henry GH, MacQueen CL, & Harvey AR (1979). Anatomical organization of the primary visual cortex (area 17) of the cat. A comparison with area 17 of the macaque monkey. Journal of Comparative Neurology, 184, 599–618. [DOI] [PubMed] [Google Scholar]
- Manger PR, Elston GN, & Pettigrew JD (2002). Multiple maps and activity-dependent representational plasticity in the anterior Wulst of the adult barn owl (Tyto alba). European Journal of Neuroscience, 16, 743–750. [DOI] [PubMed] [Google Scholar]
- Martin RD (1993). Primate origins: plugging the gaps. Nature, 363, 223–234. [DOI] [PubMed] [Google Scholar]
- Medina L, & Reiner A (2000). Do birds possess homologues of mammalian primary visual, somatosensory and motor cortices? Trends in Neurosciences, 23, 1–12. [DOI] [PubMed] [Google Scholar]
- Mehlhorn J, Hunt GR, Gray RD, Rehkämper G, & Güntürkün O (2010). Tool-making New Caledonian crows have large associative brain areas. Brain Behavior and Evolution, 75, 63–70. [DOI] [PubMed] [Google Scholar]
- Meng Q, Liu J, Varricchio DJ, Huang T, & Gao C (2004). Parental care in an ornithischian dinosaur. Nature, 431, 145–146. [DOI] [PubMed] [Google Scholar]
- Molnár Z, Kaas JH, de Carlos JA, Hevner RF, Lein E, & Němec P (2014). Evolution and development of the mammalian cerebral cortex. Brain, Behavior and Evolution, 83, 126–139. [DOI] [PMC free article] [PubMed] [Google Scholar]
- Montiel JF & Molnár Z (2013). The impact of gene expression analysis on evolving views of avian brain organization. Journal of Comparative Neurology, 521, 3604–3613. [DOI] [PubMed] [Google Scholar]
- Mountcastle VB (1997). The columnar organization of the brain. Brain, 120, 701–722. [DOI] [PubMed] [Google Scholar]
- Naish D, & Tattersdill W (2021). Art, Anatomy, and the Stars: Russell and Séguin’s Dinosauroid. Canadian Journal of Earth Sciences, 10.1139/cjes-2020-0172. [DOI] [Google Scholar]
- Nakamori T, Sato K, Atoji Y, Kanamatsu T, Tanaka K, & Ohki-Hamazaki H (2010). Demonstration of a neural circuit critical for imprinting behavior in chicks. Journal of Neuroscience, 30, 4467–4480. [DOI] [PMC free article] [PubMed] [Google Scholar]
- Newman EA (2003). New roles for astrocytes: Regulation of synaptic transmission. Trends in Neurosciences, 26, 536–542. [DOI] [PubMed] [Google Scholar]
- Nieder A (2017). Inside the corvid brain - probing the physiology of cognition in crows. Current Opinion in Behavioral Scieince, 16, 8–14. [Google Scholar]
- Nieder A, Wagener L, & Rinnert P (2020). A neural correlate of sensory consciousness in a corvid bird. Science 369: 1626–1629. [DOI] [PubMed] [Google Scholar]
- Northcutt RG (1978). Forebrain and midbrain organization in lizards and its phylogenetic significance. In Greenberg N, & MacLean PD (Eds.), Behavior and Neurology of Lizards (pp. 11–64). Bethesda: NIMH. [Google Scholar]
- Northcutt RG (1981). Evolution of the telencephalon in nonmammals. Annual Review of Neuroscience, 4, 301–350. [DOI] [PubMed] [Google Scholar]
- Northcutt RG, & Kaas JH (1995). The emergence and evolution of mammalian neocortex. Trends in Neurosciences, 18, 373–379. [DOI] [PubMed] [Google Scholar]
- Olkowicz S, Kocourek M, Lučan RK, Porteš M, Fitch WT, Herculano-Houzel S, & Němec P (2016). Birds have primate-like numbers of neurons in the forebrain. Proceedings of the National Academy of Sciences (U.S.A.), 113, 7255–7260. [DOI] [PMC free article] [PubMed] [Google Scholar]
- Ostrom JH (1986). Social and unsocial behavior in dinosaurs. In Nitecki MH, & Kitchell JA JA (Eds.), Evolution of Animal Behavior (pp. 41–61). Oxford, UK: Oxford University Press. [Google Scholar]
- Parishar P, Mohapatra AN, & Iyengar S (2021). Investigating behavioral responses to mirrors and the mark test in adult male zebra finches and house crows. Frontiers in Psychology, 12, 637850. [DOI] [PMC free article] [PubMed] [Google Scholar]
- Paul GS (1988). Predatory Dinosaurs of the World. New York, NY: Simon and Schuster. [Google Scholar]
- Pepperberg I (1999). The Alex Studies: Cognitive and Communicative Abilities of Grey Parrots. Cambridge, MA: Harvard University Press. [Google Scholar]
- Petrides M, Tomaiuolo F, Yeterian EH, & Pandya DN (2012). The prefrontal cortex: Comparative architectonic organization in the human and the macaque monkey brains. Cortex, 48, 46–57. [DOI] [PubMed] [Google Scholar]
- Pettigrew JD, & Konishi M (1976). Neurons selective for orientation and binocular disparity in the visual Wulst of the barn owl (Tyto alba). Science, 193, 675–678. [DOI] [PubMed] [Google Scholar]
- Pettigrew JD (1978). Comparison of the retinotopic organization of the visual Wulst in nocturnal and diurnal raptors, with a note on the evolution of frontal vision. In Cool SJ, & Smith EL III (Eds), Frontiers in Visual Science (pp. 328–335). Berlin: Springer Verlag. [Google Scholar]
- Pika S, Sima MJ, Blum CR, Hermann E, & Mundry R (2020). Ravens parallel great apes in physical and cognitive social skills. Scientific Reports, 10, 20617. [DOI] [PMC free article] [PubMed] [Google Scholar]
- Pol D, Mancuso AC, Smith RMH, Marsicano CA, Ramezani J, Cerda IA, Otero A, & Fernandez V (2021). Earliest evidence of herd-living and age segregation amongst dinosaurs. Scientific Reports, 11, 20023. [DOI] [PMC free article] [PubMed] [Google Scholar]
- Pontzer H, Brown MH, Raichlen DA, Dunsworth H, Hare B, Walker K, Luke A, Dugas LR, Durazo-Arvizu R, Schoeller D, Plange-Rhule J, Bovet P, Forrester TE, Lambert EV, Thompson ME, Shumaker RW, & Ross SR (2016). Metabolic acceleration and the evolution of human brain size and life history. Nature, 533, 390–392. [DOI] [PMC free article] [PubMed] [Google Scholar]
- Preuss TM, Qi H, & Kaas JH (1999). Distinctive compartmental organization of human primary visual cortex. Proceedings of the National Academy of Sciences (U.S.A.), 96, 11601–11606. [DOI] [PMC free article] [PubMed] [Google Scholar]
- Preuss TM (2007). Primate brain evolution in phylogenetic context. In Kaas JH (Ed.), Evolution of Nervous Systems (Volume 4, pp. 1–34). Amsterdam: Elsevier. [Google Scholar]
- Prior H, Schwarz A, & Güntürkün O (2008). Mirror-induced behavior in the Magpie (Pica pica): Evidence of self-recognition. PLoS Biology, 6, e202. [DOI] [PMC free article] [PubMed] [Google Scholar]
- Pritz MB (1975). Anatomical identification of a telencephalic visual area in crocodiles: ascending connections of nucleus rotundus in Caiman crocodilus. Journal of Comparative Neurology, 164, 323–338. [DOI] [PubMed] [Google Scholar]
- Pritz MB (1980). Parallels in the organization of auditory and visual systems in crocodiles. In Ebbesson SOE (Ed.), Comparative Neurology of the Telencephalon (pp. 331–342). New York, NY: Plenum Press. [Google Scholar]
- Pritz MB, & Northcutt RG (1977). Succinate dehydrogenase activity in the telencephalon of crocodiles correlates with the projection areas of sensory thalamic nuclei. Brain Research, 124, 357–360. [DOI] [PubMed] [Google Scholar]
- Puelles L, Kuwana E, Puelles E, Bulfone A, Shimamura K, Keleher J, Smiga S, & Rubenstein JL (2000). Pallial and subpallial derivatives in the embryonic chick and mouse telencephalon, traced by the expression of the genes Dlx-2, Emx-1, Nkx- 2.1, Pax-6, and Tbr-1. Journal of Comparative Neurology, 424, 409–438. [DOI] [PubMed] [Google Scholar]
- Puelles L, Ayad A, Alonso A, Sandoval JE, MartÍnez-de-la-Torre M, Medina L, & Ferran JL (2016). Selective early expression of the orphan nuclear receptor Nr4a2 identifies the claustrum homolog in the avian mesopallium: Impact on sauropsidian/mammalian pallium comparisons. Journal of Comparative Neurology, 524, 665–703. [DOI] [PubMed] [Google Scholar]
- Puelles L (2022). Current status of the hypothesis of a claustro-insular homolog in sauropsids. Brain, Behavior and Evolution, 96, 212–241. [DOI] [PubMed] [Google Scholar]
- Purves D, Augustine GJ, Fitzpatrick D, Hall WC, LaMantia AS, McNamara JO, & White LE (Eds.). (2008). Neuroscience (4th ed.). Sunderland, MA: Sinauer Associates. [Google Scholar]
- Rakic P (2009). Evolution of the neocortex: a perspective from developmental biology. Nature Reviews Neuroscience, 10, 724–735. [DOI] [PMC free article] [PubMed] [Google Scholar]
- Reader SM, Hager Y, & Lalan KN (2011). The evolution of primate general and cultural intelligence. Philosophical Transactions of the Royal Society B, 366, 1017–1027 [DOI] [PMC free article] [PubMed] [Google Scholar]
- Reiner A, & Karten HJ (1983). The laminar source of efferent projections from the avian Wulst. Brain Research, 275, 349–354. [DOI] [PubMed] [Google Scholar]
- Reiner A (1991). A comparison of the neurotransmitter-specific and neuropeptide-specific neuronal cell types present in turtle cortex to those present in mammalian isocortex, Implications for the evolution of isocortex. Brain, Behavior and Evolution, 38, 53–91. [DOI] [PubMed] [Google Scholar]
- Reiner A (1993). Neurotransmitter organization and connections of turtle cortex, Implications for the evolution of mammalian isocortex. Comparative Biochemistry and Physiology, 104A, 735–748. [DOI] [PubMed] [Google Scholar]
- Reiner A, Medina L, & Veenman CL (1998). Structural and functional evolution of the basal ganglia in vertebrates. Brain Research Reviews, 28, 235–284. [DOI] [PubMed] [Google Scholar]
- Reiner A (2000). A hypothesis as to the organization of cerebral cortex in the common reptile ancestor of modern reptiles and mammals. In Bock GA, & Cardew G (Eds.), Evolutionary Developmental Biology of the Cerebral Cortex (pp. 83–108). London: Novartis Foundation. [DOI] [PubMed] [Google Scholar]
- Reiner A, & Northcutt RG (2000). Succinic dehydrogenase histochemistry reveals the location of the putative primary visual and auditory areas within the dorsal ventricular ridge of Sphenodon punctatus. Brain, Behavior and Evolution, 55, 26–36. [DOI] [PubMed] [Google Scholar]
- Reiner A, Stern EA, & Wilson CJ (2001). Physiology and morphology of intratelencephalically projecting corticostriatal neurons in pigeons as revealed by intracellular recording and cell filling. Brain, Behavior and Evolution, 58, 101–114. [DOI] [PubMed] [Google Scholar]
- Reiner A (2002). Functional circuitry of the avian basal ganglia: Implications for basal ganglia organization in stem amniotes. Brain Research Bulletin, 57, 513–528. [DOI] [PubMed] [Google Scholar]
- Reiner A, Jiao Y, Del Mar N, Laverghetta AV, & Lei WL (2003). Differential morphology of pyramidal-tract type and intratelencephalically-projecting type corticostriatal neurons and their intrastriatal terminals in rats. Journal of Comparative Neurology, 457, 420–440. [DOI] [PubMed] [Google Scholar]
- Reiner A, Perkel DJ, Bruce LL, Butler A, Csillag A, Kuenzel W, Medina L, Paxinos G, Shimizu T, Striedter G, Wild JM, Ball GF, Durand S, Güntürkün O, Lee D, Mello CV, Powers A, White SA, Hough G, Kubikova L, Smulders TV, Wada K, Dugas-Ford J, Husband S, Yamamoto K, Yu J, Siang C, & Jarvis ED (2004). Revised nomenclature for avian telencephalon and some related brainstem nuclei. Journal of Comparative Neurology, 473, 377–414. [DOI] [PMC free article] [PubMed] [Google Scholar]
- Reiner A, Yamamoto K, & Karten HJ (2005). Organization and evolution of the avian forebrain. Anatomical Record, 287A, 1080–1102. [DOI] [PubMed] [Google Scholar]
- Reiner A (2005). A new avian brain nomenclature: Why, how and what. Brain Research Bulletin, 66, 317–331. [DOI] [PubMed] [Google Scholar]
- Reiner A (2009). Avian Evolution: From Darwin’s finches to a new way of thinking about avian forebrain organization and behavioral capabilities. Biology Letters, 5, 122–124. [DOI] [PMC free article] [PubMed] [Google Scholar]
- Reiner A, Hart NM, Lei WL, & Deng YP (2010). Corticostriatal projection neurons – Dichotomous types and dichotomous functions. Frontiers in Neuroanatomy, 4, 142. [DOI] [PMC free article] [PubMed] [Google Scholar]
- Revzin AM, & Karten HJ (1967). Rostral projections of the optic tectum and the nucleus rotundus in the pigeon. Brain Research, 3, 264–276. [Google Scholar]
- Rieppel O (1999). Turtle origins. Science, 283, 945–1001. [DOI] [PubMed] [Google Scholar]
- Ristau CA (2013). Cognitive ethology. Wiley’s Interdisciplinary Reviews: Cognitive Science, 4, 493–509. [DOI] [PubMed] [Google Scholar]
- Rose J (2022). The avian brain. Current Biology, 32, R1042–R1172.36283356 [Google Scholar]
- Roth G (2015). Convergent evolution of complex brains and high intelligence. Philosophical Transactions of the Royal Society B, 370, 20150049. [DOI] [PMC free article] [PubMed] [Google Scholar]
- Roth G, & Dicke U (2005). Evolution of the Brain and Intelligence. Trends in Cognitive Neurosciences, 9, 250–257. [DOI] [PubMed] [Google Scholar]
- Russell DA, & Seguin R (1982). Reconstruction of the small cretaceous theropod Stenenychosaurus inequalis and a hypothetical dinosauroid. Syllogeus, 37, 1–43. [Google Scholar]
- Sarkar S, & Atoji Y (2018). Distribution of vesicular glutamate transporters in the brain of the turtle (Pseudemys scripta elegans). Journal of Comparative Neurology, 526, 1690–1702. [DOI] [PubMed] [Google Scholar]
- Sayol F, & LeFebvre L, Sol D (2016). Relative brain size and its relation with the associative pallium in birds. Brain, Behavior and Evolution, 87, 69–77. [DOI] [PubMed] [Google Scholar]
- Segal M (2017). Dendritic spines: Morphological building blocks of memory. Neurobiology of Learning and Memory, 138, 3–9. [DOI] [PubMed] [Google Scholar]
- Sereno PC (1998). The evolution of dinosaurs. Science, 284, 2137–2147. [DOI] [PubMed] [Google Scholar]
- Shanahan M, Bingman VP, Shimizu T, Wild M, & Güntürkün O (2013). Large-scale network organization in the avian forebrain: a connectivity matrix and theoretical analysis. Frontiers in Computational Neuroscience, 7, 89. [DOI] [PMC free article] [PubMed] [Google Scholar]
- Shepherd GM (2013). Corticostriatal connectivity and its role in disease. Nature Reviews Neuroscience, 14, 278–291. [DOI] [PMC free article] [PubMed] [Google Scholar]
- Shepherd GM, & Rowe TB (2017). Neocortical lamination: Insights from neuron types and evolutionary precursors. Frontiers in Neuroanatomy, 11, 100. [DOI] [PMC free article] [PubMed] [Google Scholar]
- Sherwood CC, Broadfield DC, Holloway RL, Gannon PJ, & Hof PR (2003). Variability of Broca’s area homologue in African great apes: implications for language evolution. Anatomical Record: Advances in Integrative Anatomy and Evolutionary Biology, 271A, 276–285. [DOI] [PubMed] [Google Scholar]
- Sherwood CC, Bauernfield AL, Bianchi S, Raghanti MA, & Hof PR (2012). Human brain evolution writ large and small. In Hofman MA, & Falks D (Eds.), Progress in Brain Research (Volume 195, pp. 237–254). Amsterdam: Elsevier. [DOI] [PubMed] [Google Scholar]
- Shimizu T, & Karten HJ (1990). Multiple origins of neocortex: contributions of the dorsal ventricular ridge. In Finlay BL, Innocenti G, & Scheich H (Eds.), The Neocortex, Ontogeny and Phylogeny (pp. 75–86). New York, NY: Plenum Press. [Google Scholar]
- Shimizu T, & Karten HJ (1991). Computational significance of lamination of the telencephalon. In Arbib M, & Ewert JP (Eds.), Visual Structures and Integrated Functions (Volume 3, pp. 325–337). Berlin, Heidelberg, New York: Springer-Verlag. [Google Scholar]
- Shimizu T, Cox K, & Karten HJ (1995). Intratelencephalic projections of the visual Wulst in pigeons (Columba livia). Journal of Comparative Neurology, 359, 551–572. [DOI] [PubMed] [Google Scholar]
- Simons M, & Nave KA (2016). Oligodendrocytes: Myelination and axonal support. In Barres BA, Freeman MR, & Stevens B (Eds.), Cold Springs Harbor Perspectives in Biology (Volume 8, pp. a020479). Cold Springs Harbor: Cold Springs Harbor Press. [DOI] [PMC free article] [PubMed] [Google Scholar]
- Sierra A, Tremblay ME, & Wake H (2014). Never resting microglia: physiological roles in the healthy brain and pathological implications. Frontiers in Cellular Neuroscience, 8, 240. [DOI] [PMC free article] [PubMed] [Google Scholar]
- Smith AT, Singh KD, Williams AL, & Greenlee MD (2001). Estimating receptive field size from fMRI data in human striate and extrastriate visual cortex. Cerebral Cortex, 11, 1182–1190. [DOI] [PubMed] [Google Scholar]
- Sol D, Olkowicz S, Sayol F, Kocourek M, Zhang Y, Marhounová L, Osadnik C, Corssmit E, Garcia-Porta J, Martin TE, Lefebvre L, & Němec P (2022). Neuron numbers link innovativeness with both absolute and relative brain size in birds. Nature Ecology & Evolution, 6, 1381–1389. [DOI] [PubMed] [Google Scholar]
- Soler M, Colmenero JM, Pérez-Contreras T, & Peralta-Sánchez JM (2020). Replication of the mirror mark test experiment in the magpie (Pica pica) does not provide evidence of self-recognition. Journal of Comparative Psychology, doi: 10.1037/com0000223. Online ahead of print. [DOI] [PubMed] [Google Scholar]
- Spires-Jones T, & Knafo S (2012). Spines, plasticity, and cognition in Alzheimer’s model Mice. Neural Plasticity, 2012, 319386. [DOI] [PMC free article] [PubMed] [Google Scholar]
- Stacho M, Herold C, Rook N, Wagner H, Axer M, Amunts K, & Güntürkün O (2020). A cortex-like canonical circuit in the avian forebrain. Science, 369, eabc5534. [DOI] [PubMed] [Google Scholar]
- Striedter GF (1997). The telencephalon of tetrapods in evolution. Brain, Behavior and Evolution, 49, 179–213. [DOI] [PubMed] [Google Scholar]
- Ströckens F, Neves K, Kirchem S, Schwab C, Herculano-Houzel S, Günturkun O (2022). High associative neuron numbers could drive cognitive performance in corvid species. Journal of Comparative Neurology, 530, 1588–1605. [DOI] [PubMed] [Google Scholar]
- Timmermans S, LeFebvre L, Booire D, & Basu P (2000). Relative size of the hyperstriatum ventrale is the best predictor of feeding innovation rate in birds. Brain Behavior and Evolution, 56, 196–203. [DOI] [PubMed] [Google Scholar]
- Tömböl T, Csillag A, & Stewart MG (1988). Cell types of the hyperstriatum ventrale of the domestic chicken (Gallus domesticus): a Golgi study. Journal für Hirnforschung, 29, 319–334. [PubMed] [Google Scholar]
- Tullberg BS, Ah-King M, & Temrin H (2002). Phylogenetic reconstruction of parental-care systems in the ancestors of birds. Philosophical Transactions of the Royal Society London B: Biological Sciences, 357, 251–257. [DOI] [PMC free article] [PubMed] [Google Scholar]
- Van Essen DC (1997). A tension-based theory of morphogenesis and compact wiring in the central nervous system. Nature, 385, 313–318. [DOI] [PubMed] [Google Scholar]
- Van Essen D (2004). Organization of visual areas in macaque and human cerebral cortex. In Chalupa LM, & Werner S (Eds.), The Visual Neurosciences (Volume 1, pp. 507–521). Cambridge, MA: MIT Press. [Google Scholar]
- Van Essen DC (2013). Cartography and connectomes. Neuron, 80, 775–790. [DOI] [PMC free article] [PubMed] [Google Scholar]
- Van Essen DC, & Dierker DL (2007). Surface-based and probabilistic atlases of primate cerebral cortex. Neuron, 56, 209–225. [DOI] [PubMed] [Google Scholar]
- Van Essen DC, Glasser MF, Dierker DL, & Harwell J (2012a). Cortical parcellations of the macaque monkey analyzed on surface-based atlases. Cerebral Cortex, 22, 2227–2240. [DOI] [PMC free article] [PubMed] [Google Scholar]
- Van Essen DC, Glasser MF, Dierker DL, Harwell J, & Coalson T (2012b). Parcellations and hemispheric asymmetries of human cerebral cortex analyzed on surface-based atlases. Cerebral Cortex, 22, 2241–2262. [DOI] [PMC free article] [PubMed] [Google Scholar]
- Van Essen DC, Donahue CJ, Coalson TS, Kennedy H, Hayashi T, & Glasser MF (2019). Cerebral cortical folding, parcellation and connectivity in humans, nonhuman primates and mice. Proceedings of the National Academy of Sciences (U.S.A.), 116, 26173–26180. [DOI] [PMC free article] [PubMed] [Google Scholar]
- Vanhooland LC, Szabó A, Bugnyar T, & Massen JJM (2022). Investigating behavioral responses to mirrors and the mark test in adult male zebra finches and house crows. Animal Cognition, doi: 10.1007/s10071-022-01696-4. Online ahead of print. [DOI] [PMC free article] [PubMed] [Google Scholar]
- Varricchio DJ, Moore JR, Erickson GM, Norell MA, Jackson FD, & Borkowski JJ. (2008). Avian paternal care had dinosaur origin. Science, 322, 1826–1828. [DOI] [PubMed] [Google Scholar]
- Veenman CL, Wild JM, & Reiner A (1995). Organization of the avian “Corticostriatal” projection system: A retrograde and anterograde pathway tracing study in pigeons. Journal of Comparative Neurology, 354, 87–126. [DOI] [PubMed] [Google Scholar]
- Ventura-Antunes L, Herculano-Houzel S, & (2022). Energy supply per neuron is constrained capillary density in the mouse brain. Frontiers in Integrative Neuroscience, 16, 760887. [DOI] [PMC free article] [PubMed] [Google Scholar]
- Wagener L, & Nieder A (2020). Categorical auditory working memory in crows. iScience, 23, 101737. [DOI] [PMC free article] [PubMed] [Google Scholar]
- Wang IE, & Clandinin TR (2016). The influence of wiring economy on nervous system evolution. Current Biology, 26, R1101–R1108. [DOI] [PubMed] [Google Scholar]
- Wang L, Luo Y, Wang H, Zou Y, Yao H, & Ullah S, Li Z (2020). Azure-winged magpies fail to understand the principle of mirror imaging. Behavioral Processes, 177, 104155. [DOI] [PubMed] [Google Scholar]
- Wang Y, Brzozowska-Prechtl A, & Karten HJ (2010). Laminar and columnar auditory cortex in avian brain. Proceedings of the National Academy of Sciences (U.S.A.), 107, 12676–12681. [DOI] [PMC free article] [PubMed] [Google Scholar]
- Wang Z, Pascual-Anaya J, Zadissa A, Li W, Niimura Y, Huang Z, Li C, White S, Xiong Z, Fang D, Wang B, Ming Y, Chen Y, Zheng Y, Kuraku S, Pignatelli M, Herrero J, Beal K, Nozawa M, Li Q, Wang J, Zhang H, Yu L, Shigenobu S, Wang J, Liu J, Flicek P, Searle S, Wang J, Kuratani S, Yin Y, Aken B, Zhang G, & Irie N (2013). The Draft genomes of soft-shell turtle and Green Sea Turtle yield insights into the development and evolution of the turtle-specific body plan. Nature Genetics, 45, 701–706. [DOI] [PMC free article] [PubMed] [Google Scholar]
- Watanabe M, Ito H, & Masai H (1983). Cytoarchitecture and visual receptive neurons in the Wulst of the Japanese quail (Coturnix coturnix japonica). Journal of Comparative Neurology, 213, 188–198. [DOI] [PubMed] [Google Scholar]
- Weir AA, Chappell J, & Kacelnik A (2002). Shaping of hooks in New Caledonian crows. Science, 297, 981. [DOI] [PubMed] [Google Scholar]
- Welker W (1990). Why does cerebral cortex fissure and fold? A review of determinants of gyri and sulci. In Jones EG, & Peters A (Ed.s), Cerebral Cortex Volume 8B (pp. 3–136). New York, NY: Plenum Press. [Google Scholar]
- Wild JM (1987). The avian somatosensory system: connections of regions of body representation in the forebrain of the pigeon. Brain Research, 412, 205–223. [DOI] [PubMed] [Google Scholar]
- Wild JM (1992). Direct and indirect “cortico”-rubral and rubro-cerebellar cortical projections in the pigeon. Journal of Comparative Neurology, 326, 623–636. [DOI] [PubMed] [Google Scholar]
- Wild JM, & Farabaugh SM (1996). Organization of afferent and efferent projections of the nucleus basalis prosencephali in a passerine, Taeniopygia guttata. Journal of Comparative Neurology, 365, 306–328. [DOI] [PubMed] [Google Scholar]
- Wild JM (1997). The avian somatosensory system: the pathway from wing to Wulst in a passerine (Chloris chloris). Brain Research, 759, 122–134. [DOI] [PubMed] [Google Scholar]
- Wild JM, Karten HJ, & Frost BJ (1993). Connections of the auditory forebrain in the pigeon (Columba livia). Journal of Comparative Neurology, 337, 32–62. [DOI] [PubMed] [Google Scholar]
- Wild JM, Kubke MF, & Peña JL (2008). A pathway for predation in the brain of the barn owl (Tyto alba): projections of the gracile nucleus to the “claw area” of the rostral Wulst via the dorsal thalamus. Journal of Comparative Neurology, 509, 156–166. [DOI] [PMC free article] [PubMed] [Google Scholar]
- Wild JM, & Williams MN (2000). Rostral Wulst in passerine birds. I. Origin, course, and terminations of an avian pyramidal tract. Journal of Comparative Neurology, 41, 429–450. [PubMed] [Google Scholar]
- Wilimzig C, Ragert P, & Dinse HR (2012). Cortical topography of intracortical inhibition influences the speed of decision making. Proceedings of the National Academy of Sciences (U.S.A.), 109, 3107–3112. [DOI] [PMC free article] [PubMed] [Google Scholar]
- Wilson CJ, & Groves PM (1980). Fine structure and synaptic connections of the common spiny neuron of the rat neostriatum: a study employing intracellular inject of horseradish peroxidase. Journal of Comparative Neurology, 194, 599–615. [DOI] [PubMed] [Google Scholar]
- Wilson EO (2012). The Social Conquest of Earth. New York, NY: W.W. Norton. [Google Scholar]
- Wilson JX (1997). Antioxidant defense of the brain: a role for astrocytes. Canadian Journal of Physiology and Pharmacology, 75, 1149–1163. [PubMed] [Google Scholar]
- Witkovsky P, Zeigler HP, & Silver R (1973). The nucleus basalis of the pigeon: A single-unit analysis. Journal of Comparative Neurology, 147, 119–128. [DOI] [PubMed] [Google Scholar]
- Witmer LM, & Ridgely RC (2009). New insights into the brain, braincase, and ear region of tyrannosaurs (dinosauria, theropoda), with implications for sensory organization and behavior. Anatomical Record, 292, 1266–1296. [DOI] [PubMed] [Google Scholar]
- Woolsey TA, & Van der Loos H (1970). The structural organization of layer IV in the somatosensory region (SI) of mouse cerebral cortex. The description of a cortical field composed of discrete cytoarchitectonic units. Brain Research, 17, 205–242. [DOI] [PubMed] [Google Scholar]
- Xu X, Zhou Z, Wang X, Kuang X, Zhang F, & Du X (2003). Four-winged dinosaurs from China. Nature, 421, 335–340. [DOI] [PubMed] [Google Scholar]
- Yamamoto K, & Reiner A (2007). Is the avian dorsal ventricular ridge (DVR) homologous to the mammalian cerebral cortex or to the amygdala ― Evaluating hypotheses by assessing homologous projection pathways to the telencephalon? In Watanabe S, & Hofman MA (Eds.), Integration of Comparative Neuroanatomy and Cognition (pp. 75–96). Tokyo: Keio University Press. [Google Scholar]
- Young MP, Scannell JW, Burns GAPC, & Blakemore C (1994). Analysis of Connectivity: Neural systems in the cerebral cortex. Reviews in the Neurosciences, 5, 227–249. [DOI] [PubMed] [Google Scholar]
- Zeier H, & Karten HJ (1971). The archistriatum of the pigeon: organization of afferent and efferent connections. Brain Research, 31, 313–326. [DOI] [PubMed] [Google Scholar]
- Zeigler HP, & Karten HJ (1973). Brain mechanisms and feeding behavior in the pigeon (Columba livia). I. Quinto-frontal structures. Journal of Comparative Neurology, 152, 59–82. [DOI] [PubMed] [Google Scholar]
- Zhang FX, Ge SN, Dong YL, Shi J, Feng YP, Li Y, Li YQ, & Li JL (2018). Vesicular glutamate transporter isoforms: The essential players in the somatosensory systems. Progress in Neurobiology, 171, 72–89. [DOI] [PubMed] [Google Scholar]
Associated Data
This section collects any data citations, data availability statements, or supplementary materials included in this article.
Data Availability Statement
This is a review paper and all data used have already been published by diverse authors, and the cited papers are publicly available.