

Abstract
Abstract
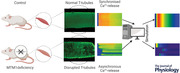
In mammalian skeletal muscle, the propagation of surface membrane depolarization into the interior of the muscle fibre along the transverse (T) tubular network is essential for the synchronized release of calcium from the sarcoplasmic reticulum (SR) via ryanodine receptors (RyRs) in response to the conformational change in the voltage‐sensor dihydropyridine receptors. Deficiency in 3‐phosphoinositide phosphatase myotubularin (MTM1) has been reported to disrupt T‐tubules, resulting in impaired SR calcium release. Here confocal calcium transients recorded in muscle fibres of MTM1‐deficient mice were compared with the results from a model where propagation of the depolarization along the T‐tubules was modelled mathematically with disruptions in the network assumed to modify the access and transmembrane resistance as well as the capacitance. If, in simulations, T‐tubules were assumed to be partially or completely inaccessible to the depolarization and RyRs at these points to be prime for calcium‐induced calcium release, all the features of measured SR calcium release could be reproduced. We conclude that the inappropriate propagation of the depolarization into the fibre interior is the initial critical cause of severely impaired SR calcium release in MTM1 deficiency, while the Ca2+‐triggered opening of RyRs provides an alleviating support to the diseased process.
Key points
Myotubular myopathy is a fatal disease due to genetic deficiency in the phosphoinositide phosphatase MTM1.
Although the causes are known and corresponding gene therapy strategies are being developed, there is no mechanistic understanding of the disease‐associated muscle function failure.
Resolving this issue is of primary interest not only for a fundamental understanding of how MTM1 is critical for healthy muscle function, but also for establishing the related cellular mechanisms most primarily or stringently affected by the disease, which are thus of potential interest as therapy targets.
The mathematical modelling approach used in the present work proves that the disease‐associated alteration of the plasma membrane invagination network is sufficient to explain the dysfunctions of excitation–contraction coupling, providing the first integrated quantitative framework that explains the associated contraction failure.
Keywords: calcium release, ryanodine receptor, sarcoplasmic reticulum, MTM1, T‐tubule
Abstract figure legend In mammalian skeletal muscle the surface membrane depolarization propagates into the interior of the muscle fibre along the transverse (T) tubular network and synchronizes the release of calcium from the sarcoplasmic reticulum (SR) via ryanodine receptors (RyRs). Deficiency in 3‐phosphoinositide phosphatase myotubularin (MTM1) results in the disruption of the T‐tubules and the appearance of delayed SR calcium release. Calcium transients recorded in muscle fibres of MTM1‐deficient mice were compared with results of a mathematical model propagating the depolarization along the T‐tubules. If T‐tubules were assumed to be partially or completely inaccessible to the depolarization, all features of measured SR calcium release could be reproduced. Thus the inappropriate propagation of the depolarization into the fibre interior is the initial critical cause of severely impaired SR calcium release in MTM1 deficiency, while the Ca2+‐triggered opening of RyRs provides an alleviating support to the diseased process.
Introduction
In skeletal muscle the release of calcium ions from the sarcoplasmic reticulum (SR), the intracellular calcium store, is the key step that controls contraction (Schneider, 1994). The opening of the calcium release channels, the ryanodine receptors (RyRs; Fleischer et al. 1985), in the SR membrane is therefore a strictly controlled process which is achieved by the molecular interaction between RyRs and the voltage sensors of the transverse (T) tubular membrane, the dihydropyridine receptors (DHPRs; Ríos & Pizarro, 1991). Under physiological conditions RyRs remain closed until a depolarization of the surface and T‐tubular membranes, normally in the form of an action potential (AP), initiates a conformational change in the DHPRs which in turn leads to the opening of RyRs and the subsequent fast release of calcium from the terminal cisternae of the SR (see for review Baylor & Hollingworth, 2011; Hernández‐Ochoa & Schneider, 2018; Ríos et al., 1992) and thus to contraction; a process referred to as excitation–contraction coupling (ECC). Relaxation is achieved by returning the released calcium back into the SR via the SR calcium pump (Melzer et al., 1986).
In mammals, three different isoforms of RyR – types 1, 2, and 3 (RyR1, RyR2 and RyR3) – are expressed in a tissue‐specific manner (Marks et al., 1989). For striated muscles, RyR2 is found in the heart, while RyR1 and 3, with RyR1 being the dominant isoform (in most cases accounting for more than 95%) are present in skeletal muscle (Sorrentino & Volpe, 1993). Importantly, isolated and reconstituted RyRs, of all isoforms, display a clear sensitivity to calcium ions; namely, a small increase of intracellular calcium concentration ([Ca2+]i) at their intracellular surface opens (calcium‐induced calcium release; CICR), while a greater increase in [Ca2+]i inactivates the channel (Endo, 2009). In heart muscle this calcium sensitivity plays a vital role in ECC as RyR2 is always activated by CICR (Györke & Györke, 1998). In contrast, in the skeletal muscles of mammalian species, calcium ions, i.e. CICR, do not seem to have any role in RyR opening in situ, under physiological conditions.
A number of mutations in the ryr1 gene have been described to date, many associated with altered handling of [Ca2+]i resulting from leaky (see e.g. Lawal et al., 2018) or less/non‐conducting (Lawal et al., 2018) release channels. Nevertheless, CICR in adult skeletal muscle fibres even carrying these ryr1 mutations has not been documented. On the other hand, situations where the DHPR and RyR interaction has not developed yet or has artificially been altered provide evidence that calcium ions can initiate the release of calcium from the SR. For the former, CICR was demonstrated in T‐tubule‐devoid regions of skeletal myotubes in culture (Yang et al, 2001) or in CaV1.1ΔE29 (Sultana et al., 2016). For the latter, the presence of calcium sparks in enzymatically isolated adult skeletal muscle fibres subjected to osmotic challenge or to membrane permeabilization by saponin provides clear evidence (see e.g. Wang et al., 2005 and Pierantozzi et al., 2019, respectively).
Myotubularin, MTM1 deficiency, calcium sparks
In 2009, skeletal muscle ECC was for the first time documented to be a major target of myotubular myopathy, the X‐linked form of centronuclear myopathy due to deficiency in the phosphoinositide phosphatase MTM1 (Al Qusairi et al., 2009). Although mild and intermediate forms of the disease do exist, most patients experience the severe form which is associated with stringent muscle weakness, hypotonia and respiratory distress from birth, leading to death within the first months of life (see, for review, Annoussamy et al., 2019). The Mtm1‐KO mouse model recapitulates the main features of the human disease (Buj‐Bello et al., 2002) and has allowed a detailed characterization of the pathological mechanisms responsible for muscle weakness. This revealed an unanticipated accumulation of molecular and functional defects of the ECC machinery including T‐tubule network disruption, triad disorganization, reduced protein amount of DHPR α1 subunit and of RyR1, reduced voltage‐activated DHPR Ca2+ current, reduced and spatially erratic at the subcellular level, voltage‐activated RYR1‐mediated SR Ca2+ release, and conspicuous presence of spontaneous SR Ca2+ release activity at rest under the form of Ca2+ sparks (Al Qusairi et al., 2009; Kutchukian et al., 2016, 2019). Interestingly though, resting [Ca2+]i and SR calcium content were not affected by the mutation (Al Qusairi et al., 2009). The pathogenic mechanisms leading to these defects remain unclear (for a recent review, see Gómez‐Oca et al., 2021). Interactions of MTM1 with other proteins, specifically BIN1 and DNM2, are likely implicated, as they are believed to be involved in processes of membrane curving, membrane tubulation and tubule fission, and could thus play a role in proper T‐tubule maintenance in the differentiated fibres. In addition, an accumulation of MTM1 phosphoinositide substrates may also directly affect RyR1‐mediated SR Ca2+ release (Rodríguez et al., 2014).
The above observations lead us to propose that adult skeletal muscle fibres from MTM1‐deficient mice display CICR during normal excitation (Kutchukian et al., 2019). While the data were conclusive, there was no evidence that the spatio‐temporal profiles of [Ca2+]i seen in MTM1‐deficient muscle fibres could indeed be generated by CICR during voltage‐clamp activation. Here we provide a detailed simulation of the activation and inactivation of RyRs under conditions where DHPR‐ and calcium‐activated channels can co‐exist but are spatially segregated, with the latter confined to areas where the T‐tubular network is disrupted. By comparing measured and simulated line‐scan images of [Ca2+]i we demonstrate that this co‐existence of differentially gated RyRs can explain all the observed features of the spatially and temporarily inhomogeneous calcium transients seen in skeletal muscles of MTM1 knock‐out mice.
Methods
Ethical approval
All animal experiments were performed according to the ethics rules of the French Department of Veterinary Services and of the French Ministry for Higher Education, Research and Innovation, and followed the guidelines specified by the revised European Directive 2010/63/EU and the local animal ethics committee of the University Claude Bernard Lyon 1 (#DR2015‐62).
Experimental procedures
The confocal Ca2+ measurements described in the present manuscript are from a series of experiments reported by Kutchukian et al. (2016, 2019). In brief, single muscle fibres were isolated from the flexor digitorum brevis and interosseus muscles of 4–5‐week‐old wild‐type (WT) and Mtm1‐KO male mice in the 129PAS background, using collagenase (Sigma, type 1) treatment for 60 min at 37°C, followed by gentle mechanical trituration of the muscles. Single isolated muscle fibres were voltage‐clamped with the silicone voltage‐clamp technique (Jacquemond, 1997) using a micropipette filled with a solution containing (in mm) 120 K‐glutamate, 5 Na2‐ATP, 5 Na2‐phosphocreatine, 5.5 MgCl2, 12 EGTA, 4.8 CaCl2, 0.1 rhod‐2, 5 glucose and 5 HEPES, while the extracellular solution contained (in mm) 140 TEA‐methane‐sulfonate, 2.5 CaCl2, 2 MgCl2, 1 4‐aminopyridine, 10 HEPES and 0.002 tetrodotoxin. Once the voltage‐clamp pipette tip was inserted into a muscle fibre, a 30 min period was allowed before starting the measurements to allow for equilibration of the fibre cytosol with the pipette solution. Membrane depolarizing steps were delivered from a holding value of −80 mV. Fluorescence of the Ca2+‐sensitive dye rhod‐2 in the fibre's cytosol was detected using the confocal line‐scan configuration (1.15 ms per line) of a Zeiss LSM 5 Exciter microscope (Zeiss, Oberkochen, Germany) equipped with a 63× oil immersion objective (numerical aperture 1.4), with the line parallel to the longitudinal axis of the fibre. Voltage pulse‐activated rhod‐2 fluorescence changes were expressed as F/F0 with F0 the pre‐pulse baseline fluorescence as described by Kutchukian et al. (2019). All experiments were performed at room temperature (20–22°C).
Imaging of the T‐tubule network was achieved with the membrane staining dye di‐8‐anepps as described by Kutchukian et al. (2016): isolated fibres were incubated for 60 min in the presence of 10 μm of the dye.
Mathematical models
Intramembrane charge movement
The steady‐state membrane potential (Vm ) dependence of intramembrane charge movement, Qa (Vm ), that can directly gate the opening of the adjacent RyR (also referred to as charge1; see e.g. Brum & Ríos, 1987) was assumed to follow a Boltzmann distribution described with the appropriate steepness factor (ka ) and mid‐point voltage (V 50 ,a )
| (1a) |
Distribution between charge in the inactivated (also referred to as charge2; Brum & Ríos, 1987) and non‐inactivated (charge1) positions based on the holding potential (Vh ) was also assumed to follow a two‐state Boltzmann distribution
| (1b) |
with a steepness factor and a mid‐point voltage of ki and V 50 ,i , respectively. These, and all subsequent parameters used in the model calculations are presented in Table 1.
Table 1.
Parameters used in the simulation
| # | Description | Value | Unit of measure | Reference |
|---|---|---|---|---|
| 1 | V 50,a (for Boltzmann distribution) | −35 | mV | Collet et al. (2003) |
| 2 | k a (for Boltzmann distribution) | 15 | mV | Collet et al. (2003) |
| 3 | V 50, i of the inactivation site | −57 | mV | Ferreira Gregorio et al. (2017) |
| 4 | ki of the inactivation site | 8 | mV | Ferreira Gregorio et al. (2017) |
| 5 | Maximal time constant for charge movement (τmax) | 5 | ms | Collet et al. (2003) |
| 6 | Pixel size | 0.15 | μm | see Methods |
| 7 | K d of the activation site | 10 | μM | Sárközi et al. (1996) |
| 8 | k off of the activation site | 0.3 | 1/ms | Dura et al. (2003) |
| 9 | K d of the inactivation site | 200 | μM | Sárközi et al. (1996) |
| 10 | k off of the inactivation site | 0.1 | 1/ms | Schneider et al. (1988) |
| 11 | Rate constant for the transition C1 → A1 | 10−6 | 1/ms | * |
| 12 | Rate constant for the transition A1 → C1 | 1 | 1/ms | * |
| 13 | Rate constant for the transition C2 → A2 | 3 | 1/ms | * |
| 14 | Rate constant for the transition A2 → C2 | 0.01 | 1/ms | * |
| 15 | Rate constant for the transition N1 → I1 | 3×10⁻⁸ | 1/ms | * |
| 16 | Rate constant for the transition I1 → N1 | 0.001 | 1/ms | * |
| 17 | Rate constant for the transition N2 → I2 | 0.3 | 1/ms | Dura et al. (2003) |
| 18 | Rate constant for the transition I2 → N2 | 2 | 1/ms | Dura et al. (2003) |
| 19 | Maximal free sarcoplasmic reticulum [Ca2+] | 400 | μM | Ziman et al. (2010) |
| 20 | Resting [Ca2+] | 0.1 | μM | Williams et al. (1990) |
| 21 | Diffusion coefficient of Ca2+ in the myoplasm | 0.53 | μm2/ms | Endo (2009) |
Adjusted for best fit of the time course of sarcoplasmic reticulum calcium release.
Transitions of charge1 between the resting and activating states following a change in transmembrane voltage was calculated based on a second‐order single‐barrier Eyring‐rate model (Brum & Ríos, 1987) with
| (2) |
where τ(Vm ) and τmax are the time constants of charge transitions at the membrane potentials of Vm and V50,a , respectively. Examples of non‐linear capacitive currents representing transfers of intramembrane charge between the resting and activating states with different Vm and Vh are presented in Figs 1, 11 and 13.
Figure 1. Voltage dependence of intramembrane charge movement.
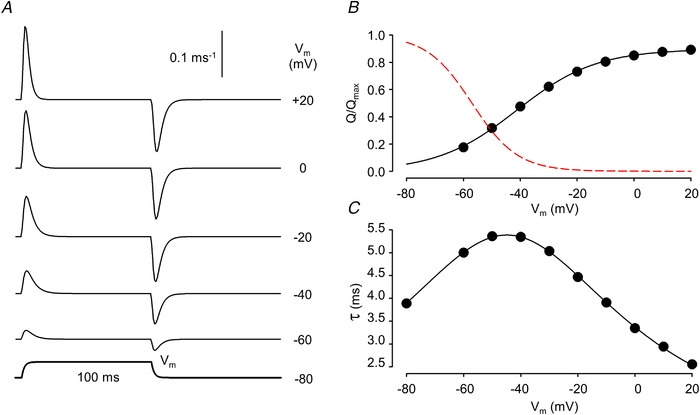
A, simulated non‐linear capacitive currents (I Q) in response to 100 ms long depolarizing pulses to the indicated membrane potentials (V m). Its time course is presented below the traces. The holding potential (V h) was set to −80 mV. B, voltage dependence of charge activation (circles) together with the best fit of eqn (1a) (solid curve) to the data points. The parameters of the fit are Q max = 0.90, V 50,a = −41.3 mV, and ka = 14.0 mV. Note that the maximal available charge does not reach unity as some DHPRs are in the inactivated state at V h = −80 mV. The voltage dependence of inactivation (eqn (1b)) is also shown (dashed curve). C, voltage dependence of the time constant for charge transfer. The curve represents the best fit of eqn (2) to the data points with τmax = 5.4 ms, V 50 = −44.9 mV, and k = 15.8 mV. Parameters for the simulation are given in Table 1. For further details see text. [Colour figure can be viewed at wileyonlinelibrary.com]
Membrane potential
Spreading of the change in membrane potential into the depth of the fibre was assumed to satisfy the differential equation (see Adrian et al., 1969)
| (3) |
where r is the radial distance from the longitudinal axis of the fibre (i.e. space; note that the fibre was assumed to be cylindrically symmetrical), t is the time from the change in voltage, D (a diffusion coefficient‐like parameter) is equal to the ratio of the specific conductance (Glum ; dimension 1/Ω/m) and capacitance (Ctm ; dimension F/m3) of the T‐tubular lumen and membrane, respectively (D = Glum /Ctm ; dimension m2/s), while τ (a time constant‐like parameter) is the ratio of the specific capacitance and conductance (Gtm ; τ = Ctm /Gtm ; dimension s) of the given T‐tubule along which the potential spreads inward.
Given the boundary conditions, Vm (r = a, t = 0) = Vh , where a is the radius of the fibre, the solution of eqn (3) is
| (4) |
with Ji being the i th first order Bessel function, αj the j th positive root of J0 , ,, , while a, D and τ have their defined meaning. Note that in the steady‐state (the solution of eqn (4) is the function of the electrical properties of the given T‐tubule (ρ) and the relative distance (r *) from the surface (Fig. 2). Note also that while τ is the time constant of the T‐tubule membrane, ρ can be considered as its space constant normalized to the fibre radius. Figures 3 and 4 present the calculated time courses of membrane voltage, the amount of charge in the activating position, and the corresponding charge movement current for the different ρ and τ values. It was apparent that if ρ was considered to be close to normal (ρ = 5 for Fig. 3) the effect of τ was marginal. On the other hand, if ρ was set to 1 (Fig. 4; considerable T‐tubule dysfunction) the effect of τ became significant.
Figure 2. Simulated profiles of membrane potentials with different T‐tubule parameters.
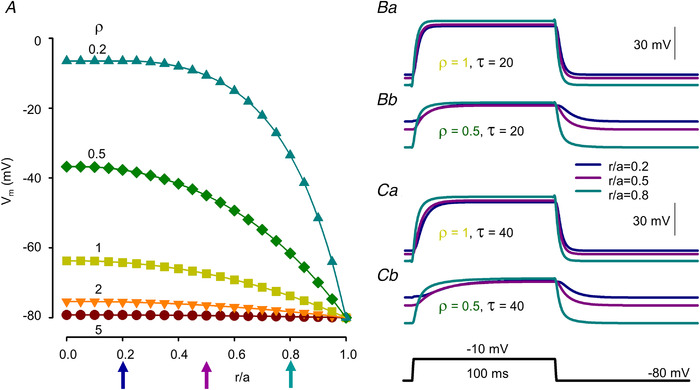
A, resting membrane potential profiles within the voltage‐clamped muscle fibre at different values for ρ (i.e. steady‐state solutions of eqn (4) for ρ = 5, 2, 1, 0.5, 0.2). Relative spatial positions were defined as the distance from the longitudinal axis (r) of the fibre divided by the radius (a) of the fibre. Holding potential (V h) was set to −80 mV. B and C, changes in the membrane potential at (r/a = 0.2, 0.5 and 0.8) in response to a depolarizing step of 100 ms to −10 mV. Ba & Ca and Bb & Cb present the cases of ρ = 1 and 0.5, respectively. Values for V h at a given r/a were taken from A. τ was set to 20 and 40 ms for B and C, respectively. [Colour figure can be viewed at wileyonlinelibrary.com]
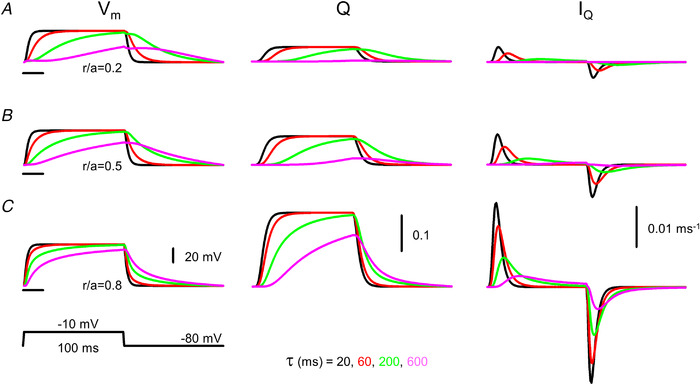
Figure 3. Simulated time courses of membrane potential (V m), charge in the activating position (Q) and charge movement current (I Q).
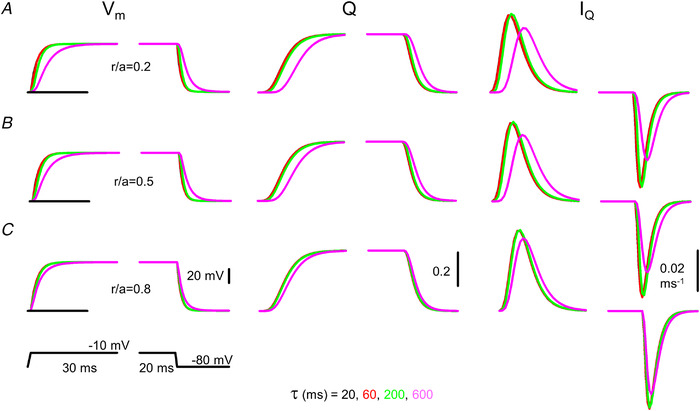
A–C, simulations were carried out at different relative spatial positions (r/a) within the fibre (0.2, 0.5 and 0.8 for A, B and C, respectively) with ρ set to 5 and τ set to 20, 60, 200 and 600 ms. The fibre was depolarized to −10 mV for 100 ms from a holding potential of −80 mV (indicated by the horizontal lines at the V m traces). Note that an extreme value of 600 ms (compare with the control value of 20 ms; see parameters in Table 1) for τ is needed to obtain appreciable difference in the time course of V m and I Q at normal ρ (i.e. at ρ = 5). [Colour figure can be viewed at wileyonlinelibrary.com]
Figure 4. Simulated time courses of membrane potential (V m), charge in the activating position (Q) and charge movement current (I Q).
A–C, simulations were carried out at different relative spatial positions (r/a) within the fibre (0.2, 0.5 and 0.8 for A, B and C, respectively) with ρ set to 1 and τ set to 20, 60, 200 and 600 ms. The fibre was depolarized to −10 mV for 100 ms from a holding potential of −80 mV (indicated by the horizontal lines at the V m traces). Note that already a small change in τ to 60 ms (compare with the control value of 20 ms; see parameters in Table 1) results in an appreciable difference in the time course of Vm, Q and I Q at reduced ρ (i.e. at ρ = 1). Note also that at large τ the amount of charge moved by the depolarizing pulse is considerably reduced. [Colour figure can be viewed at wileyonlinelibrary.com]
RyR activation
The activation of the RyR calcium release channels was, unless otherwise specified (see below), taken to be the consequence of the conformational change in the adjacent voltage sensors (DHPRs). Namely, when the voltage sensors (those in the charge1 position) in response to a depolarizing pulse move to the activated state the neighbouring RyRs open. These channels will hereon be termed as charge‐ (Q‐) gated.
Release channels were also assumed to have a calcium activating site (Ogawa et al., 2021; Sárközi et al., 2000). Upon binding of Ca2+ to this site (Fig. 5A ) the channel undergoes a conformational change and opens. The process is implemented using a four‐state model (Fig. 5B ) with two closed and two open states from each of which one is Ca2+ bound and one is not. These channels will hereon be termed as calcium‐ (Ca2+‐) gated.
Figure 5. Model of ryanodine receptor (RyR) Ca2+ release channel and its gating.
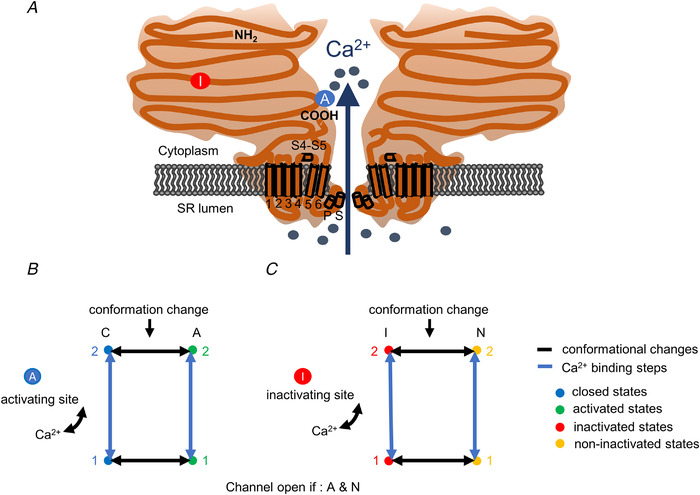
A, inactivating‐sites ( ): N‐terminal; around amino acids 1873−1903. Activating site (
 ): C‐terminal; amino acids 4007−5037. B and C, gating schemes of RyR for activation and inactivation with calcium. B, four‐state model of channel activation. C, four‐state model of channel inactivation. Note: the channel is open if A(ctivated) and N(ot‐inactivated). [Colour figure can be viewed at wileyonlinelibrary.com]
Note that in the framework of the model a RyR calcium release channel is either Q‐gated or Ca2+‐gated, i.e. a Q‐gated channel cannot be activated by Ca2+ only by the voltage sensor. Moreover, channels that are located in normally functioning T‐tubules are always Q‐gated. On the other hand, some RyRs in disrupted T‐tubules, if specifically mentioned, can be Ca2+‐gated.
RyR inactivation
All channels (both Q‐ and Ca2+‐gated) can undergo a calcium‐dependent inactivation. The channels are assumed to have a binding site for Ca2+ which, if occupied, initiates a conformational change to a state where the channel cannot be opened (Fig. 5A ). The process is modelled using a four‐state scheme similar to that described for the activation site (Fig. 5C ). The entire process of inactivation was assumed to be independent of all other properties of the channel (whether Q‐ or Ca2+‐gated and is in a closed or an activated state). It is further assumed that the parameters describing the activation and inactivation of RyRs by calcium is independent of whether or not the T‐tubular network is disrupted.
Voltage dependence of RyR opening
Figure 6A presents the calculated time course of SR calcium release expressed as the relative proportion of open Ryrs in a fibre with normal T‐tubules (i.e. ρ = 5 and τ = 20 ms; based on values for G lum, G tm and C tm as estimated by Adrian et al., 1969) for depolarizations to the indicated voltages from a holding potential of −80 mV. For a Q‐gated channel to be activated, four adjacent voltage sensors (based on the arrangement of DHPRs and Ryrs in the junctional area; see e.g. Flucher & Franzini‐Armstrong, 1996.) were assumed to be needed in the activating position. This gave rise to a rightward shift and steeper voltage dependence of SR calcium release (Fig. 6B ; circles and solid trace) as compared with that of intramembrane charge movement (Fig. 6B ; dashed trace).
Figure 6. Voltage dependence of ryanodine receptor1 activation.
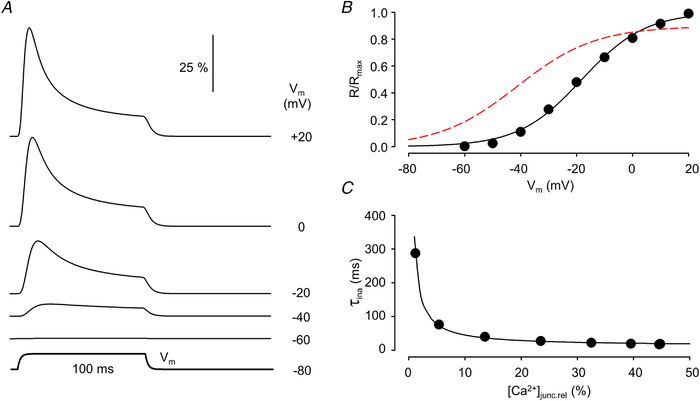
A, time course of channel opening (dR/dt) in response to 100 ms long depolarizing pulses to the indicated membrane potentials (V m). Traces were normalized to the number of channels within the junctional space. B, membrane potential dependence of the relative number of open release channels. Superimposed is the best fit of eqn (1a) to the data points. The parameters of the fit are R max = 48.90, V 50,a = −18.12 mV and k a = 11.30 mV. The voltage dependence of Q taken from Fig. 1B is also shown (dashed curve). C, [Ca2+]junc dependence of the time constant for channel inactivation. Values on the x‐axis are expressed as relative to the maximal attainable [Ca2+]junc. The data points were fitted to eqn (5) (best fit is shown superimposed) with K d,rel = 25.6, ki = 0.0787. Parameters for the simulation are given in Table 1. For further details see text. [Colour figure can be viewed at wileyonlinelibrary.com]
To further enable the comparison with previously published data, the declining phase of the time course of channel opening during the depolarizing pulse – representing the calcium‐dependent inactivation of RyR – was fitted by a single exponential function. The obtained time constants (τina) were then plotted as a function of the [Ca2+] in the junctional space ([Ca2+]junc) expressed as relative to the maximal attainable [Ca2+]junc ([Ca2+]junc,rel; Fig. 6C ). These data points were then fitted with
| (5) |
where Kd ,rel is the dissociation constant of the inactivation site normalized to the maximal attainable [Ca2+]junc and ki is the rate constant of the conformational change of RyR (see e.g. Sárközi et al., 1996). As demonstrated in Fig. 6C the data points were well fitted with eqn (5) giving rise to a ki of 78.7 1/s in accordance with previously published data from measurements on isolated fibres (Sárközi et al., 1996).
Results
Disrupted T‐tubular network in MTM1‐deficient skeletal muscle fibres
Figure 7 presents transmitted light (panels Aand B) and fluorescence images (panels Cand D) of control and MTM1‐deficient muscle fibres collected with a confocal microscope to demonstrate how the absence of this phosphoinositide phosphatase affects the T‐tubular network. To this end, fibres were stained with di‐8‐Anepps, a hydrophobic voltage‐sensitive fluorescent dye that has been extensively used to stain the surface membrane of excitable cells (e.g. Al‐Qusairi et al., 2009; Kutchukian et al., 2016). Figure 7C demonstrates that under physiological conditions the staining reveals a regular double‐rowed pattern consistent with the organization of the T‐tubular network. On the other hand, in the image of the fibre from the MTM1 knock‐out animal (Fig. 7D ) large patches of non‐stained areas are present, indicative of disrupted T‐tubules in these parts of the muscle fibre. However, the image also demonstrates that there are zones with normal staining as well. These observations raise the possibility that in MTM1‐deficient fibres, areas with both normal and modified ECC could be present.
Figure 7. Disrupted T‐tubular network in a fibre from an MTM1‐deficient mouse.
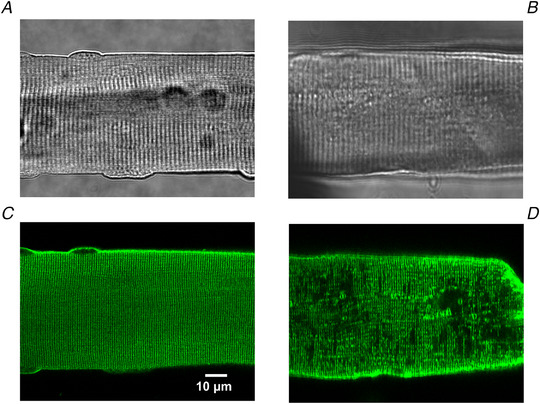
Transmitted light image of a wild‐type (A) and a MTM1‐deficient (B) flexor digitorum brevis (FDB) fibre. Fluorescent image of a di‐8‐Anepps stained wild‐type (C) and a MTM1‐deficient (D) FDB fibre collected with a confocal microscope. Note the regular and the incomplete patterns of the T‐tubules in the wild‐type and the MTM1‐deficient fibres, respectively. [Colour figure can be viewed at wileyonlinelibrary.com]
Implementation of the model for ECC with a modified T‐tubular network
To understand the implications of disrupted T‐tubules on ECC, a computer routine was written to simulate the spread of excitation along the T‐tubules and the consequent activation and inactivation of RyRs at a given release site together with the diffusion of calcium ions between these sites. For simplicity, simulation was performed in one dimension only – along the scan line. The events at different release sites were assumed not to influence one another apart from the Ca2+ arriving from the adjacent sites and modifying the local [Ca2+]. As the scan line was positioned parallel to the longitudinal axis of the fibre, the relative distance (r/a = r* ) was taken to be identical for all spatial positions.
As evidenced from eqn (4), the spatial differences in charge movement activation depend only on how the specific parameters (D and τ) of the T‐tubular membrane vary along the scan line. To incorporate this into the model, τ and the dimensionless parameter ρ were allowed to vary along the scan line to describe any disruptions in the T‐tubule network at the given spatial position. This is reflected both in the spatial variation in V h (see Fig. 8A ) and in the time course of the membrane potential change that drives the conformational change of the voltage sensors (see Fig. 2).
Figure 8. Simulated spatio‐temporal pattern of intracellular calcium concentration in an artificial muscle fibre.
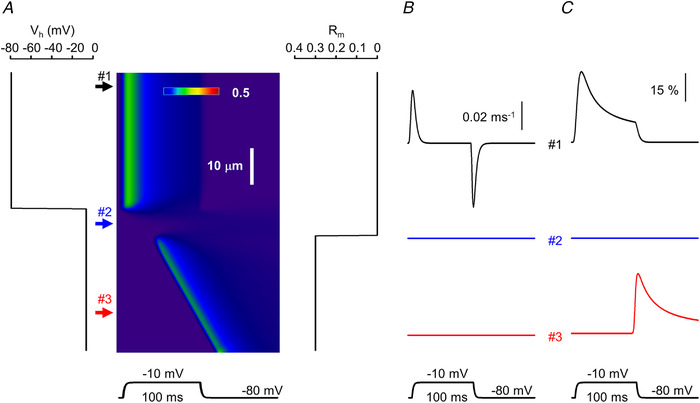
A, line‐scan image showing the calcium concentration profile. The assumed distribution of the holding potential (V h) and relative availability of ryanodine receptors (RyRs) that can be activated by calcium (R m) along the fibre are presented next to the image (left and right, respectively). V h was determined by setting ρ = 5 and 0.2 in eqn (4) at positions where the T‐tubules were assumed to be intact (upper arrow) and affected (middle and bottom arrow), respectively. The fibre was depolarized to −10 mV for 100 ms. B, non‐linear capacitive currents representing intramembrane charge movement at different locations along the fibre as indicated by the respective numbered arrows in A. C, time course of open RyRs at the same spatial positions. The same parameters were used in the simulation as in Figs 1 and 6. [Colour figure can be viewed at wileyonlinelibrary.com]
Q‐gated channels were assumed to be activated immediately when all four of their voltage sensors moved to the activating position. They remained open until one of the voltage sensors returned to its resting state unless they became inactivated due to the calcium‐dependent inactivation process. To incorporate in the model the possibility that calcium ions may activate the channels, a dimensionless parameter (Rm ) was introduced which described the proportion of Ca2+‐gated channels at a given spatial position (see Fig. 8A ). By definition, for all i (where i refers to a given spatial coordinate in the image along the scan line); and R m(i) = 0 if all channels are Q‐gated and R m(i) = 1 if all channels are Ca2+‐gated at that position (if, e.g. 30% of the channels are Ca2+‐gated then R m(i) = 0.3; see Fig. 8A ). Ca2+‐gated channels could also undergo calcium‐dependent inactivation, as mentioned above. Unless otherwise stated R m(i) was set to 0.
Once the spatial profiles of T‐tubule properties and channel activation were set, the simulation was run to follow the release and diffusion of calcium ions along the scan line. The program generated the spatio‐temporal profiles at each point of the scan line of intramembrane charge movement, RyR activation and inactivation, and the calcium concentration. The latter, as a line‐scan image, was then compared with those measured experimentally.
As an example, Fig. 8 presents the result of the simulation where the scanning line was assumed to traverse three different compartments of the fibre. In certain spatial positions – exemplified by position #1 in Fig. 8A – the T‐tubule network was assumed to be intact and RyRs were thus taken to be all Q‐gated (i.e. ρ = 5 and R m = 0, and consequently the holding potential, V h, was calculated to be −80 mV; left panel in Fig. 8A ). In another spatial position (position #2 in Fig. 8A ) the T‐tubule network was assumed to be completely disrupted (ρ = 0.2; calculated V h = −8 mV; see also Fig. 2A ) while all RyRs were still taken to be Q‐gated. Finally, in a part of the fibre, with completely disrupted T‐tubules, 30% of the calcium release channels were assumed to be Ca2+‐gated (R m = 0.3). As demonstrated in Fig. 8, this gave rise to spatially inhomogeneous intramembrane charge movement and calcium release with delayed openings of RyRs. Note also that while calcium release terminated instantly upon fibre repolarization at positions where only Q‐gated channels were present (position #1 in Fig. 8), this was not the case where calcium was allowed to govern channel opening (position #3).
Spatially and temporally heterogeneous calcium release in MTM1‐deficient skeletal muscle
Figure 9 presents line‐scan images of calcium transients measured on enzymatically isolated skeletal muscle fibres from myotubularin‐deficient mice in response to depolarizing pulses of 500 ms in duration and at various amplitudes. The images were selected to demonstrate critical features of the calcium release process in MTM1‐deficient muscle fibres that are not seen in healthy controls. First and foremost, as demonstrated in all panels of Fig. 9 (see spatial positions indicated by upper arrows) there are positions within the fibre that behave essentially identically to those seen under control conditions. Namely, a large calcium release occurs that is synchronous with the depolarizing pulse and displays a fast rising phase, fast inactivation and termination upon returning to the holding potential.
Figure 9. Characteristic features of sarcoplasmic reticulum calcium release in MTM1‐deficient mouse skeletal muscle fibres as assessed by confocal line‐scan imaging.
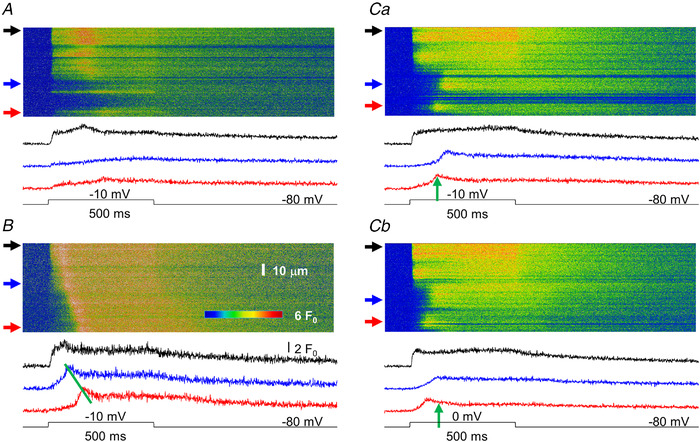
A, a fibre displaying areas where normal (top arrow) or reduced (to a lesser, middle arrow or to a more pronounced extent, bottom arrow) calcium release is observed. Here, and in all other panels, traces below the image represent the time course of the transient calculated by averaging 10 points in the spatial domain at the corresponding (from top to bottom) arrow. B, a fibre displaying a propagating calcium wave. The slope of the line connecting the peaks of the transients can be used to determine the speed of propagation (570 μm/s for the image in B). Ca, a fibre displaying areas where the start of the transient significantly lags behind that of the voltage command. Upper trace represents a non‐affected area, whereas middle and bottom traces present examples for delayed activation. The fibre was depolarized to −10 mV. Cb, same fibre as in Ca, but now depolarized to 0 mV. The positions of the arrows next to the images and thus the time course of the transients correspond to identical spatial positions in Ca and Cb. Note that the delay for activation in the affected area is less in the fibre with the greater depolarization as indicated by the vertical arrows pointing to the peak of the bottom trace in Ca (the arrow in Cb is positioned at the same time point as that in Ca). The resting membrane potential was set to −80 mV and the depolarization was 500 ms for all fibres in the figure. [Colour figure can be viewed at wileyonlinelibrary.com]
On the other hand, four distinct features can be identified in these images that are not present in control muscle fibres. First, as seen in Fig. 9A (position at the bottom arrow) and Fig. 9Ca, there are regions of the fibre where, despite the depolarization, none or very little calcium release occurs. Secondly, as exemplified in Fig. 9B , propagating calcium waves seem to occur in these cells. This is substantiated by the linear wave front along the spatial dimension and the delays in calcium release activation as demonstrated by the time courses of the calcium transients depicted at positions marked by the middle and bottom arrows shown below the line‐scan image. Thirdly, at distinct spatial positions calcium release activation is delayed as compared with the onset of fibre depolarization (see e.g. positions in Fig. 9 Ca marked by the middle and bottom arrows and the corresponding traces below the image) independent of any visible calcium wave. Finally, by comparing Fig. 9Ca with Fig. 9Cb – in which consecutive line scans and corresponding transients are presented from the same spatial positions of the same fibre with depolarizations to −10 and 0 mV, respectively – it is evident that this delay in the activation of SR calcium release is voltage dependent. To further the comparison, vertical arrows are positioned at the same point in time on the lowermost traces (corresponding to the spatial position marked by bottom arrows at the line‐scan images). The time point was selected to mark the peak of the transient in Fig. 9Ca. Note that the peak of the transient in Fig. 9Cb occurs earlier than that in Fig. 9Ca, demonstrating that a shorter delay for activation corresponds to a larger depolarization.
Lack of or delayed activation of SR calcium release
It is evident from the model used, and as demonstrated in Fig. 8A (spatial position #2), that if the T‐tubules are critically disrupted (in that particular example ρ = 0.2) and there are no Ca2+‐gated RyRs in the given region of the fibre, calcium release from the SR will not occur. Under these conditions the resting V h is very low (−8 mV in Fig. 8A ), giving rise to an essentially complete inactivation of the voltage sensors and their consequent inability to activate the release channels. This, taken together with the disrupted T‐tubular network (see Fig. 8) would simply explain the observation that some regions are devoid of SR calcium release in the line‐scan images.
However, the introduction of Ca2+‐gated RyRs in such a region would give rise to essentially instantaneous (the delay would only be the time needed for calcium to diffuse from a neighbouring release site) calcium release. To generate an appreciable delay in the activation of SR calcium release based on CICR only, one should introduce a large area with no Ca2+‐gated RyRs as was done in Fig. 8A (see the delay in the onset of the calcium wave). This, nevertheless, was not the case in the images presented in Fig. 9C where the delay was present in spatially neighbouring locations (i.e. within the resolution of the confocal system).
To explain this observation, we explored the possibility according to which altered T‐tubular properties could underlie the delayed onset of SR calcium release. Simulations were run using different values for ρ and τ ranging from 0.2 to 5 and from 20 to 600 ms, respectively, with only Q‐gated calcium release channels present. The surface membrane was depolarized to −10 mV (identical in size to the depolarization used in the actual measurement presented in Fig. 10A ) for 100 ms. Figure 10B thus presents simulated line‐scan images where two distinct areas were considered within the muscle fibre. In the region represented by the upper arrow, ρ and τ were set to their normal values (5 and 20 ms, respectively), while in the affected region ρ was reduced to 0.8, 0.9 and 1 for Fig. 10Ba, Bb and Bc, respectively, with τ being set at 200 ms. Note that the onset of SR calcium release under these conditions was substantially delayed as compared with the start of the depolarization. Furthermore, as evidenced from the images, the smaller the ρ the greater was the delay. This dependence of the onset of SR calcium release activation on ρ is presented in Fig. 10C , where the position of the peak of the transients is displayed as a function of ρ. If the T‐tubular network is functioning close to normal (ρ > 2) the activation of the interior of the fibre is readily achieved, while if the T‐tubular access is reduced the activation is substantially prolonged, and furthermore, this prolongation is extremely sensitive to the space constant when it is close to the radius of the fibre (i.e. when ρ is equal to or less than 1). The calculated changes in membrane voltage and intramembrane charge movement are presented in Fig. 11. It should be noted that if ρ is reduced to below 0.7 no detectable calcium release occurs (in the absence of Ca2+‐gated channels) due to the insufficient activation of the Q‐gated channels (data not shown).
Figure 10. Simulation of delayed activation in MTM1‐deficient muscle fibres.
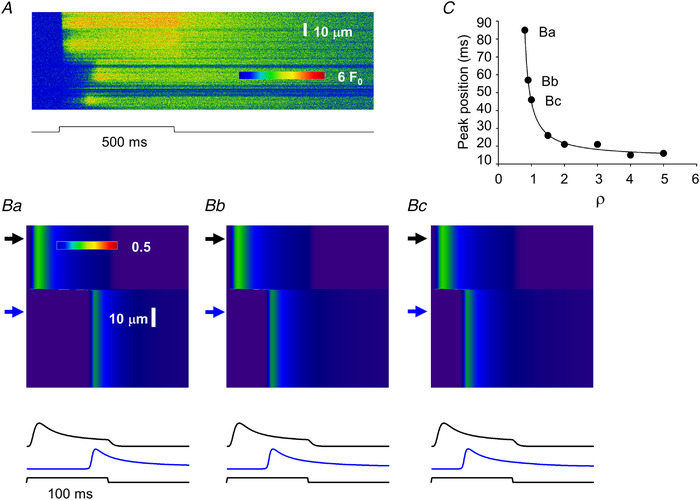
A, same line‐scan image as presented in Fig. 9 Ca. B, simulated line‐scan images (simulation done as described in Methods and presented in Fig. 8 and Figs 2, 3, 4) using two areas with different parameters. Upper arrows point to areas where activation is normal (for normal parameters see Table 1) while bottom arrows point to affected areas where ρ and τ (eqn (4)) were altered. τ was increased to 200 ms from its normal value of 20 ms, while ρ was decreased to 1, 0.9 and 0.8 from its normal value of 5 for Bc, Bb and Ba, respectively. Traces below the images represent the time course of the transient at the corresponding (top and bottom) arrow. C, dependence of the activation delay (as assessed by the position of the peak of the transient compared with the onset of the depolarizing pulse) on the selection of ρ. Points labelled Ba, Bb and Bc correspond to the bottom traces in Ba, Bb and Bc, respectively. In the simulation the fibre was depolarized to −10 mV for 100 ms from a holding potential of −80 mV to mimic the depolarization of the fibre in A. Note that the simulated images, here and in all subsequent figures, display the time course of the calcium transient in the triadic junction (see Methods). [Colour figure can be viewed at wileyonlinelibrary.com]
Figure 11. Simulated changes in membrane potential and intramembrane charge movement.
A, membrane potential changes at the arrows corresponding to Fig. 10Ba, Bb and Bc. Scale bars are valid for all traces. B, charge movement currents (I Q) calculated at the same position on each panel. Note the different scales for the solid and dashed traces (the expanded scales correspond to the solid traces). Dashed traces were calculated with ρ = 5. [Colour figure can be viewed at wileyonlinelibrary.com]
Voltage dependence of activation delay
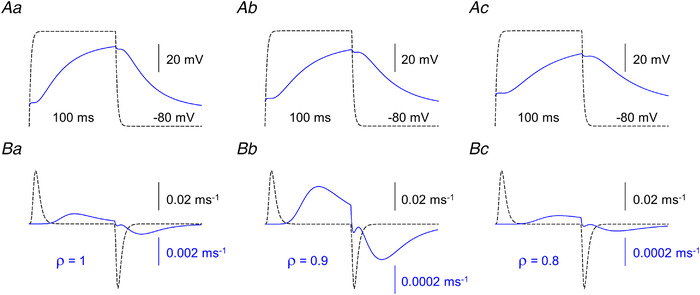
To further test the potential of the model, depolarizing pulses of increasing amplitudes were applied to characterize the voltage dependence of the delay of SR calcium release in the areas of affected T‐tubules. To generate the images in Fig. 12B the previously introduced method (Fig. 10B ) was followed. The fibre was assumed to have an area of normal (represented by the upper arrows) and an additional area with disrupted T‐tubules (represented by the bottom arrows). The surface membrane was depolarized to −20, 0 and +20 mV for Fig. 12Ba, Bb and Bc, respectively, to explore the voltage range used in the actual measurements (line scans from such measurements are presented in Fig. 12Aa and Ab). To simulate the T‐tubule malfunction ρ and τ were set to 0.8 and 200 ms, respectively; values corresponding to those used for Fig. 10. The corresponding changes in membrane voltage and intramembrane charge movement are presented in Fig. 13. Note that the delay for calcium release activation, as also evidenced from the traces below the line‐scan images in Fig. 12B was clearly voltage dependent. Furthermore, in line with the observations from the actual measurements, greater depolarizations brought about shorter delays. The membrane potential dependence of release activation – assessed as the time‐to‐peak of the transients – is presented in Fig. 12C for the voltage range of −20 to +20 mV for two values of ρ. In T‐tubules with a low space constant (ρ = 0.8) the voltage dependence is steep, while for only a slightly less‐affected T‐tubule (ρ = 1) this dependence is shallow.
Figure 12. Simulation of the voltage dependence of delayed activation in MTM1‐deficient muscle fibres.
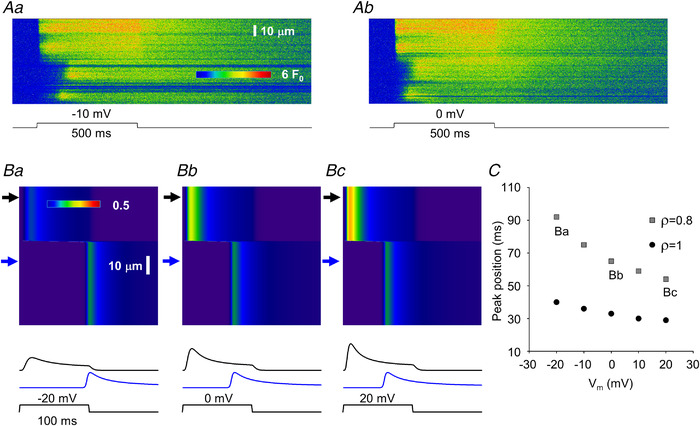
A, same line‐scan images as presented in Fig. 9C . B, simulated line‐scan images using two areas with different parameters. Upper arrows point to areas where activation is normal while bottom arrows point to affected areas where ρ and τ (eqn (4)) were altered. τ was increased to 200 ms from its normal value of 20 ms, while ρ was decreased to 0.8 from its normal value of 5. The depolarizing pulse brought the membrane potential (V m) from a resting value of −80 mV to −20, 0 and +20 mV for 100 ms for Ba, Bb and Bc, respectively. Traces below the images represent the time course of the transient at the corresponding (top and bottom) arrows. Note that the activation of the bottom trace is faster if the membrane is more depolarized. C, voltage dependence of the activation delay (as assessed by the position of the peak of the transient as compared with the onset of the depolarizing pulse) at different ρ values. Points labelled Ba, Bb and Bc correspond to the bottom traces in Ba, Bb and Bc, respectively. [Colour figure can be viewed at wileyonlinelibrary.com]
Figure 13. Simulated changes in membrane potential and intramembrane charge movement.
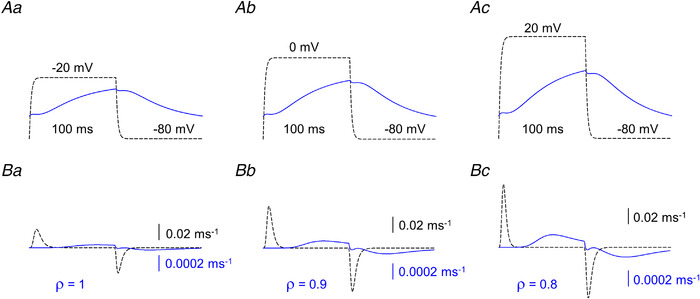
A, membrane potential changes at the arrows corresponding to Ba, Bb and Bc in Fig. 12. B, charge movement currents (I Q) calculated at the same position on each panel. Note the 100 times smaller scale for the solid traces. [Colour figure can be viewed at wileyonlinelibrary.com]
Calcium waves
Calcium waves have previously been described in both cardiac (Wier & Blatter, 1991) and skeletal muscle (Cully et al., 2014) under special conditions. Therefore, we expected that our model would simply reproduce the presence of propagating wave fronts of calcium release activation (as presented in Fig. 14A from an actual measurement) once Ca2+‐gated release channels and, consequently, CICR is present in the model. This assumption was clearly substantiated by the simulation presented in Fig. 8A . The calcium waves described so far had a velocity of around 0.2 μm/ms (Zhou et al., 2005).
Figure 14. Simulation of calcium wave propagation in MTM1‐deficient muscle fibres.
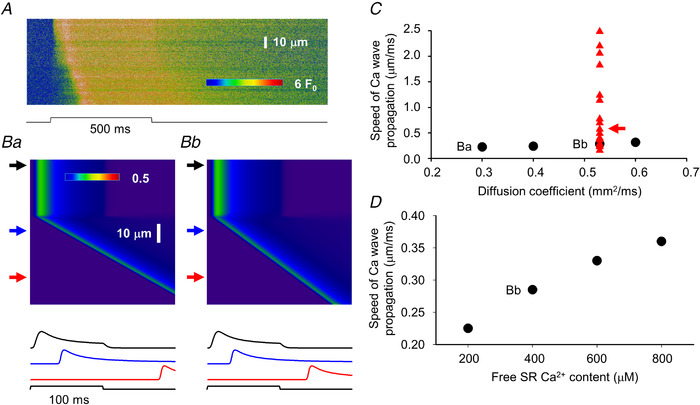
A, same line‐scan image as presented in Fig. 9B . B, simulated line‐scan images using two areas with different parameters. Upper arrows point to areas where activation is normal (for normal parameters see Table 1) while middle and bottom arrows point to affected areas where the presence of calcium activatable RyRs were introduced (30% of all channels in the affected area) while ρ was set to 0.2. This allowed calcium‐induced calcium release (CICR) to initiate a propagating calcium wave. The diffusion coefficient for calcium was set to 0.53 (see Donahue & Abercrombie, 1987) and 0.3 μm2/ms in Bb and Ba, respectively. Traces below the images represent the time course of the transient in the spatial domain at the corresponding (top to bottom) arrows. C, dependence of the speed of the propagation of the calcium wave on the selected diffusion coefficient for calcium (circles). Points labelled Ba and Bb correspond to images in Ba and Bb, respectively. Triangles represent actual values measured in line‐scan images (as that in A), arrow points to the data (0.57 μm/ms) obtained from the image in A. Note that the measured values cover a much broader range that those obtained in the simulations, in many cases far beyond what would be expected for CICR. D, dependence of the speed of the propagation of the calcium wave on the sarcoplasmic reticulum calcium content. Point labelled Bb corresponds to image in Bb. In the simulation the fibre was depolarized to −10 mV for 100 ms from a holding potential of −80 mV to mimic the depolarization of the fibre in A. [Colour figure can be viewed at wileyonlinelibrary.com]
Using 0.53 μm2/ms for the diffusion coefficient of Ca2+ in the myoplasm (a value taken from the literature; see Table 1) our model readily generated a propagating calcium wave as presented in Fig. 14 Bb. For the simulation we followed the idea used for Figs 10 and 12; namely, the fibre was divided into two areas, one with normal and another with disrupted T‐tubules. In this case, however, affected T‐tubules were assumed to be essentially incapable of conducting the change in the surface membrane potential into the interior of the fibre (i.e. ρ was set to 0.2) but to have some Ca2+‐gated channels (R m was set to 0.3 for the simulations in Fig. 14). This setting (Fig. 14 Bb) gave rise to a calcium wave with a propagation velocity (calculated from the slope of the wave front) of 0.285 μm/ms, essentially in line with previous measurements (see above). Varying the diffusion coefficient of Ca2+ in the range of 0.3 (corresponding line scan is shown in Fig. 14 Ba) to 0.6 μm2/ms had little effect on the speed of propagation as presented in Fig. 14C (circles). These findings convinced us that CICR and calcium wave propagation were properly incorporated into our model.
However, values calculated from actual measurements (red symbols in Fig. 14C ) were scattered over a much wider range, reaching propagation speeds as great as 2.4 μm2/ms; an order of magnitude greater than those published earlier. As propagation speed based on CICR critically depends on the rate and amount of calcium released from the internal calcium stores, simulations were repeated with changing the assumed free SR Ca2+ concentration (using 0.53 μm2/ms as the diffusion coefficient for calcium in the myoplasm). Although the propagation speed indeed became faster with increased SR calcium load as presented in Fig. 14D , doubling the load only increased the speed by 26.3%. These simulations convinced us that the extremely fast wave fronts could not be explained by assuming CICR to be present in these fibres. However, it should be emphasized that in the majority of fibres the propagation velocities were essentially identical to those obtained from our simulations suggesting that CICR was indeed responsible for the development of propagating wave fronts in those fibres.
Wave front of calcium release activation
The extremely large apparent propagation speed for the activation of SR calcium release observed in a subpopulation of fibres required alternative explanations, other than CICR. The observations that different ρ values – i.e. different extents of T‐tubular disruption – can result in different delays for the onset of calcium release activation and that T‐tubular defects seemed to appear in patches (see Fig. 7) suggested a possible solution. In all of the simulations above the spatial profile of ρ was assumed to change suddenly (from a control value of 5 to different but lower values to represent the defect) and then remain constant. What if ρ was to change ‘smoothly’, i.e. following a given continuous spatial profile that represents a T‐tubular defect that is not identical within a region, rather it becomes worse and worse?
Simulations presented in Fig. 15 explore this possibility. Figure 15A and C presents two simple spatial profiles for ρ; namely, ρ was assumed to decrease linearly or following a second‐order polynomial from a starting value of 1 to a final value of 0.8 for Fig. 15A and C, respectively, in the affected region. As in all simulations, a portion of the fibre was assumed to have normal T‐tubules (ρ = 5) with only Q‐gated channels present in both the non‐affected and affected regions (R m was set to 0 for the entire fibre). Results of the simulations with the linear and quadratic functions for ρ are presented in Fig. 15B and D, respectively. In both cases an apparent travelling wave‐form is observed which has faster apparent speed of travelling (greater slopes) then those presented in Fig. 14B . This later observation is quantified in Fig. 15E where the apparent speeds – calculated from the slopes – at positions marked by corresponding letters ‘a’, ‘b’ and ‘c’ on the line‐scan image in panels B and D are plotted together with the measured propagation speeds (values taken from Fig. 14C ). The simulated values fall perfectly within the range of extremely large measured speeds suggesting that a progressive decline in T‐tubular function in the affected domains could be the underlying reason for apparent travelling wave fronts of SR calcium release.
Figure 15. Simulation of calcium wave propagation without calcium‐induced calcium release in MTM1‐deficient muscle fibres.
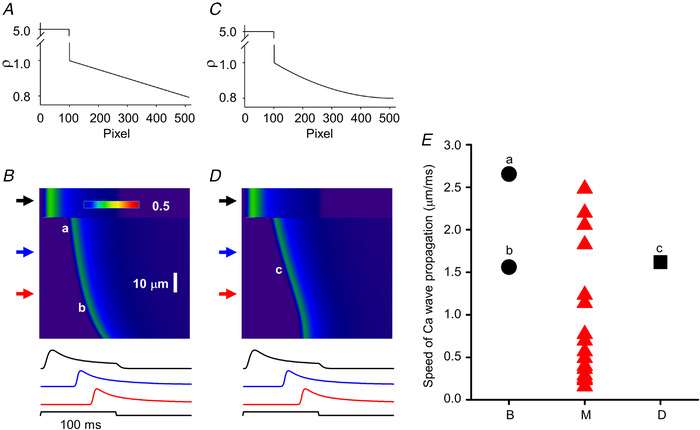
A and C, spatial profiles of ρ. Graphs present the change in ρ along the spatial domain (512 pixels) of the simulation. Two cases were considered: ρ either changed linearly (A) or following a second‐order polynomial (C) from 1 to 0.8 in the affected region. B and D, simulated line‐scan images using the ρ profiles from A and C, respectively (τ = 400 ms; R m = 0). Upper arrows point to areas where activation is normal, while middle and bottom arrows point to affected areas. Traces below the images represent the time course of the transient at the corresponding (top to bottom) arrows. Note the appearance of a clear wave front in both images. Note also that the wave front seems to ‘curve’ in B (i.e. the calculated speed of ‘propagation’ would be different at different spatial positions) while it is linear for the most part in C (i.e. the calculated speed of ‘propagation’ would be constant at different spatial positions). In the simulation the fibre was depolarized to −10 mV for 100 ms from a holding potential of −80 mV. E, triangles represent actual values measured (M) in line‐scan images (same as that in C in Fig. 14), a, b (circles) and c (square) label the data obtained from the images in B and D. [Colour figure can be viewed at wileyonlinelibrary.com]
Taken together, our simulations with the simple assumptions of altered T‐tubular accessibility, i.e. reduced ρ and τ, and the appearance of Ca2+‐gated channels in areas where voltage control was completely lost were able to describe not only qualitatively but also quantitatively the complex observations that in certain domains release activation is delayed, this delay is strongly voltage dependent, and travelling wave fronts of release activation can occur with a large range of apparent travelling speeds.
Discussion
Diseased Ca2+ release reproduced with numerical simulations
We provide here quantitative mechanistic understanding of critical hallmarks of the defective SR Ca2+ release process that is associated with muscle contraction failure in myotubular myopathy. Results from the modelling demonstrate that various extents of T‐tubule disruption (in concurrence with the experimental observations) combined with the consequent opened option for RyR1 channels to switch from a charge(Q)‐gated to a Ca2+‐gated operating mode, reproduces the diseased Ca2+ transients. There are two important accompanying correlates: T‐tubule disruption is a key initial determinant of the disease‐associated functional deficit; Ca2+‐gated RyR1 channels provide an emergency support alleviating (though not relieving) the impact of the defective normal Ca2+ release process. Of importance, the similarity of Ca2+ release symptomatology between MTM1‐deficient muscle and other centronuclear myopathies (Huntoon et al., 2018; Kutchukian et al., 2017; Silva‐Rojas et al., 2022) promotes the likelihood that identical or closely related pathophysiological mechanisms are at work in those diseases as well.
SR Ca2+ release in healthy mammalian muscle fibres exclusively relies on Q‐gated RyR1 channels; it exhibits very standardized features in terms of voltage control of onset and termination, voltage dependency of activation, kinetics and spatial homogeneity, which overall contribute to the stringent safety of the control of muscle contraction. In contrast, MTM1‐deficient muscle fibres exhibit a diversity of SR Ca2+ release alterations including spatial heterogeneity, kinetic defects, depressed amplitude, propagating events and voltage‐free spontaneous activity (Al‐Qusairi et al., 2009; Kutchukian et al., 2016, 2019). So far, a unifying modelling framework capable of explaining defects in voltage‐activated Ca2+ release in this disease model had remained unavailable. The present work relies on a history of previously worked out quantitative biophysical knowledge of the properties of the T‐tubule network, of the EC coupling process and of the RyR channels, including the Ca2+ dependency of their activation and inactivation, to provide such a framework. The model considers healthy SR Ca2+ release areas where the opening of RyR channels is triggered by the voltage‐dependent DHPR Q displacement in the T‐tubule membrane, followed by RyR closure due to Ca2+‐dependent inactivation, together with diseased Ca2+ release areas where Q‐dependent RyR gating is compromised because of limited T‐tubule accessibility to voltage changes. This is sufficient to predict spatially inhomogeneous ICM activation due to locally shunted T‐tubule voltage distribution, delayed Ca2+ transients and the voltage dependency of the delay. Under these conditions, implementing the added possibility for a fraction of the RyR channels to undergo Ca2+‐dependent activation is sufficient to recapitulate the existence of the observed propagating transients. The inclusion of CICR in the model is substantiated by the presence of propagating calcium release events with extremely large full‐width at half maxima (FWHM) and high frequency (Kutchukian et al., 2019). These features render it unlikely that these events would be due to random activation of neighbouring – both in space and time – release sites. Rather, as suggested by Kutchukian and coworkers (2019), CICR is a likely, but not necessarily the sole, candidate for synchronizing the opening of RyRs responsible for the generation of events with large (greater than 4 μm) FWHM. Importantly, the strength of the model is that the two disease‐related assumptions above are validated by the images of the T‐tubule network in the diseased fibres (see Fig. 7) and by the consensual concept according to which control of RyR activation by the DHPR precludes the Ca2+‐activation mode (see Ríos, 2018).
It is important to stress that the apparent speeds of propagation for the observed calcium wave fronts showed a large scatter with values ranging from 0.16 to 2.48 μm/ms (see Figs 14 and 15). To explore the possible underlying mechanisms one must first consider the amount of evidence that shows that if the T‐tubular network is disrupted, e.g. by Saponin permeabilization or by osmotic stress (Bodnar et al., 2014; Wang et al., 2005, respectively), or not yet developed – as in cultured myotubes (Shirokova et al., 1999) – the RyRs are prone to be activated by calcium. On the other hand, as suggested by Cully et al. (2014), lowering of the SR calcium content and the consequent alteration of RyR open probability could also explain a regenerative propagation. While the measured values at the lower end (see Fig. 14C ) would be consistent with both a CICR‐ (see e.g. Figueroa et al., 2012 for values in frog skeletal muscle) or an intra‐SR‐based propagation (Cully et al., 2014), those of the higher end are clearly not. A number of possibilities arise to explain the apparent fast propagation of the calcium wave front. In situ the travelling of an AP along the longitudinally positioned T‐tubules would be an ideal candidate. These APs have indeed been demonstrated to exist and to travel with a speed of 13 ± 3 μm/ms (Posterino et al., 2000), comparable to the values measured here. However, under our experimental conditions (the presence of 2 μm tetrodotoxin and tetraethylammonium being the major cation in the External solution) APs could not develop, thus this possibility must be excluded. Nevertheless, longitudinally positioned T‐tubules provide an alternative solution; namely, electrotonic propagation. If these T‐tubules are also affected as the transversally running T‐tubules, and there is no reason to believe that they aren't, delayed activation (see e.g. the traces for V m in Fig. 4) and consequently an apparent slowed propagation could take place in them, too. This framework would, however, require that the transversal T‐tubules of the affected area should be gradually more and more affected otherwise the excitation would reach a given spatial point faster along the corresponding transversal T‐tubule than via a distant transversal T‐tubule followed by propagation along a longitudinal T‐tubule. This scenario is not very different from what we have assumed in Fig. 15 (and in the corresponding text), i.e. gradually changing ρ, the only simplification is that spread along longitudinal T‐tubules was not modelled. Taken together, our model – and the observations – are consistent with the possible presence of CICR‐based propagation of calcium waves but inevitably require additional, most likely gradual loss of T‐tubule function in the affected areas.
Limitations of and simplifications in the models used
Although the models were effective in reproducing the most important features associated with MTM1 deficiency, it should be emphasized that a number of simplifications were made when collating the events of EC coupling. Furthermore, certain details seen in line‐scan images representing modified SR calcium release were not explored here.
First and foremost, interactions between adjacent T‐tubules other than the diffusion of calcium from a release site to its neighbours were not considered. This approximation neglects the presence of longitudinal T‐tubules (Franzini‐Armstrong, 1991) that were shown to conduct electrical activation between sarcomeres even in the absence of surface membrane depolarization (Launikonis & Stephenson, 2004), and the percentage of which was shown to be increased in MTM1‐deficient muscle fibres (Al Qusairi et al., 2009). A scenario where excitation along first a non‐affected transversal and then along a longitudinal T‐tubule would reach areas where the corresponding T‐tubule is not functioning is, therefore, not unimaginable. In this framework, access distances to otherwise activatable RyRs could be much greater than the radius of the fibre. This would then lead to activation delays even if T‐tubular conductance (G lum and G tm) and capacitance (C tm) are not altered. While this possibility cannot be ruled out, the observed delays (under certain conditions greater than 100 ms) would, if T‐tubules are functioning normally, require access distances to exceed the fibre radius several fold. This is unlikely to be the case based on the staining of T‐tubules (Fig. 7), which suggested that the size of disrupted areas was clearly less than that of the fibre diameter. Nevertheless, this alternative pathway for activation with modified T‐tubular parameters, i.e. reduced ρ and/or increased τ, could explain the extremely long delays seen in a few line‐scan images.
Intramembrane charge movement was described using a simple two‐state model with Eyring‐rate kinetics (Brum & Ríos, 1987). This is clearly an over‐simplification of the process. A number of reports, including those from our laboratory, have confirmed that distinct kinetic components are present on charge movement currents, referred to as the ‘hump’ component or I γ (see e.g. Huang, 1991; Szücs et al., 1991). This component was suggested to be the result of calcium release from the SR and thus generate a positive feed‐back in RyR activation (Pizarro et al., 1991), resulting in a steeper voltage dependence of SR calcium release than that expected from the charge movement alone. Furthermore, both orthograde and retrograde coupling between DHPRs and RyRs, based on their physical interaction, have been described (Dirksen, 2002). These, and a number of other pieces of information including, but not restricted to, whether the four S4 segments in a given DHPR would contribute equally to the activation or the four DHPRs that, it has been suggested, interact with a single RyR (Huang et al., 2011), would all participate in the activation, make the precise simulation of intramembrane charge movement and its role in the activation process problematic. However, we did not aim to describe the exact voltage dependence of the processes that were analysed here; rather, only how the size of the depolarization tends to affect them was assessed. Since no in‐depth analysis was needed, the model used here was, in our opinion, sufficient to give the necessary insight.
The simulation of the release of calcium from the SR also involved a number of simplifications. RyRs in mammalian muscle were described as being organized in a double‐row pattern where only every second calcium release channel is coupled physically to the DHPRs (Protasi, 2002). In our simulations all RyRs in a given triad were assumed to behave identically. This is an over‐simplification not only because of the above mentioned morphological arrangement, but also because the T‐tubular membrane might be differentially affected within the region of the triad giving rise to the possibility of differentially gated RyRs. It is also feasible that the pathophysiology is not restricted to the T‐tubular membrane, but the SR membrane is affected, too, which again could give rise to differentially gated channels within a given triad. Furthermore, although the regulation of the calcium release channel by calcium is included and is an essential part of the model simulations, not only are the gating schemes for both calcium‐dependent activation and inactivation simplified (see e.g. Dura et al., 2003; another model with elaborate description), but the luminal regulation of the channel (Qin et al., 2009) is not included either. However, the time course (and voltage dependence) of the simulated SR calcium release (Fig. 6) in non‐affected areas closely resembled that published earlier, confirming that the model used here reproduces the most important features of the release process, thus enabling us to conduct not only a qualitative but a quantitative comparison of measured and simulated values. Nevertheless, it should be noted that when selecting the parameters describing the activation and inactivation schemes we, while trying to use values as close to those published for the given processes, kept in mind that the final wave‐form and magnitude of SR calcium release should be as close to those measured earlier as possible.
This raises the question of the adequacy of the selection of parameters used in the model simulations. Importantly, the parameters used represent, to the best of our knowledge, the physiological values of the given processes. Even if these would be adequate to describe the physiological case, they might not be relevant for the areas with affected T‐tubules. This is substantiated by the finding that altered membrane properties critically affect the functioning of transmembrane proteins, including ion channels (Pouvreau et al., 2004). This, and the aforementioned complexity of the interaction between the molecules involved, led us to use as few adjustable parameters as possible. During the simulations only two parameters, the dimensionless parameter ρ and the parameter τ (space‐ and time‐constant parameters, respectively) describing the loss of proper conduction of the depolarization along the T‐tubules were systematically altered. They were selected for two simple reasons. First, their physiological meaning can easily be understood; namely, how far and how fast can the depolarization spread into the interior of the fibre, and, secondly, the actual changes in the electrical parameters of the T‐tubules (access resistance, transmembrane resistance, capacitance) do not need to be directly assessed. It is important to note here that the ranges tested for these parameters – from 0.2 to 5 ms and from 20 to 600 ms for ρ and τ, respectively – although seeming arbitrary, actually cover all possibilities that could occur within the fibre. Values less than 0.2 or greater than 5 for ρ would not further alter intramembrane charge movement as there was no activation at all at ρ = 0.2 or homogeneous and full activation at ρ = 5. Similarly, values greater than 600 ms for τ would not alter the outcome as no appreciable activation is seen during a depolarizing pulse already with τ = 600 ms. Altogether, the above limitations and simplifications should not compromise any of the conclusions from the simulations.
Comparison with cardiac cells
To our knowledge, MTM1 deficiency was the first reported model of skeletal muscle disease associated with stringent disruption of the T‐tubule network. In cardiac cells, there have been several reports of similar alterations, with the T‐tubule network yielding reduced density, spatial disorganization/patchy pattern, associated with heart failure (Heinzel et al., 2008; Louch et al., 2004, 2006; Lyon et al., 2009; see for review Dibb et al., 2022). In concurrence with our simulations, detachment of T‐tubules from the surface membrane in cardiac cells was shown to alter AP propagation in the disconnected portions of the network, but also in the still connected portions, due to worsened coupling with the surface membrane (Sacconi et al., 2012). Importantly, electrical properties of cardiac T‐tubules were also shown to be heavily determined by their constriction/dilatation status (Uchida & Lopatin, 2018), which is something that could also play a role in our skeletal muscle disease models. For instance, muscle fibres from the dynamin2 R465W mouse model of centronuclear myopathy do not exhibit the gross alterations of the T‐tubule network observed in MTM1‐deficient fibres. Still, they also suffer from spatial loss of SR Ca2+ release synchrony, of propagating events and of spontaneous Ca2+ sparks (Kutchukian et al., 2017). It is thus very possible that changes in the constriction or geometrical status of individual T‐tubules in that model, play a role in the Ca2+ release alterations.
The comparison with cardiac muscle is also interesting because cardiac EC coupling fully relies on Ca2+‐activated RyRs in normal conditions. Still, some qualitative hallmarks of defective Ca2+ release due to T‐tubule disorganization are similar to those in skeletal muscle, as for instance reduced synchrony due to orphaned RyRs being activated by Ca2+ released by, and diffusing from, still intact dyadic regions. Within the early steps of T‐tubule disorganization, activation of RyRs by Ca2+ in muscle fibres necessarily acts as a compensatory gain of function mechanism, allowing affected regions at immediate proximity of healthy regions to experience close to normal Ca2+ release. Of course, in the absence of compensatory reconstruction of the T‐tubule network, progression of the defects irremediably compromises EC coupling function, leading to the fatal outcome in myotubular myopathy. Strategies aimed at promoting T‐tubule reconstruction have already been considered in the cardiac context (see Dibb et al., 2022) and would certainly be of therapeutic relevance for myotubular and other forms of centronuclear myopathy.
In summary, within the framework of the present knowledge of EC coupling function, modelling the consequences of altered T‐tubular network in muscle fibres is sufficient to recapitulate the Ca2+ release defects experimentally detected in MTM1‐deficient muscle fibres. Our proposal is that that T‐tubule destruction is a leading determinant of Ca2+ release dysfunction and EC coupling failure in myotubular myopathy and, as such, should be considered a therapeutic target.
Additional information
Competing interests
The authors declare no conflict of financial and non‐financial competing interests on behalf of all authors.
Author contributions
All animal experiments were performed at Institut NeuroMyoGène, University Claude Bernard, Lyon 1. C.K. and V.J. performed the electrophysiological and confocal imaging experiments. A.B.‐B. generated the MTM1‐KO mouse. L.C., D.B. and P.S. created the model of Ca release. L.C. wrote the simulation program. L.C., P.S. and C.T. performed the simulations. D.B., P.S., L.C. and V.J. contributed to data interpretation and discussion and to critical revisions of the manuscript. All authors approved the final version of the manuscript, agree to be accountable for all aspects of the work in ensuring that questions related to the accuracy or integrity of any part of the work are appropriately investigated and resolved. All persons designated as authors qualify for authorship, and all those who qualify for authorship are listed.
Funding
This work was supported by grants from CNRS, INSERM and Université Claude Bernard ‐ Lyon 1 to Institut NeuroMyoGène (#SBCF 2018). This work was also supported by the Association Française contre les Myopathies (AFM‐Téléthon: Alliance MyoNeurALP program; project 5.3.4.4 to V. Jacquemond), and by a grant to C. Kutchukian from the Société Française de Myologie (SFM, # SBCF 2018). The research was also financed by projects to L. Csernoch no. K_137600 and TKP2020‐NKA‐04 which have been implemented with the support provided by the Ministry of Innovation and Technology of Hungary from the National Research, Development and Innovation Fund, financed under the K_21 and 2020−4.1.1‐TKP2020 funding schemes, respectively.
Author's present address
Candice Kutchukian: Department of Physiology and Membrane Biology, University of California, Davis, CA, USA.
Supporting information
Statistical Summary Document
Peer Review History
Biography
Peter Szentesi received his degree as a mathematician from the Kossuth Lajos University in Debrecen (1990) and a PhD in Physiology from the Medical University in Debrecen (1998). As a post‐doctoral fellow he spent two years in the lab of Ernst Niggli at the University of Bern in Switzerland (2002–2004) and learned the essence of calcium concentration measurements with confocal microscopy. He is a Senior Research Advisor in the Department of Physiology at the Faculty of Medicine at the University of Debrecen with a well‐recognized expertise in calcium homeostasis, force and energetics of skeletal muscle in health and in pathological conditions.

Handling Editors: Scott Powers & Christopher Sundberg
The peer review history is available in the Supporting information section of this article (https://doi.org/10.1113/JP283650#support‐information‐section).
Data availability statement
All data supporting the results are presented in the manuscript. The simulation program is available, upon reasonable request, from the corresponding author.
References
- Adrian, R. H. , Chandler, W. K. , & Hodgkin, A. L. (1969). The kinetics of mechanical activation in frog muscle. The Journal of Physiology, 204(1), 207–230. [DOI] [PMC free article] [PubMed] [Google Scholar]
- Al‐Qusairi, L. , Weiss, N. , Toussaint, A. , Berbey, C. , Messaddeq, N. , Kretz, C. , Sanoudou, D. , Beggs, A. H. , Allard, B. , Mandel, J. L. , Laporte, J. , Jacquemond, V. , & Buj‐Bello, A. (2009). T‐tubule disorganization and defective excitation‐contraction coupling in muscle fibres lacking myotubularin lipid phosphatase. Proceedings National Academy of Science USA, 106(44), 18763–18768. [DOI] [PMC free article] [PubMed] [Google Scholar]
- Annoussamy, M. , Lilien, C. , Gidaro, T. , Gargaun, E. , Chê, V. , Schara, U. , Gangfuß, A. , D'Amico, A. , Dowling, J. J. , Darras, B. T. , Daron, A. , Hernandez, A. , de Lattre, C. , Arnal, J. M. , Mayer, M. , Cuisset, J. M. , Vuillerot, C. , Fontaine, S. , Bellance, R. , …, Servais, L. (2019). X‐linked myotubular myopathy: A prospective international natural history study. Neurology, 92(16), e1852‐e1867. [DOI] [PMC free article] [PubMed] [Google Scholar]
- Baylor, S. M. , & Hollingworth, S. (2011). Calcium indicators and calcium signalling in skeletal muscle fibres during excitation‐contraction coupling. Progress in Biophysics and Molecular Biology, 105(3), 162–179. [DOI] [PMC free article] [PubMed] [Google Scholar]
- Bodnar, D. , Geyer, N. , Ruzsnavszky, O. , Olah, T. , Hegyi, B. , Sztretye, M. , Fodor, J. , Dienes, B. , Balogh, A. , Papp, Z. , Szabo, L. , Muller, G. , Csernoch, L. , & Szentesi, P. (2014). Hypermuscular mice with mutation in the myostatin gene display altered calcium signalling. The Journal of Physiology, 592(6), 1353–1365. [DOI] [PMC free article] [PubMed] [Google Scholar]
- Brum, B. , & Ríos, E. (1987). Intramembrane charge movement in frog skeletal muscle fibres. Properties of charge 2. The Journal of Physiology, 387(1), 489–517. [DOI] [PMC free article] [PubMed] [Google Scholar]
- Buj‐Bello, A. , Laugel, V. , Messaddeq, N. , Zahreddine, H. , Laporte, J. , Pellissier, J. F. , & Mandel, J. L. (2002). The lipid phosphatase myotubularin is essential for skeletal muscle maintenance but not for myogenesis in mice. Proceedings National Academy of Science USA, 99(23), 15060–15065. [DOI] [PMC free article] [PubMed] [Google Scholar]
- Collet, C. , Csernoch L., & Jacquemond V. (2003). Intramembrane charge movement and L‐type calcium current in skeletal muscle fibres isolated from control and mdx mice. Biophysical Journal, 84(1), 251–265. [DOI] [PMC free article] [PubMed] [Google Scholar]
- Cully, T. R. , Edwards, J. N. , & Launikonis, B. S. (2014). Activation and propagation of Ca2+ release from inside the sarcoplasmic reticulum network of mammalian skeletal muscle. The Journal of Physiology, 592(17), 3727–3746. [DOI] [PMC free article] [PubMed] [Google Scholar]
- Dibb, K. M. , Louch, W. E. , & Trafford, A. W. (2022). Cardiac transverse tubules in physiology and heart failure. Annual Review of Physiology, 84(1), 229–255. [DOI] [PubMed] [Google Scholar]
- Dirksen, R. T. (2002). Bi‐directional coupling between dihydropyridine receptors and ryanodine receptors. Frontiers in Bioscience, 7(1–3), d659–d670. [DOI] [PubMed] [Google Scholar]
- Donahue, B. S. , & Abercrombie, R. F. (1987). Free diffusion coefficient of ionic calcium in cytoplasm. Cell Calcium, 8(6), 437–448. [DOI] [PubMed] [Google Scholar]
- Dura, M. , Zahradník, I. , & Zahradníková, A. (2003). Kinetics of cardiac RyR channel gating studied at high temporal resolution. Physiological Research, 52, 571–578. [PubMed] [Google Scholar]
- Endo, M. (2009). Calcium‐induced calcium release in skeletal muscle. Physiological Reviews, 89(4), 1153–1176. [DOI] [PubMed] [Google Scholar]
- Ferreira Gregorio, J. , Pequera G., Manno C., Ríos E., & Brum G. (2017). The voltage sensor of excitation‐contraction coupling in mammals: Inactivation and interaction with Ca2+ . Journal of General Physiology, 149(11), 1041–1058. [DOI] [PMC free article] [PubMed] [Google Scholar]
- Figueroa, L. , Shkryl, V. M. , Zhou, J. , Manno, C. , Momotake, A. , Brum, G. , Blatter, L. A. , Ellis‐Davies, G. C. R. , & Ríos, E. (2012). Synthetic localized calcium transients directly probe signalling mechanisms in skeletal muscle. The Journal of Physiology, 590(6), 1389–1411. [DOI] [PMC free article] [PubMed] [Google Scholar]
- Fleischer, S. , Ogunbunmi, E. M. , Dixon, M. C. , & Fleer, E. A. (1985). Localization of Ca2+ release channels with ryanodine in junctional terminal cisternae of sarcoplasmic reticulum of fast skeletal muscle. Proceedings National Academy of Science USA, 82(21), 7256–7259. [DOI] [PMC free article] [PubMed] [Google Scholar]
- Flucher, B. E. , & Franzini‐Armstrong, C. (1996). Formation of junctions involved in excitation‐contraction coupling in skeletal and cardiac muscle. Proceedings National Academy of Science USA, 93(15), 8101–8106. [DOI] [PMC free article] [PubMed] [Google Scholar]
- Franzini‐Armstrong, C. (1991). Simultaneous maturation of transverse tubules and sarcoplasmic reticulum during muscle differentiation in the mouse. Developmental Biology, 146(2), 353–363. [DOI] [PubMed] [Google Scholar]
- Gómez‐Oca, R. , Cowling, B. S. , & Laporte, J. (2021). Common pathogenic mechanisms in centronuclear and myotubular myopathies and latest treatment advances. International Journal of Molecular Sciences, 22(21), 11377. [DOI] [PMC free article] [PubMed] [Google Scholar]
- Györke, I. , & Györke, S. (1998). Regulation of the cardiac ryanodine receptor channel by luminal Ca2+ involves luminal Ca2+ sensing sites. Biophysical Journal, 75(6), 2801–2810. [DOI] [PMC free article] [PubMed] [Google Scholar]
- Heinzel, F. R. , Bito, V. , Biesmans, L. , Wu, M. , Detre, E. , von Wegner, F. , Claus, P. , Dymarkowski, S. , Maes, F. , Bogaert, J. , Rademakers, F. , D'hooge, J. , & Sipido, K. (2008). Remodeling of T‐tubules and reduced synchrony of Ca2+ release in myocytes from chronically ischemic myocardium. Circulation Research, 102(3), 338–346. [DOI] [PubMed] [Google Scholar]
- Hernández‐Ochoa, E. O. , & Schneider, M. F. (2018). Voltage sensing mechanism in skeletal muscle excitation‐contraction coupling: Coming of age or midlife crisis? Skelet Muscle, 8(1), 22. [DOI] [PMC free article] [PubMed] [Google Scholar]
- Huang, C. L. (1991). Separation of intramembrane charging components in low‐calcium solutions in frog skeletal muscle. Journal of General Physiology, 98(2), 249–263. [DOI] [PMC free article] [PubMed] [Google Scholar]
- Huang, C. L. , Pedersen, T. H. , & Fraser, J. A. (2011). Reciprocal dihydropyridine and ryanodine receptor interactions in skeletal muscle activation. Journal of Muscle Research and Cell Motility, 32(3), 171–202. [DOI] [PubMed] [Google Scholar]
- Huntoon, V. , Widrick, J. J. , Sanchez, C. , Rosen, S. M. , Kutchukian, C. , Cao, S. , Pierson, C. R. , Liu, X. , Perrella, M. A. , Beggs, A. H. , Jacquemond, V. , & Agrawal, P. B. (2018). SPEG‐deficient skeletal muscles exhibit abnormal triad and defective calcium handling. Human Molecular Genetics, 27(9), 1608–1617. [DOI] [PMC free article] [PubMed] [Google Scholar]
- Jacquemond, V. (1997). lndo‐1 Fluorescence signals elicited by membrane depolarization in enzymatically isolated mouse skeletal muscle fibres. Biophysical Journal, 73(2), 920–928. [DOI] [PMC free article] [PubMed] [Google Scholar]
- Kutchukian, C. , Lo Scrudato, M. , Tourneur, Y. , Poulard, K. , Vignaud, A. , Berthier, C. , Allard, B. , Lawlor, M. W. , Buj‐Bello, A. , & Jacquemond, V. (2016). Phosphatidylinositol 3‐kinase inhibition restores Ca2+ release defects and prolongs survival in myotubularin‐deficient mice. Proceedings National Academy of Science USA, 113(50), 14432–14437. [DOI] [PMC free article] [PubMed] [Google Scholar]
- Kutchukian, C. , Szentesi, P. , Allard, B. , Trochet, D. , Beuvin, M. , Berthier, C. , Tourneur, Y. , Guicheney, P. , Csernoch, L. , Bitoun, M. , & Jacquemond, V. (2017). Impaired excitation‐contraction coupling in muscle fibres from the dynamin2R465W mouse model of centronuclear myopathy. The Journal of Physiology, 595(24), 7369–7382. [DOI] [PMC free article] [PubMed] [Google Scholar]
- Kutchukian, C. , Szentesi, P. , Buj‐Bello, A. , Csernoch, L. , Allard, B. , & Jacquemond, V. (2019). Ca2+‐induced sarcoplasmic reticulum Ca2+ release in myotubularin‐deficient muscle fibres. Cell Calcium, 80, 91–100. [DOI] [PubMed] [Google Scholar]
- Launikonis, B. S. , & Stephenson, D. G. (2004). Osmotic properties of the sealed tubular system of toad and rat skeletal muscle. Journal of General Physiology, 123(3), 231–247. [DOI] [PMC free article] [PubMed] [Google Scholar]
- Lawal, T. A. , Todd, J. J. , & Meilleur, K. G. (2018). Ryanodine receptor 1‐related myopathies: Diagnostic and therapeutic approaches. Neurotherapeutics, 15(4), 885–899. [DOI] [PMC free article] [PubMed] [Google Scholar]
- Louch, W. E. , Bito, V. , Heinzel, H. R. , Macianskiene, R. , Vanhaecke, J. , Flameng, W. , Mubagwa, K. , & Sipido, K. R. (2004). Reduced synchrony of Ca2+ release with loss of T‐tubules‐a comparison to Ca2+ release in human failing cardiomyocytes. Cardiovascular Research, 62(1), 63–73. [DOI] [PubMed] [Google Scholar]
- Louch W. E., Mørk, H. K. , Sexton, J. , Strømme, T. A. , Laake, P. , Sjaastad, I. , & Sejersted O. M. (2006). T‐tubule disorganization and reduced synchrony of Ca2+ release in murine cardiomyocytes following myocardial infarction. The Journal of Physiology, 574, 519–533. [DOI] [PMC free article] [PubMed] [Google Scholar]
- Lyon, A. R. , MacLeod, K. T. , Zhang, Y. , Garcia, E. , Kikonda Kanda, G. , Lab, M. J. , Korchev, Y. E. , Harding, S. E. , & Gorelik, J. (2009). Loss of T‐tubules and other changes to surface topography in ventricular myocytes from failing human and rat heart. Proceedings National Academy of Science USA, 106(16), 6854–6859. [DOI] [PMC free article] [PubMed] [Google Scholar]
- Marks, A. R. , Tempst, P. , Hwang, K. S. , Taubman, M. B. , Inui, M. , Chadwick, C. , Fleischer, S. , & Nadal‐Ginard, B. (1989). Molecular cloning and characterization of the ryanodine receptor/junctional channel complex cDNA from skeletal muscle sarcoplasmic reticulum. Proceedings National Academy of Science USA, 86(22), 8683–8687. [DOI] [PMC free article] [PubMed] [Google Scholar]
- Melzer, W. , Ríos, E. , & Schneider, M. F. (1986). The removal of myoplasmic free calcium following calcium release in frog skeletal muscle. The Journal of Physiology, 372(1), 261–292. [DOI] [PMC free article] [PubMed] [Google Scholar]
- Ogawa, H. , Kurebayashi, N. , Yamazawa, T. , & Murayama, T. (2021). Regulatory mechanisms of ryanodine receptor/Ca2+ release channel revealed by recent advancements in structural studies. Journal of Muscle Research and Cell Motility, 42(2), 291–304. [DOI] [PMC free article] [PubMed] [Google Scholar]
- Pierantozzi, E. , Szentesi, P. , Al‐Gaadi, D. , Oláh, T. , Dienes, B. , Sztretye, M. , Rossi, D. , Sorrentino, V. , & Csernoch, L. (2019). Calcium homeostasis is modified in skeletal muscle fibres of small Ankyrin1 knockout mice. International Journal of Molecular Sciences, 20(13), 3361. [DOI] [PMC free article] [PubMed] [Google Scholar]
- Pizarro, G. , Csernoch, L. , Uribe, I. , Rodríguez, M. , & Ríos, E. (1991). The relationship between Q gamma and Ca release from the sarcoplasmic reticulum in skeletal muscle. Journal of General Physiology, 97(5), 913–947. [DOI] [PMC free article] [PubMed] [Google Scholar]
- Posterino G. S., Lamb G. D. & Stephenson D. G. (2000). Twitch and tetanic force responses and longitudinal propagation of action potentials in skinned skeletal muscle fibres of the rat. The Journal of Physiology, 527, 131–137. [DOI] [PMC free article] [PubMed] [Google Scholar]
- Pouvreau, S. , Berthier, C. , Blaineau, S. , Amsellem, J. , Coronado, R. , & Strube, C. (2004). Membrane cholesterol modulates dihydropyridine receptor function in mice fetal skeletal muscle cells. The Journal of Physiology, 555(2), 365–381. [DOI] [PMC free article] [PubMed] [Google Scholar]
- Protasi, F. (2002). Structural interaction between RYRs and DHPRs in calcium release units of cardiac and skeletal muscle cells. Frontiers in Bioscience, 7(4), d650–d658. [DOI] [PubMed] [Google Scholar]
- Ríos, E. , & Pizarro, G. (1991). Voltage sensor of excitation–contraction coupling in skeletal muscle. Physiological Reviews, 71(3), 849–908. [DOI] [PubMed] [Google Scholar]
- Ríos, E. , Pizarro, G. , & Stefani, E. (1992). Charge movement and the nature of signal transduction in skeletal muscle excitation‐contraction coupling. Annual Review of Physiology, 54(1), 109–133. [DOI] [PubMed] [Google Scholar]
- Ríos, E. (2018). Calcium‐induced release of calcium in muscle: 50 years of work and the emerging consensus. Journal of General Physiology, 150(4), 521–537. [DOI] [PMC free article] [PubMed] [Google Scholar]
- Rodríguez, E. G. , Lefebvre, R. , Bodnár, D. , Legrand, C. , Szentesi, P. , Vincze, J. , Poulard, K. , Bertrand‐Michel, J. , Csernoch, L. , Buj‐Bello, A. , & Jacquemond, V. (2014) Phosphoinositide substrates of myotubularin affect voltage‐activated Ca2⁺ release in skeletal muscle. Pflugers Archiv: European Journal of Physiology, 466(5), 973–985. [DOI] [PubMed] [Google Scholar]
- Qin, J. , Valle, G. , Nani, A. , Chen, H. , Ramos‐Franco, J. , Nori, A. , Volpe, P. , & Fill, M. (2009). Ryanodine receptor luminal Ca2+ regulation: Swapping calsequestrin and channel isoforms. Biophysical Journal, 97(7), 1961–1970. [DOI] [PMC free article] [PubMed] [Google Scholar]
- Sacconi, L. , Ferrantini, C. , Lotti, J. , Coppini, R. , Yan, P. , Loew, L. M. , Tesi, C. , Cerbai, E. , Poggesi, C. , & Pavone, F. S. (2012). Action potential propagation in transverse‐axial tubular system is impaired in heart failure. Proceedings National Academy of Science USA, 109(15), 5815–5819. [DOI] [PMC free article] [PubMed] [Google Scholar]
- Sárközi, S. , Szentesi, P. , Jona, I. , & Csernoch, L. (1996). Effects of cardiac glycosides on excitation‐contraction coupling in frog skeletal muscle fibres. The Journal of Physiology, 495(3), 611–626. [DOI] [PMC free article] [PubMed] [Google Scholar]
- Sárközi, S. , Szegedi, C. , Szentesi, P. , Csernoch, L. , Kovács, L. , & Jóna, I. (2000). Regulation of the rat sarcoplasmic reticulum calcium release channel by calcium. Journal of Muscle Research and Cell Motility, 21(2), 131–138. [DOI] [PubMed] [Google Scholar]
- Schneider, M. F. , & Simon B. J. (1988). Inactivation of calcium release from the sarcoplasmic reticulum in frog skeletal muscle. The Journal of Physiology, 405(1), 727–745. [DOI] [PMC free article] [PubMed] [Google Scholar]
- Schneider, M. F. (1994). Control of calcium release in functioning skeletal muscle fibres. Annual Review of Physiology, 56(1), 463–484. [DOI] [PubMed] [Google Scholar]
- Shirokova, N. , Shirokov, R. , Rossi, D. , Gonzalez, A. , Kirsch, W. G. , Garcia, J. , Sorrentino, V. , & Ríos, E. (1999). Spatially segregated control of Ca2+ release in developing skeletal muscle of mice. The Journal of Physiology, 521(2), 483–495. [DOI] [PMC free article] [PubMed] [Google Scholar]
- Silva‐Rojas, R. , Nattarayan, V. , Jaque‐Fernandez, F. , Gomez‐Oca, R. , Menuet, A. , Reiss, D. , Goret, M. , Messaddeq, N. , Lionello, V. M. , Kretz, C. , Cowling, B. S. , Jacquemond, V. , & Laporte, J. (2022). Mice with muscle‐specific deletion of Bin1 recapitulate centronuclear myopathy and acute downregulation of dynamin 2 improves their phenotypes. Molecular Therapy, 30(2), 868–880. [DOI] [PMC free article] [PubMed] [Google Scholar]
- Sorrentino, V. , & Volpe, P. (1993). Ryanodine receptors: How many, where and why? Trends in Pharmacological Sciences, 14(3), 98–103. [DOI] [PubMed] [Google Scholar]
- Sultana, N. , Dienes, B. , Benedetti, A. , Tuluc, P. , Szentesi, P. , Sztretye, M. , Rainer, J. , Hess, M. W. , Schwarzer, C. , Obermair, G. J. , Csernoch, L. , & Flucher, B. E. (2016). Restricting calcium currents is required for correct fibre type specification in skeletal muscle. Development (Cambridge, England), 143, 1547–1559. [DOI] [PMC free article] [PubMed] [Google Scholar]
- Szücs, G. , Csernoch, L. , Magyar, J. , & Kovács, L. (1991). Contraction threshold and the “hump” component of charge movement in frog skeletal muscle. Journal of General Physiology, 97(5), 897–911. [DOI] [PMC free article] [PubMed] [Google Scholar]
- Uchida, K. , & Lopatin, A. N. (2018). Diffusional and electrical properties of T‐tubules are governed by their constrictions and dilations. Biophysical Journal, 114(2), 437–449. [DOI] [PMC free article] [PubMed] [Google Scholar]
- Wang, X. , Weisleder, N. , Collet, C. , Zhou, J. , Chu, Y. , Hirata, Y. , Zhao, X. , Pan, Z. , Brotto, M. , Cheng, H. , & Ma, J. (2005). Uncontrolled calcium sparks act as a dystrophic signal for mammalian skeletal muscle. Nature Cell Biology, 7(5), 525–530. [DOI] [PubMed] [Google Scholar]
- Wier, W. G. , & Blatter, L. A. (1991). Ca2+‐oscillations and Ca2+‐waves in mammalian cardiac and vascular smooth muscle cells. Cell Calcium, 12(2–3), 241–254. [DOI] [PubMed] [Google Scholar]
- Williams, D. A. , Head, S. I. , Bakker, A. J. , & Stephenson, D. G. (1990). Resting calcium concentrations in isolated skeletal muscle fibres of dystrophic mice. The Journal of Physiology, 428(1), 243–256. [DOI] [PMC free article] [PubMed] [Google Scholar]
- Yang, D. , Pan, Z. , Takeshima, H. , Wu, C. , Nagaraj, R. Y. , Ma, J. , & Cheng, H. (2001). RyR3 amplifies RyR1‐mediated Ca2+‐induced Ca2+ release in neonatal mammalian skeletal muscle. Journal of Biological Chemistry, 276(43), 40210–40214. [DOI] [PubMed] [Google Scholar]
- Zhou, J. , Brum, G. , Gonzalez, A. , Launikonis, B. S. , Stern, M. D. , & Ríos, E. (2005). Concerted vs. sequential. Two activation patterns of vast arrays of intracellular Ca2+ channels in muscle. Journal of General Physiology, 126(4), 301–309. [DOI] [PMC free article] [PubMed] [Google Scholar]
- Ziman, A. P. , Ward, C. W. , Rodney, G. G. , Lederer, W. J. , & Bloch, R. J. (2010). Quantitative measurement of Ca2+ in the sarcoplasmic reticulum lumen of mammalian skeletal muscle. Biophysical Journal, 99(8), 2705–2714. [DOI] [PMC free article] [PubMed] [Google Scholar]
Associated Data
This section collects any data citations, data availability statements, or supplementary materials included in this article.
Supplementary Materials
Statistical Summary Document
Peer Review History
Data Availability Statement
All data supporting the results are presented in the manuscript. The simulation program is available, upon reasonable request, from the corresponding author.