Abstract
Pancreatic ductal adenocarcinoma (PDAC) cells maintain a high level of autophagy, allowing them to thrive in an austere microenvironment. However, the processes through which autophagy promotes PDAC growth and survival are still not fully understood. Here, we show that autophagy inhibition in PDAC alters mitochondrial function by losing succinate dehydrogenase complex iron sulfur subunit B expression by limiting the availability of the labile iron pool. PDAC uses autophagy to maintain iron homeostasis, while other tumor types assessed require macropinocytosis, with autophagy being dispensable. We observed that cancer-associated fibroblasts can provide bioavailable iron to PDAC cells, promoting resistance to autophagy ablation. To overcome this cross-talk, we used a low-iron diet and demonstrated that this augmented the response to autophagy inhibition therapy in PDAC-bearing mice. Our work highlights a critical link between autophagy, iron metabolism, and mitochondrial function that may have implications for PDAC progression.
Autophagy supports PDAC growth by maintaining mitochondrial function through regulating iron metabolism.
INTRODUCTION
Pancreatic ductal adenocarcinoma (PDAC), representing more than 95% of pancreatic cancers, is highly resistant to therapy and has a low 5-year survival rate (11%) for all stages of the disease combined (1). By 2030, it is expected to account for the second highest number of cancer-related deaths in the United States (1, 2). PDAC tumors are characterized by a harsh tumor microenvironment (TME) that is hypoperfused, altered in nutrient availability, and hypoxic. To survive in this hostile TME, PDAC cells reprogram their metabolic needs and rely on nutrient scavenging mechanisms such as macroautophagy (hereafter referred to as autophagy) and macropinocytosis. More than a decade ago, we demonstrated that PDAC tumors have high basal levels of autophagy and rely on this process to survive and grow (3). Since then, our understanding of the role of autophagy in PDAC has evolved substantially. Through different models, we and others have identified the pleiotropic, tumor cell intrinsic and extrinsic roles of autophagy in PDAC (4–6). However, the molecular substrates that autophagy provides under environmental stress are poorly understood. The use of hydroxychloroquine (HCQ) to inhibit autophagy as a monotherapy to target autophagy in PDAC has been tested, but the efficacy has been limited. In contrast, combining chemotherapy with HCQ in patients with PDAC has shown an improved response to therapy (7). Therefore, dissecting the molecular substrates that autophagy provides in the complex PDAC TME could have clinical ramifications by informing more effective therapeutic combinations.
Our previous research has demonstrated that ferritinophagy, a type of selective autophagy, is critical for maintaining iron homeostasis (8). In addition, some reports have shown a vital role of the lysosome in maintaining iron homeostasis (9–11). Here, we provide evidence that autophagy is essential to preserving the labile iron pool (LIP) (Fe2+) in PDAC cells. Depletion of LIPs through autophagy/lysosomal inhibition resulted in growth defects and mitochondrial dysfunction. We demonstrate that autophagy inhibition reduces the assembly of iron-sulfur (Fe-S) clusters (ISCs) via ISC assembly 1 (ISCA1). ISCs are inorganic cofactors necessary to stabilize various proteins, including several involved in the electron transfer chain, such as succinate dehydrogenase complex iron sulfur subunit B (SDHB). The reduction of SDHB in PDAC cells upon autophagy inhibition led to a decrease in mitochondrial respiration and a reorganization of cristae microarchitecture. Supplementation of iron or ectopic expression of SDHB or ISCA1 was sufficient to rescue growth and the mitochondria defects in the setting of deficient autophagy. Last, we demonstrate that restoration of iron homeostasis by tumor-stroma cross-talk is a critical resistance mechanism of autophagy inhibition in PDAC and that iron deprivation sensitizes PDAC tumors to autophagy/lysosomal inhibition in syngeneic mouse models.
RESULTS
Autophagy inhibition decreases SDHB by limiting bioavailable iron in PDAC
We have previously shown that loss of autophagy in PDAC leads to a decrease in mitochondrial oxygen consumption rate (OCR) (3), but the mechanism of this impairment remained unknown. Our prior work also demonstrated that most amino acid pools were relatively unaltered upon autophagy inhibition, with the exception of cysteine, which decreased significantly (12). Supplementing PDAC cells with cysteine could not rescue the OCR defect upon autophagy inhibition (fig. S1A) and, metabolic profiling did not demonstrate global decreases in TCA metabolite pool sizes upon loss of autophagy (fig. S1, B and C). Together, these data suggest that inhibition of autophagy was not limiting the necessary substrates to support the TCA cycle but may more directly affect mitochondrial function.
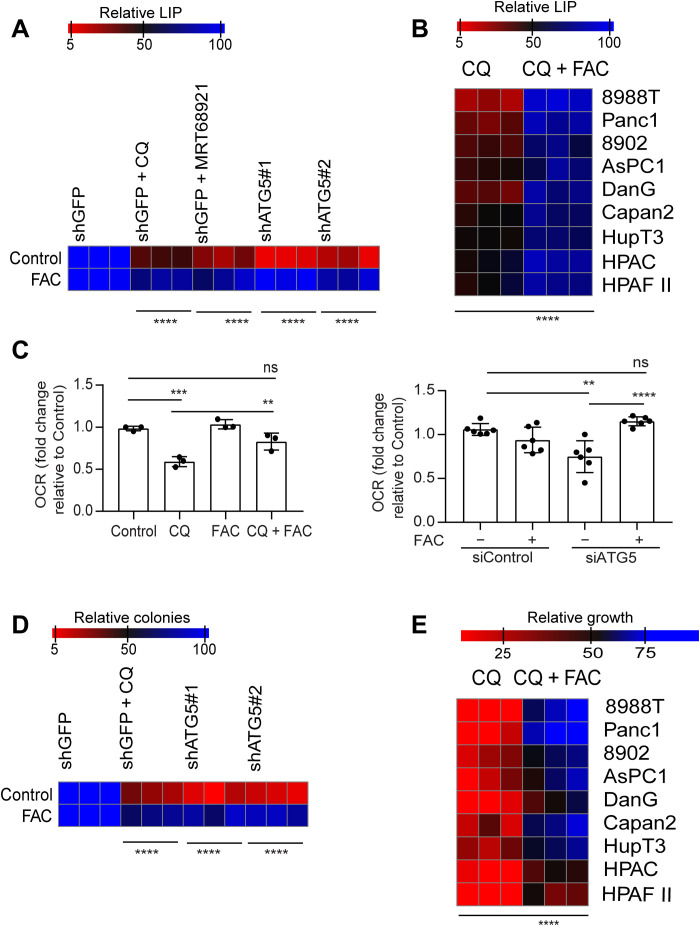
Our prior work has shown that autophagy has a critical role in iron homeostasis through a form of selective autophagy termed ferritinophagy (8). We demonstrate that ferritinophagy represents the major route for the maintenance of the bioavailable LIP in PDAC (fig. S1, D and E). Given the importance of ISC proteins in mitochondrial function, we hypothesized that a drop in the LIP upon autophagy inhibition was responsible for the decreased mitochondrial respiration. We found that genetic or pharmacological inhibition of autophagy led to a notable decrease in the LIP, which could be restored upon ferric ammonium citrate (FAC) supplementation (Fig. 1, A and B). Supplementation of FAC could also rescue the drop in OCR observed in PDAC cells where autophagy was inhibited through pharmacological or genetic means (Fig. 1C).
Fig. 1. Autophagy inhibition leads to a drop in the LIP in PDAC.
(A) Autophagy was inhibited genetically or pharmacologically in PDAC cells, and the relative LIP was determined after cotreatment with FAC in 8988T cells. (B) Chloroquine (CQ)–mediated drop in LIP was rescued by FAC in the indicated PDAC cell lines. (C) OCR rescue after FAC cotreatment in CQ-treated or ATG5-knockdown PDAC cells. Heatmaps showing clonogenic assays (D) in PDAC cells and relative proliferation in a panel of PDAC cell lines after treatment with FAC in autophagy-inhibited cells. Data are means ± SD, and P values were quantified using two-way analysis of variance (ANOVA) with Sidak’s multiple comparison’s test (for A, B, D, and E) and one-way ANOVA with Tukey’s post hoc test (for C). **P < 0.01, ***P < 0.001, and ****P < 0.0001 were considered as significant. The heatmaps (A, B, D, and E) as well as OCR data of siATG5 panel (C) are representative of one experiment repeated n = 3 (for heatmaps) and 2 (for OCR) times, respectively, while the OCR data of CQ experiment panel in (C) are combined data from n = 3 experiments. Heatmaps are indicating values in % by considering control as 100.
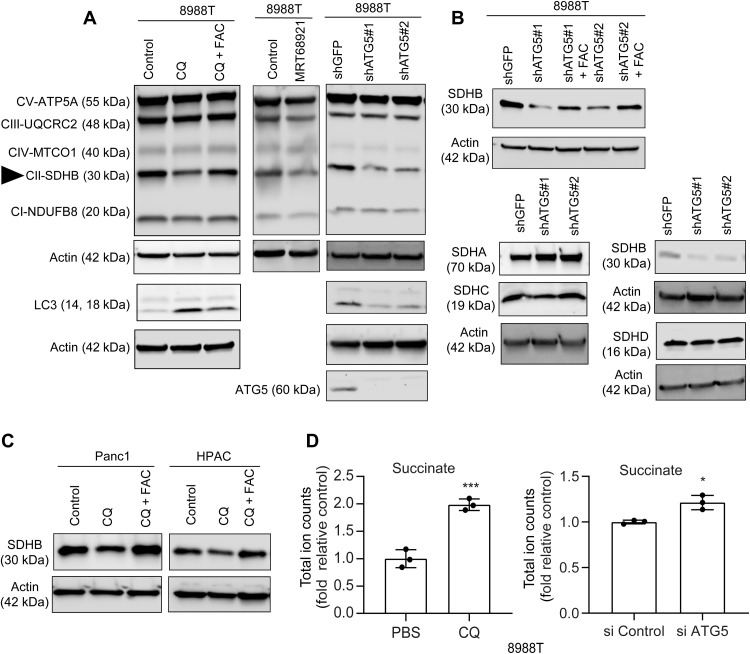
In addition, we observed that FAC could potently rescue the clonogenic growth and proliferation in autophagy-inhibited cells (Fig. 1, D and E). To further investigate the effect of autophagy inhibition on oxidative phosphorylation (OXPHOS), we assessed the level of OXPHOS complexes (I to V) after autophagy inhibition. We observed that, of five complexes, only complex II, specifically SDHB, was reduced after the loss of autophagy in PDAC (Fig. 2, A to C). Consistent with it being an Fe-S cluster protein, we found that loss of cystine or chelation of iron abrogates SDHB expression (fig. S2A). As loss of autophagy in PDAC also leads to drop in cysteine levels (12), we analyzed whether supplementation of N-acetyl cysteine (NAC) in autophagy-inhibited cells could rescue effects on SDHB expression. Intriguingly, we found that NAC could not rescue the decrease in SDHB levels upon autophagy inhibition (fig. S2B), while iron supplementation could significantly restore SDHB levels. Together, this suggests that it is iron that is rate-limiting. The biogenesis and turnover of SDHB involves Fe-S cluster synthesis with a cascade of proteins acting as scaffolds. Analysis of Fe-S containing and Fe-S cluster proteins, including those in both the mitochondrial and cytoplasmic compartments (fig. S3 and table S1), demonstrated a relative selectivity of which were affected by autophagy loss, with SDHB among the most down-regulated. The decrease in SDHB upon autophagy inhibition corresponded with an accumulation of succinate pool size, confirming functional loss of the protein (Fig. 2D).
Fig. 2. Autophagy inhibition abrogates SDHB level in PDAC.
Pharmacological (A) or genetic (B) inhibition of autophagy in PDAC cells was cotreated with FAC for 24 hours followed by immunoblots for the indicated proteins. SDHB is pointed out using a triangle. Similar to (A), other PDAC cell lines were used for analyzing SDHB level in (C) followed by total ion counts of succinate in PDAC cells using liquid chromatography–mass spectrometry (n = 3 technical replicates) after autophagy inhibition (D). Data are means ± SD, and P values were quantified using unpaired Student’s two tailed t test. *P < 0.05 and ***P < 0.001 were considered as significant.
Loss of autophagy causes defects in mitochondrial architecture
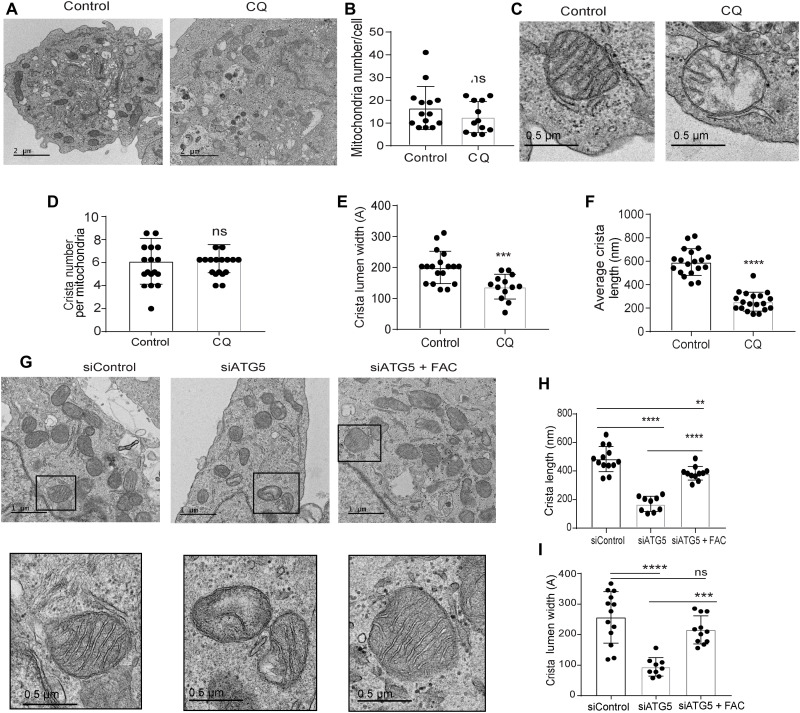
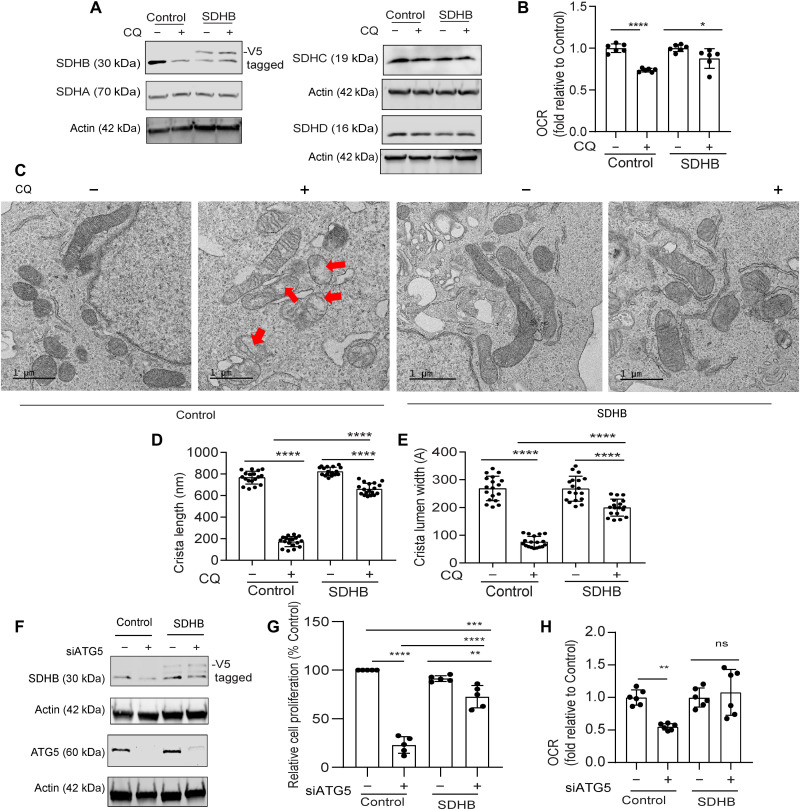
In line with our previous data (3), transmission electron microscopy (TEM) analysis revealed that there is no alteration in mitochondrial number after chloroquine (CQ) treatment (Fig. 3, A and B). Given the known contribution of SDHB in controlling the mitochondrial ultrastructure in pathological conditions like Carney triad syndrome (13), we investigated the mitochondrial architecture using TEM of autophagy-deficient PDAC cells. Notably, we observed that CQ treatment resulted in a significant reduction in mitochondrial crista lumen width and length (Fig. 3, C to F). This resulted in an accumulation of large vacant spaces inside the mitochondria, which are typical characteristics of impaired function (Fig. 3C). Genetic inhibition of autophagy demonstrated similar findings (Fig. 3, G to I). Autophagy inhibition in PDAC cells that ectopically overexpressed SDHB not only prevented the marked fall in SDHB levels (Fig. 4A) but also rescued the decrease in OCR (Fig. 4B). Moreover, mitochondrial ultrastructure analysis revealed that ectopic expression of SDHB in autophagy-inhibited cells could restore the cristae microarchitecture (Fig. 4, C to E). SDHB overexpression also showed significant rescue in proliferation and OCR upon autophagy inhibition (Fig. 4, F to H, and fig. S2C).
Fig. 3. Loss of autophagy impairs mitochondrial microarchitecture in PDAC.
(A) Representative TEM images of PDAC cells treated with PBS (Control) or CQ followed by determining their (B) mitochondrial number per cell (Control, n = 14; CQ, n = 12 cells). (C) A magnified section of a PDAC cell showing mitochondrial ultrastructure after CQ treatment followed by quantification of (D) crista number per mitochondria (n = 17 unique crista for both Control and CQ), (E) crista lumen width (Control, n = 18; CQ, n = 13 unique crista), and (F) crista length (n = 19 unique crista for both Control and CQ). (G) Representative TEM images of ATG5-knockdown PDAC cells with or without FAC treatment were quantified for (H) crista length and (I) crista lumen width (siControl, n = 13; siATG5, n = 9; siATG5 + FAC, n = 11 unique crista). Black boxes were digitally zoomed in to highlight the morphology of typical dysfunctional mitochondria. Random TEM image of mitochondria was blindly acquired and quantified. Data are means ± SD, and P values were quantified using one-way ANOVA with Tukey’s post hoc test. **P < 0.01, ***P < 0.001, and ****P < 0.0001 were considered as significant.
Fig. 4. Ectopic SDHB rescues the mitochondrial dysfunction upon autophagy inhibition in PDAC.
PDAC cells expressing SDHB and control vector were treated with CQ followed by immunoblotting for the indicated proteins (A) and analyzed for (B) OCR (combined data from n = 2 experiments). (C) Representative TEM images of cells are shown in situation similar to (A) followed by mitochondrial crista length (D; n = 18 unique cristae for all groups) and lumen width (E; n = 18 unique cristae for all groups) determination. Red arrows in (C) indicate the typical dysfunctional mitochondria. ATG5 was suppressed in SDHB overexpression and control PDAC cells for immunoblotting of indicated proteins (F). Under conditions similar to (F), cell proliferation (G; combined data of n = 5 experiment) and OCR was determined (H; combined data of n = 2 experiments). Data are means ± SD, and P values were quantified using one-way ANOVA with Tukey’s post hoc test. *P < 0.05, **P < 0.01, ***P < 0.001, and ****P < 0.0001 were considered as significant.
Autophagy sustains SDHB expression by regulating ISCA1 levels
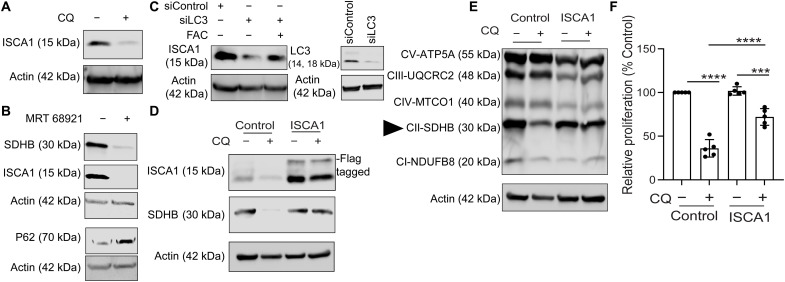
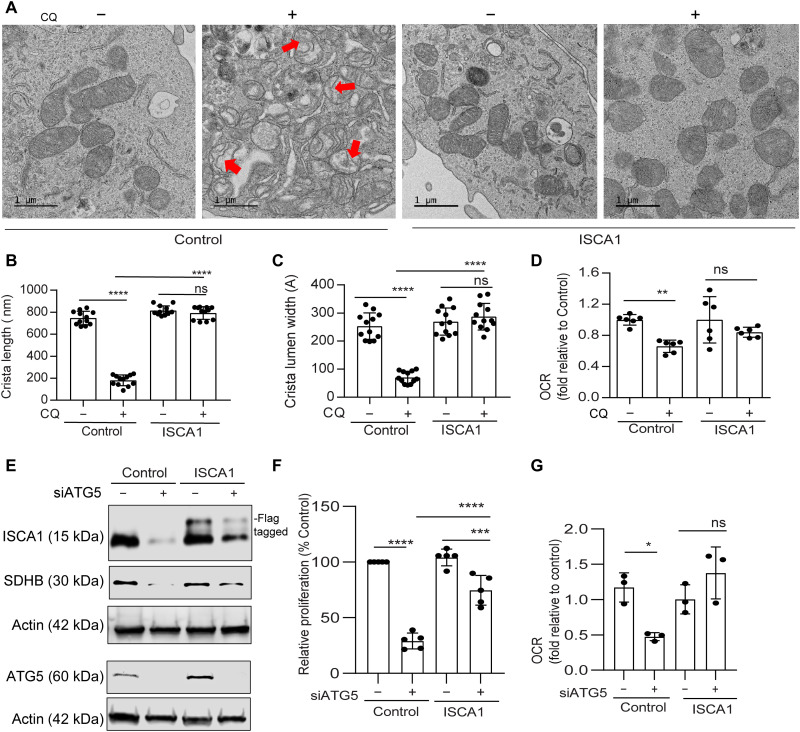
We next investigated the mechanism by which SDHB levels are regulated upon loss of autophagy in PDAC. In this regard, the ISCA1 protein is shown to play an important role in biogenesis of Fe-S proteins like SDHB (14, 15). Loss of autophagy in PDAC showed a strong reduction of ISCA1 that could be rescued by FAC supplementation (Fig. 5, A to C). Overexpression of ISCA1 in PDAC cells restored SDHB levels and proliferation upon inhibition of autophagy (Fig. 5, D to F). Mitochondrial ultrastructure studies by TEM analysis revealed that ISCA1-overexpressing cells also rescued the cristae ultrastructure (Fig. 6, A to C), as well as prevented a decrease in OCR and proliferation when autophagy was inhibited in these cells (Fig. 6, D to G).
Fig. 5. Autophagy maintains SDHB expression by regulating ISCA1.
PDAC cells were treated with CQ (A) or MRT-68921 (ULK inhibitor) (B), and the indicated proteins were analyzed by immunoblotting. (C) ISCA1 levels were determined after FAC cotreatment of PDAC cells with siRNAs against LC3. Immunoblot for LC3 was done to detect quality of knockdown as shown in the right panel. PDAC cells overexpressing ISCA1 or control vector were treated with CQ followed by immunoblotting for the indicated proteins in (D) and (E) followed by analyzing their relative cell proliferation (F; combined data of n = 5 experiments). SDHB is indicated in (E) using a triangle. Data are means ± SD, and P values were quantified using one-way ANOVA with Tukey’s post hoc test. ***P < 0.001 and ****P < 0.0001 were considered as significant.
Fig. 6. ISCA1 overexpression rescues the mitochondrial architecture changes after autophagy inhibition.
(A) Representative TEM images of PDAC cells overexpressing ISCA1 or control vector after CQ treatment was done followed by analysis of mitochondrial crista length (B) and lumen width (C) from n = 12 unique cristae for all groups. Red arrows in (A) indicate the typical dysfunctional mitochondria. (D) Effect of ISCA1 expression on the OCR was estimated after CQ treatment (representative data from one experiment that was repeated n = 2 times). (E) ATG5 was suppressed in cells bearing ISCA1 overexpression, and the level of indicated proteins was measured by immunoblotting, followed by measurement of relative cell proliferation (F; combined data of n = 5 experiments) and OCR (G; representative data of one experiment that was repeated n = 2 times). Data are means ± SD, and P values were quantified using one-way ANOVA with Tukey’s post hoc test. **P < 0.01, ***P < 0.001, and ****P < 0.0001 *P < 0.05 were considered as significant.
Autophagy maintains the LIP in PDAC
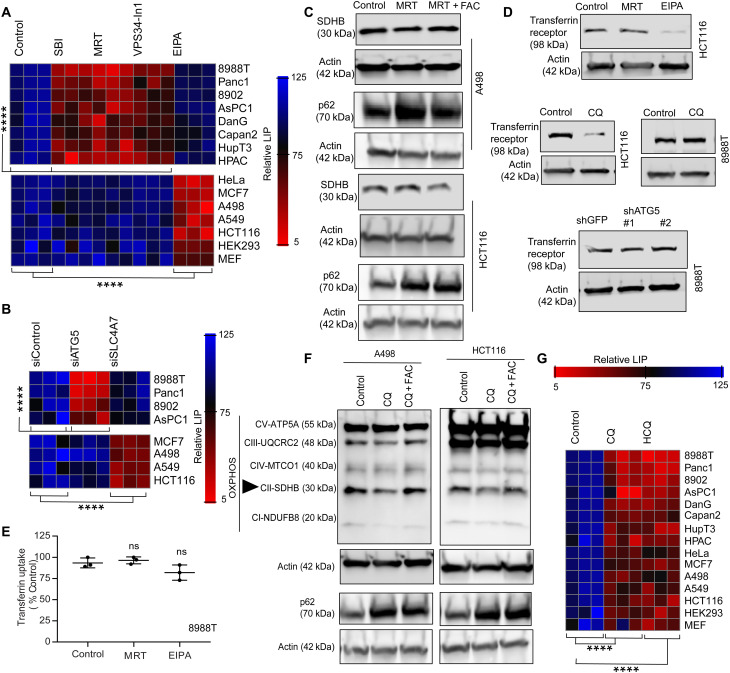
In addition to autophagy, PDAC cells are known to scavenge nutrients using macropinocytosis (16). Because these two processes converge at the lysosome, a critical hub for iron homeostasis (9), we assessed the contributions of these different routes to the LIP in multiple cell lines using various pharmacological and genetic methods to inhibit autophagy and macropinocytosis respectively (Fig. 7, A and B, and fig. S4A). Notably, we found that the contribution of autophagy to the LIP was restricted to PDAC. In non-PDAC cells, autophagy inhibition had minimal impact on the LIP and SDHB levels (Fig. 7, A to C), while macropinocytosis was critical for LIP maintenance through regulation of the transferrin receptor (Fig. 7D). Conversely, neither autophagy nor macropinocytosis inhibition significantly affected transferrin uptake in PDAC (Fig. 7, D and E). Similar to PDAC cells (Fig. 2A), lysosomal inhibition using CQ treatment in non-PDAC cells caused a significant drop in SDHB (Fig. 7F). Moreover, lysosomal inhibition (by treatment with CQ or HCQ) affected the LIP in both the PDAC and non-PDAC cells (Fig. 7G). This data collectively indicate that the route of the iron reservoir acquisition might differ between tumor types, but, ultimately, they use lysosome-mediated degradation to maintain the LIP.
Fig. 7. LIP in PDAC is regulated by autophagy level.
(A) Heatmap showing the relative LIP after inhibiting autophagy or macropinocytosis using pharmacological agents in different cell lines. (B) Genetic inhibition of autophagy and macropinocytosis in indicated cell lines to measure the LIP. (C) Non-PDAC cells were cotreated with or without an autophagy inhibitor along with FAC, and indicated proteins were immunoblotted. (D) Transferrin receptor was measured after inhibition of autophagy, lysosome, or macropinocytosis in different cell lines. (E) Transferrin uptake was measured in PDAC cells after the loss of autophagy or macropinocytosis (representative data from one experiment that was repeated n = 3 times). (F) Non-PDAC cancer cells were treated with CQ or cotreated with CQ and FAC and analyzed for the indicated proteins. SDHB is indicated in (F) using a triangle. (G) Different cell lines were treated with CQ and HCQ, and the relative LIP was determined and expressed as a heatmap. All indicated heatmaps show representative data of one experiment repeated n = 3 independent times. Heatmaps are indicating values in % by considering control as 100. Data are means ± SD, and P values were quantified using one-way ANOVA with Tukey’s post hoc test. ****P < 0.0001 was considered as significant. P > 0.05 were considered as ns.
CAFs support iron labile pool in autophagy-inhibited PDAC cells
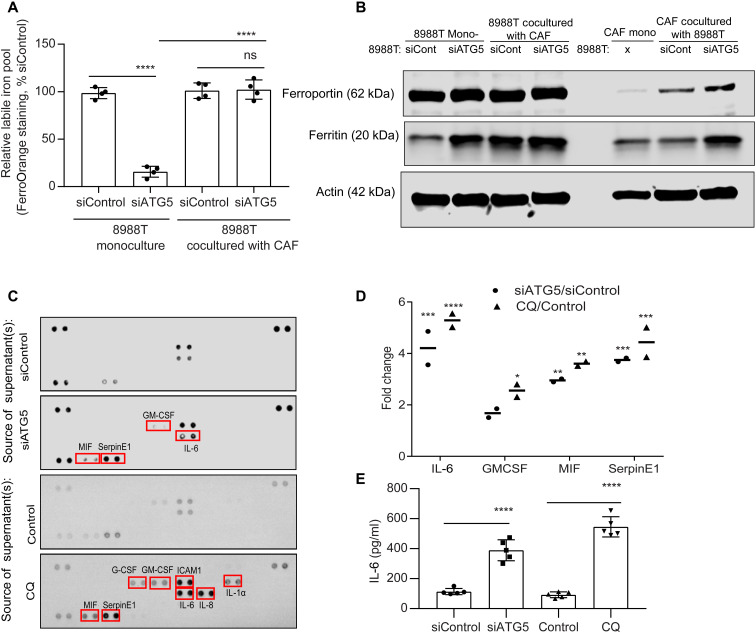
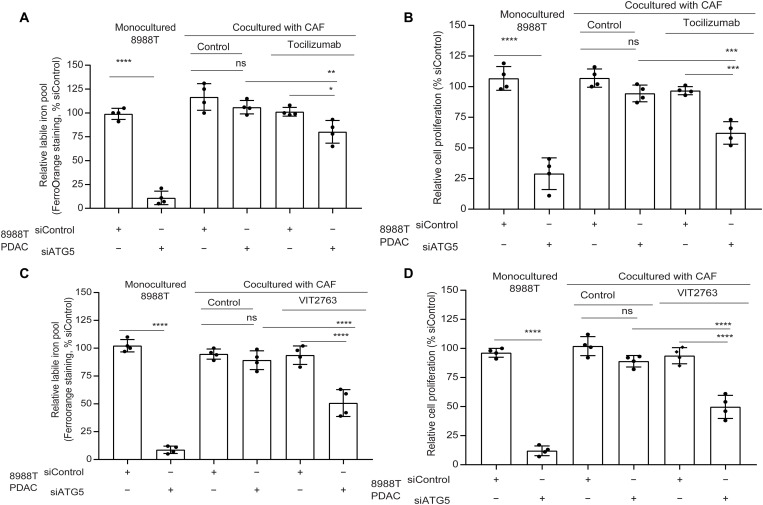
Despite the importance of autophagy in controlling iron availability in PDAC, the response of patients to HCQ as a monotherapy in clinical trials has been disappointing (17). To explore whether the TME may contribute to this resistance, we investigated the effect of LIP compensation by coculturing PDAC with cancer-associated fibroblasts (CAFs), which can make up a significant fraction of the PDAC TME. We see that coculture of PDAC cells with CAFs significantly rescues the LIP upon autophagy inhibition (Fig. 8A). To understand the involvement of PDAC-CAF cross-talk to modulate the LIP, we explored how coculture influenced the expression of key iron transporters. We saw an increase in iron exporter ferroportin [FPN; encoded by SLC40A1 gene; (18)] in CAFs, when they were cocultured with autophagy-inhibited PDAC (Fig. 8B). In contrast, there was no significant alteration of FPN levels in PDAC under coculture or monoculture conditions. Intriguingly, we observed that, when CAFs are cocultured with autophagy-inhibited PDAC cells, there was a rise in CAF ferritin levels (Fig. 8B). To identify the secreted factor that promoted increased CAF ferritin, we performed a secretome analysis of autophagy-inhibited PDAC (Fig. 8, C and D). We observed that autophagy-inhibited PDAC showed a significant secretion of the interleukin-6 (IL-6) cytokine, which has been previously shown to increase ferritin levels (Fig. 8, C and D) (19, 20). Under coculture conditions, we observed a rescue of SDHB level and mitochondrial functioning under autophagy-inhibited conditions (fig. S4, B and C). To confirm the importance of IL-6 in the iron cross-talk between PDAC and CAFs, we used an IL-6 receptor antagonist, tocilizumab, in coculture studies. We saw that tocilizumab treatment prevented the LIP compensation in autophagy-inhibited PDAC in coculture (Fig. 9A). Tocilizumab treatment also restored the antiproliferative effect of autophagy inhibition on PDAC cells in the coculture system (Fig. 9B). Furthermore, IL-6 loss specifically in CAFs did not affect ferritin levels under coculture conditions (fig. S4, D and E), confirming that the PDAC-secreted IL-6 is the major contributor to increase of CAF ferritin in a paracrine fashion. We confirmed the role of FPN in the iron secretion by the CAFs using a clinically available FPN inhibitor, VIT 2763 [also known as Vamifeport; (21, 22)]. VIT2763 prevented the LIP compensation from CAFs in autophagy-inhibited PDAC under coculture conditions, leading to impaired PDAC proliferation (Fig. 9, C and D).
Fig. 8. CAFs compensate for the LIP deficit in autophagy-inhibited PDAC.
(A) PDAC cells transfected with siRNAs against ATG5 were cocultured with CAFs followed by quantification of LIP in PDAC. (B) Mono- or cocultured PDAC and CAFs under conditions similar to (A) and assessed for the indicated proteins by immunoblotting. (C) Cell culture supernatants of PDAC cells treated with CQ or expressing siATG5 were analyzed using the proteome profiler human cytokine array kit (combined data from n = 2 repeats), and the change in cytokine pixel intensity was quantified in (D). (E) Under conditions similar to (C), IL-6 was quantified by enzyme-linked immunosorbent assay (representative data from one experiment repeated n = 3 times). Data are means ± SD. For (A), (E), and (D), P values were quantified using one-way (Tukey’s post hoc test) and two-way ANOVA (Holm Sidak’s test), respectively. *P < 0.05, **P < 0.01, ***P < 0.001, and ****P < 0.0001 were considered as significant.
Fig. 9. CAFs use FPN-ferritin axis to rescue drop in LIP of autophagy impaired PDAC.
PDAC cells bearing siATG5 or siControl were cocultured with CAFs and treated with tocilizumab or VIT2763 followed by determination of the relative LIP and cell proliferation (A and B for tocilizumab; C and D for VIT2763), respectively. (A to D) Representative data from one experiment repeated n = 3 times. Data are means ± SD, and P values were quantified using one-way ANOVA with Tukey’s post hoc test. *P < 0.05, **P < 0.01, ***P < 0.001, and ****P < 0.0001 were considered as significant.
Iron diet restriction synergizes with autophagy inhibition to treat PDAC
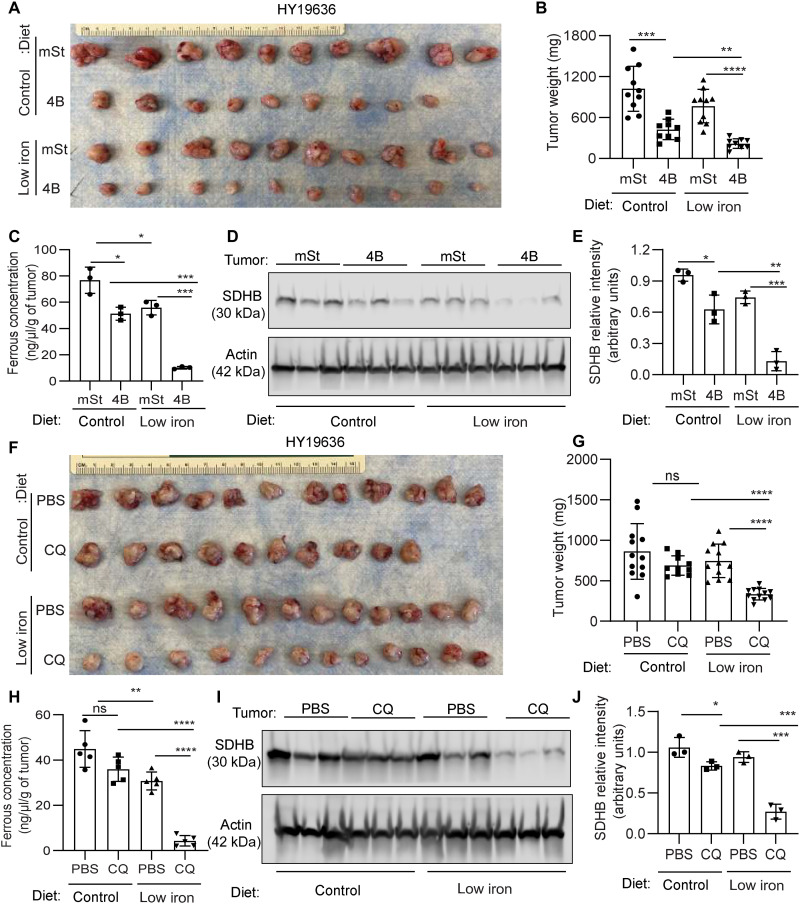
To harness the iron-autophagy axis in vivo, we assessed whether autophagy inhibition would cooperate with iron restriction in inhibiting PDAC tumor growth. Our hypothesis was that decreasing the overall bioavailable iron would impair compensatory responses, such as the PDAC-CAF cross-talk. To this end, we systematically reduced iron levels by exposing mice to a low-iron diet [4 to 6 parts per million (ppm)] in comparison to our standard diet’s 220-ppm iron level for at least 2 weeks before orthotopic transplantation of PDAC cells expressing a doxycycline-inducible dominant negative ATG4B (ATG4Bdn) or control vector (mST) into syngeneic hosts. This level of iron in the diet did not significantly affect hemoglobin levels (fig. S4E). Consistent with our previous findings, autophagy inhibition significantly reduced tumor growth. The addition of a low-iron diet led to a further tumor growth reduction, suggesting that iron deprivation sensitizes tumor cells to autophagy inhibition (Fig. 10, A and B). Loss of autophagy and iron limiting diet showed a significant drop in the bioavailable ferrous iron concentration in tumors (Fig. 10C) that led to a decline in SDHB expression (Fig. 10, D and E). To assess these findings in a more clinically relevant setting, we tested the role of CQ, an inhibitor of lysosomal acidification that has been used clinically to inhibit autophagy, in a low-iron context in vivo. Consistent with it being a relatively weak autophagy inhibitor, CQ treatment failed to reduce tumor growth in mice on the control diet. Notably, the combination of CQ and an iron-restricted diet significantly reduced tumor growth (Fig. 10, F and G), and these tumors showed a decrease in the ferrous iron pool as well as decreased SDHB expression (Fig. 10, H to F). In line with our previous findings (6), we observed that autophagy inhibition increased T cell infiltration in the tumors; however, this was not further enhanced by the low-iron diet (fig. S5). In addition, the modulation of iron levels by autophagy does not appear to involve ferroptosis (fig. S6, A to D). Together, these data support a model where a low-iron diet cooperates with autophagy inhibition by preventing microenvironmental compensation and critically disrupting iron homeostasis in PDAC tumors.
Fig. 10. Combination of iron restricted diet and autophagy inhibition provides a therapeutic benefit in PDAC.
(A) Murine PDAC cells (HY19636) bearing intact autophagy (mSt) or inhibited autophagy (4B) were orthotopically implanted in syngeneic mice fed with doxycycline (625 mg/kg) diet containing control (220 ppm) or low iron (4 to 6 ppm). Mice were euthanized after 24 days of implantation, and tumor images are shown (A; n = 10, 9, 10, and 10 from top to bottom) along with tumor weights (B). (C) The ferrous concentration of different tumors indicated in (A) was analyzed from three randomly selected tumors of each group. (D) SDHB expression levels were determined by performing immunoblot analysis on these tumors, and their relative quantification was performed (E). B6 mice bearing syngeneic PDAC cells were treated with CQ or PBS, fed with control or low-iron diet, and were euthanized 24 days after implantation. Tumor images are shown (F; n = 12, 10, 12, and 12 from top to bottom) along with tumor weights (G). (H) Ferrous concentration in tumors of the indicated groups was determined (n = 3). (I) SDHB expression level was assessed by immunoblotting on these tumors, and their relative quantification was performed (J) (n = 3). Data are means ± SD, and P values were quantified using one-way ANOVA with Tukey’s post hoc test. *P < 0.05, **P < 0.01, ***P < 0.001, and ****P < 0.0001 were considered as significant.
DISCUSSION
Previously, we identified that PDAC tumors rely on autophagy to grow and progress. Since then, our understanding of the role of autophagy in PDAC has evolved substantially. However, there is limited research to identify metabolic substrates that autophagy provides in PDAC. Here, we demonstrated that autophagy is essential for maintaining iron homeostasis in PDAC cells to support the mitochondrial function necessary for growth and proliferation. Mechanistically, we showed that autophagy inhibition decreases the LIP and the synthesis of Fe-S clusters via the assembly factor, ISCA1, leading to a decrease in the ISC protein SDHB. Either supplementation of iron or ectopic expression of ISCA1 or SDHB restores mitochondria function and cellular growth.
In the past decade, we and others have elucidated multiple metabolic cross-talks between the tumor and stroma (23). For example, we demonstrated that CAFs can secrete the amino acid alanine supporting PDAC metabolism (5). However, little is known about the role of CAFs in supporting PDAC growth in iron-deficient states. We sought to dissect this connection in vitro using coculture systems, and we found that autophagy impairment leads to IL-6 secretion from PDAC that promotes an increase in ferritin in CAFs. Iron efflux from the CAFs is then increased via up-regulation of the iron efflux protein FPN, leading to the restoration of the LIP in PDAC cells. Pharmacological inhibition of FPN using VIT2763 or the use of antagonist of the IL-6 receptor, tocilizumab, reduced PDAC cell proliferation in response to autophagy inhibition in the coculture system by restricting the LIP. This observation is consistent with other metabolic cross-talk programs that we have previously described (5, 24, 25), demonstrating the complex role of tumor-stroma in PDAC. Lowering the systemic iron levels of PDAC-bearing mice presumably disrupts this cross-talk by limiting iron available to the CAFs and provides an explanation for the robust combinatorial effects of autophagy inhibition with a low-iron diet. Future studies will continue to explore how disruption of iron metabolism in PDAC could affect its complex TME.
Consistent with previous work, we observed that lysosomal homeostasis is essential to maintain iron homeostasis with disruption of lysosomal acidification depleting the LIP in all cell types examined (9). Inhibition of the canonical autophagy pathway only affected PDAC cell lines, suggesting that their LIP are autophagy/ferritin-dependent, consistent with prior reports (26). We have not yet determined the mechanism of this difference between PDAC and non-PDAC lines, but we hypothesize that the high basal levels of autophagy or other unique biological aspects of PDAC may promote this phenotype. Prior work has shown that the autophagy-dependent secretion of IL-6 is important for invasion of Ras-transformed cells (27). The increased IL-6 secretion in PDAC that we observe in response to autophagy inhibition may be due to the exquisite importance of autophagy in the maintenance of the LIP in this tumor type. These results further underscore the importance of fully dissecting this complex biology in tumor-specific systems.
Our research, along with two recent independent publications, supports the notion that iron metabolism is crucial for the development and progression of PDAC. Recently, it was demonstrated that genetic deletion of Ncoa4, the selective autophagy receptor for ferritinophagy, in the KPC model enhances survival (26). Ncoa4-deficient cells showed a decrease in ISC and mitochondrial function. Conversely, overexpression of Ncoa4 in the KPC model resulted in an increase in tumor development and reduced the overall survival compared to KPC mice. It was also demonstrated that inhibition of the RAS-MAPK pathway led to an increase in iron supply mediated by ferritinophagy, supporting mitochondrial respiration and PDAC growth (28). They revealed that this survival mechanism was coordinated at the transcriptional level by the microphthalmia/transcription factor E (MiT/TFE) factors.
Together, our work and these other studies support the model in which the iron-autophagy/lysosome axis represents a metabolic vulnerability in PDAC. Specifically, our study demonstrated the feasibility of targeting this metabolic dependency in vivo and mechanistically defined the distinct regulation of iron homeostasis in different tumor types, which has implications for how one would approach this therapeutically. We were able to exploit this dependency by modulating the systematic levels of iron, resulting in higher efficiency of autophagy and lysosomal inhibition. Although there are not specific inhibitors of iron-autophagy axis yet, our in vivo results suggest that perhaps the combination of autophagy/lysosomal inhibitors with dietary modulation of iron levels could be a promising initial step to improve the pharmacological profile of HCQ/CQ in the clinic. Ultimately, it will be critical to use these mechanistic findings to design approaches to target iron metabolism in PDAC, without compromising the role of iron in tissue and cellular homeostasis.
MATERIALS AND METHODS
Cell culture
PaTu-8988T and PaTu-8902 cell lines were obtained from Leibniz Institute DSMZ-German Collection of Microorganisms and Cell Cultures GmbH, while the rest were from American Type Culture Collection. Murine PDAC cell line HY19636 was established as previously described (6). All cells were cultured in Dulbecco’s modified Eagle’s medium (DMEM; Fisher, MT10017CV) supplemented with 10% fetal bovine serum containing 1% penicillin/streptomycin antibiotic (Life Technologies, 15140163) and incubated in a humidified chamber supplied with 5% CO2. Unless and until mentioned in the figures, PDAC refers to 8988T cells. Cell lines were regularly inspected for mycoplasma contamination by polymerase chain reaction (PCR) and authenticated by fingerprinting.
Clonogenic and cell proliferation assay
Clonogenic and cell proliferation assay experiments were done following the previously reported methods published in (12).
Chemicals
N-acetyl-l-cysteine (5 mM; Sigma-Aldrich, A9165), methylthiazolyldiphenyl-tetrazolium bromide (Sigma-Aldrich, M5655), CQ (25 μM, unless otherwise mentioned; Sigma-Aldrich, C6628), deferoxamine mesylate salt (100 μM; Sigma-Aldrich, D9533), ferric ammonium citrate (FAC; 200 μM; Fisher Scientific, I72-500), SBI-0206965 (10 μM; Sigma-Aldrich, SML1540-5MG), MRT68921 dihydrochloride (10 μM; Sigma-Aldrich, SML1644-5MG), HCQ sulfate (10 μM; Sigma-Aldrich, H0915), Vps34-IN1 (10 μM; Cayman Chemicals, 17392), 5-[N-ethyl-N-isopropyl] amiloride (10 μM; Cayman Chemicals, 14406), ferrostatin-1 (20 μM; Cayman Chemicals, 17729), and liproxstatin-1 (14 μM; Cayman Chemicals, 17730).
Western blotting and antibodies
For all Western blot analysis, lysates were prepared using the Cell Lysis Buffer (1×, Cell Signaling Technology: 9803) supplemented with protease inhibitor (Thermo, A32953) and phosphatase inhibitor (PhosSTOP; Sigma-Aldrich, 04906837001), and the Western blotting was done as previously described (6). The following antibodies were used: Total OXPHOS Rodent WB Antibody Cocktail (Abcam, ab110413), ATG5 (Novus Biologicals, NB110-53818), β-actin (Sigma-Aldrich, A5441), LC3B (Novus Biologicals, NB100-220), P62/SQSTM1 (Abnova, H00008878-M01), SDHB (21A11AE7; Abcam, ab14714), SDHA (D6J9M) XP Rabbit mAb (Cell Signaling Technology, 11998 T), SDHC (Proteintech, 14575-1-AP), SDHD (Sigma-Aldrich, SAB3500797), ISCA1/HBLD2 (1A11) (Novus Biologicals, H00081689-M02), ferritin (Abcam, ab75973), transferrin receptor (Abcam, ab84036), FPN/SLC40A1 (Novus Biologicals, NBP1-21502), VDAC1/porin (Abcam, ab15895), CIAPIN1 (Proteintech, 12638-1-AP), NUBP1 (Proteintech, 18011-1-AP), PTGS2 (Proteintech, 12375-1-AP), IL-6 (Proteintech, 21865-1-AP), GPx4 (Abcam, ab125066), and Na,K–adenosine triphosphatase (Cell Signaling Technology, 3010S). Bands from Western blots in Fig. 10 were quantified using ImageJ [National Institutes of Health (NIH), Bethesda, MD, USA].
Cytokine assays
After autophagy/lysosome inhibition, cell culture supernatant was analyzed using the Proteome Profiler Human Cytokine Array Kit (Bio-Techne, ARY005B), and the array spots were quantified using ImageJ (NIH, Bethesda, MD, USA) software after subtracting the background signal. The Human IL-6 ELISA Kit (ab178013) from Abcam was used to estimate the IL-6 level in cell culture supernatants using the manufacturer’s protocol.
Quantification of LIP
Bioavailable LIP was quantified using FerroOrange dye (Dojindo, F374-12) that is highly selective for intracellular Fe2+ detection as previously reported by Weber et al. (9). Briefly, cells were seeded in black frame glass bottom plate with high performance #1.5 cover glass (Cellvis, CA, USA). After experimental treatment, cells were incubated with 1 μM FerroOrange dye in Hanks’ balanced salt solution (HBSS) and incubated as per (9). The fluorescent intensity of the cells reflecting the LIP was quantified by measuring the fluorescent signal at excitation wavelength (λex) of 543 nm and emission wavelength (λem) of 580 nm as per the manufacturer recommendation using a SpectraMax M5 plate reader (Molecular Devices) and normalized to the cell count.
In vivo ferrous concentration assay
Ferrous concentration was determined from tumor specimens of indicated groups using the manufacturer’s protocols of the Iron Assay Kit (Sigma-Aldrich, MAK025), which was previously reported in (26).
Plate reader assay of fluorescent dextran retention
We adapted the protocol from Sutton et al. (29). A total of 5000 cells bearing different experimental treatments were seeded in black 96-well plates. Cells were treated with Tetramethylrhodamine (TMR)-dextran (1 mg/ml, 30 min; Thermo Fisher, D1819) followed by three times washing with phosphate-buffered saline (PBS), and then, the fluorescent signal was quantified by measuring the signal λex of 550 nm and λem of 580 nm using a SpectraMax M5 plate reader (Molecular Devices) and normalized to the cell count.
Transferrin uptake
PDAC cells under different experimental conditions were analyzed for transferrin uptake as previously reported (12).
RNA interference and plasmids
Lentiviral-based short hairpin–mediated RNA target sequences are as follows: shATG5#1: 5′-CCTGAACAGAATCATCCTTAA-3′-(TRCN0000330394); shATG5#2: 5′-CCTGAACAGAATCATCCTTAA-3′-(TRCN0000151963); and shGFP: 5′-TGCCCGACAACCACTACCTGA-3′-(TRCN0000072186). Small interfering RNA (siRNA) pools against ATG5 (sc-41445), LC3 (sc-43390), FTH (sc-40575), FTL (sc-40577), NCOA4 (sc-29719), SLC4A7 (sc-77885), and IL-6 (sc-39627) were purchased from Santa Cruz Biotechnology Inc., along with control siRNA (sc-37007), which consisted of a scrambled sequence. Quantitative reverse transcription PCR was followed as previously reported in (6). mRNA abundance was quantified by ΔCt method and normalized to glyceraldehyde-3-phosphate dehydrogenase (GAPDH). Sequences for quantitative PCR primers are as follows: GAPDH: forward 5′ to 3′ (GTCTCCTCTGACTTCAACAGCG) and reverse 3′ to 5′ (ACCACCCTGTTGCTGTAGCCAA); ATG5: forward (AAAGATGTGCTTCGAGATGTGT) and reverse (CACTTTGTCAGTTACCAACGTCA); FTH: forward (TGAAGCTGCAGAACCAACGAGG) and reverse (GCACACTCCATTGCATTCAGCC); FTL: forward (CAGCCTGGTCAATTTGTACCT) and reverse (GCCAATTCGCGGAAGAAGTG); NCOA4: forward (GCTTGCTATTGGTGGAGTTCTCC) and reverse (GCACACTCCATTGCATTCAGCC); SLC4A7: forward (CCAGTCGGATTCCTCTTGTTCG) and reverse (CAGACCTGTTCGCAAAGAGTGG).
Plasmids expressing SDHB (HsCD00954622) and the corresponding vector backbone (no. #40125) were obtained from DNASU plasmid repository and Addgene, respectively. Open reading frame expression clone for ISCA1 (NM_030940.3) (EX-T7718-Lv242-B) along with control vector (EX-EGFP-Lv242-B) was obtained from GeneCopoeia. pINDUCER20-mStrawberry (no. 161734) and pINDUCER20-mStrawberry-Atg4BC74A (no. 161735) plasmids were obtained from Addgene.
Transmission electron microscopy
PaTu-8988T cells undergoing indicated experiments were fixed using 0.1 M sodium cacodylate buffer (pH 7.4) comprising 2.5% glutaraldehyde and 2% paraformaldehyde for overnight at 4°C. Following this, postfixation was carried out using 1% osmium tetroxide and 1% potassium ferrocyanide for 1 hour at 4°C after which block staining was performed in 0.25% aqueous uranyl acetate for overnight at 4°C. The samples were processed following a standard manner and embedded in EMbed 812 (Electron Microscopy Sciences, Hatfield, PA, USA). After cutting the samples into ultrathin sections (70 nm), they were mounted on copper grids followed by staining with uranyl acetate and lead citrate. A total of 20 to 25 cells from each of the samples were randomly selected for imaging under the Talos L120C Transmission Electron Microscope (Thermo Fisher Scientific, Hillsboro, OR, USA) with Gatan 4k × 4k OneView Camera (Gatan Inc. Pleasanton, CA, USA). High-resolution ultrastructure images of mitochondria were captured, and the single cristae length and lumen width of different mitochondria were analyzed from different field of view for indicated number of sample sizes. Image acquisition was done in a blinded manner, and the data quantification was obtained from random mitochondria. Quantification of TEM data, image processing, and analysis was done using ImageJ (NIH, Bethesda, MD, USA) following (30, 31).
Metabolomic analysis
For metabolomics studies, PDAC cells were transfected with siRNAs (siControl or siATG5) for 72 hours prior the assay or treated with CQ (20 μM) for 24 hours. Cells were plated in a six-well plate at 2.0 × 10⁵ cells per well and allowed to attach overnight in DMEM. Next, cells were washed with PBS twice and cultured for 24 hours in DMEM supplemented with 10% dialyzed serum. Metabolites were collected by using the extraction buffer that consists of 80% methanol with 500 nM from the amino acid mix standard (Cambridge Isotope Laboratories). Samples were subsequently processed by the Metabolomics Core Research Lab at NYU Langone Health as described by Parker et al. (32). The data were normalized to internal standards and cell number, and the instrument was assessed for performance.
Oxygen consumption rate
Basal OCR was measured using a Seahorse XFe96 analyzer (Agilent). PDAC lines were plated at 10,000 to 20,000 cells per well depending on the growth kinetics of the line in either standard DMEM or with CQ (20 μM), doxycycline (1 μg/ml), and FAC (150 μM) 24 hours prior the assay. Before the assay, medium was removed and replace with XF assay medium (25 mM glucose, 4 mM of glutamine, no sodium bicarbonate, and 5 mM Hepes), the plate was incubated for ~45 min at 37°C in a non-CO2 incubator (Thermo Fisher Scientific). Medium was changed a second time before the beginning of the assay, and drug treatments were maintained in the XF assay medium throughout the experiment. Following the experiment, cells were normalized to protein quantification using the DC Protein Assay Kit (Bio-Rad). At least two independent experiments were performed for all conditions, and data from 6 to 12 technical replicate wells for each independent experiment were averaged. Data were plotted relative to the untreated/control condition of each independent group.
Orthotopic xenograft experiments
Orthotopic injections of PDAC cells were conducted as previously described (6). Briefly, mice were anesthetized with ketamine (100 mg/kg) and xylazine (10 mg/kg) before surgery. An incision was made in proximity to the spleen, and the pancreas was carefully externalized. Cells were resuspended in 20 μl of a solution composed of HBSS and matrigel (Corning, 356231) at a one-to-one ratio and injected into the tail of the pancreas with insulin syringes (29-gauge needle; BD, 324702). For all the in vivo experiments, approximately 7000 cells were injected unless indicated otherwise. HY19636 were infected either with pINDUCER20-mStrawberry (referred as mSt in the figures; Addgene, no. 161734) or pINDUCER20-mStrawberry-Atg4BC74A (referred as 4B, Addgene, no. 161735) as previously described (6). After surgery, the incision was closed using a 3-0 vicryl violet suture (Ethicon, J311H) and using the BD AutoClip Wound Closing System (BD). Mice were treated with buprenex every 12 hours after surgery for 48 hours. Animals were allowed to recover from surgery for at least 5 days before starting the experimental process.
To systematically reduce iron levels, animals were exposed to an iron-deficient diet (4 to 6 ppm; Envigo, TD.99397) for at least 2 weeks prior surgery. For the regular mouse diet, we used food pellet from Lab Serv (PicoLab Rodent diet 20, catalog no. 5053; 220-ppm iron). After surgery, animals were randomized into control diet (doxycycline at 625 mg/kg with 220-ppm iron; TD.01306) or iron deficient with doxycycline (Envigo, TD.210813). For CQ experiments, mice were treated daily intraperitoneally with CQ (60 mg/kg) or vehicle (PBS). Treatment started 5 days after surgery as previously described. Tumor weight measured was at the endpoint after they were euthanized, and tumor was harvested for further analysis.
All animal studies were approved by the NYU Langone Health Institutional Animal Care and Use Committee, protocol no. A16-00507. Female mice B6J (Charles River, C57BL/6J) used in this study were 8 to 10 weeks old and not involved in previous procedures. All mice were maintained in the animal facility of the New York University Grossman School of Medicine.
Statistical analysis
Representation of statistics for all experimental data with sample size and type of analysis is indicated in individual figure legends. P < 0.05 was considered the level of significance when comparing the values of experimental groups in comparison to respective controls. All analysis was carried out using GraphPad 7. Every experiment was repeated multiple times with biological replicates, and attempts at replication of presented data were successful. For in vivo experiments, the groups were randomly assigned in a blinded manner, and all mice enrolled onto a study were included.
Acknowledgments
Funding: This work was supported by NCI (grants P01CA117969, R35CA232124, P30CA016087-38, and 1R01CA251726-01A1), the Lustgarten Foundation, and SU2C to A.C.K; HHMI Gilliam Fellowships for Advanced Study to J.E.-R; and the Burroughs Wellcome Fund Career Awards for Medical Scientists (1014767.01) and the Hale Family Center for Pancreatic Cancer research grant to J.D.M. J.D.M. also reports research funding from Novartis outside the submitted work. We thank the New York University (NYU) Langone Health Experimental Pathology Laboratory and Flow Cytometry Core, each supported, in part, by the Cancer Center Support grant P30CA016087 at the Laura and Isaac Perlmutter Cancer Center. We thank NYULH DART Microscopy Laboratory for assistance with TEM work; this core is partially funded by NYU Cancer Center support grant NIH/NCI P30CA016087. We thank S. Gygi for use of CORE for mass spectrometry data analysis software. The Experimental Pathology Research Laboratory is partially supported by the Cancer Center support grant P30CA016087 at NYU Langone’s Laura and Isaac Perlmutter Cancer Center. Heatmaps were developed using Morpheus (https://software.broadinstitute.org/morpheus).
Author contributions: Supervision: A.C.K. Conceptualization and writing manuscript: S.M., J.E.-R., and A.C.K. Experimentation and analysis: Seahorse and metabolomic study done by J.E.-R., the rest by S.M. Animal studies: J.E.-R., E.Y.L., A.S.W.S., and S.M. Proteomics: H.Z. and J.D.M. All the authors read the manuscript and approved the submission. Competing interests: A.C.K. has financial interests in Vescor Therapeutics and is an inventor on patents pertaining to KRAS-regulated metabolic pathways and redox control pathways in pancreatic cancer, targeting GOT1 as a therapeutic approach (PCT/US2013/042468; filed 23 May 2013, published 28 November 2013), targeting alanine transport, and the autophagic control of iron metabolism (PCT/US2015/023142, filed 27 March 27 2015, published 29 June 2017) filed by Dana Farber Cancer Institute Inc., Beth Israel Deaconess Medical Center Inc. A.C.K. is on the scientific advisory board of Rafael/Cornerstone Pharmaceuticals, is an advisor to OncoRev, and has been a consultant for Deciphera and Abbvie. J.D.M. and A.C.K. are inventors on patent (PCT/US2015/023142, details as mentioned above). All patent status is active. The other authors declare that they have no competing interests.
Data and materials availability: All data needed to evaluate the conclusions in the paper are present in the paper and/or the Supplementary Materials.
Supplementary Materials
This PDF file includes:
Figs. S1 to S6
Table S1
Supplementary Methods
References
REFERENCES AND NOTES
- 1.R. L. Siegel, K. D. Miller, H. E. Fuchs, A. Jemal, Cancer statistics, 2021. CA Cancer J. Clin. 71, 7–33 (2021). [DOI] [PubMed] [Google Scholar]
- 2.L. Rahib, B. D. Smith, R. Aizenberg, A. B. Rosenzweig, J. M. Fleshman, L. M. Matrisian, Projecting cancer incidence and deaths to 2030: The unexpected burden of thyroid, liver, and pancreas cancers in the United States. Cancer Res. 74, 2913–2921 (2014). [DOI] [PubMed] [Google Scholar]
- 3.S. Yang, X. Wang, G. Contino, M. Liesa, E. Sahin, H. Ying, A. Bause, Y. Li, J. M. Stommel, G. Dell'antonio, J. Mautner, G. Tonon, M. Haigis, O. S. Shirihai, C. Doglioni, N. Bardeesy, A. C. Kimmelman, Pancreatic cancers require autophagy for tumor growth. Genes Dev. 25, 717–729 (2011). [DOI] [PMC free article] [PubMed] [Google Scholar]
- 4.A. Yang, N. V. Rajeshkumar, X. Wang, S. Yabuuchi, B. M. Alexander, G. C. Chu, D. D. Von Hoff, A. Maitra, A. C. Kimmelman, Autophagy is critical for pancreatic tumor growth and progression in tumors with p53 alterations. Cancer Discov. 4, 905–913 (2014). [DOI] [PMC free article] [PubMed] [Google Scholar]
- 5.C. M. Sousa, D. E. Biancur, X. Wang, C. J. Halbrook, M. H. Sherman, L. Zhang, D. Kremer, R. F. Hwang, A. K. Witkiewicz, H. Ying, J. M. Asara, R. M. Evans, L. C. Cantley, C. A. Lyssiotis, A. C. Kimmelman, Pancreatic stellate cells support tumour metabolism through autophagic alanine secretion. Nature 536, 479–483 (2016). [DOI] [PMC free article] [PubMed] [Google Scholar]
- 6.K. Yamamoto, A. Venida, J. Yano, D. E. Biancur, M. Kakiuchi, S. Gupta, A. S. W. Sohn, S. Mukhopadhyay, E. Y. Lin, S. J. Parker, R. S. Banh, J. A. Paulo, K. W. Wen, J. Debnath, G. E. Kim, J. D. Mancias, D. T. Fearon, R. M. Perera, A. C. Kimmelman, Autophagy promotes immune evasion of pancreatic cancer by degrading MHC-I. Nature 581, 100–105 (2020). [DOI] [PMC free article] [PubMed] [Google Scholar]
- 7.H. J. Zeh, N. Bahary, B. A. Boone, A. D. Singhi, J. L. Miller-Ocuin, D. P. Normolle, A. H. Zureikat, M. E. Hogg, D. L. Bartlett, K. K. Lee, A. Tsung, J. W. Marsh, P. Murthy, D. Tang, N. Seiser, R. K. Amaravadi, V. Espina, L. Liotta, M. T. Lotze, A randomized phase II preoperative study of autophagy inhibition with high-dose hydroxychloroquine and gemcitabine/nab-paclitaxel in pancreatic cancer patients. Clin. Cancer Res. 26, 3126–3134 (2020). [DOI] [PMC free article] [PubMed] [Google Scholar]
- 8.J. D. Mancias, X. Wang, S. P. Gygi, J. W. Harper, A. C. Kimmelman, Quantitative proteomics identifies NCOA4 as the cargo receptor mediating ferritinophagy. Nature 509, 105–109 (2014). [DOI] [PMC free article] [PubMed] [Google Scholar]
- 9.R. A. Weber, F. S. Yen, S. P. V. Nicholson, H. Alwaseem, E. C. Bayraktar, M. Alam, R. C. Timson, K. La, M. Abu-Remaileh, H. Molina, K. Birsoy, Maintaining iron homeostasis is the key role of lysosomal acidity for cell proliferation. Mol. Cell 77, 645–655.e7 (2020). [DOI] [PMC free article] [PubMed] [Google Scholar]
- 10.F. Rizzollo, S. More, P. Vangheluwe, P. Agostinis, The lysosome as a master regulator of iron metabolism. Trends Biochem. Sci. 46, 960–975 (2021). [DOI] [PubMed] [Google Scholar]
- 11.K. F. Yambire, C. Rostosky, T. Watanabe, D. Pacheu-Grau, S. Torres-Odio, A. Sanchez-Guerrero, O. Senderovich, E. G. Meyron-Holtz, I. Milosevic, J. Frahm, A. P. West, N. Raimundo, Impaired lysosomal acidification triggers iron deficiency and inflammation in vivo. eLife 8, e51031 (2019). [DOI] [PMC free article] [PubMed] [Google Scholar]
- 12.S. Mukhopadhyay, D. E. Biancur, S. J. Parker, K. Yamamoto, R. S. Banh, J. A. Paulo, J. D. Mancias, A. C. Kimmelman, Autophagy is required for proper cysteine homeostasis in pancreatic cancer through regulation of SLC7A11. Proc. Natl. Acad. Sci. U.S.A. 118, e2021475118 (2021). [DOI] [PMC free article] [PubMed] [Google Scholar]
- 13.E. Szarek, E. R. Ball, A. Imperiale, M. Tsokos, F. R. Faucz, A. Giubellino, F. M. Moussallieh, I. J. Namer, M. S. Abu-Asab, K. Pacak, D. Taïeb, J. A. Carney, C. A. Stratakis, Carney triad, SDH-deficient tumors, and Sdhb+/− mice share abnormal mitochondria. Endocr. Relat. Cancer 22, 345–352 (2015). [DOI] [PMC free article] [PubMed] [Google Scholar]
- 14.L. K. Beilschmidt, S. Ollagnier de Choudens, M. Fournier, I. Sanakis, M. A. Hograindleur, M. Clémancey, G. Blondin, S. Schmucker, A. Eisenmann, A. Weiss, P. Koebel, N. Messaddeq, H. Puccio, A. Martelli, ISCA1 is essential for mitochondrial Fe4S4 biogenesis in vivo. Nat. Commun. 8, 15124 (2017). [DOI] [PMC free article] [PubMed] [Google Scholar]
- 15.A. Torraco, O. Stehling, C. Stümpfig, R. Rösser, D. De Rasmo, G. Fiermonte, D. Verrigni, T. Rizza, A. Vozza, M. Di Nottia, D. Diodato, D. Martinelli, F. Piemonte, C. Dionisi-Vici, E. Bertini, R. Lill, R. Carrozzo, ISCA1 mutation in a patient with infantile-onset leukodystrophy causes defects in mitochondrial [4Fe-4S] proteins. Hum. Mol. Genet. 27, 2739–2754 (2018). [DOI] [PubMed] [Google Scholar]
- 16.J. Encarnación-Rosado, A. C. Kimmelman, Harnessing metabolic dependencies in pancreatic cancers. Nat. Rev. Gastroenterol. Hepatol. 18, 482–492 (2021). [DOI] [PMC free article] [PubMed] [Google Scholar]
- 17.B. M. Wolpin, D. A. Rubinson, X. Wang, J. A. Chan, J. M. Cleary, P. C. Enzinger, C. S. Fuchs, N. J. McCleary, J. A. Meyerhardt, K. Ng, D. Schrag, A. L. Sikora, B. A. Spicer, L. Killion, H. Mamon, A. C. Kimmelman, Phase II and pharmacodynamic study of autophagy inhibition using hydroxychloroquine in patients with metastatic pancreatic adenocarcinoma. Oncologist 19, 637–638 (2014). [DOI] [PMC free article] [PubMed] [Google Scholar]
- 18.E. Nemeth, M. S. Tuttle, J. Powelson, M. B. Vaughn, A. Donovan, D. M. Ward, T. Ganz, J. Kaplan, Hepcidin regulates cellular iron efflux by binding to ferroportin and inducing its internalization. Science 306, 2090–2093 (2004). [DOI] [PubMed] [Google Scholar]
- 19.J. T. Rogers, Ferritin translation by interleukin-1and interleukin-6: The role of sequences upstream of the start codons of the heavy and light subunit genes. Blood 87, 2525–2537 (1996). [PubMed] [Google Scholar]
- 20.M. Kobune, Y. Kohgo, J. Kato, E. Miyazaki, Y. Niitsu, Interleukin-6 enhances hepatic transferrin uptake and ferritin expression in rats. Hepatology 19, 1468–1475 (1994). [PubMed] [Google Scholar]
- 21.F. Richard, J. J. van Lier, B. Roubert, T. Haboubi, U. M. Göhring, F. Dürrenberger, Oral ferroportin inhibitor VIT-2763: First-in-human, phase 1 study in healthy volunteers. Am. J. Hematol. 95, 68–77 (2020). [DOI] [PMC free article] [PubMed] [Google Scholar]
- 22.V. Manolova, N. Nyffenegger, A. Flace, P. Altermatt, A. Varol, C. Doucerain, H. Sundstrom, F. Dürrenberger, Oral ferroportin inhibitor ameliorates ineffective erythropoiesis in a model of β-thalassemia. J. Clin. Invest. 130, 491–506 (2019). [DOI] [PMC free article] [PubMed] [Google Scholar]
- 23.C. A. Lyssiotis, A. C. Kimmelman, Metabolic interactions in the tumor microenvironment. Trends Cell Biol. 27, 863–875 (2017). [DOI] [PMC free article] [PubMed] [Google Scholar]
- 24.S. J. Parker, C. R. Amendola, K. E. R. Hollinshead, Q. Yu, K. Yamamoto, J. Encarnación-Rosado, R. E. Rose, M. M. LaRue, A. S. W. Sohn, D. E. Biancur, J. A. Paulo, S. P. Gygi, D. R. Jones, H. Wang, M. R. Philips, D. Bar-Sagi, J. D. Mancias, A. C. Kimmelman, Selective alanine transporter utilization creates a targetable metabolic niche in pancreatic cancer. Cancer Discov. 10, 1018–1037 (2020). [DOI] [PMC free article] [PubMed] [Google Scholar]
- 25.R. S. Banh, D. E. Biancur, K. Yamamoto, A. S. W. Sohn, B. Walters, M. Kuljanin, A. Gikandi, H. Wang, J. D. Mancias, R. J. Schneider, M. E. Pacold, A. C. Kimmelman, Neurons release serine to support mRNA translation in pancreatic cancer. Cell 183, 1202–1218.e25 (2020). [DOI] [PMC free article] [PubMed] [Google Scholar]
- 26.N. Santana-Codina, M. Q. Del Rey, K. S. Kapner, H. Zhang, A. Gikandi, C. Malcolm, C. Poupault, M. Kuljanin, K. M. John, D. E. Biancur, B. Chen, N. K. Das, K. E. Lowder, C. J. Hennessey, W. Huang, A. Yang, Y. M. Shah, J. A. Nowak, A. J. Aguirre, J. D. Mancias, NCOA4-mediated ferritinophagy is a pancreatic cancer dependency via maintenance of iron bioavailability for iron-sulfur cluster proteins. Cancer Discov. 12, 2180–2197 (2022). [DOI] [PMC free article] [PubMed] [Google Scholar]
- 27.R. Lock, C. M. Kenific, A. M. Leidal, E. Salas, J. Debnath, Autophagy-dependent production of secreted factors facilitates oncogenic RAS-driven invasion. Cancer Discov. 4, 466–479 (2014). [DOI] [PMC free article] [PubMed] [Google Scholar]
- 28.M. Ravichandran, J. Hu, C. Cai, N. P. Ward, A. Venida, C. Foakes, M. Kuljanin, A. Yang, C. J. Hennessey, Y. Yang, B. R. Desousa, G. Rademaker, A. A. L. Staes, Z. Cakir, I. H. Jain, A. J. Aguirre, J. D. Mancias, Y. Shen, G. M. DeNicola, R. M. Perera, Coordinated transcriptional and catabolic programs support iron-dependent adaptation to RAS-MAPK pathway inhibition in pancreatic cancer. Cancer Discov. 12, 2198–2219 (2022). [DOI] [PMC free article] [PubMed] [Google Scholar]
- 29.M. N. Sutton, S. T. Gammon, R. Muzzioli, F. Pisaneschi, B. Radaram, P. Yang, D. Piwnica-Worms, RAS-driven macropinocytosis of albumin or dextran reveals mutation-specific target engagement of RAS p.G12C inhibitor ARS-1620 by NIR-fluorescence imaging. Mol. Imaging Biol. 24, 498–509 (2022). [DOI] [PMC free article] [PubMed] [Google Scholar]
- 30.V. Wilkens, W. Kohl, K. Busch, Restricted diffusion of OXPHOS complexes in dynamic mitochondria delays their exchange between cristae and engenders a transitory mosaic distribution. J. Cell Sci. 126, 103–116 (2013). [DOI] [PubMed] [Google Scholar]
- 31.K. E. R. Hollinshead, S. J. Parker, V. V. Eapen, J. Encarnacion-Rosado, A. Sohn, T. Oncu, M. Cammer, J. D. Mancias, A. C. Kimmelman, Respiratory supercomplexes promote mitochondrial efficiency and growth in severely hypoxic pancreatic cancer. Cell Rep. 33, 108231 (2020). [DOI] [PMC free article] [PubMed] [Google Scholar]
- 32.S. J. Parker, J. Encarnación-Rosado, K. E. R. Hollinshead, D. M. Hollinshead, L. J. Ash, J. A. K. Rossi, E. Y. Lin, A. S. W. Sohn, M. R. Philips, D. R. Jones, A. C. Kimmelman, Spontaneous hydrolysis and spurious metabolic properties of α-ketoglutarate esters. Nat. Commun. 12, 4905 (2021). [DOI] [PMC free article] [PubMed] [Google Scholar]
- 33.N. Santana-Codina, A. S. Chandhoke, Q. Yu, B. Małachowska, M. Kuljanin, A. Gikandi, M. Stańczak, S. Gableske, M. P. Jedrychowski, D. A. Scott, A. J. Aguirre, W. Fendler, N. S. Gray, J. D. Mancias, Defining and targeting adaptations to oncogenic KRASG12C inhibition using quantitative temporal proteomics. Cell Rep. 30, 4584–4599.e4 (2020). [DOI] [PubMed] [Google Scholar]
- 34.J. K. Eng, M. R. Hoopmann, T. A. Jahan, J. D. Egertson, W. S. Noble, M. J. MacCoss, A deeper look into Comet—Implementation and features. J. Am. Soc. Mass Spectrom. 11, 1865–1874 (2015). [DOI] [PMC free article] [PubMed] [Google Scholar]
- 35.G. C. McAlister, D. P. Nusinow, M. P. Jedrychowski, M. Wühr, E. L. Huttlin, B. K. Erickson, R. Rad, W. Haas, S. P. Gygi, MultiNotch MS3 enables accurate, sensitive, and multiplexed detection of differential expression across cancer cell line proteomes. Anal. Chem. 86, 7150–7158 (2014). [DOI] [PMC free article] [PubMed] [Google Scholar]
Associated Data
This section collects any data citations, data availability statements, or supplementary materials included in this article.
Supplementary Materials
Figs. S1 to S6
Table S1
Supplementary Methods
References


